Embed Size (px)
Citation preview

Summary of FY2014 Third Quarter Earnings Results
January 30, 2015
The English version is a translation of the original Japanese version.
Please note that if there is any discrepancy, the Japanese version will take priority.
Electric Power Development Co., Ltd.
Forward Looking Statements
1
The following contains statements that constitute forward-looking statements, plans for
the future, management targets, etc. relating to the Company and/or the J-POWER
group. These are based on current assumptions of future events, and there exist
possibilities that such assumptions are objectively incorrect and actual results may differ
from those in the statements as a result of various factors.
Furthermore, information and data other than those concerning the Company and its
subsidiaries/affiliates are quoted from public information, and the Company has not
verified and will not warrant its accuracy or dependency.
※Display of Figures
All figures are consolidated unless stated otherwise.
Amounts less than 100 million yen and electric power sales volume less than 100 million kWh shown in the consolidated financial data have been rounded down. Consequently, the sum of the individual amounts may not necessarily agree with figures shown in total columns.
Contents
I. Summary of FY2014 Third Quarter Earnings Results
Summary of FY2014 Third Quarter Earnings Results ・・・ 4
Key Data ・・・ 5
FY2014 Third Quarter Earnings Results (Main Factors for Change) ・・・ 7
Revenue / Expenditure Comparison ・・・ 8
Balance Sheet ・・・ 9
II. Summary of FY2014 Earnings Forecast
Summary of FY2014 Earnings Forecast ・・・ 11
Key Data ・・・ 12
FY2014 Earnings Forecast (Main Factors for Change) ・・・ 13
Overseas Power Generation Business: Earnings Contribution Forecast ・・・ 14
Appendix
2
3
I. Summary of FY2014 Third Quarter
Earnings Results
Summary of FY2014 Third Quarter Earnings Results
4
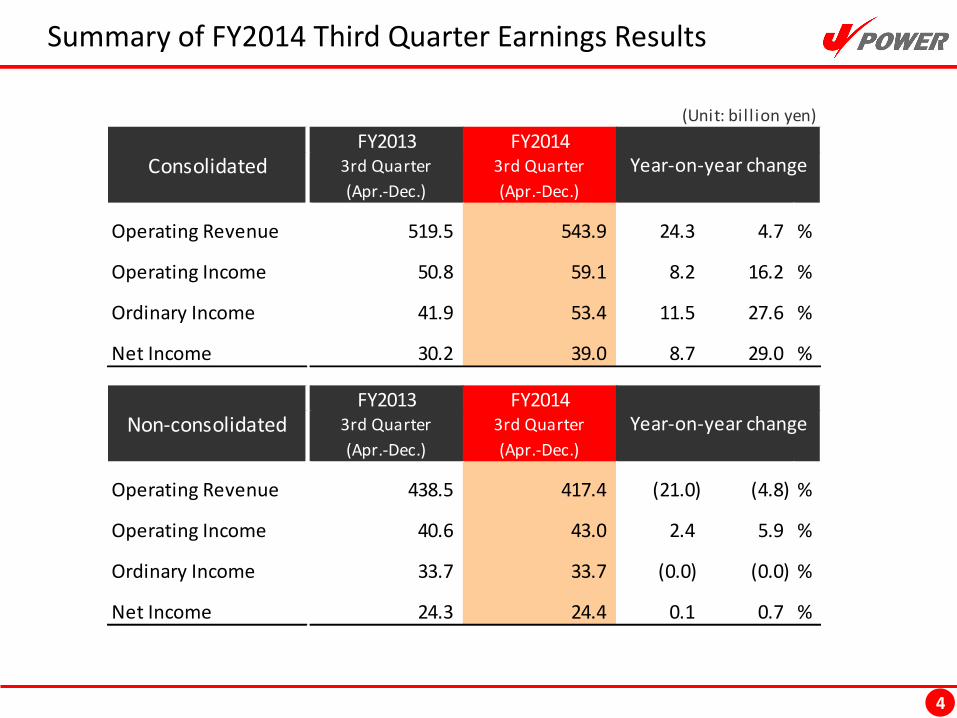
(Unit: bil l ion yen)
FY2013 FY20143rd Quarter 3rd Quarter
(Apr.-Dec.) (Apr.-Dec.)
Operating Revenue 519.5 543.9 24.3 4.7 %
Operating Income 50.8 59.1 8.2 16.2 %
Ordinary Income 41.9 53.4 11.5 27.6 %
Net Income 30.2 39.0 8.7 29.0 %
FY2013 FY20143rd Quarter 3rd Quarter
(Apr.-Dec.) (Apr.-Dec.)
Operating Revenue 438.5 417.4 (21.0) (4.8) %
Operating Income 40.6 43.0 2.4 5.9 %
Ordinary Income 33.7 33.7 (0.0) (0.0) %
Net Income 24.3 24.4 0.1 0.7 %
Consolidated
Non-consolidated
Year-on-year change
Year-on-year change
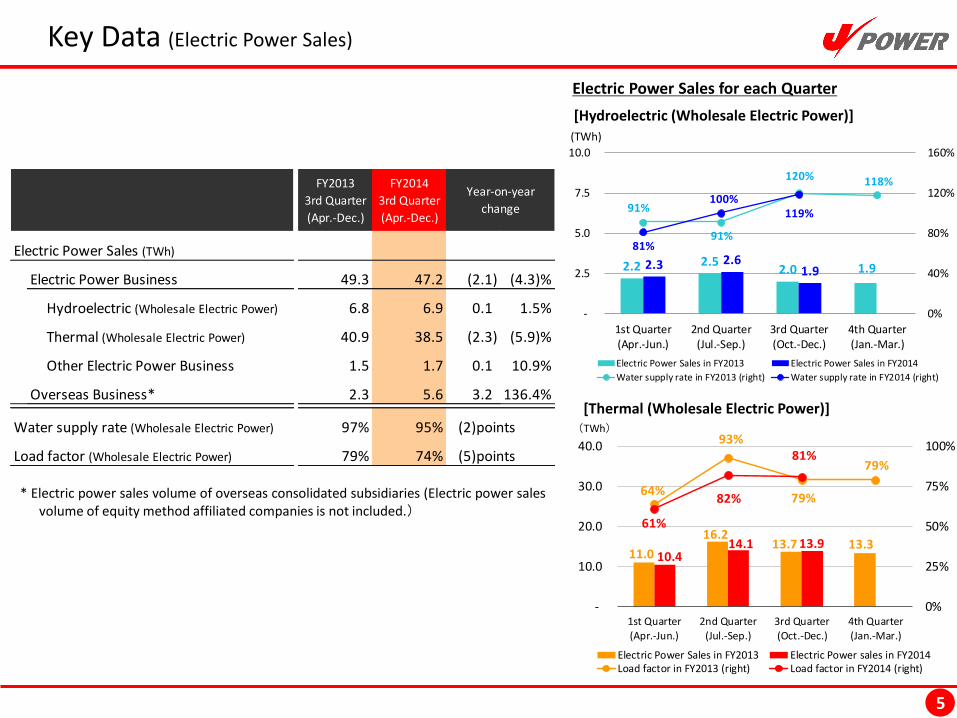
Key Data (Electric Power Sales)
5
Electric Power Sales for each Quarter
* Electric power sales volume of overseas consolidated subsidiaries (Electric power sales volume of equity method affiliated companies is not included.)
[Hydroelectric (Wholesale Electric Power)]
[Thermal (Wholesale Electric Power)]
2.2 2.5 2.0 1.9 2.3 2.6
1.9
91%
91%
120% 118%
81%
100%119%
0%
40%
80%
120%
160%
-
2.5
5.0
7.5
10.0
1st Quarter(Apr.-Jun.)
2nd Quarter(Jul.-Sep.)
3rd Quarter(Oct.-Dec.)
4th Quarter(Jan.-Mar.)
(TWh)
Electric Power Sales in FY2013 Electric Power Sales in FY2014
Water supply rate in FY2013 (right) Water supply rate in FY2014 (right)
11.0
16.213.7 13.3
10.4 14.1 13.9
64%
93%
79%
79%
61%
82%
81%
0%
25%
50%
75%
100%
-
10.0
20.0
30.0
40.0
1st Quarter
(Apr.-Jun.)
2nd Quarter
(Jul.-Sep.)
3rd Quarter
(Oct.-Dec.)
4th Quarter
(Jan.-Mar.)
(TWh)
Electric Power Sales in FY2013 Electric Power sales in FY2014Load factor in FY2013 (right) Load factor in FY2014 (right)
Electric Power Sales (TWh)
Electric Power Business 49.3 47.2
Hydroelectric (Wholesale Electric Power) 6.8 6.9
Thermal (Wholesale Electric Power) 40.9 38.5
Other Electric Power Business 1.5 1.7
Overseas Business* 2.3 5.60 0
Water supply rate (Wholesale Electric Power) 97% 95%
Load factor (Wholesale Electric Power) 79% 74%
0.1 10.9%
3.2 136.4%
(2)points
(5)points
0.1 1.5%
(2.3) (5.9)%
FY2014
3rd Quarter
(Apr.-Dec.)
Year-on-year
change
(2.1) (4.3)%
FY2013
3rd Quarter
(Apr.-Dec.)
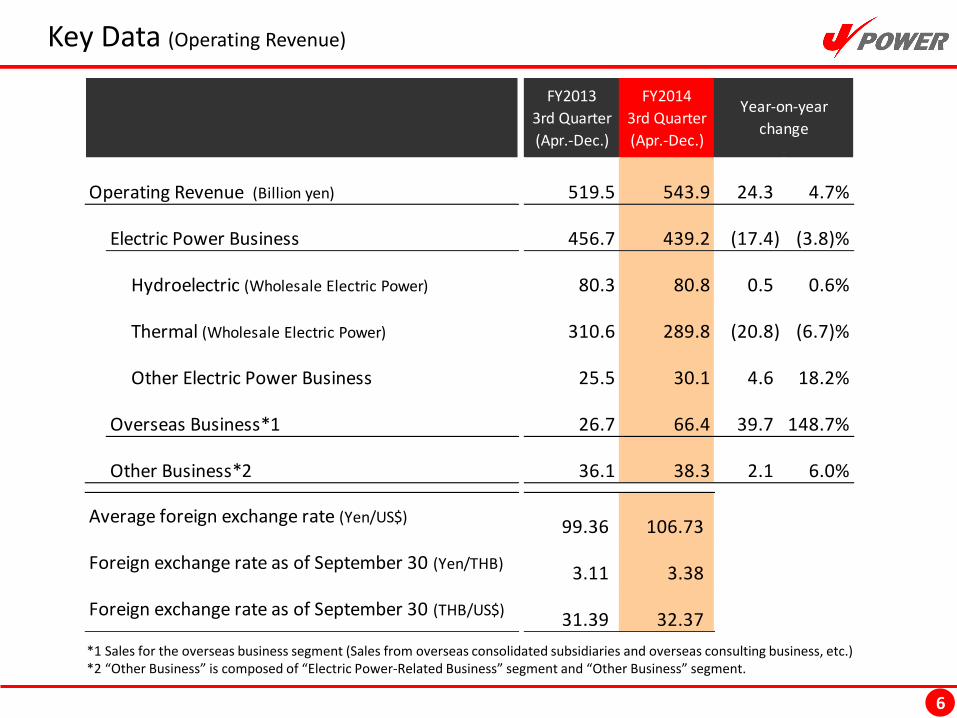
Key Data (Operating Revenue)
6
*1 Sales for the overseas business segment (Sales from overseas consolidated subsidiaries and overseas consulting business, etc.) *2 “Other Business” is composed of “Electric Power-Related Business” segment and “Other Business” segment.
Operating Revenue (Billion yen) 519.5 543.9
Electric Power Business 456.7 439.2
Hydroelectric (Wholesale Electric Power) 80.3 80.8
Thermal (Wholesale Electric Power) 310.6 289.8
Other Electric Power Business 25.5 30.1
Overseas Business*1 26.7 66.4
Other Business*2 36.1 38.3
99.36 106.73
3.11 3.38
31.39 32.37
Average foreign exchange rate (Yen/US$)
Foreign exchange rate as of September 30 (Yen/THB)
Foreign exchange rate as of September 30 (THB/US$)
FY2013
3rd Quarter
(Apr.-Dec.)
FY2014
3rd Quarter
(Apr.-Dec.)
Year-on-year
change
24.3 4.7%
(17.4) (3.8)%
0.5 0.6%
(20.8) (6.7)%
4.6 18.2%
39.7 148.7%
2.1 6.0%
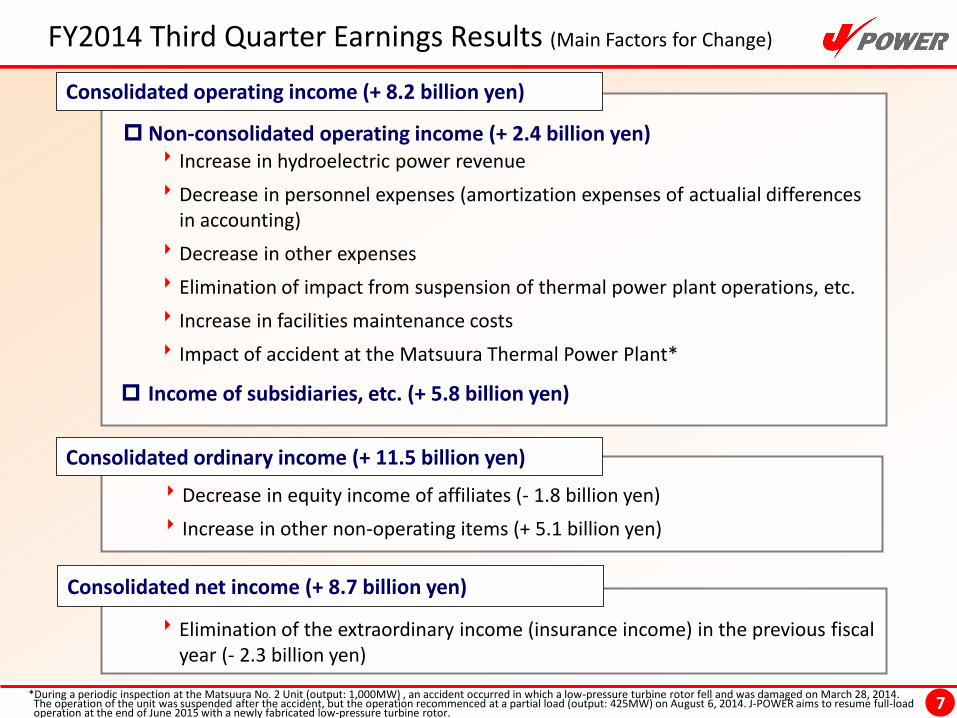
FY2014 Third Quarter Earnings Results (Main Factors for Change)
7
Non-consolidated operating income (+ 2.4 billion yen)
Income of subsidiaries, etc. (+ 5.8 billion yen)
Decrease in equity income of affiliates (- 1.8 billion yen)
Increase in other non-operating items (+ 5.1 billion yen)
Consolidated ordinary income (+ 11.5 billion yen)
Consolidated net income (+ 8.7 billion yen)
Elimination of the extraordinary income (insurance income) in the previous fiscal year (- 2.3 billion yen)
Consolidated operating income (+ 8.2 billion yen)
Increase in hydroelectric power revenue
Decrease in personnel expenses (amortization expenses of actualial differences in accounting)
Decrease in other expenses
Elimination of impact from suspension of thermal power plant operations, etc.
Increase in facilities maintenance costs
Impact of accident at the Matsuura Thermal Power Plant*
*During a periodic inspection at the Matsuura No. 2 Unit (output: 1,000MW) , an accident occurred in which a low-pressure turbine rotor fell and was damaged on March 28, 2014. The operation of the unit was suspended after the accident, but the operation recommenced at a partial load (output: 425MW) on August 6, 2014. J-POWER aims to resume full-load operation at the end of June 2015 with a newly fabricated low-pressure turbine rotor.
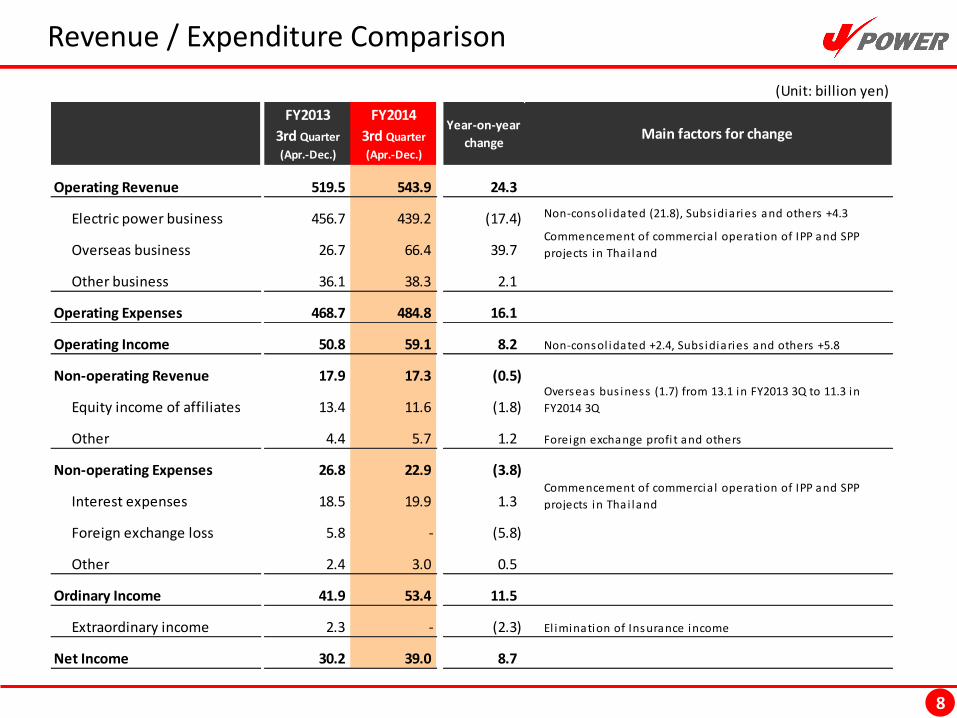
Revenue / Expenditure Comparison
8
(Unit: billion yen)
Operating Revenue 519.5 543.9 24.3
Electric power business 456.7 439.2 (17.4) Non-consol idated (21.8), Subs idiaries and others +4.3
Overseas business 26.7 66.4 39.7
Other business 36.1 38.3 2.1
Operating Expenses 468.7 484.8 16.1
Operating Income 50.8 59.1 8.2
Non-operating Revenue 17.9 17.3 (0.5)
Equity income of affiliates 13.4 11.6 (1.8)
Other 4.4 5.7 1.2 Foreign exchange profi t and others
Non-operating Expenses 26.8 22.9 (3.8)
Interest expenses 18.5 19.9 1.3
Foreign exchange loss 5.8 - (5.8)
Other 2.4 3.0 0.5
Ordinary Income 41.9 53.4 11.5
Extraordinary income 2.3 - (2.3)
Net Income 30.2 39.0 8.7
FY2013
3rd Quarter
(Apr.-Dec.)
FY2014
3rd Quarter
(Apr.-Dec.)
Year-on-year
changeMain factors for change
Commencement of commercia l operation of IPP and SPP
projects in Thai land
Non-consol idated +2.4, Subs idiaries and others +5.8
Overseas bus iness (1.7) from 13.1 in FY2013 3Q to 11.3 in
FY2014 3Q
Commencement of commercia l operation of IPP and SPP
projects in Thai land
El imination of Insurance income
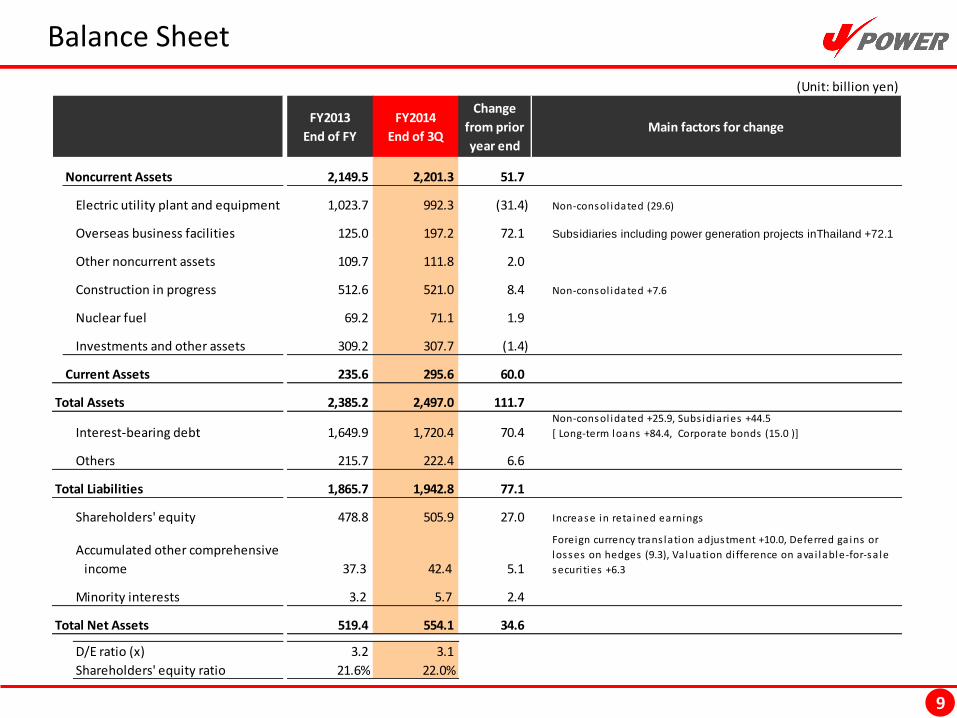
Balance Sheet
9
(Unit: billion yen)
Noncurrent Assets 2,149.5 2,201.3 51.7
Electric utility plant and equipment 1,023.7 992.3 (31.4)
Overseas business facilities 125.0 197.2 72.1
Other noncurrent assets 109.7 111.8 2.0
Construction in progress 512.6 521.0 8.4
Nuclear fuel 69.2 71.1 1.9
Investments and other assets 309.2 307.7 (1.4)
Current Assets 235.6 295.6 60.0
Total Assets 2,385.2 2,497.0 111.7
Interest-bearing debt 1,649.9 1,720.4 70.4
Others 215.7 222.4 6.6
Total Liabilities 1,865.7 1,942.8 77.1
Shareholders' equity 478.8 505.9 27.0
Accumulated other comprehensive
income 37.3 42.4 5.1
Minority interests 3.2 5.7 2.4
Total Net Assets 519.4 554.1 34.6
D/E ratio (x) 3.2 3.1
Shareholders' equity ratio 21.6% 22.0%
FY2013
End of FY
FY2014
End of 3Q
Change
from prior
year end
Main factors for change
Non-consol idated (29.6)
Subsidiaries including power generation projects inThailand +72.1
Non-consol idated +7.6
Non-consol idated +25.9, Subs idiaries +44.5
[ Long-term loans +84.4, Corporate bonds (15.0 )]
Increase in reta ined earnings
Foreign currency trans lation adjustment +10.0, Deferred ga ins or
losses on hedges (9.3), Va luation di fference on avai lable-for-sa le
securi ties +6.3
10
II. Summary of FY2014 Earnings Forecast
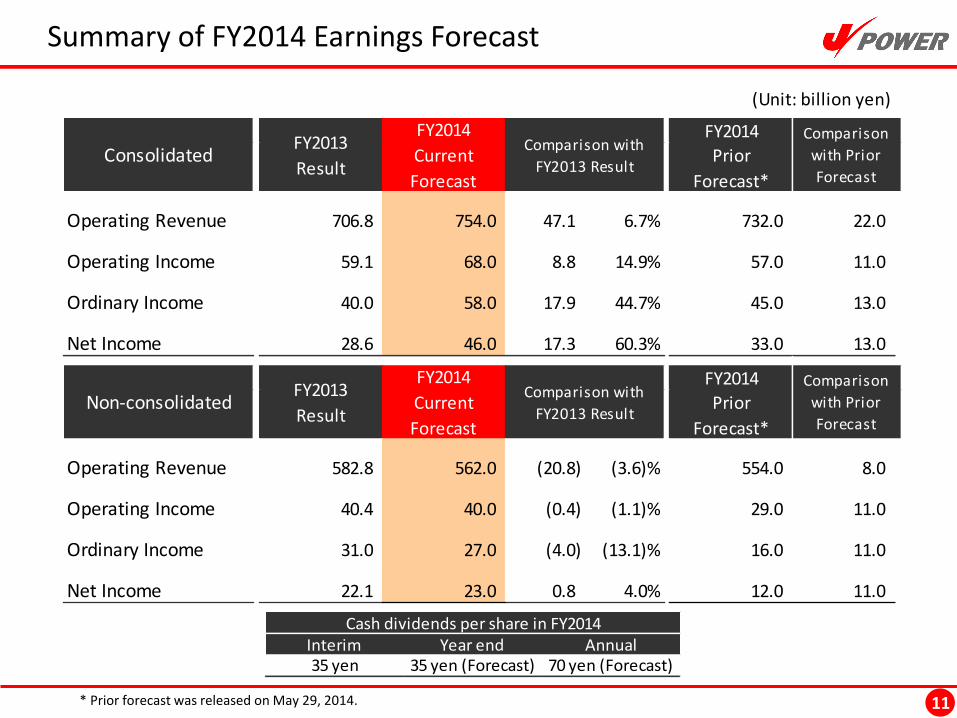
Summary of FY2014 Earnings Forecast
11 * Prior forecast was released on May 29, 2014.
Interim Year end Annual35 yen 35 yen (Forecast) 70 yen (Forecast)
Cash dividends per share in FY2014
(Unit: billion yen)
FY2014
Operating Revenue 706.8 754.0 47.1 6.7% 732.0 22.0
Operating Income 59.1 68.0 8.8 14.9% 57.0 11.0
Ordinary Income 40.0 58.0 17.9 44.7% 45.0 13.0
Net Income 28.6 46.0 17.3 60.3% 33.0 13.0
FY2014
Operating Revenue 582.8 562.0 (20.8) (3.6)% 554.0 8.0
Operating Income 40.4 40.0 (0.4) (1.1)% 29.0 11.0
Ordinary Income 31.0 27.0 (4.0) (13.1)% 16.0 11.0
Net Income 22.1 23.0 0.8 4.0% 12.0 11.0
Non-consolidated
ConsolidatedFY2013
Result
FY2014
Current
Forecast
Comparison with
FY2013 Result
Comparison
with Prior
ForecastPrior
Forecast*
FY2013
Result
FY2014
Current
Forecast
Comparison with
FY2013 Result
Comparison
with Prior
ForecastPrior
Forecast*
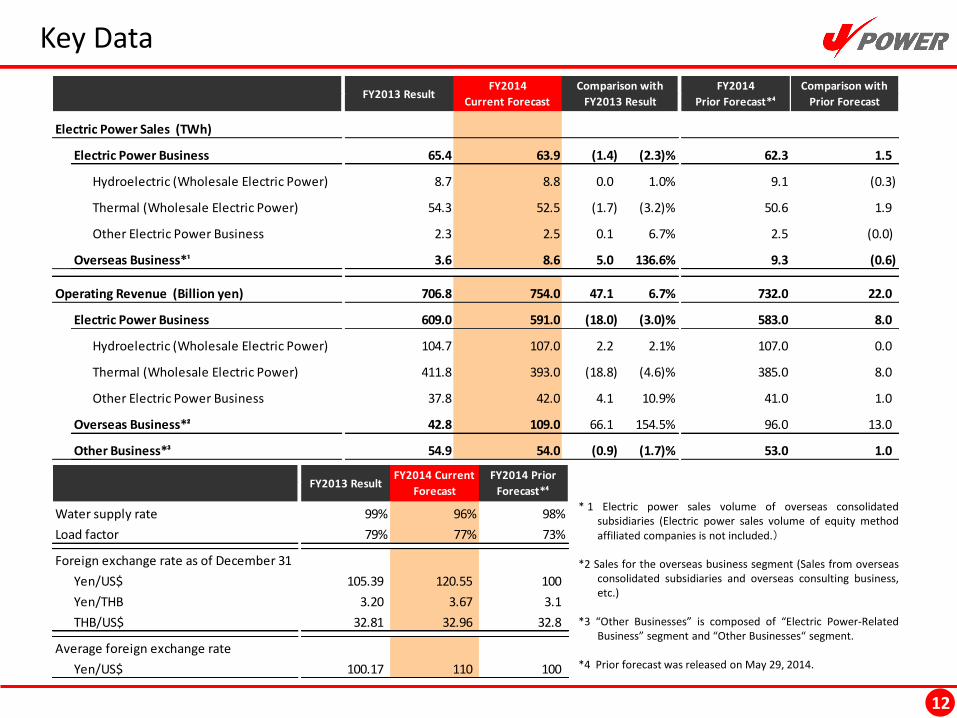
Key Data
12
* 1 Electric power sales volume of overseas consolidated subsidiaries (Electric power sales volume of equity method affiliated companies is not included.)
*2 Sales for the overseas business segment (Sales from overseas
consolidated subsidiaries and overseas consulting business, etc.)
*3 “Other Businesses” is composed of “Electric Power-Related
Business” segment and “Other Businesses“ segment. *4 Prior forecast was released on May 29, 2014.
Electric Power Sales (TWh)
Electric Power Business 65.4 63.9 62.3 1.5
Hydroelectric (Wholesale Electric Power) 8.7 8.8 9.1 (0.3)
Thermal (Wholesale Electric Power) 54.3 52.5 50.6 1.9
Other Electric Power Business 2.3 2.5 2.5 (0.0)
Overseas Business*¹ 3.6 8.6 9.3 (0.6)
Operating Revenue (Billion yen) 706.8 754.0 732.0 22.0
Electric Power Business 609.0 591.0 583.0 8.0
Hydroelectric (Wholesale Electric Power) 104.7 107.0 107.0 0.0
Thermal (Wholesale Electric Power) 411.8 393.0 385.0 8.0
Other Electric Power Business 37.8 42.0 41.0 1.0
Overseas Business*² 42.8 109.0 96.0 13.0
Other Business*³ 54.9 54.0 53.0 1.0
(18.8) (4.6)%
4.1 10.9%
(0.9) (1.7)%
66.1 154.5%
136.6%
47.1 6.7%
(18.0) (3.0)%
2.2 2.1%
5.0
0.0 1.0%
(1.7) (3.2)%
0.1 6.7%
FY2014
Prior Forecast*⁴
Comparison with
Prior Forecast
(1.4) (2.3)%
FY2013 ResultFY2014
Current Forecast
Comparison with
FY2013 Result
Water supply rate 99% 96% 98%
Load factor 79% 77% 73%
Foreign exchange rate as of December 31
Yen/US$ 105.39 120.55 100
Yen/THB 3.20 3.67 3.1
THB/US$ 32.81 32.96 32.8
Average foreign exchange rate
Yen/US$ 100.17 110 100
FY2014 Current
Forecast
FY2014 Prior
Forecast*⁴FY2013 Result
(12.0)
(5.5)
- 10.0 20.0 30.0
FY2013OrdinaryIncome
FY2012OrdinaryIncome
58.0
±0.0
(12.0)
±0.0
(4.5)
+9.0
+1.5
- 10.0 20.0 30.0 40.0 50.0 60.0
FY2014OrdinaryIncome
(Forecast)
FY2013OrdinaryIncome(Result)
13
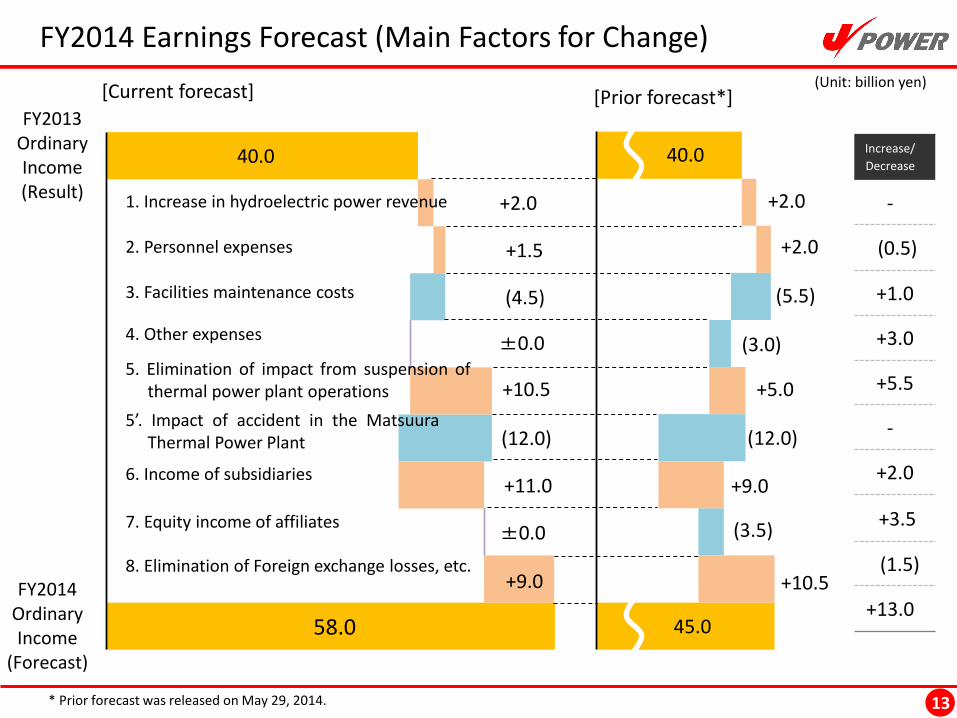
FY2014 Earnings Forecast (Main Factors for Change)
Increase/
Decrease
-
(0.5)
+1.0
+3.0
+5.5
-
+2.0
+3.5
(1.5)
+13.0
(Unit: billion yen)
+10.5
+11.0
+2.0
[Current forecast] [Prior forecast*]
+2.0
(3.0)
+5.0
+9.0
40.0
45.0
40.0
* Prior forecast was released on May 29, 2014.
(3.5)
+2.0
+10.5
3. Facilities maintenance costs
7. Equity income of affiliates
1. Increase in hydroelectric power revenue
8. Elimination of Foreign exchange losses, etc.
2. Personnel expenses
5. Elimination of impact from suspension of thermal power plant operations
4. Other expenses
6. Income of subsidiaries
5’. Impact of accident in the Matsuura Thermal Power Plant
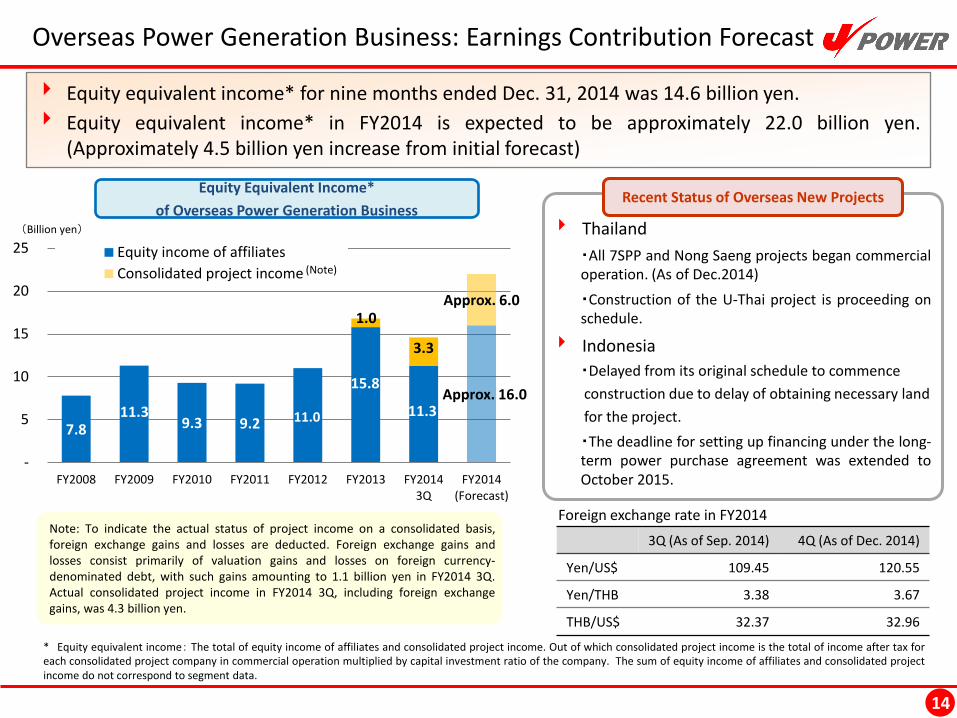
Overseas Power Generation Business: Earnings Contribution Forecast
14
3Q (As of Sep. 2014) 4Q (As of Dec. 2014)
Yen/US$ 109.45 120.55
Yen/THB 3.38 3.67
THB/US$ 32.37 32.96
Equity equivalent income* for nine months ended Dec. 31, 2014 was 14.6 billion yen.
Equity equivalent income* in FY2014 is expected to be approximately 22.0 billion yen. (Approximately 4.5 billion yen increase from initial forecast)
Equity Equivalent Income*
of Overseas Power Generation Business Recent Status of Overseas New Projects
Foreign exchange rate in FY2014
Thailand
・All 7SPP and Nong Saeng projects began commercial operation. (As of Dec.2014)
・Construction of the U-Thai project is proceeding on schedule.
Indonesia
・Delayed from its original schedule to commence
construction due to delay of obtaining necessary land
for the project.
・The deadline for setting up financing under the long-term power purchase agreement was extended to October 2015.
7.8 11.3
9.3 9.2 11.0
15.8
11.3 Approx. 16.0
1.0
3.3
Approx. 6.0
-
5
10
15
20
25
FY2008 FY2009 FY2010 FY2011 FY2012 FY2013 FY20143Q
FY2014(Forecast)
(Billion yen)
Equity income of affiliates
Consolidated project income
Note: To indicate the actual status of project income on a consolidated basis, foreign exchange gains and losses are deducted. Foreign exchange gains and losses consist primarily of valuation gains and losses on foreign currency-denominated debt, with such gains amounting to 1.1 billion yen in FY2014 3Q. Actual consolidated project income in FY2014 3Q, including foreign exchange gains, was 4.3 billion yen.
* Equity equivalent income: The total of equity income of affiliates and consolidated project income. Out of which consolidated project income is the total of income after tax for each consolidated project company in commercial operation multiplied by capital investment ratio of the company. The sum of equity income of affiliates and consolidated project income do not correspond to segment data.
(Note)

15
APPENDIX
APPENDIX Contents
16
New Coal-fired Power Projects in Japan ・・・17
The Ohma Nuclear Power Project ・・・18
Response to the New Safety Standards at the Ohma Nuclear Power Plant ・・・19
Overseas Power Generation Projects Owned Capacity ・・・22
Projects in Thailand by Consolidated Subsidiaries ・・・23
Statements of Income ・・・25
Non-consolidated: Revenues and Expenses ・・・26
Segment Information ・・・27
Cash Flow ・・・28
Financial Data ・・・29
Monthly Electric Sales ・・・30
New Coal-fired Power Projects in Japan
17
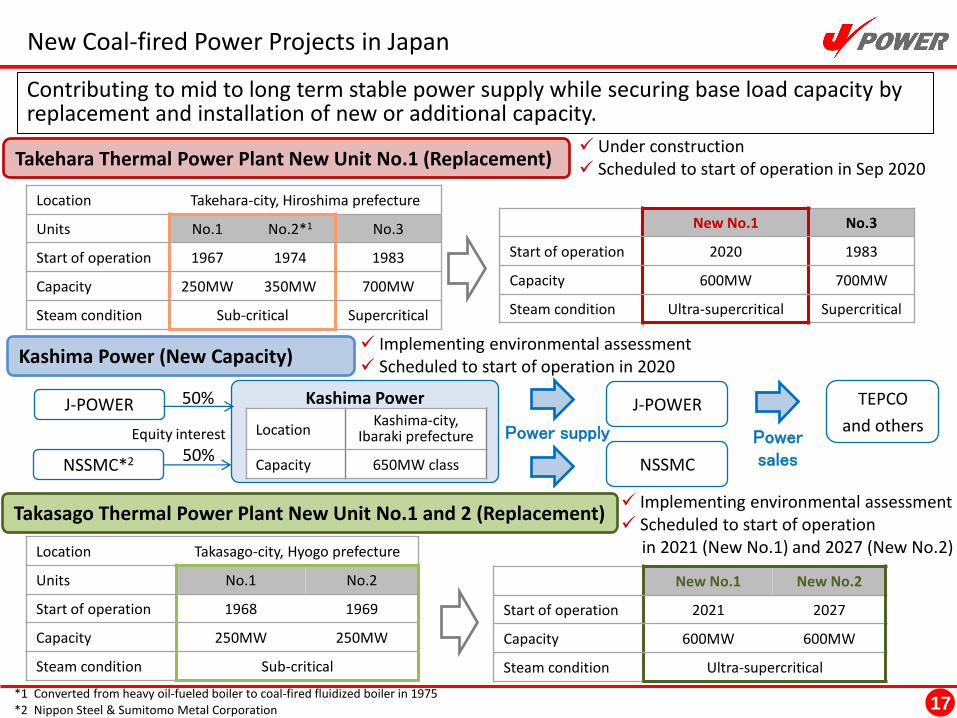
Kashima Power J-POWER
NSSMC*2
Location Kashima-city,
Ibaraki prefecture
Capacity 650MW class
Takehara Thermal Power Plant New Unit No.1 (Replacement)
Kashima Power (New Capacity)
*1 Converted from heavy oil-fueled boiler to coal-fired fluidized boiler in 1975 *2 Nippon Steel & Sumitomo Metal Corporation
Equity interest
J-POWER
NSSMC
Power supply
TEPCO
and others Power sales
Contributing to mid to long term stable power supply while securing base load capacity by replacement and installation of new or additional capacity.
50%
50%
Location Takehara-city, Hiroshima prefecture
Units No.1 No.2*1 No.3
Start of operation 1967 1974 1983
Capacity 250MW 350MW 700MW
Steam condition Sub-critical Supercritical
Under construction Scheduled to start of operation in Sep 2020
Units New No.1 No.3
Start of operation 2020 1983
Capacity 600MW 700MW
Steam condition Ultra-supercritical Supercritical
Implementing environmental assessment Scheduled to start of operation in 2020
Location Takasago-city, Hyogo prefecture
Units No.1 No.2
Start of operation 1968 1969
Capacity 250MW 250MW
Steam condition Sub-critical
Takasago Thermal Power Plant New Unit No.1 and 2 (Replacement) Implementing environmental assessment Scheduled to start of operation in 2021 (New No.1) and 2027 (New No.2)
Units New No.1 New No.2
Start of operation 2021 2027
Capacity 600MW 600MW
Steam condition Ultra-supercritical
The Ohma Nuclear Power Project
18
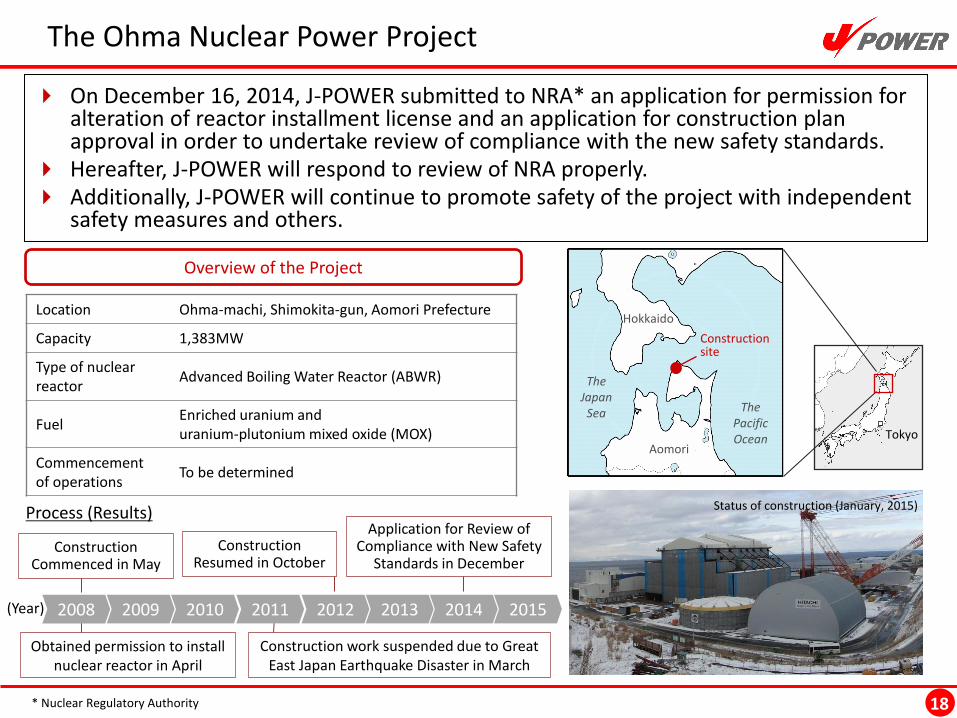
On December 16, 2014, J-POWER submitted to NRA* an application for permission for alteration of reactor installment license and an application for construction plan approval in order to undertake review of compliance with the new safety standards.
Hereafter, J-POWER will respond to review of NRA properly. Additionally, J-POWER will continue to promote safety of the project with independent
safety measures and others.
Location Ohma-machi, Shimokita-gun, Aomori Prefecture
Capacity 1,383MW
Type of nuclear reactor
Advanced Boiling Water Reactor (ABWR)
Fuel Enriched uranium and uranium-plutonium mixed oxide (MOX)
Commencement of operations
To be determined
Tokyo
The Pacific Ocean
The Japan
Sea
Status of construction (January, 2015)
Aomori
Hokkaido
Overview of the Project
Process (Results)
Construction Commenced in May
Construction work suspended due to Great East Japan Earthquake Disaster in March
Construction Resumed in October
(Year)
Obtained permission to install nuclear reactor in April
Construction site
2008 2009 2010 2011 2012 2013 2014 2015
Application for Review of Compliance with New Safety
Standards in December
* Nuclear Regulatory Authority
Response to the New Safety Standards at the Ohma Nuclear Power Plant
19
建設状況 (2013年1月現在)
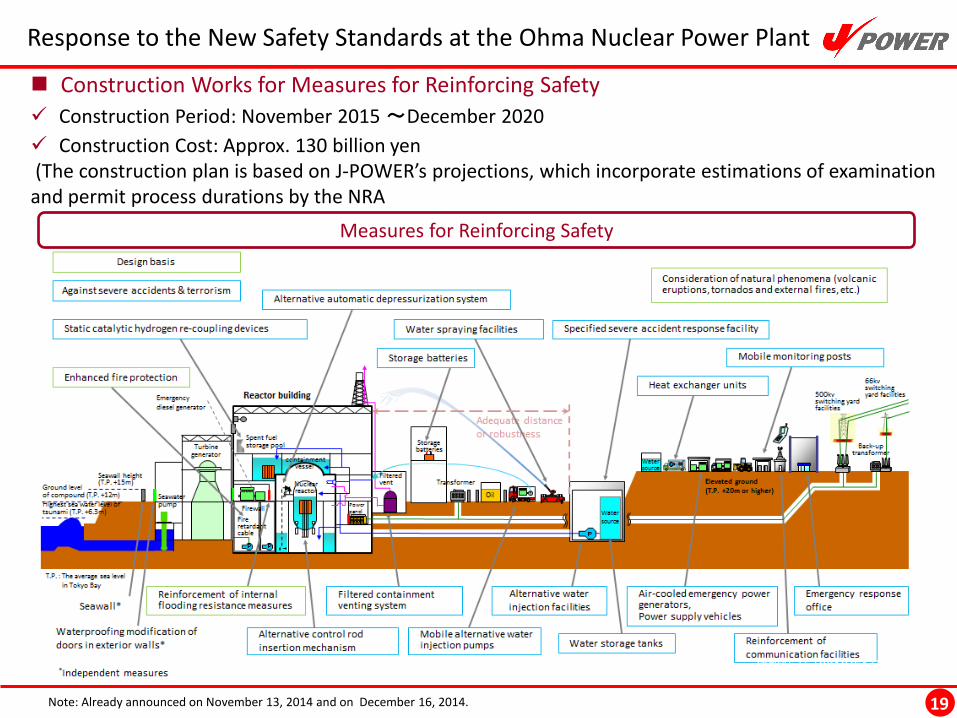
Measures for Reinforcing Safety
Construction Works for Measures for Reinforcing Safety
Construction Period: November 2015 ~December 2020
Construction Cost: Approx. 130 billion yen (The construction plan is based on J-POWER’s projections, which incorporate estimations of examination and permit process durations by the NRA
Note: Already announced on November 13, 2014 and on December 16, 2014.
20
Response to the New Safety Standards at the Ohma Nuclear Power Plant (Main Conditions)
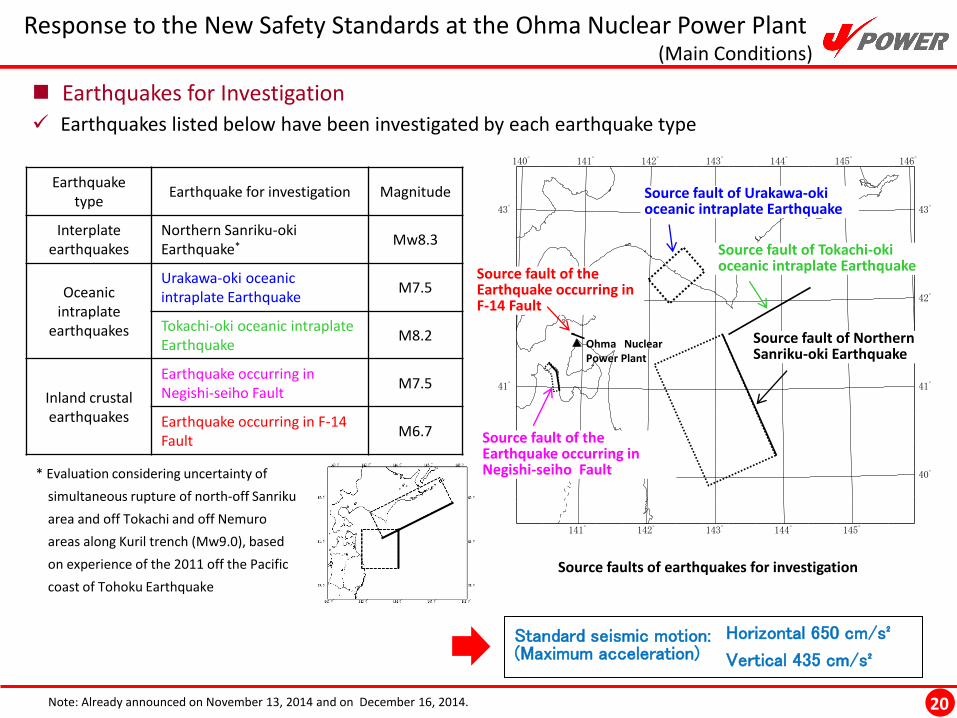
Earthquakes for Investigation
Earthquakes listed below have been investigated by each earthquake type
Earthquake type
Earthquake for investigation Magnitude
Interplate earthquakes
Northern Sanriku-oki Earthquake* Mw8.3
Oceanic intraplate
earthquakes
Urakawa-oki oceanic intraplate Earthquake
M7.5
Tokachi-oki oceanic intraplate Earthquake
M8.2
Inland crustal earthquakes
Earthquake occurring in Negishi-seiho Fault M7.5
Earthquake occurring in F-14 Fault
M6.7
* Evaluation considering uncertainty of
simultaneous rupture of north-off Sanriku
area and off Tokachi and off Nemuro
areas along Kuril trench (Mw9.0), based
on experience of the 2011 off the Pacific
coast of Tohoku Earthquake
140゚
141゚
141゚
142゚
142゚
143゚
143゚
144゚
144゚
145゚
145゚ 146゚
40゚ 40゚
41゚ 41゚
42゚ 42゚
43゚ 43゚
0 50 100 km
Source faults of earthquakes for investigation
Source fault of Urakawa-oki oceanic intraplate Earthquake
Source fault of Tokachi-oki oceanic intraplate Earthquake
Source fault of Northern Sanriku-oki Earthquake
Source fault of the Earthquake occurring in Negishi-seiho Fault
Source fault of the Earthquake occurring in F-14 Fault
Ohma Nuclear Power Plant
Standard seismic motion: (Maximum acceleration)
Note: Already announced on November 13, 2014 and on December 16, 2014.
Horizontal 650 cm/s²
Vertical 435 cm/s²
21
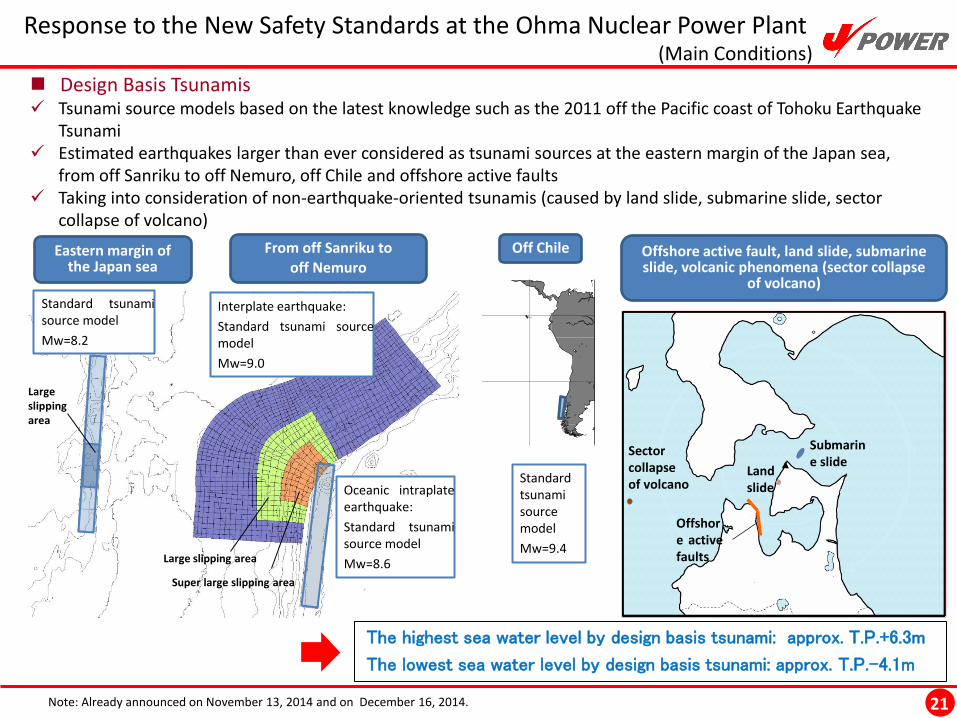
Design Basis Tsunamis Tsunami source models based on the latest knowledge such as the 2011 off the Pacific coast of Tohoku Earthquake
Tsunami Estimated earthquakes larger than ever considered as tsunami sources at the eastern margin of the Japan sea,
from off Sanriku to off Nemuro, off Chile and offshore active faults Taking into consideration of non-earthquake-oriented tsunamis (caused by land slide, submarine slide, sector
collapse of volcano)
Response to the New Safety Standards at the Ohma Nuclear Power Plant (Main Conditions)
Eastern margin of the Japan sea
From off Sanriku to off Nemuro
Standard tsunami source model
Mw=8.2
Large slipping area
Interplate earthquake:
Standard tsunami source model
Mw=9.0
Oceanic intraplate earthquake:
Standard tsunami source model
Mw=8.6 Large slipping area
Super large slipping area
60°N
30°N
0°
30°S
60°S120°E 150°E 180° 150°W 120°W 90°W 60°W
Off Chile
Land slide
Submarine slide
Offshore active faults
Offshore active fault, land slide, submarine slide, volcanic phenomena (sector collapse
of volcano)
Sector collapse of volcano Standard
tsunami source model
Mw=9.4
The highest sea water level by design basis tsunami: approx. T.P.+6.3m
The lowest sea water level by design basis tsunami: approx. T.P.-4.1m
Note: Already announced on November 13, 2014 and on December 16, 2014.
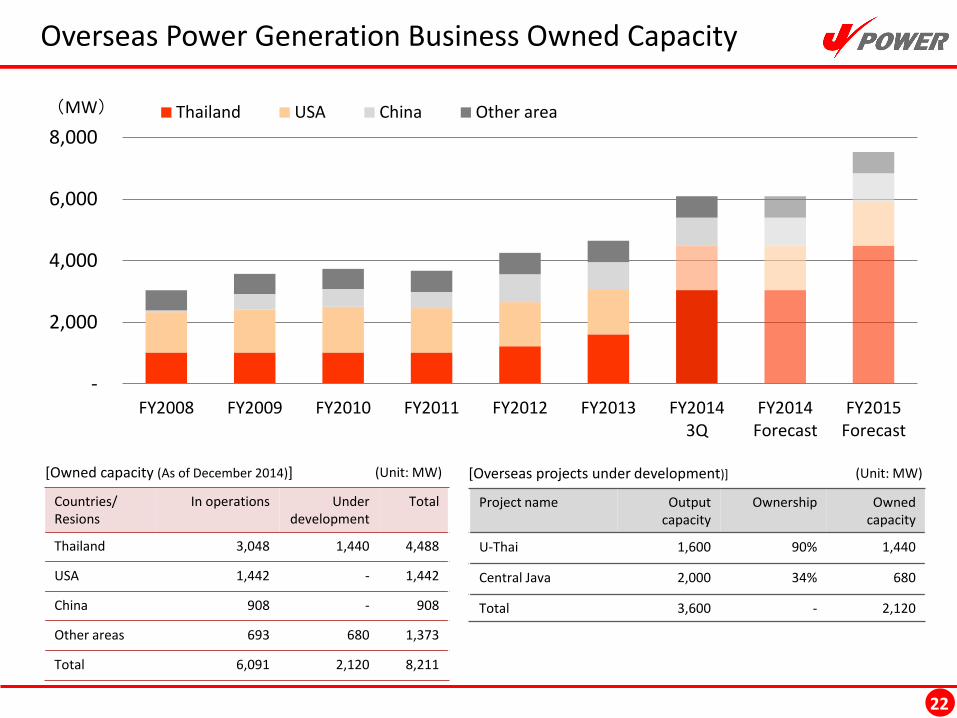
Overseas Power Generation Business Owned Capacity
22
[Owned capacity (As of December 2014)]
Countries/ Resions
In operations Under development
Total
Thailand 3,048 1,440 4,488
USA 1,442 - 1,442
China 908 - 908
Other areas 693 680 1,373
Total 6,091 2,120 8,211
(Unit: MW)
-
2,000
4,000
6,000
8,000
FY2008 FY2009 FY2010 FY2011 FY2012 FY2013 FY20143Q
FY2014Forecast
FY2015Forecast
(MW) Thailand USA China Other area
Project name Output capacity
Ownership Owned capacity
U-Thai 1,600 90% 1,440
Central Java 2,000 34% 680
Total 3,600 - 2,120
[Overseas projects under development)] (Unit: MW)
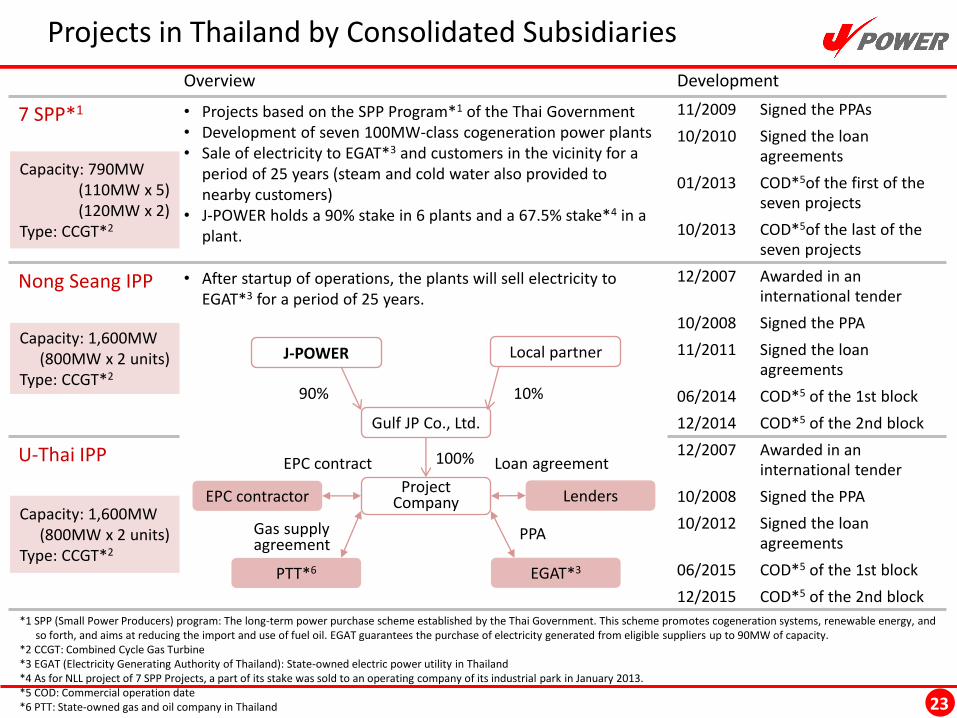
Projects in Thailand by Consolidated Subsidiaries
23
Overview Development
7 SPP*1 • Projects based on the SPP Program*1 of the Thai Government • Development of seven 100MW-class cogeneration power plants • Sale of electricity to EGAT*3 and customers in the vicinity for a
period of 25 years (steam and cold water also provided to nearby customers)
• J-POWER holds a 90% stake in 6 plants and a 67.5% stake*4 in a plant.
11/2009 Signed the PPAs
10/2010 Signed the loan agreements
01/2013 COD*5of the first of the seven projects
10/2013 COD*5of the last of the seven projects
Nong Seang IPP • After startup of operations, the plants will sell electricity to EGAT*3 for a period of 25 years.
12/2007 Awarded in an international tender
10/2008 Signed the PPA
11/2011 Signed the loan agreements
06/2014 COD*5 of the 1st block
12/2014 COD*5 of the 2nd block
U-Thai IPP 12/2007 Awarded in an international tender
10/2008 Signed the PPA
10/2012 Signed the loan agreements
06/2015 COD*5 of the 1st block
12/2015 COD*5 of the 2nd block
Capacity: 790MW (110MW x 5) (120MW x 2)
Type: CCGT*2
Capacity: 1,600MW (800MW x 2 units)
Type: CCGT*2
Capacity: 1,600MW (800MW x 2 units)
Type: CCGT*2
J-POWER Local partner
Gulf JP Co., Ltd.
Project Company
PTT*6
EPC contractor Lenders
EGAT*3
90% 10%
100%
PPA Gas supply agreement
EPC contract Loan agreement
*1 SPP (Small Power Producers) program: The long-term power purchase scheme established by the Thai Government. This scheme promotes cogeneration systems, renewable energy, and so forth, and aims at reducing the import and use of fuel oil. EGAT guarantees the purchase of electricity generated from eligible suppliers up to 90MW of capacity. *2 CCGT: Combined Cycle Gas Turbine *3 EGAT (Electricity Generating Authority of Thailand): State-owned electric power utility in Thailand *4 As for NLL project of 7 SPP Projects, a part of its stake was sold to an operating company of its industrial park in January 2013. *5 COD: Commercial operation date *6 PTT: State-owned gas and oil company in Thailand
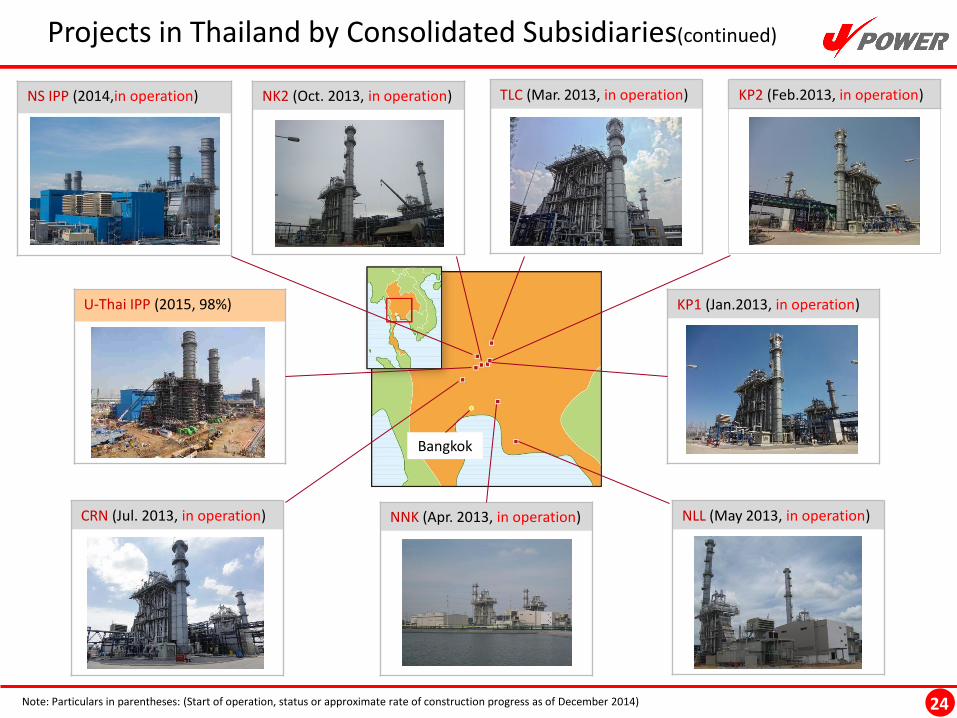
NK2 (Oct. 2013, in operation)
CRN (Jul. 2013, in operation) NLL (May 2013, in operation) NNK (Apr. 2013, in operation)
TLC (Mar. 2013, in operation) KP2 (Feb.2013, in operation)
KP1 (Jan.2013, in operation) U-Thai IPP (2015, 98%)
NS IPP (2014,in operation)
24
Projects in Thailand by Consolidated Subsidiaries(continued)
Bangkok
Note: Particulars in parentheses: (Start of operation, status or approximate rate of construction progress as of December 2014)
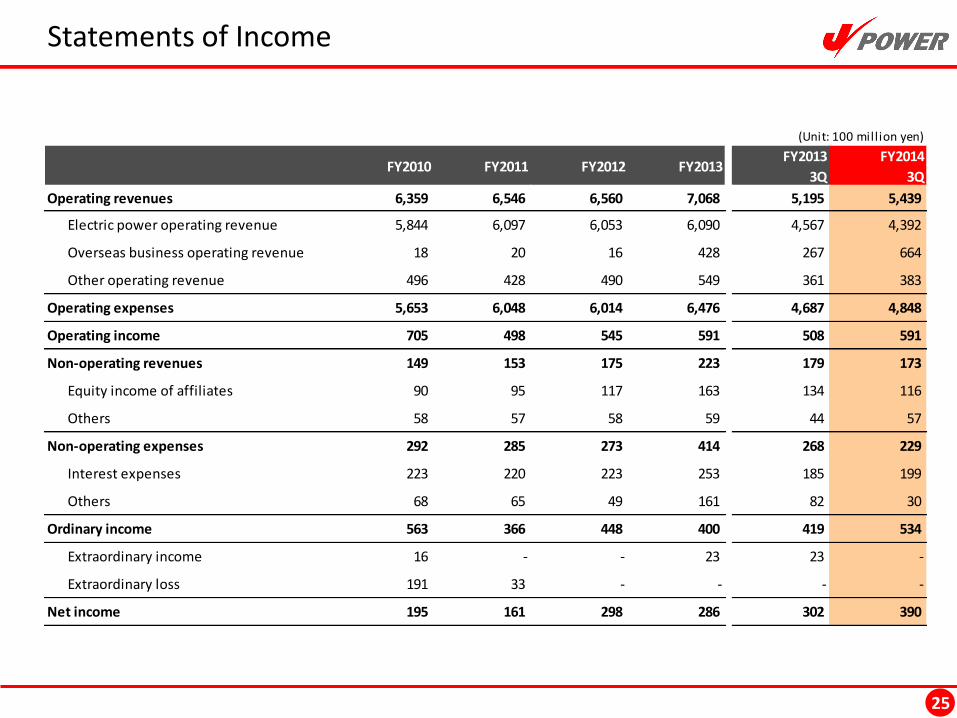
Statements of Income
25
(Unit: 100 mill ion yen)
FY2010 FY2011 FY2012 FY2013FY2013
3Q
FY2014
3Q
Operating revenues 6,359 6,546 6,560 7,068 5,195 5,439
Electric power operating revenue 5,844 6,097 6,053 6,090 4,567 4,392
Overseas business operating revenue 18 20 16 428 267 664
Other operating revenue 496 428 490 549 361 383
Operating expenses 5,653 6,048 6,014 6,476 4,687 4,848
Operating income 705 498 545 591 508 591
Non-operating revenues 149 153 175 223 179 173
Equity income of affiliates 90 95 117 163 134 116
Others 58 57 58 59 44 57
Non-operating expenses 292 285 273 414 268 229
Interest expenses 223 220 223 253 185 199
Others 68 65 49 161 82 30
Ordinary income 563 366 448 400 419 534
Extraordinary income 16 - - 23 23 -
Extraordinary loss 191 33 - - - -
Net income 195 161 298 286 302 390
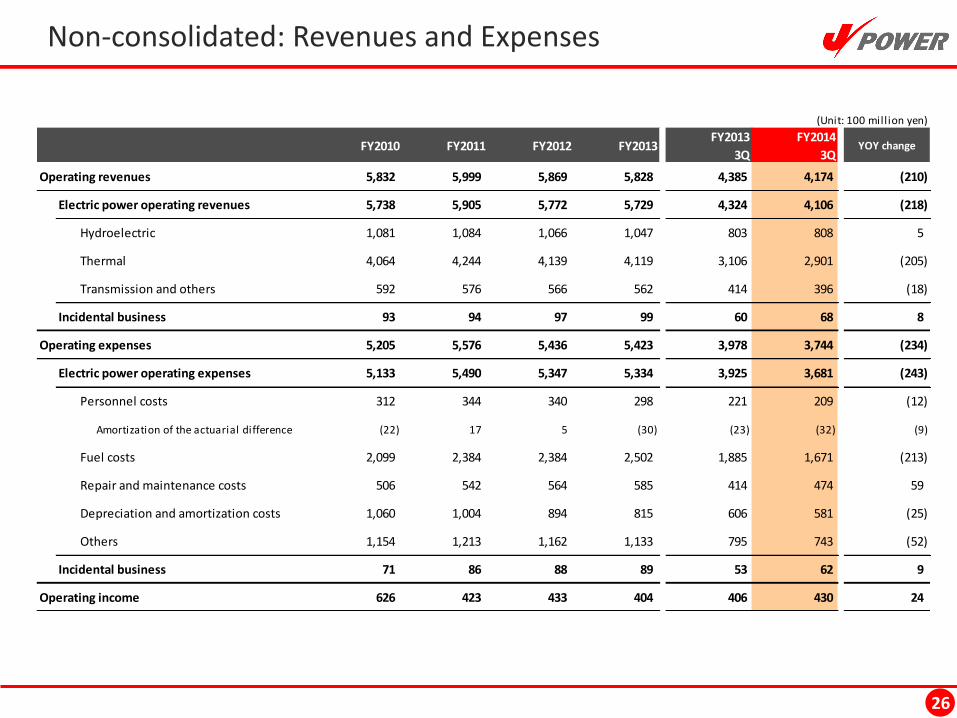
Non-consolidated: Revenues and Expenses
26
(Unit: 100 mill ion yen)
FY2010 FY2011 FY2012 FY2013FY2013
3Q
FY2014
3QYOY change
Operating revenues 5,832 5,999 5,869 5,828 4,385 4,174 (210)
Electric power operating revenues 5,738 5,905 5,772 5,729 4,324 4,106 (218)
Hydroelectric 1,081 1,084 1,066 1,047 803 808 5
Thermal 4,064 4,244 4,139 4,119 3,106 2,901 (205)
Transmission and others 592 576 566 562 414 396 (18)
Incidental business 93 94 97 99 60 68 8
Operating expenses 5,205 5,576 5,436 5,423 3,978 3,744 (234)
Electric power operating expenses 5,133 5,490 5,347 5,334 3,925 3,681 (243)
Personnel costs 312 344 340 298 221 209 (12)
Amortization of the actuarial difference (22) 17 5 (30) (23) (32) (9)
Fuel costs 2,099 2,384 2,384 2,502 1,885 1,671 (213)
Repair and maintenance costs 506 542 564 585 414 474 59
Depreciation and amortization costs 1,060 1,004 894 815 606 581 (25)
Others 1,154 1,213 1,162 1,133 795 743 (52)
Incidental business 71 86 88 89 53 62 9
Operating income 626 423 433 404 406 430 24
27
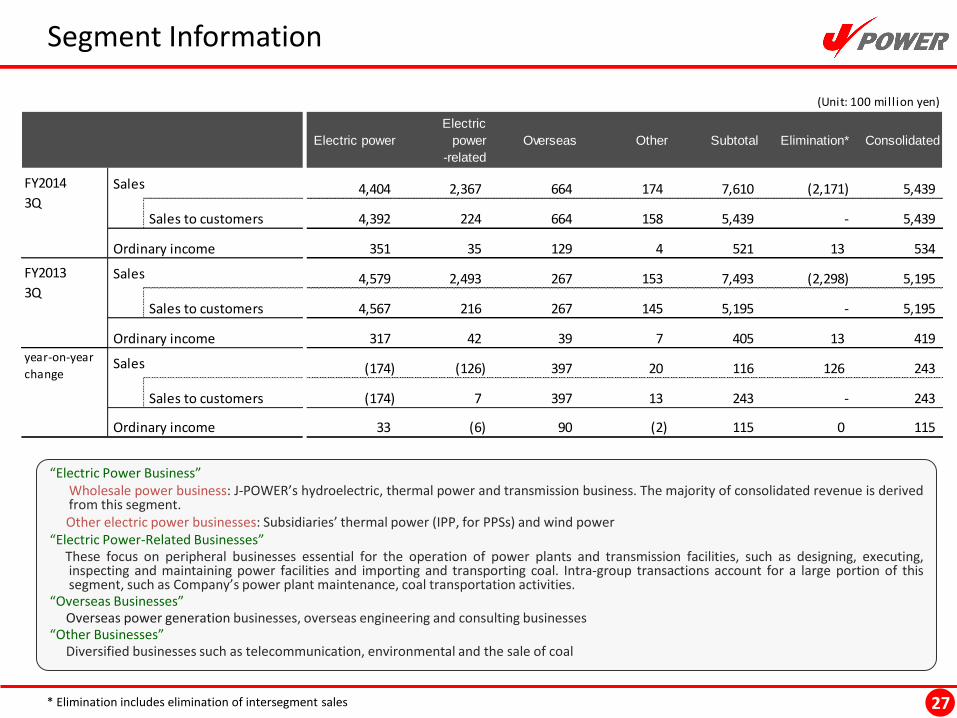
Segment Information
* Elimination includes elimination of intersegment sales
(Unit: 100 mill ion yen)
Electric power
Electric
power
-related
Overseas Other Subtotal Elimination* Consolidated
Sales 4,404 2,367 664 174 7,610 (2,171) 5,439
Sales to customers 4,392 224 664 158 5,439 - 5,439
Ordinary income 351 35 129 4 521 13 534
Sales 4,579 2,493 267 153 7,493 (2,298) 5,195
Sales to customers 4,567 216 267 145 5,195 - 5,195
Ordinary income 317 42 39 7 405 13 419
Sales (174) (126) 397 20 116 126 243
Sales to customers (174) 7 397 13 243 - 243
Ordinary income 33 (6) 90 (2) 115 0 115
FY2013
3Q
year-on-year
change
FY2014
3Q
“Electric Power Business” Wholesale power business: J-POWER’s hydroelectric, thermal power and transmission business. The majority of consolidated revenue is derived
from this segment. Other electric power businesses: Subsidiaries’ thermal power (IPP, for PPSs) and wind power “Electric Power-Related Businesses” These focus on peripheral businesses essential for the operation of power plants and transmission facilities, such as designing, executing,
inspecting and maintaining power facilities and importing and transporting coal. Intra-group transactions account for a large portion of this segment, such as Company’s power plant maintenance, coal transportation activities.
“Overseas Businesses” Overseas power generation businesses, overseas engineering and consulting businesses “Other Businesses” Diversified businesses such as telecommunication, environmental and the sale of coal
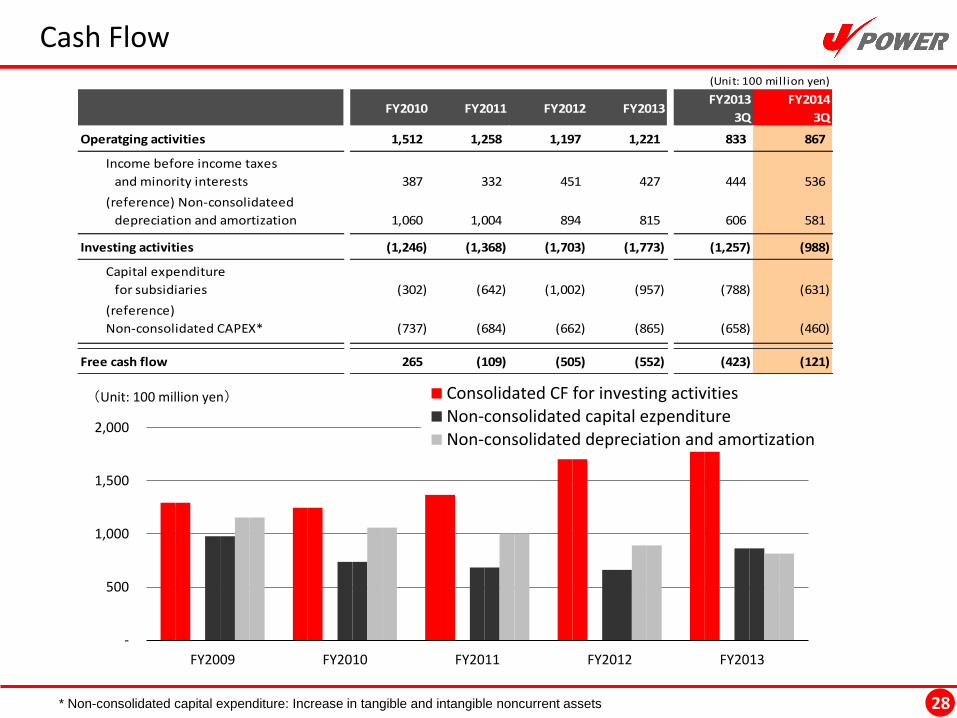
Cash Flow
28 * Non-consolidated capital expenditure: Increase in tangible and intangible noncurrent assets
-
500
1,000
1,500
2,000
FY2009 FY2010 FY2011 FY2012 FY2013
(Unit: 100 million yen) Consolidated CF for investing activitiesNon-consolidated capital ezpenditureNon-consolidated depreciation and amortization
(Unit: 100 mill ion yen)
FY2010 FY2011 FY2012 FY2013FY2013
3Q
FY2014
3Q
Operatging activities 1,512 1,258 1,197 1,221 833 867
Income before income taxes
and minority interests 387 332 451 427 444 536
(reference) Non-consolidateed
depreciation and amortization 1,060 1,004 894 815 606 581
Investing activities (1,246) (1,368) (1,703) (1,773) (1,257) (988)
Capital expenditure
for subsidiaries (302) (642) (1,002) (957) (788) (631)
(reference)
Non-consolidated CAPEX* (737) (684) (662) (865) (658) (460)
Free cash flow 265 (109) (505) (552) (423) (121)
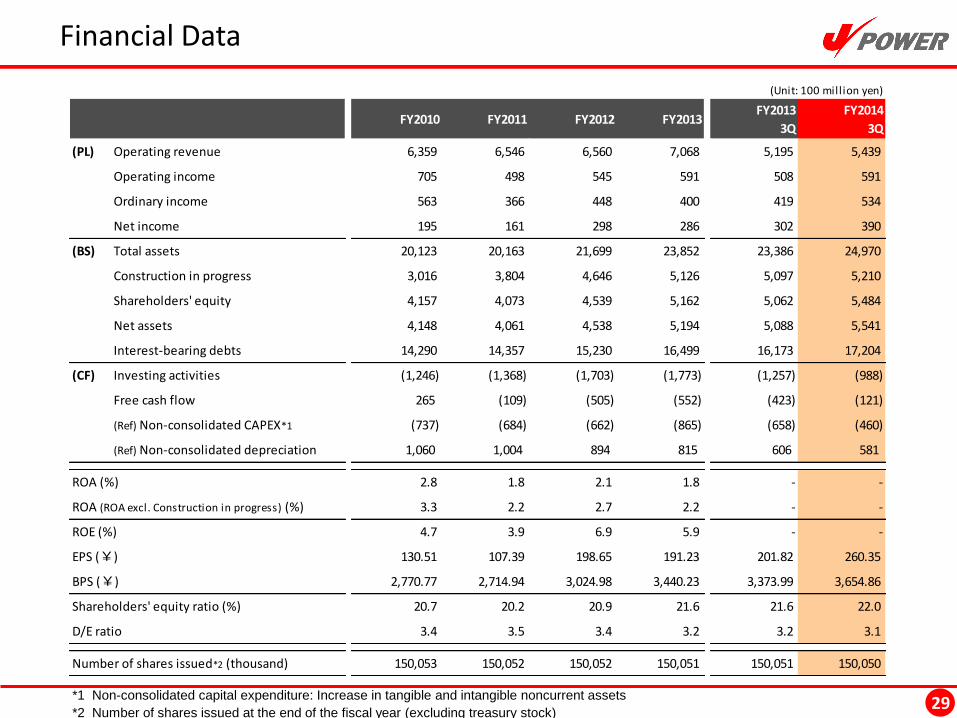
Financial Data
29 *1 Non-consolidated capital expenditure: Increase in tangible and intangible noncurrent assets
*2 Number of shares issued at the end of the fiscal year (excluding treasury stock)
(Unit: 100 mill ion yen)
FY2010 FY2011 FY2012 FY2013FY2013
3Q
FY2014
3Q
(PL) Operating revenue 6,359 6,546 6,560 7,068 5,195 5,439
Operating income 705 498 545 591 508 591
Ordinary income 563 366 448 400 419 534
Net income 195 161 298 286 302 390
(BS) Total assets 20,123 20,163 21,699 23,852 23,386 24,970
Construction in progress 3,016 3,804 4,646 5,126 5,097 5,210
Shareholders' equity 4,157 4,073 4,539 5,162 5,062 5,484
Net assets 4,148 4,061 4,538 5,194 5,088 5,541
Interest-bearing debts 14,290 14,357 15,230 16,499 16,173 17,204
(CF) Investing activities (1,246) (1,368) (1,703) (1,773) (1,257) (988)
Free cash flow 265 (109) (505) (552) (423) (121)
(Ref) Non-consolidated CAPEX*1 (737) (684) (662) (865) (658) (460)
(Ref) Non-consolidated depreciation 1,060 1,004 894 815 606 581
ROA (%) 2.8 1.8 2.1 1.8 - -
ROA (ROA excl. Construction in progress) (%) 3.3 2.2 2.7 2.2 - -
ROE (%) 4.7 3.9 6.9 5.9 - -
EPS (¥) 130.51 107.39 198.65 191.23 201.82 260.35
BPS (¥) 2,770.77 2,714.94 3,024.98 3,440.23 3,373.99 3,654.86
Shareholders' equity ratio (%) 20.7 20.2 20.9 21.6 21.6 22.0
D/E ratio 3.4 3.5 3.4 3.2 3.2 3.1
Number of shares issued*2 (thousand) 150,053 150,052 150,052 150,051 150,051 150,050
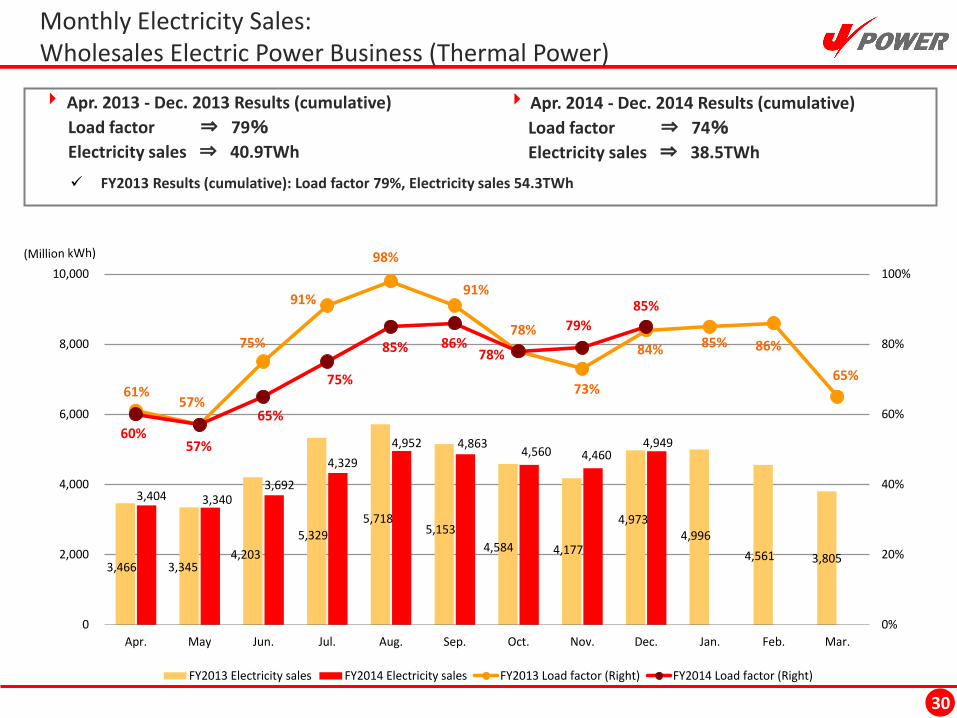
Monthly Electricity Sales: Wholesales Electric Power Business (Thermal Power)
30
Apr. 2014 - Dec. 2014 Results (cumulative)
Load factor ⇒ 74%
Electricity sales ⇒ 38.5TWh
Apr. 2013 - Dec. 2013 Results (cumulative)
Load factor ⇒ 79%
Electricity sales ⇒ 40.9TWh
FY2013 Results (cumulative): Load factor 79%, Electricity sales 54.3TWh
3,466 3,345 4,203
5,329 5,718
5,153
4,584 4,177
4,973 4,996
4,561 3,805
3,404 3,340 3,692
4,329
4,952 4,863 4,560 4,460
4,949
61%57%
75%
91%
98%
91%
78%
73%
84% 85% 86%
65%
60%57%
65%
75%
85% 86%78%
79%
85%
0%
20%
40%
60%
80%
100%
0
2,000
4,000
6,000
8,000
10,000
Apr. May Jun. Jul. Aug. Sep. Oct. Nov. Dec. Jan. Feb. Mar.
FY2013 Electricity sales FY2014 Electricity sales FY2013 Load factor (Right) FY2014 Load factor (Right)
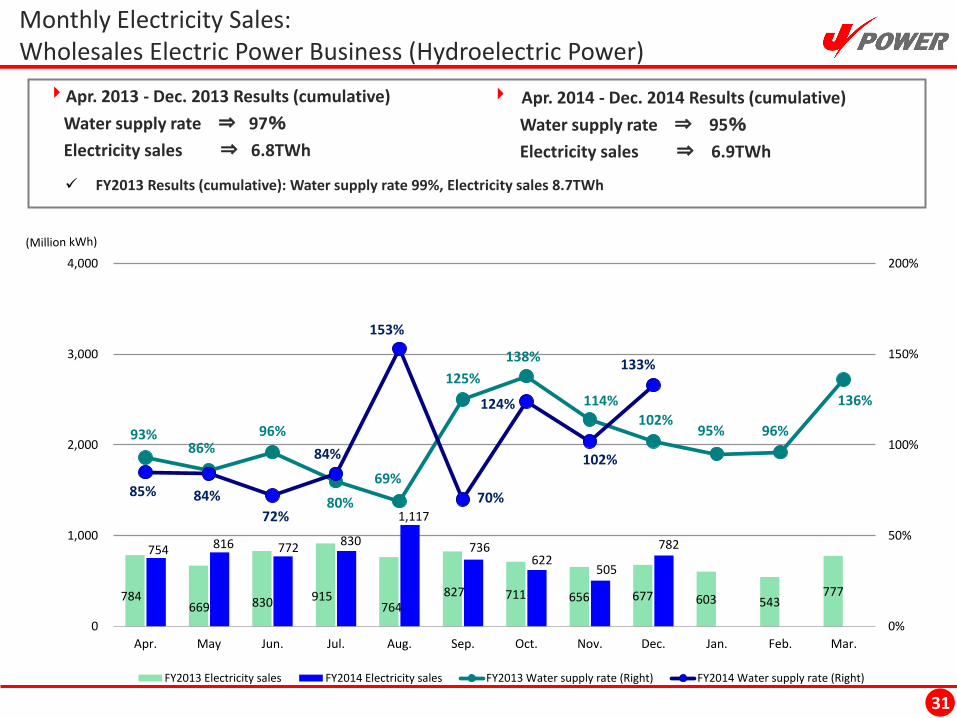
Monthly Electricity Sales: Wholesales Electric Power Business (Hydroelectric Power)
31
Apr. 2014 - Dec. 2014 Results (cumulative)
Water supply rate ⇒ 95%
Electricity sales ⇒ 6.9TWh
Apr. 2013 - Dec. 2013 Results (cumulative)
Water supply rate ⇒ 97%
Electricity sales ⇒ 6.8TWh
FY2013 Results (cumulative): Water supply rate 99%, Electricity sales 8.7TWh
784 669 830 915
764 827 711 656 677 603 543
777
754 816 772 830
1,117
736 622
505
782
93%86%
96%
80%
69%
125%
138%
114%
102%95% 96%
136%
85% 84%
72%
84%
153%
70%
124%
102%
133%
0%
50%
100%
150%
200%
0
1,000
2,000
3,000
4,000
Apr. May Jun. Jul. Aug. Sep. Oct. Nov. Dec. Jan. Feb. Mar.
FY2013 Electricity sales FY2014 Electricity sales FY2013 Water supply rate (Right) FY2014 Water supply rate (Right)
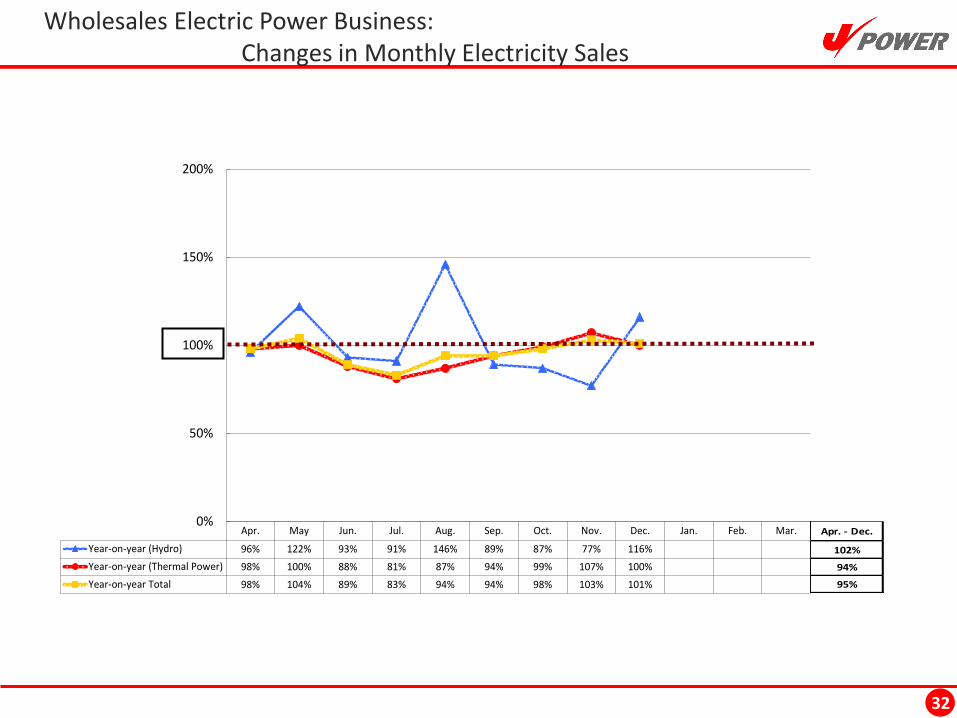
Apr. May Jun. Jul. Aug. Sep. Oct. Nov. Dec. Jan. Feb. Mar.
Year-on-year (Hydro) 96% 122% 93% 91% 146% 89% 87% 77% 116%
Year-on-year (Thermal Power) 98% 100% 88% 81% 87% 94% 99% 107% 100%
Year-on-year Total 98% 104% 89% 83% 94% 94% 98% 103% 101%
0%
50%
100%
150%
200%
Wholesales Electric Power Business: Changes in Monthly Electricity Sales
32
Apr. - Dec.
102%
94%
95%
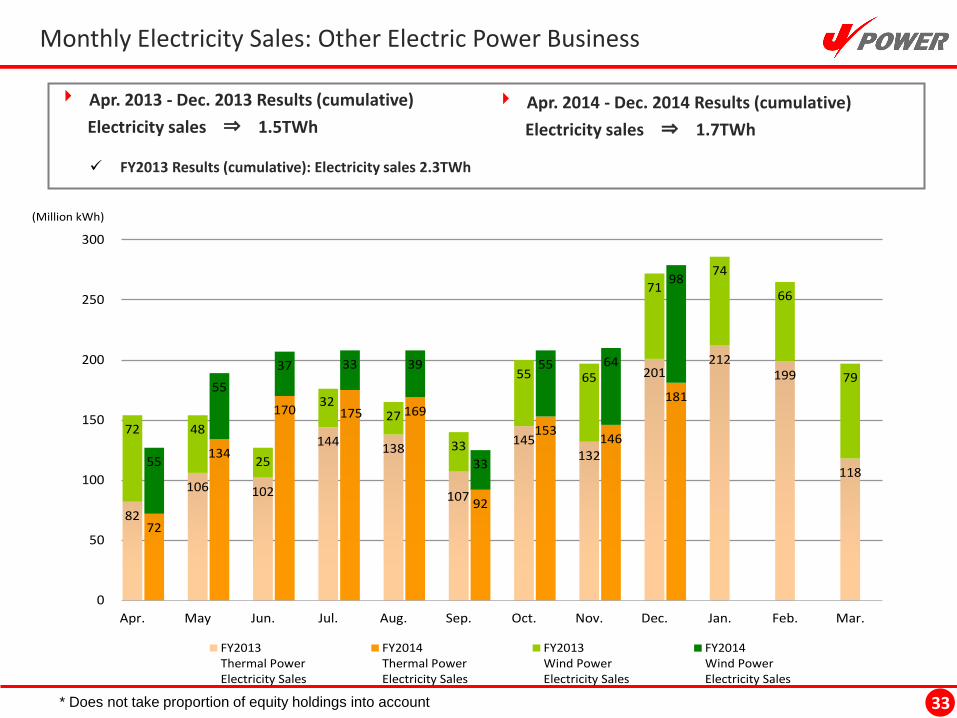
Monthly Electricity Sales: Other Electric Power Business
33
Apr. 2013 - Dec. 2013 Results (cumulative)
Electricity sales ⇒ 1.5TWh
Apr. 2014 - Dec. 2014 Results (cumulative)
Electricity sales ⇒ 1.7TWh
FY2013 Results (cumulative): Electricity sales 2.3TWh
* Does not take proportion of equity holdings into account
82
106 102
144138
107
145132
201212
199
118
72
134
170 175 169
92
153146
181
72 48
25
3227
33
55 65
7174
66
79
55
55
37 33 39
33
55 64
98
0
50
100
150
200
250
300
Apr. May Jun. Jul. Aug. Sep. Oct. Nov. Dec. Jan. Feb. Mar.
(Million kWh)
FY2013Thermal PowerElectricity Sales
FY2014Thermal PowerElectricity Sales
FY2013Wind PowerElectricity Sales
FY2014Wind PowerElectricity Sales

34
http://www.jpower.co.jp/
電源開発株式会社