Embed Size (px)
Citation preview

1
Drosophila Cdc42-interacting protein 4 (dCIP4) restrains synaptic growth by inhibiting the secretion of the retrograde Gbb signal Minyeop Nahm, Sungdae Kim, Sang Kyoo Paik, Mihye Lee, Seongsoo Lee, Zang Hee Lee, Jaesang Kim, Daekee Lee, Yong Chul Bae, and Seungbok Lee
Supplemental Figure Legends
Supplemental Figure 1. Localization of dCIP4 in the embryonic CNS. Stage 16 wild-
type embryos were double stained for dCIP4 (green) and the presynaptic marker
Synaptotagmin (Syt) (red; A) or the postsynaptic marker Dlg (red; B). White arrows
indicate salivary glands. Ventral view, anterior to the left. Scale bar, 100 μm.
Supplemental Figure 2. Evolutionarily conserved properties of dCIP4. A, B,
Representative images of COS-7 cells transfected with wild-type Myc-dCIP4 (dCIP4;
A) and Myc-dCIP4-L145D (dCIP4[LD]; B). Myc immunoreactivity was examined by
confocal microscopy. Note that the L145D mutation in dCIP4 completely abolishes its
membrane-tubulating activity. Scale bar, 20 μm. C, dCIP4 interacts with the
constitutively active Cdc42 (Cdc42V12) via the HR1 domain and Wsp via the SH3
domain. In pull-down assays, cell lysates from HEK293T cells expressing Myc-
Cdc42V12, Myc-Cdc42N17, or Wsp-GFP were incubated with immobilized GST,
GST-dCIP4, GST-dCIP4-L436S (GST-dCIP4[LS]), or GST-dCIP4-W603K (GST-
dCIP4[WK]). The pull-downs were analyzed by western blotting with either anti-Myc
(two upper panels) or anti-GFP (middle panel). The lower panel shows the Coomassie
Blue staining following SDS-PAGE of GST and GST-dCIP4 preparations. The arrow
indicates the position of the GST-dCIP4 fusion and its mutants. D, dCIP4 can bind

2
simultaneously to active Cdc42 and Wsp. Cell lysates prepared from HEK293T cells
expressing HA-Cdc42V12 along with Myc-dCIP4 (left panels) or Myc-dCIP4-W603K
(right panels) were incubated with immobilized GST or GST-Wsp-PRD (amino acids
301-378). The pull-downs were analyzed by western blot analysis with both anti-Myc
(upper panels) and anti-HA (middle panels) antibodies. The lower panels show the
Coomassie Blue staining following SDS-PAGE of GST and GST-Wsp-PRD
preparations. The arrows indicate the position of GST-Wsp-PRD. Numbers on the left
are molecular masses in kDa.
Supplemental Figure 3. Western blot of body-wall muscle extracts from wild-type
(WT), BG57-GAL4/+, dcip41/Df(3L)ED4342 (dcip41/Df), BG57-GAL4,dcip41/UAS-HA-
dcip4,Df(3L)ED4342 (dCIP4 rescue-post), BG57-GAL4,dcip41/UAS-HA-dcip4-
L145D,Df(3L)ED4342 (dCIP4[LD] rescue-post), BG57-GAL4,dcip41/UAS-HA-dcip4-
L436S,Df(3L)ED4342 (dCIP4[LS] rescue-post), and BG57-GAL4,dcip41/UAS-HA-
dcip4-W603K,Df(3L)ED4342 (dCIP4[WK] rescue-post) larvae. The blot was probed
with anti-HA and reprobed with anti-β-actin.
Supplemental Figure 4. Cdc42 controls the postsynaptic localization of dCIP4, which
in turn controls the postsynaptic localization of Wsp. A, Quantification of the ratio of
average dCIP4 or Wsp to HRP signal intensities for experiments in Figure 4B-E. Values
are percentages of wild-type. ***p < 0.001. B, C, Western blots of total extracts of third
instar cdc422/cdc422 larvae probed with anti-dCIP4 (B) and dcip41/Df(3L)ED4342
larvae probed with anti-Wsp (C). Each blot was stripped and reprobed with anti-β-
actin.

3
Supplemental Figure 5. Postsynaptic Cdc42 and Wsp regulate synaptic growth at the
NMJ. A1-C2, Confocal images of third instar larval NMJs 6/7 (A1, B1, C1) and muscle
6 (A2, B2, C2) labeled with anti-HRP (green) and phalloidin (red), respectively. The
genotypes analyzed include MHC-GS-GAL4/+ (control; A1, A2), MHC-GS-GAL4/UAS-
cdc42V12 (UAS-cdc42V12; B1, B2), and MHC-GS-GAL4/UAS-cdc42N17 (UAS-
cdc42N17; C1, C2). Cdc42V12 larvae display an NMJ undergrowth phenotype, while
Cdc42N17 larvae have the opposite phenotype. Actin filaments are organized regularly
into striated myofibrils in control (A2) and Cdc42N17 (C2) larvae, while Cdc42V12
(B2) larvae display abnormal actin structures (arrow). Scale bar, 25 μm. D-F,
Quantification of total bouton number (D), satellite bouton number (E), and total NMJ
length (F) at NMJ 6/7 in MHC-GS-GAL4/+ (control), MHC-GS-GAL4/UAS-cdc42V12
(UAS-cdc42V12), and MHC-GS-GAL4/UAS-cdc42N17 (UAS-cdc42N17) larvae. All
animals were raised on RU486-free medium. The numbers of NMJs analyzed are
indicated inside bars. Statistically significant differences versus the MHC-GS-GAL4/+
control are indicated on top of bars (**p < 0.01; ***p < 0.001). G-I, Quantification of
bouton number (G), satellite bouton number (H), and NMJ length (I) at NMJ 6/7 in
wild-type (WT), wsp1/Df(3R)3450 (wsp1/Df), BG57-GAL4,wsp1/UAS-wsp,Df(3R)3450
(Wsp rescue-post), and C155-GAL4; wsp1/UAS-wsp,Df(3R)3450 (Wsp rescue-pre).
Statistically significant differences versus wsp1/Df(3R)3450 are indicated on top of bars
(***p < 0.001). Raw data are shown in supplemental Table 3.
Supplemental Figure 6. Levels of postsynaptic F-actin are significantly reduced in
dcip4, cdc42, wsp, and arp3 mutants. Single confocal slices of third instar NMJ

4
branches at muscles 12 and 13 double stained with anti-HRP (green) and rhodamine-
conjugated phalloidin (red). The genotypes analyzed include wild-type (A1, A2),
dcip41/Df(3L)ED4342 (B1, B2), cdc422/cdc422 (C1, C2), wsp1/Df(3R)3450 (D1, D2),
and arp3EP3640/arp3EP3640 (E1, E2). Scale bar, 5 μm. F, Quantification of the ratio of
average postsynaptic F-actin to HRP levels in the indicated genotypes. Values are the
percentage of wild-type. Statistically significant differences versus wild-type are
indicated on top of bars (**p < 0.01; ***p < 0.001).
Supplemental Figure 7. Postsynaptic dCIP4, Cdc42, Wsp, and Arp2/3 complex are
required for the normal accumulation of P-Mad in the nuclei of motor neurons. A1-F2,
Cell body nuclei in third instar larval ventral nerve cords stained with anti-P-Mad (red)
and anti-Elav (green) antibodies in control (BG57-GAL4/+, A1, A2), BG57-GAL4/UAS-
dcip4RNAi (B1, B2), UAS-cdc42RNAi/+; BG57-GAL4/+ (C1, C2), BG57-GAL4/UAS-
wspRNAi (D1, D2), UAS-arp2RNAi/+; BG57-GAL4/+ (E1, E2), and BG57-GAL4/UAS-
arp3RNAi (F1, F2). The numbers of nuclei analyzed are indicated inside bars. Scale bar,
20 μm. G, Quantification of the ratio of average P-Mad to HRP staining intensities.
Values are percentages of the BG57-GAL4/+ control. Statistically significant differences
versus the control are indicated on top of bars (***p < 0.001).
Supplemental Figure 8. The expression and processing of Gbb-GFP is not altered in
dcip4 and wsp mutants. A1-B2, High magnification images of Ib boutons at NMJ 6/7
labeled with anti-P-Mad (red) and anti-HRP (blue) in BG57-GAL4/+ (A1, A2) and
BG57-GAL4/UAS-gbb-GFP (B1, B2) third instar larvae. Note that presynaptic P-Mad
levels and satellite bouton formation (indicated by arrowheads) are significantly

5
increased by muscle-specific expression of Gbb-GFP. Scale bar, 5 μm. C,
Quantification of the ratio of average P-Mad to HRP levels in Ib boutons. The
difference between BG57-GAL4/+ (control) and BG57-GAL4/UAS-gbb-GFP is
statistically significant (***p < 0.001). D, Western blot of body-wall muscles dissected
from BG57-GAL4/+, BG57-GAL4/UAS-gbb-GFP, BG57-GAL4,Df(3L)ED4342/UAS-
gbb-GFP,dcip41, and BG57-GAL4/UAS-gbb-GFP,UAS-wspRNAi third instar larvae
probed with anti-GFP. The same blot was reprobed with anti-β-actin. Note that the ratio
of processed Gbb-GFP to unprocessed Gbb-GFP is not significantly changed by dcip4
mutations or wsp RNAi. E-H, Confocal images of NMJs 6/7 stained for total Gbb-GFP
(green) and HRP (red) in BG57-GAL4/+ (E), BG57-GAL4/UAS-gbb-GFP (F), BG57-
GAL4,Df(3L)ED4342/UAS-gbb-GFP,dcip41 (G), and BG57-GAL4/UAS-gbb-GFP,UAS-
wspRNAi (H) third instar larvae. Note that levels of total Gbb-GFP in muscle-cell
cytoplasm and at the NMJ are not significantly different according to genotype. Scale
bar, 50 μm.
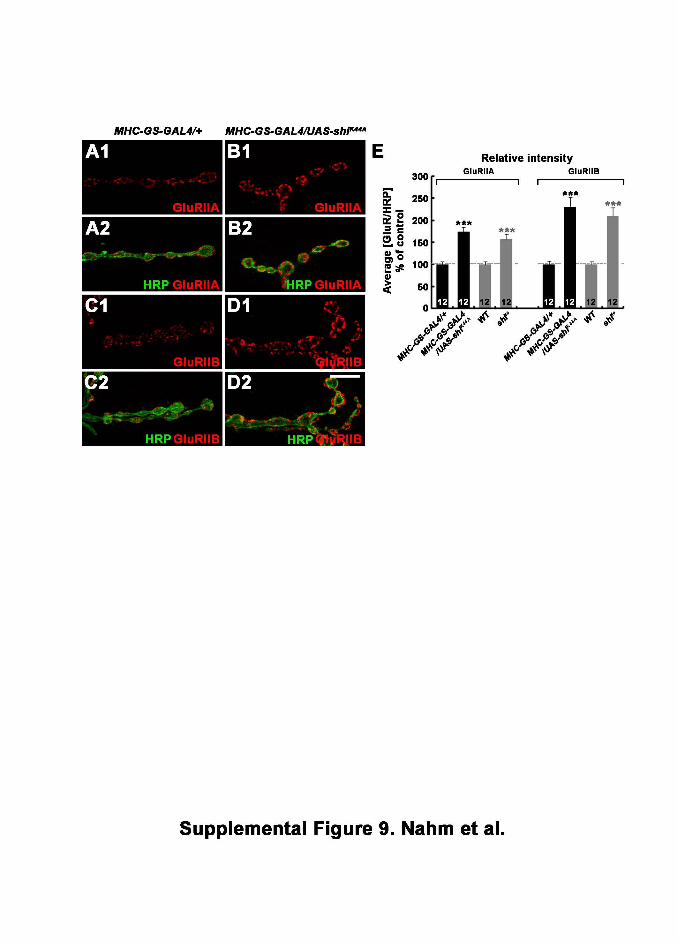
Supplemental Figure 9. Increased glutamate receptor abundance at the third-instar
NMJ in larvae expressing ShiK44A postsynaptically. A1-D2, Confocal images of NMJs
6/7 stained with anti-HRP (green) and either anti-GluRIIA (red; A1-B2) or anti-
GluRIIB (red; C1-D2) antibodies in MHC-GS--GAL4/+ and MHC-GS--GAL4/UAS-
shiK44A larvae. Scale bar, 10 μm. E, Quantification of the ratio of GluRIIA (black bars)
or GluRIIB (gray bars) versus HRP staining intensities in the indicated genotypes.
Wild-type and shits mutant larvae were pulsed at restrictive temperature for 3 h before
staining. The numbers of NMJ 6/7 branches analyzed are indicated inside bars. Values
are percentages of the corresponding control. ***p < 0.001.


Bou
ton
num
ber
p va
lue
vs W
TM
uscl
e ar
ea( μ
m2 X1
03 )p
valu
evs
WT
Bou
ton
num
ber
/Mus
cle
area
(X 1
0-3 μ
m-2
)
p va
lue
vs W
TN
MJ
leng
th( μ
m)
p va
lue
vs W
T
NM
J le
ngth
/Mus
cle
area
(X 1
0-3 μ
m-1
)
p va
lue
vs W
TSa
telli
tebo
uton
num
ber
p va
lue
vs W
T
w11
18 (W
T)11
8.2
± 4
91.7
± 1
.71.
29 ±
0.0
454
3 ±
215.
9 ±
0.2
13.1
± 1
dcip
41/D
f(3L)
ED
4342
147.
1 ±
5.6
<0.0
0187
± 2
.40.
670
1.7
± 0.
07<0
.001
624
± 26
0.00
57.
3 ±
0.3
<0.0
0121
.9 ±
1.2
<0.0
01B
G57
-GA
L4/+
112
± 4.
20.
992
87.9
± 1
.90.
855
1.27
± 0
.04
1.00
051
3 ±
210.
280
5.8
± 0.
20.
745
13.6
± 1
.31.
000
BG
57-G
AL4
,dci
p41
/UA
S-H
A-d
cip4
,Df(3
L)E
D43
4211
3.7
± 3.
90.
999
90 ±
1.9
0.99
91.
3 ±
0.05
1.00
051
7 ±
140.
368
5.8
± 0.
20.
663
12.4
± 1
1.00
0
BG
57-G
AL4
,dci
p41
/UA
S-H
A-d
cip4
-L14
5D,D
f(3L)
ED
4342
120.
7 ±
4.5
1.00
090
.3 ±
11.
000
1.34
± 0
.05
1.00
054
2 ±
200.
968
6 ±
0.2
0.82
710
.6 ±
0.7
0.87
1
BG
57-G
AL4
,dci
p41
/UA
S-H
A-d
cip4
-L43
6S,D
f(3L)
ED
4342
140.
7 ±
3.8
0.02
088
.9 ±
1.5
0.97
71.
59 ±
0.0
60.
004
595
± 22
0.07
26.
7 ±
0.3
0.01
724
± 1
.3<0
.001
BG
57-G
AL4
,dci
p41
/UA
S-H
A-d
cip4
-14
6.1
± 5.
60.
002
91.7
± 1
.31.
000
1.6
± 0.
070.
007
610
± 22
0.03
06.
7 ±
0.3
0.04
124
± 1
.5<0
.001
C15
5-G
AL4
/+13
1.8
± 3.
80.
468
96.9
± 1
.70.
468
1.4
± 0.
040.
992
555
± 21
0.67
75.
7 ±
0.2
0.56
913
.3 ±
1.1
1.00
0C
155-
GA
L4/+
; dci
p41
/UA
S-H
A-d
cip4
,Df(3
L)E
D43
4214
9.4
± 5.
3<0
.001
91.5
± 1
.61.
000
1.64
± 0
.07
<0.0
0166
1 ±
21<0
.001
7.3
± 0.
3<0
.001
21.7
± 1
.1<0
.001
Supp
lem
enta
l Tab
le 1
. Q
uant
ifica
tion
of N
MJ
para
met
ers
for e
xper
imen
ts in
Fig
ure
2

Bou
ton
num
ber
p va
lue
vsB
G57
-GA
L4/+
Mus
cle
area
( μm
2 X10³ )
p va
lue
vsB
G57
-GA
L4/+
Bou
ton
num
ber
/Mus
cle
area
(X 1
0-3 μ
m-2
)
p va
lue
vsB
G57
-GA
L4/+
NM
J le
ngth
( μm
)
p va
lue
vsB
G57
-GA
L4/+
NM
J le
ngth
/Mus
cle
area
(X 1
0-3 μ
m-1
)
p va
lue
vsB
G57
-GA
L4/+
Sate
llite
bout
on n
umbe
r
p va
lue
vsB
G57
-GA
L4/+
BG
57-G
AL4
/+11
5.4
± 2.
192
.3 ±
1.5
1.25
± 0
.02
549
± 13
6 ±
0.1
13 ±
0.7
UA
S-c
dc42
RN
Ai /+
; BG
57-G
AL4
/+16
1.4
± 5.
4<0
.001
91.3
± 1
.80.
999
1.77
± 0
.05
<0.0
0162
6 ±
200.
002
6.9
± 0.
2<0
.001
24.2
± 1
.5<0
.001
BG
57-G
AL4
/UA
S-w
spR
NA
i15
2.1
± 3.
5<0
.001
89 ±
1.3
0.67
51.
71 ±
0.0
4<0
.001
631
± 20
0.00
17.
1 ±
0.2
<0.0
0123
± 1
.2<0
.001
UA
S-a
rp2
RN
Ai /+
; BG
57-G
AL4
/+15
4.8
± 3.
9<0
.001
92.1
± 1
.81.
000
1.69
± 0
.05
<0.0
0159
0 ±
160.
073
6.4
± 0.
20.
044
20 ±
1.1
<0.0
01
BG
57-G
AL4
/UA
S-a
rp3
RN
Ai
161
± 5
<0.0
0190
± 1
.40.
859
1.79
± 0
.05
<0.0
0159
3 ±
160.
066
6.6
± 0.
20.
010
23.3
± 1
<0.0
01
Bou
ton
num
ber
p va
lue
vsC
155-
GA
L4/+
Mus
cle
area
( μm
2 X10³ )
p va
lue
vsC
155-
GA
L4/+
Bou
ton
num
ber
/Mus
cle
area
(X 1
0-3 μ
m-2
)
p va
lue
vsC
155-
GA
L4/+
NM
J le
ngth
( μm
)
p va
lue
vsC
155-
GA
L4/+
NM
J le
ngth
/Mus
cle
area
(X 1
0-3 μ
m-1
)
p va
lue
vsC
155-
GA
L4/+
Sate
llite
bout
on n
umbe
r
p va
lue
vsC
155-
GA
L4/+
C15
5-G
AL4
/+13
1.8
± 3.
896
.9 ±
1.7
1.36
± 0
.04
555
± 21
5.7
± 0.
213
.3 ±
1.1
C15
5-G
AL4
/+; U
AS
-cdc
42R
NA
i /+14
1.4
± 6
0.29
389
± 1
.90.
010
1.58
± 0
.05
0.00
158
9 ±
200.
192
6.6
± 0.
1<0
.001
19.7
± 1
.5<0
.001
C15
5-G
AL4
/+; U
AS
-wsp
RN
Ai /+
131.
6 ±
3.1
0.99
995
.5 ±
1.6
0.83
31.
38 ±
0.0
30.
937
545
± 13
0.69
15.
7 ±
0.1
0.94
413
.4 ±
0.7
0.99
7
Supp
lem
enta
l Tab
le 2
. Q
uant
ifica
tion
of N
MJ
para
met
ers
for e
xper
imen
ts in
Fig
ure
5

Bou
ton
num
ber
p va
lue
vsM
HC
-GS
-GA
L4/+
Mus
cle
area
( μm
2 X10³ )
p va
lue
vsM
HC
-GS-
GAL
4/+
Bou
ton
num
ber
/Mus
cle
area
(X 1
0-3 μ
m-2
)
p va
lue
vsM
HC
-GS-
GAL
4/+
NM
Jle
ngth
( μm
)
p va
lue
vsM
HC
-GS
-GAL
4/+
NM
J le
ngth
/Mus
cle
area
(X 1
0-3 μ
m-1
)
p va
lue
vsM
HC
-GS-
GAL
4/+
Sate
llite
bout
onnu
mbe
r
p va
lue
vsM
HC
-GS
-GA
L4/+
MH
C-G
S-G
AL4/
+ 10
8.5
± 1.
581
.9 ±
21.
33 ±
0.0
357
8 ±
197.
1 ±
0.3
10.7
± 0
.8
MH
C-G
S-G
AL4/
UA
S-c
dc42
V12
74.9
± 1
.8<0
.001
80.8
± 1
.70.
913
0.93
± 0
.03
<0.0
0143
6 ±
11<0
.001
5.4
± 0.
1<0
.001
7 ±
0.4
0.00
2M
HC
-GS
-GAL
4/U
AS
-cdc
42N
1713
0 ±
3.1
<0.0
0182
.6 ±
2.4
0.97
21.
59 ±
0.0
5<0
.001
663
± 23
0.00
58.
1 ±
0.2
0.00
520
.4 ±
0.9
<0.0
01
Bou
ton
num
ber
p va
lue
vs w
sp1/D
fM
uscl
e ar
ea( μ
m2 X1
03 )p
valu
evs
wsp
1/D
f
Bou
ton
num
ber
/Mus
cle
area
(X 1
0-3 μ
m-2
)
p va
lue
vs w
sp1/D
f
NM
Jle
ngth
( μm
)
p va
lue
vs w
sp1/D
f
NM
J le
ngth
/Mus
cle
area
(X 1
0-3 μ
m-1
)
p va
lue
vs w
sp1/D
f
Sate
llite
bout
onnu
mbe
r
p va
lue
vs w
sp1/D
f
w11
18 (W
T)11
7.8
± 2.
8<0
.001
89.6
± 1
.30.
949
1.32
± 0
.04
<0.0
0152
9 ±
20<0
.001
5.9
± 0.
3<0
.001
13.6
± 0
.8<0
.001
wsp
1/D
f(3R
)345
016
9.3
± 2.
590
.8 ±
1.3
1.87
± 0
.03
706
± 17
7.8
± 0.
226
.5 ±
1.3
BG
57-G
AL4,
wsp
1
/UA
S-w
sp,D
f(3R
)345
013
1.3
± 3.
8<0
.001
96.6
± 1
.70.
187
1.52
± 0
.03
<0.0
0156
5 ±
15<0
.001
6.5
± 0.
1<0
.001
16.3
± 0
.8<0
.001
C15
5-G
AL4
; wsp
1
/UA
S-w
sp,D
f(3R
)345
015
4.7
± 3
0.00
488
.1 ±
1.4
0.54
61.
76 ±
0.0
40.
161
690
± 17
0.90
37.
9 ±
0.2
0.99
118
± 1
.1<0
.001
Supp
lem
enta
l Tab
le 3
. Q
uant
ifica
tion
of N
MJ
para
met
ers
for e
xper
imen
ts in
Sup
plem
enta
l Fig
ure
5

Supplemental Table 4. Quantification of NMJ parameters for experiments in Figure 6
Bouton number WT dcip4 1 /+ cdc42 2 /+ wsp 1 /+ arp3 EP3640/+ cdc42 2 /+; dcip4 1 /+ dcip4 1 , +/+,wsp 1
w 1118 (WT) 117.9 ± 3.3 1.000 0.904 1.000 1.000 <0.001 <0.001
dcip4 1 /+ 118.7 ± 3.3 1.000 0.360 0.999 1.000 <0.001 <0.001
cdc42 2 /+ 125.3 ± 2.1 0.904 0.360 <0.001
wsp 1 /+ 119.4 ± 3 1.000 0.999 <0.001
arp3 EP3640/+ 118.1 ± 3.4 1.000 1.000
cdc42 2 /+; dcip4 1 /+ 145.2 ± 2.8 <0.001 <0.001 <0.001 0.957
dcip4 1 , +/+,wsp 1 147.9 ± 4.1 <0.001 <0.001 <0.001 0.957
cdc42 2 /+; dcip4 1 ,+/+,wsp 1 178.8 ± 4.2 <0.001 <0.001 <0.001
dcip4 1 ,+/ +,arp3 EP3640 155.9 ± 4.5 <0.001 <0.001 <0.001
Muscle area(μm2X103)
WT dcip4 1 /+ cdc42 2 /+ wsp 1 /+ arp3 EP3640/+ cdc42 2 /+; dcip4 1 /+ dcip4 1 , +/+,wsp 1
w 1118 (WT) 89.7 ± 1.8 0.983 1.000 1.000 1.000 0.952 1.000
dcip4 1 /+ 92 ± 1.3 0.983 0.844 0.942 0.850 0.996 0.842
cdc42 2 /+ 90.5 ± 1.2 1.000 0.844 0.718
wsp 1 /+ 90.8 ± 1.7 1.000 0.942 0.993
arp3 EP3640/+ 90 ± 1.8 1.000 0.850
cdc42 2 /+; dcip4 1 /+ 92.4 ± 1.1 0.952 0.996 0.718 0.564
dcip4 1 , +/+,wsp 1 90.2 ± 1.4 1.000 0.842 0.993 0.564
cdc42 2 /+; dcip4 1 ,+/+,wsp 1 96.9 ± 0.7 0.027 0.043 <0.001
dcip4 1 ,+/ +,arp3 EP3640 97.4 ± 2 0.017 0.112 0.017
Bouton number/Muscle area(X 10-3 μm-2)
WT dcip4 1 /+ cdc42 2 /+ wsp 1 /+ arp3 EP3640/+ cdc42 2 /+; dcip4 1 /+ dcip4 1 , +/+,wsp 1
w 1118 (WT) 1.32 ± 0.05 1.000 0.983 1.000 1.000 0.006 <0.001
dcip4 1 /+ 1.3 ± 0.03 1.000 0.210 0.956 0.975 <0.001 <0.001
cdc42 2 /+ 1.4 ± 0.03 0.983 0.210 0.003
wsp 1 /+ 1.33 ± 0.04 1.000 0.956 <0.001
arp3 EP3640/+ 1.32 ± 0.04 1.000 0.975
cdc42 2 /+; dcip4 1 /+ 1.57 ± 0.03 0.006 <0.001 0.003 0.629
dcip4 1 , +/+,wsp 1 1.65 ± 0.06 <0.001 <0.001 <0.001 0.629
cdc42 2 /+; dcip4 1 ,+/+,wsp 1 1.85 ± 0.04 <0.001 <0.001 0.020
dcip4 1 ,+/ +,arp3 EP3640 1.61 ± 0.05 <0.001 <0.001 <0.001
NMJ length(μm)
WT dcip4 1 /+ cdc42 2 /+ wsp 1 /+ arp3 EP3640/+ cdc42 2 /+; dcip4 1 /+ dcip4 1 , +/+,wsp 1
w 1118 (WT) 524 ± 10 0.769 0.745 0.697 0.850 0.004 0.004
dcip4 1 /+ 531 ± 15 0.769 0.970 0.903 0.925 0.002 <0.001
cdc42 2 /+ 532 ± 18 0.745 0.970 0.002
wsp 1 /+ 533 ± 11 0.697 0.903 <0.001
arp3 EP3640/+ 529 ± 19 0.850 0.925
cdc42 2 /+; dcip4 1 /+ 598 ± 14 0.004 0.002 0.002 0.950
dcip4 1 , +/+,wsp 1 597 ± 13 0.004 <0.001 <0.001 0.950
cdc42 2 /+; dcip4 1 ,+/+,wsp 1 692 ± 19 <0.001 <0.001 <0.001
dcip4 1 ,+/ +,arp3 EP3640 656 ± 25 <0.001 <0.001 <0.001
NMJ length/Muscle area(X 10-3 μm-1)
WT dcip4 1 /+ cdc42 2 /+ wsp 1 /+ arp3 EP3640/+ cdc42 2 /+; dcip4 1 /+ dcip4 1 , +/+,wsp 1
WT 5.9 ± 0.1 0.796 0.919 0.877 0.877 0.030 0.004
dcip4 1 /+ 5.8 ± 0.2 0.796 0.658 0.606 0.690 0.003 <0.001
cdc42 2 /+ 5.9 ± 0.2 0.919 0.658 0.012
wsp 1 /+ 5.9 ± 0.1 0.877 0.606 <0.001
arp3 EP3640/+ 5.9 ± 0.2 0.877 0.690
cdc42 2 /+; dcip4 1 /+ 6.5 ± 0.1 0.030 0.003 0.012 0.445
dcip4 1 , +/+,wsp 1 6.7 ± 0.2 0.004 <0.001 <0.001 0.445
cdc42 2 /+; dcip4 1 ,+/+,wsp 1 7.1 ± 0.2 <0.001 0.006 0.037
dcip4 1 ,+/ +,arp3 EP3640 6.7 ± 0.2 0.002 0.001 0.005
Satellitebouton number WT dcip4 1 /+ cdc42 2 /+ wsp 1 /+ arp3 EP3640/+ cdc42 2 /+; dcip4 1 /+ dcip4 1 , +/+,wsp 1
w 1118 (WT) 13.8 ± 0.9 0.997 0.139 0.989 0.989 <0.001 <0.001
dcip4 1 /+ 15 ± 0.9 0.997 0.098 0.188 0.181 <0.001 <0.001
cdc42 2 /+ 17.9 ± 0.8 0.139 0.098 <0.001
wsp 1 /+ 12.3 ± 0.8 0.989 0.188 <0.001
arp3 EP3640/+ 12.3 ± 0.6 0.989 0.181
cdc42 2 /+; dcip4 1 /+ 25.8 ± 1 <0.001 <0.001 <0.001 0.080
dcip4 1 , +/+,wsp 1 22 ± 1.1 <0.001 <0.001 <0.001 0.080
cdc42 2 /+; dcip4 1 ,+/+,wsp 1 32.2 ± 1.3 <0.001 <0.001 <0.001
dcip4 1 ,+/ +,arp3 EP3640 21.3 ± 1.1 <0.001 <0.001 <0.001
p value vs
p value vs
p value vs
p value vs
p value vs
p value vs

Supplemental Table 5. Quantification of NMJ parameters for experiments in Figure 7
Bouton number WTBG57-GAL4/UAS-cip4 RNAi
BG57-GAL4/UAS-wsp RNAi wit A12 /wit B11
w 1118 (WT) 119.4 ± 2.7 <0.001 <0.001 <0.001BG57-GAL4/+ 114.8 ± 1.7 0.978 <0.001 <0.001 <0.001
BG57-GAL4/UAS-cip4 RNAi 142.1 ± 3 <0.001 0.720 <0.001
BG57-GAL4/UAS-wsp RNAi 149.6 ± 3.5 <0.001 0.720 <0.001
wit A12 /wit B11 61.6 ± 3.3 <0.001 <0.001 <0.001BG57-GAL4,wit B11 /UAS- 65 ± 1.7 <0.001 <0.001 <0.001 0.998BG57-GAL4,wit B11 /UAS- 61.2 ± 2.8 <0.001 <0.001 <0.001 1.000
wit A12 /+ 121.1 ± 2 1.000 <0.001 <0.001 <0.001
BG57-GAL4/UAS-cip4 RNAi ,wit A12 120.1 ± 3.6 1.000 <0.001 <0.001 <0.001
BG57-GAL4/UAS-wsp RNAi ,wit A12 119.1 ± 3.1 1.000 <0.001 <0.001 <0.001
Muscle area(μm2X103)
WTBG57-GAL4/UAS-cip4 RNAi
BG57-GAL4/UAS-wsp RNAi wit A12 /wit B11
w 1118 (WT) 89.4 ± 1.2 <0.001 0.999 <0.001BG57-GAL4/+ 91.6 ± 1.3 0.985 <0.001 1.000 <0.001
BG57-GAL4/UAS-cip4 RNAi 79.2 ± 1.2 <0.001 <0.001 0.001
BG57-GAL4/UAS-wsp RNAi 90.8 ± 1.2 0.999 <0.001 <0.001
wit A12 /wit B11 70.3 ± 1.1 <0.001 0.001 <0.001BG57-GAL4,wit B11 /UAS- 68 ± 0.7 <0.001 <0.001 <0.001 0.980BG57-GAL4,wit B11 /UAS- 71.1 ± 1.2 <0.001 0.005 <0.001 1.000
wit A12 /+ 89.8 ± 1.2 1.000 <0.001 1.000 <0.001
BG57-GAL4/UAS-cip4 RNAi ,wit A12 79.4 ± 2.1 <0.001 1.000 <0.001 0.001
BG57-GAL4/UAS-wsp RNAi ,wit A12 91.8 ± 1.7 0.961 <0.001 1.000 <0.001
Bouton number/Muscle area(X 10-3 μm-2)
WTBG57-GAL4/UAS-cip4 RNAi
BG57-GAL4/UAS-wsp RNAi wit A12 /wit B11
w 1118 (WT) 1.34 ± 0.04 <0.001 <0.001 <0.001BG57-GAL4/+ 1.26 ± 0.02 0.869 <0.001 <0.001 <0.001
BG57-GAL4/UAS-cip4 RNAi 1.8 ± 0.03 <0.001 0.238 <0.001
BG57-GAL4/UAS-wsp RNAi 1.65 ± 0.04 <0.001 0.238 <0.001
wit A12 /wit B11 0.88 ± 0.05 <0.001 <0.001 <0.001BG57-GAL4,wit B11 /UAS- 0.96 ± 0.03 <0.001 <0.001 <0.001 0.918BG57-GAL4,wit B11 /UAS- 0.86 ± 0.04 <0.001 <0.001 <0.001 1.000
wit A12 /+ 1.36 ± 0.03 1.000 <0.001 <0.001 <0.001
BG57-GAL4/UAS-cip4 RNAi ,wit A12 1.52 ± 0.05 0.052 <0.001 0.418 <0.001
BG57-GAL4/UAS-wsp RNAi ,wit A12 1.31 ± 0.04 1.000 <0.001 <0.001 <0.001
Satellitebouton number WT
BG57-GAL4/UAS-cip4 RNAi
BG57-GAL4/UAS-wsp RNAi wit A12 /wit B11
w 1118 (WT) 13.8 ± 0.8 <0.001 <0.001 <0.001BG57-GAL4/+ 13.6 ± 0.6 1.000 <0.001 <0.001 <0.001
BG57-GAL4/UAS-cip4 RNAi 19 ± 0.6 <0.001 0.486 <0.001
BG57-GAL4/UAS-wsp RNAi 21.2 ± 1.1 <0.001 0.486 <0.001
wit A12 /wit B11 3.7 ± 0.5 <0.001 <0.001 <0.001BG57-GAL4,wit B11 /UAS- 4.6 ± 0.3 <0.001 <0.001 <0.001 0.996BG57-GAL4,wit B11 /UAS- 2.8 ± 0.3 <0.001 <0.001 <0.001 0.998
wit A12 /+ 12 ± 0.5 0.722 <0.001 <0.001 <0.001
BG57-GAL4/UAS-cip4 RNAi ,wit A12 11.8 ± 0.5 0.677 <0.001 <0.001 <0.001
BG57-GAL4/UAS-wsp RNAi ,wit A12 11.9 ± 0.8 0.565 <0.001 <0.001 <0.001
p value vs
p value vs
p value vs
p value vs