Embed Size (px)
Citation preview
advances.sciencemag.org/cgi/content/full/3/4/e1600663/DC1
Supplementary Materials for
A dynamic hydrophobic core orchestrates allostery in protein kinases
Jonggul Kim, Lalima G. Ahuja, Fa-An Chao, Youlin Xia, Christopher L. McClendon, Alexandr P. Kornev,
Susan S. Taylor, Gianluigi Veglia
Published 7 April 2017, Sci. Adv. 3, e1600663 (2017)
DOI: 10.1126/sciadv.1600663
This PDF file includes:
fig. S1. [1H-13C] methyl-TROSY spectra of apo, nucleotide-bound (ATPγC), and
ternary (ATPγN/PKI5-24 and ATPγN/PLN1–19) forms of 2H,13C-isoleucine, leucine,
and valine (IVL)–labeled PKA-C.
fig. S2. Plots of the IVL methyl group CSPs upon ligand binding.
fig. S3. Mapping of the CSPs of the IVL methyl side-chain groups onto the crystal
structure of PKA-C (PDB: 1ATP).
fig. S4. Statistical analysis of the chemical shift changes.
fig. S5. CHESCA (39) correlation matrix showing the degree of correlated
chemical shift changes for the methyl side chains of IVL residues.
fig. S6. Global conformational transitions mapped via linear CSPs probed by
amide backbone resonances and methyl group resonances.
fig. S7. Fast time scale (picosecond to nanosecond) conformational dynamics of
the kinase upon ligand binding.
fig. S8. Thermodynamics of ligand binding for PKA-C as measured by isothermal
titration calorimetry (ITC).
fig. S9. Slow time scale (microsecond to millisecond) conformational dynamics of
the kinase.
fig. S10. Slow time scale conformational dynamics of the kinase.
fig. S11. Synchronous dynamics occurring in the highly conserved hydrophobic
core.
fig. S12. Location of I150 at the interface between different communities of
PKA-C.
fig. S13. Bridging residues connect the R-spine and C-spine at the PKA
hydrophobic core.
fig. S14. Western blot–based activity assay.
fig. S15. Assembly of the R-spine for active protein kinases.
fig. S16. Expression and purification of recombinant 2H, 15N, 13CH3-ILV, and
PKA-C from E. coli bacteria.
table S1. Classification of residues undergoing correlated chemical shift changes
and their respective location in a specific community as identified by community
map analysis.
table S2. The dynamic light scattering data for three different forms of PKA-C.
table S3. T2 and S2 values for methyl side-chain groups of apo PKA-C.
table S4. T2 and S2 values for methyl side-chain groups of the ATPγC-bound state
of PKA-C.
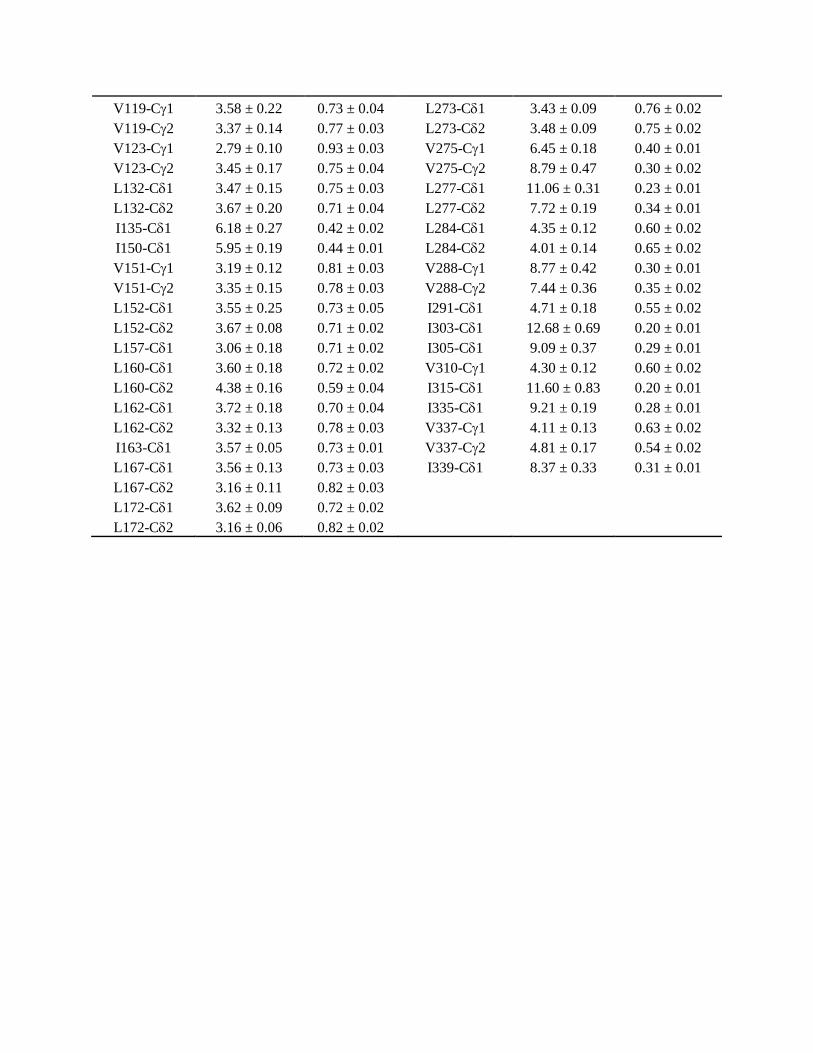
table S5. T2 and S2 values for methyl side-chain groups of the ATPγN/PKI5-24-
bound state of PKA-C.
table S6. Group fits of CPMG dispersion curves measured at 700 and 850 MHz of
the apo form of PKA-C.
table S7. Group fits of the CPMG relaxation dispersion curves measured at 700
and 850 MHz of the ATPγC form of PKA-C.
table S8. Single-quantum individual site fits of CPMG relaxation dispersion
curves measured at 700 and 850 MHz of the apo form of PKA-C.
table S9. Individual fits of the CPMG dispersion curves measured at 700 and 50
MHz of the ATPγC-bound state of PKA-C.
table S10. Single-quantum individual site fits of CPMG curves at 700 and 850
MHz of the ATPγN/PKI5-24-bound state of PKA-C.
table S11. Approximate Rex values from two points of the CPMG experiment for
the ATPγN/PLN1–19-bound form of PKA-C.
Reference (54)

fig. S1. [1H-13C] methyl-TROSY spectra of apo, nucleotide-bound (ATPγC), and ternary
(ATPγN/PKI5-24 and ATPγN/PLN1–19) forms of 2H,13C-isoleucine, leucine, and valine (IVL)–
labeled PKA-C. Resonances assignments were performed on the ATPN/PKI5-24 bound form
and transferred to the other forms following the chemical shift trajectories upon ligand titration
experiments.
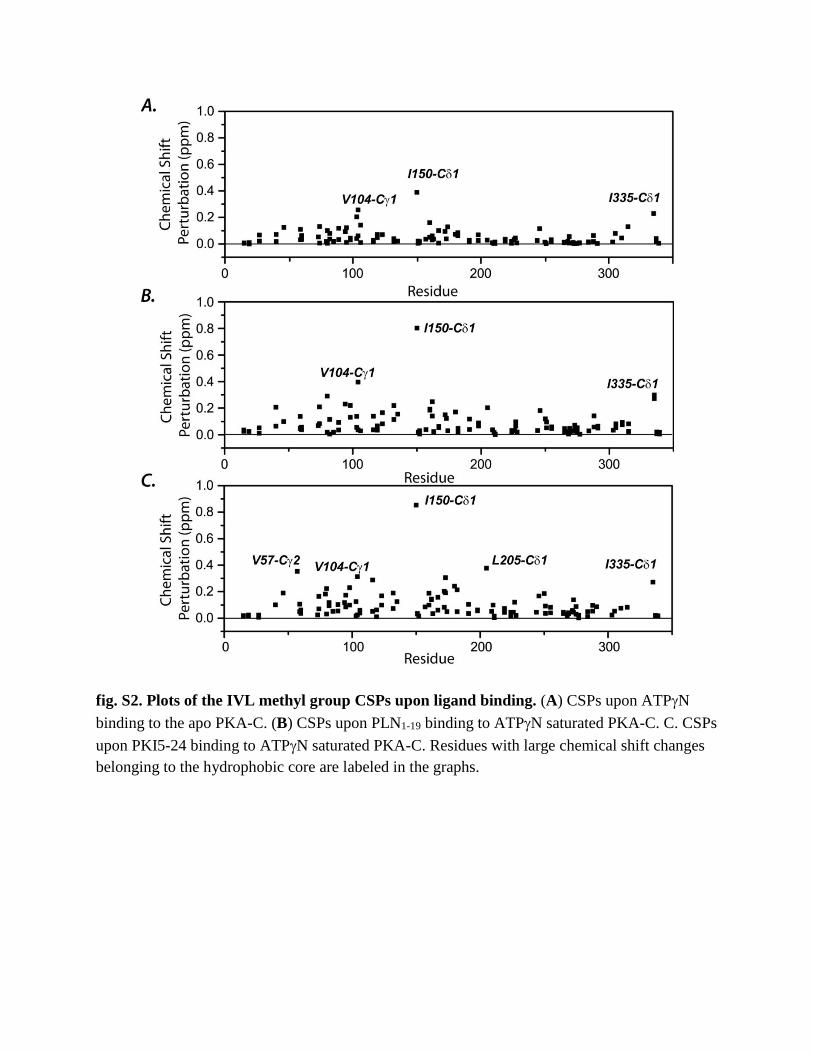
fig. S2. Plots of the IVL methyl group CSPs upon ligand binding. (A) CSPs upon ATPN
binding to the apo PKA-C. (B) CSPs upon PLN1-19 binding to ATPN saturated PKA-C. C. CSPs
upon PKI5-24 binding to ATPN saturated PKA-C. Residues with large chemical shift changes
belonging to the hydrophobic core are labeled in the graphs.
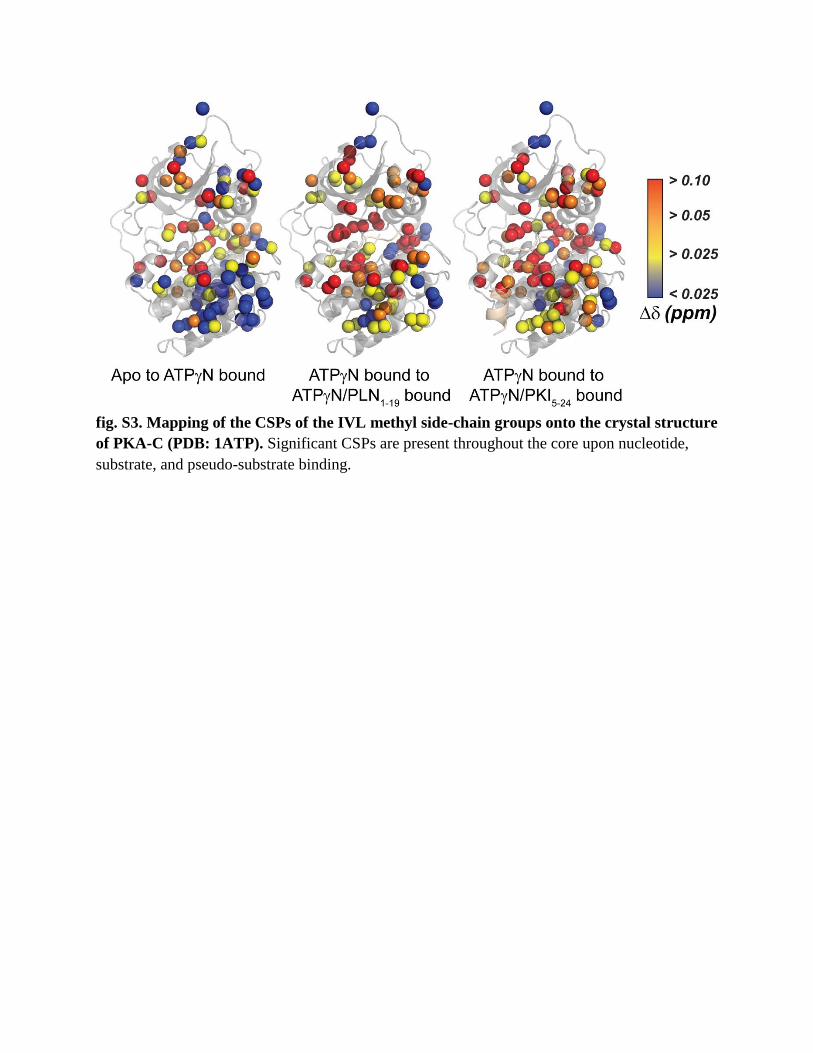
fig. S3. Mapping of the CSPs of the IVL methyl side-chain groups onto the crystal structure
of PKA-C (PDB: 1ATP). Significant CSPs are present throughout the core upon nucleotide,
substrate, and pseudo-substrate binding.
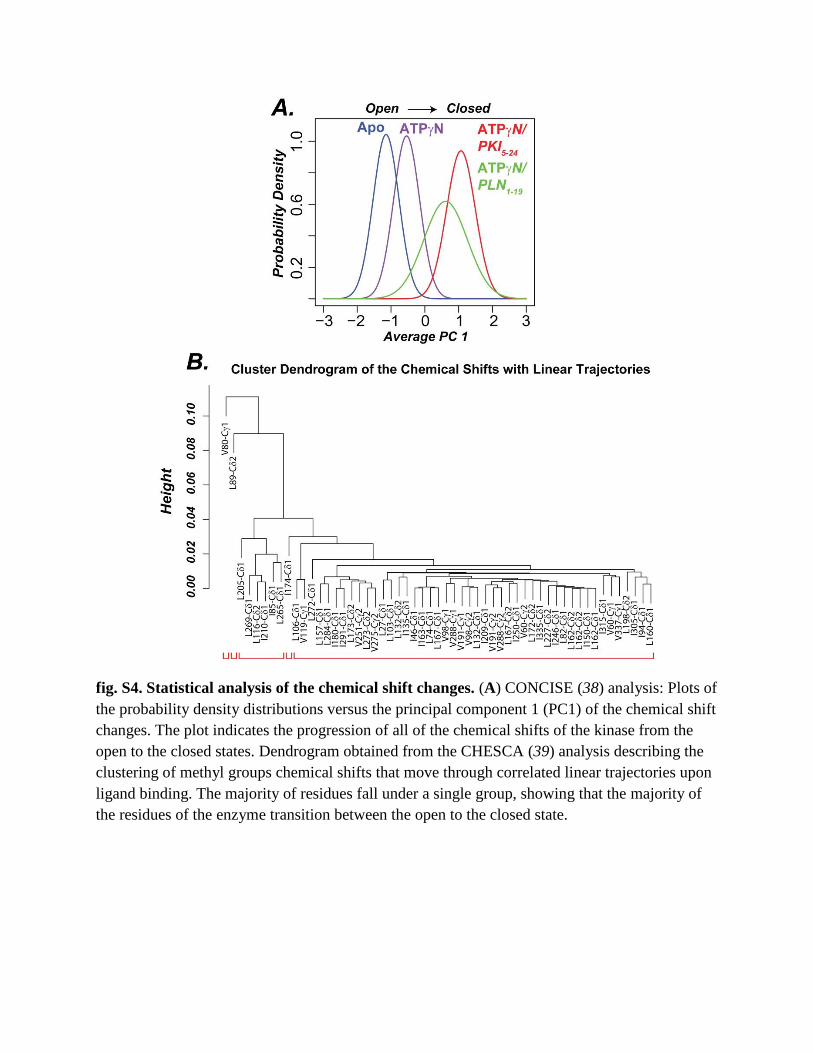
fig. S4. Statistical analysis of the chemical shift changes. (A) CONCISE (38) analysis: Plots of
the probability density distributions versus the principal component 1 (PC1) of the chemical shift
changes. The plot indicates the progression of all of the chemical shifts of the kinase from the
open to the closed states. Dendrogram obtained from the CHESCA (39) analysis describing the
clustering of methyl groups chemical shifts that move through correlated linear trajectories upon
ligand binding. The majority of residues fall under a single group, showing that the majority of
the residues of the enzyme transition between the open to the closed state.
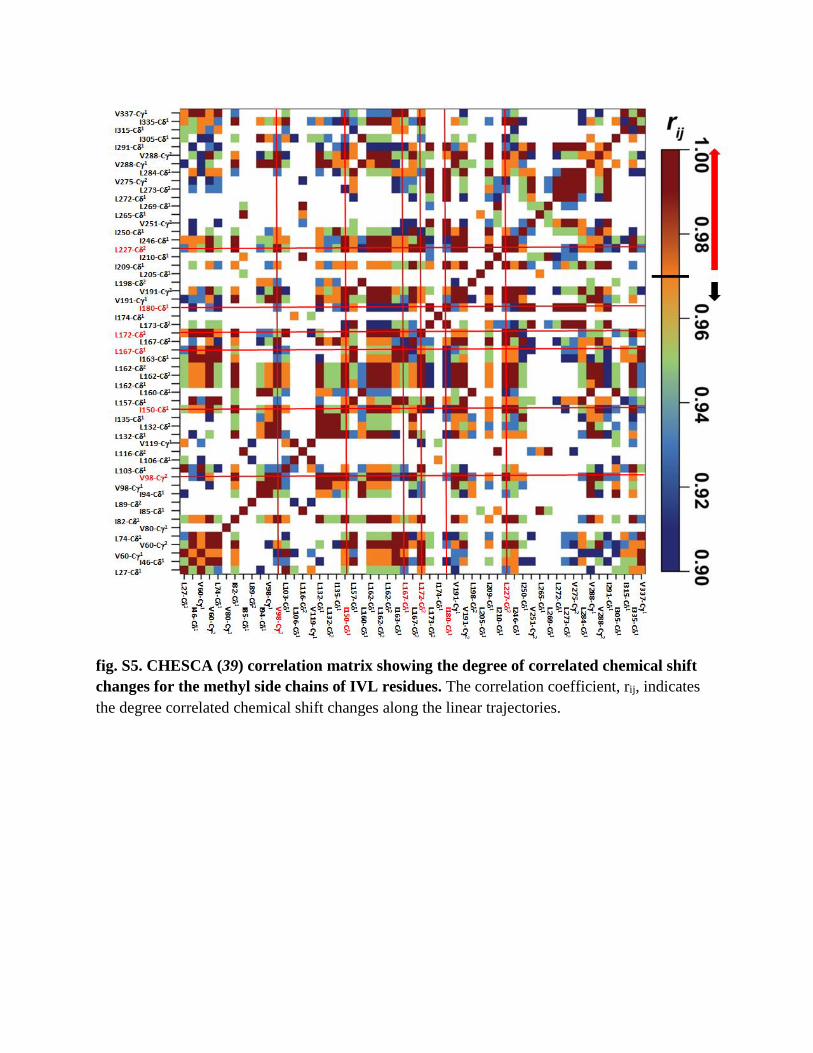
fig. S5. CHESCA (39) correlation matrix showing the degree of correlated chemical shift
changes for the methyl side chains of IVL residues. The correlation coefficient, rij, indicates
the degree correlated chemical shift changes along the linear trajectories.
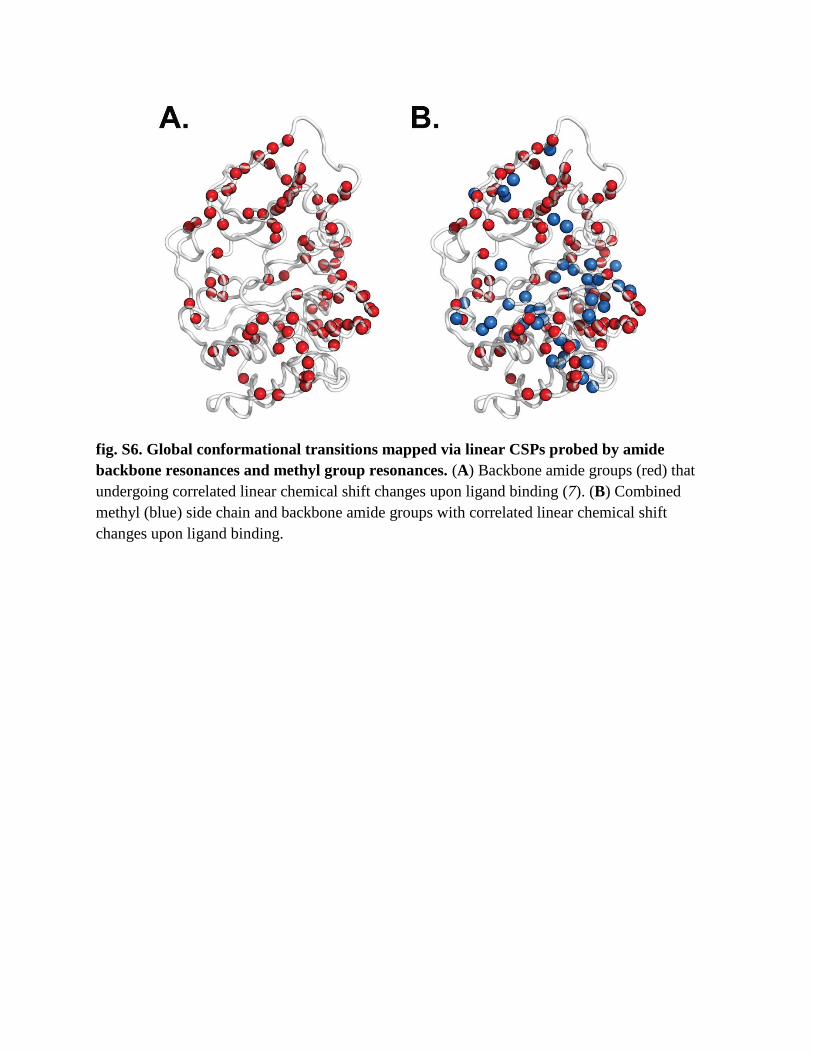
fig. S6. Global conformational transitions mapped via linear CSPs probed by amide
backbone resonances and methyl group resonances. (A) Backbone amide groups (red) that
undergoing correlated linear chemical shift changes upon ligand binding (7). (B) Combined
methyl (blue) side chain and backbone amide groups with correlated linear chemical shift
changes upon ligand binding.
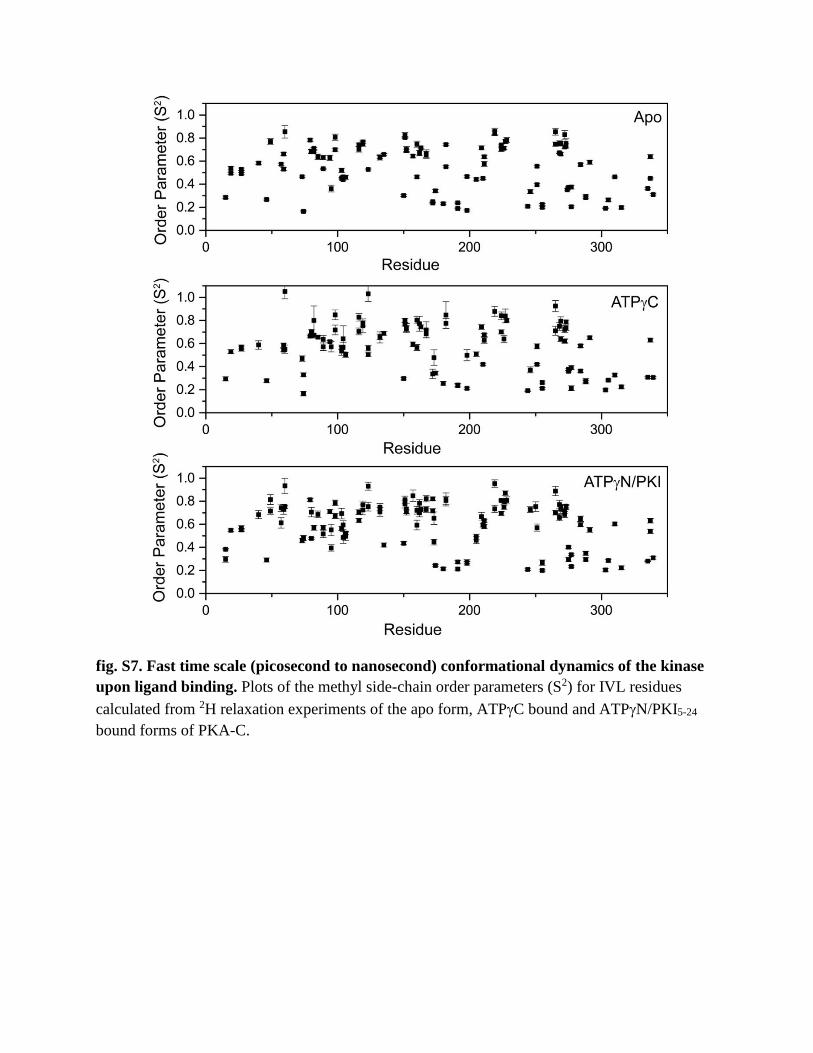
fig. S7. Fast time scale (picosecond to nanosecond) conformational dynamics of the kinase
upon ligand binding. Plots of the methyl side-chain order parameters (S2) for IVL residues
calculated from 2H relaxation experiments of the apo form, ATPC bound and ATPN/PKI5-24
bound forms of PKA-C.
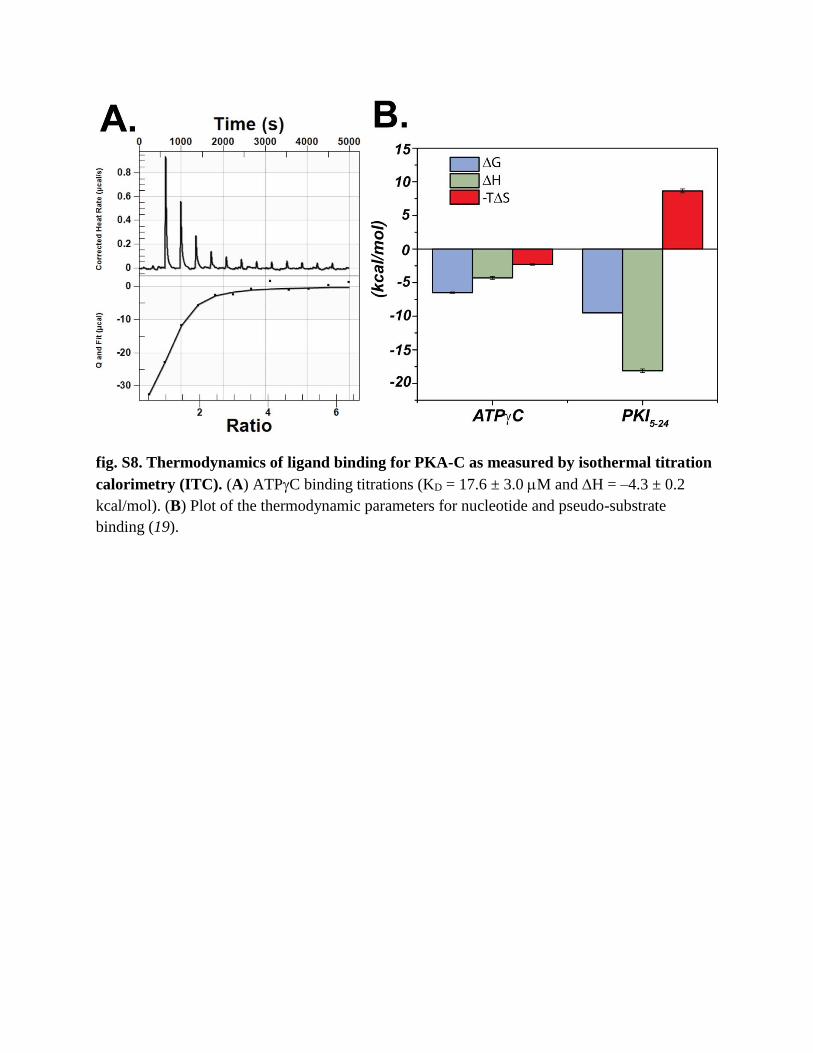
fig. S8. Thermodynamics of ligand binding for PKA-C as measured by isothermal titration
calorimetry (ITC). (A) ATPC binding titrations (KD = 17.6 ± 3.0 M and H = –4.3 ± 0.2
kcal/mol). (B) Plot of the thermodynamic parameters for nucleotide and pseudo-substrate
binding (19).
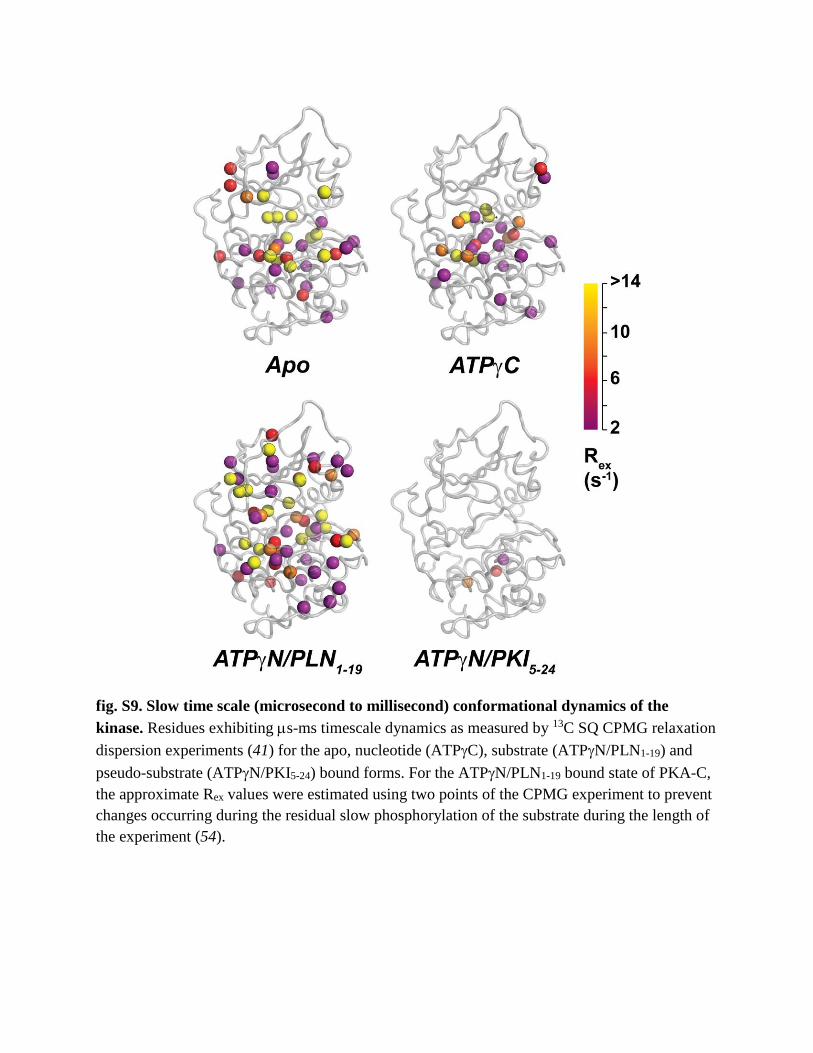
fig. S9. Slow time scale (microsecond to millisecond) conformational dynamics of the
kinase. Residues exhibiting s-ms timescale dynamics as measured by 13C SQ CPMG relaxation
dispersion experiments (41) for the apo, nucleotide (ATPC), substrate (ATPN/PLN1-19) and
pseudo-substrate (ATPN/PKI5-24) bound forms. For the ATPN/PLN1-19 bound state of PKA-C,
the approximate Rex values were estimated using two points of the CPMG experiment to prevent
changes occurring during the residual slow phosphorylation of the substrate during the length of
the experiment (54).
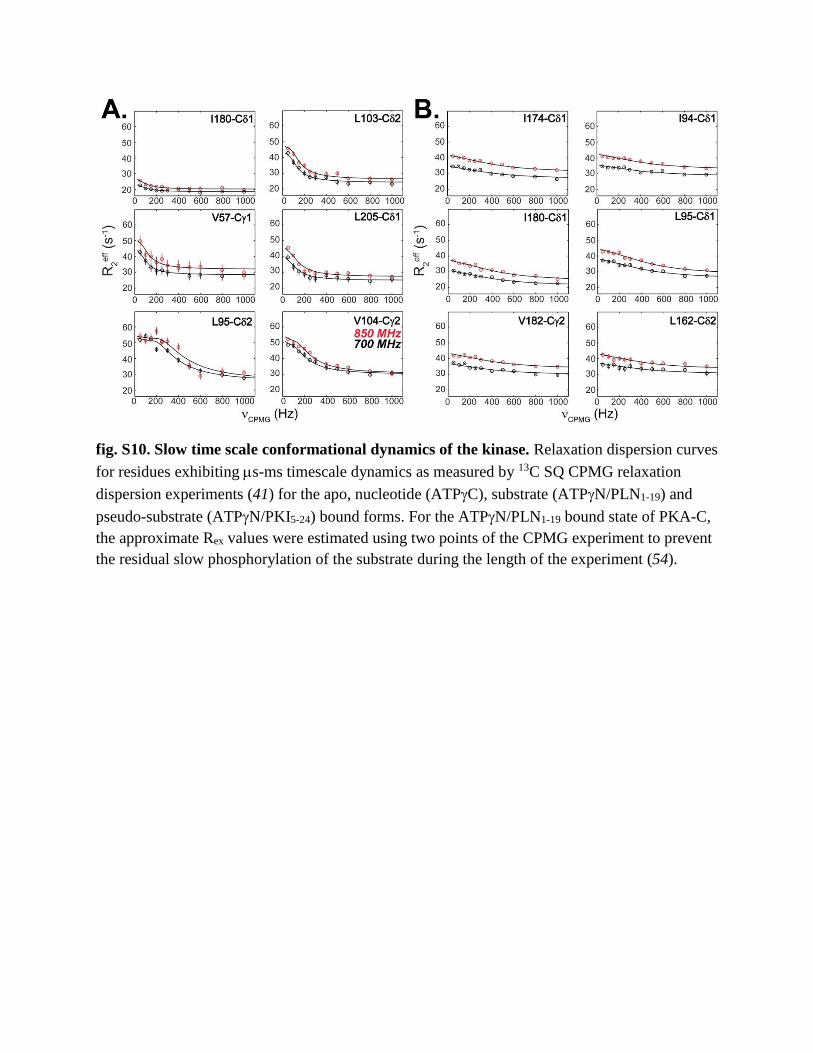
fig. S10. Slow time scale conformational dynamics of the kinase. Relaxation dispersion curves
for residues exhibiting s-ms timescale dynamics as measured by 13C SQ CPMG relaxation
dispersion experiments (41) for the apo, nucleotide (ATPC), substrate (ATPN/PLN1-19) and
pseudo-substrate (ATPN/PKI5-24) bound forms. For the ATPN/PLN1-19 bound state of PKA-C,
the approximate Rex values were estimated using two points of the CPMG experiment to prevent
the residual slow phosphorylation of the substrate during the length of the experiment (54).
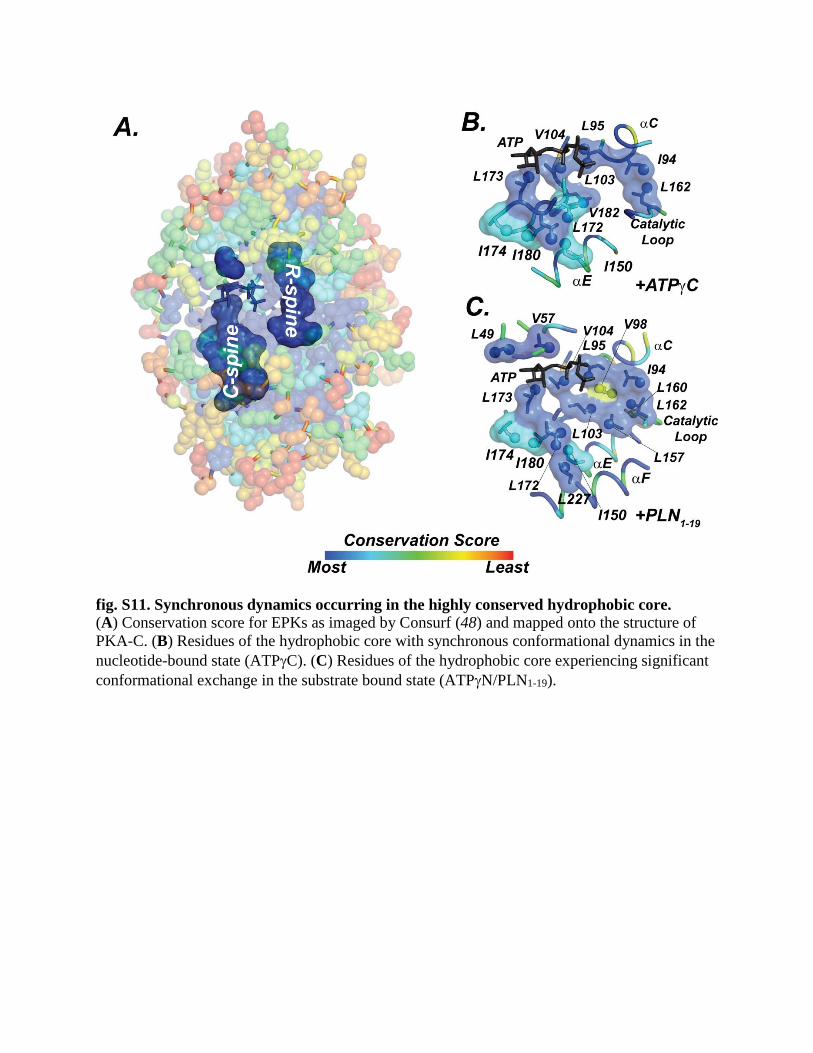
fig. S11. Synchronous dynamics occurring in the highly conserved hydrophobic core. (A) Conservation score for EPKs as imaged by Consurf (48) and mapped onto the structure of
PKA-C. (B) Residues of the hydrophobic core with synchronous conformational dynamics in the
nucleotide-bound state (ATPC). (C) Residues of the hydrophobic core experiencing significant
conformational exchange in the substrate bound state (ATPN/PLN1-19).
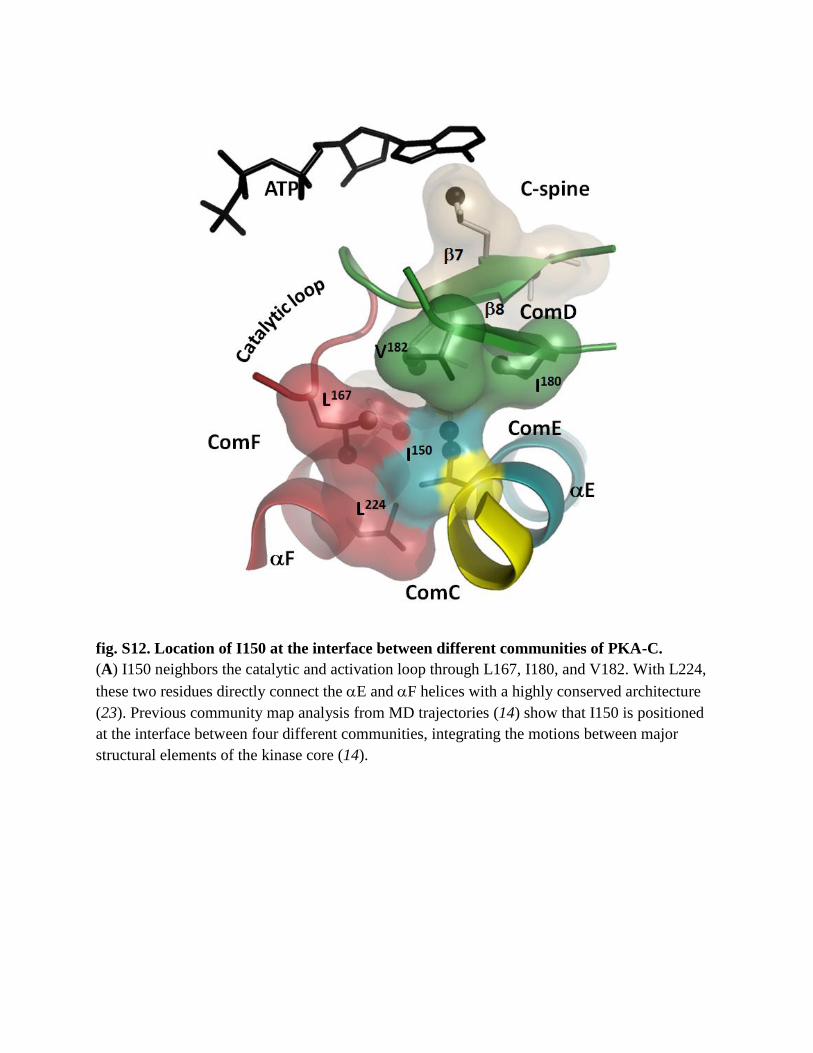
fig. S12. Location of I150 at the interface between different communities of PKA-C.
(A) I150 neighbors the catalytic and activation loop through L167, I180, and V182. With L224,
these two residues directly connect the E and F helices with a highly conserved architecture
(23). Previous community map analysis from MD trajectories (14) show that I150 is positioned
at the interface between four different communities, integrating the motions between major
structural elements of the kinase core (14).
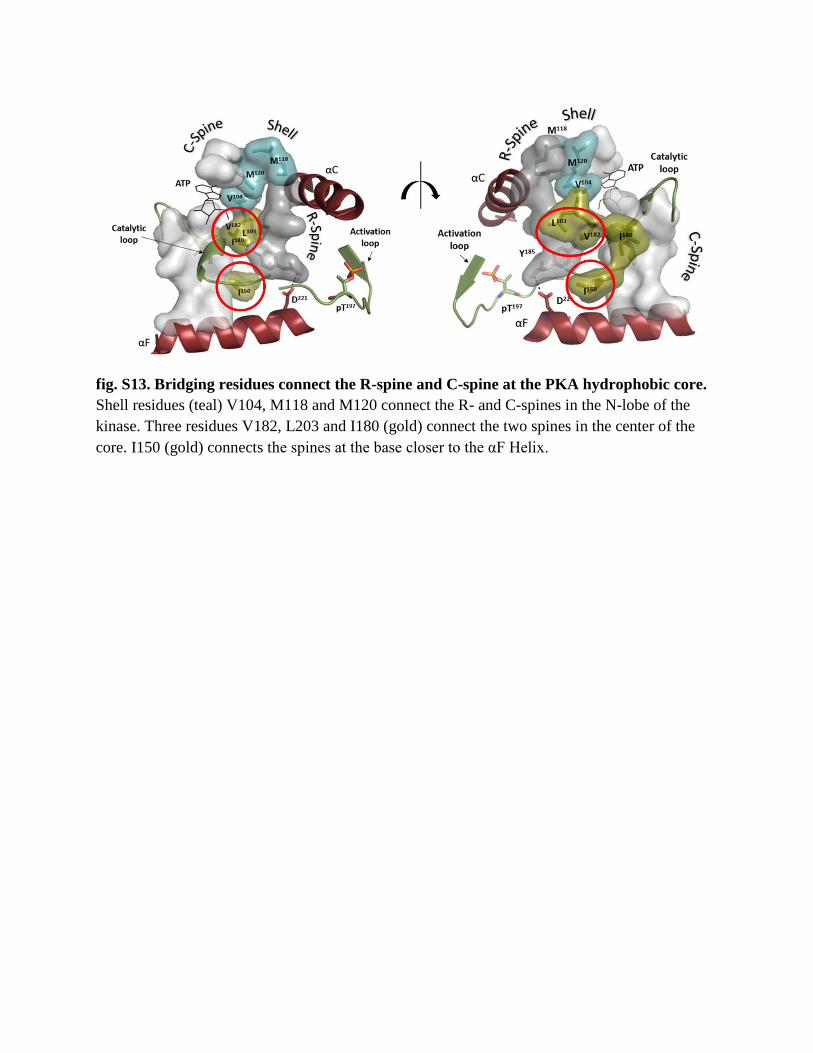
fig. S13. Bridging residues connect the R-spine and C-spine at the PKA hydrophobic core.
Shell residues (teal) V104, M118 and M120 connect the R- and C-spines in the N-lobe of the
kinase. Three residues V182, L203 and I180 (gold) connect the two spines in the center of the
core. I150 (gold) connects the spines at the base closer to the αF Helix.
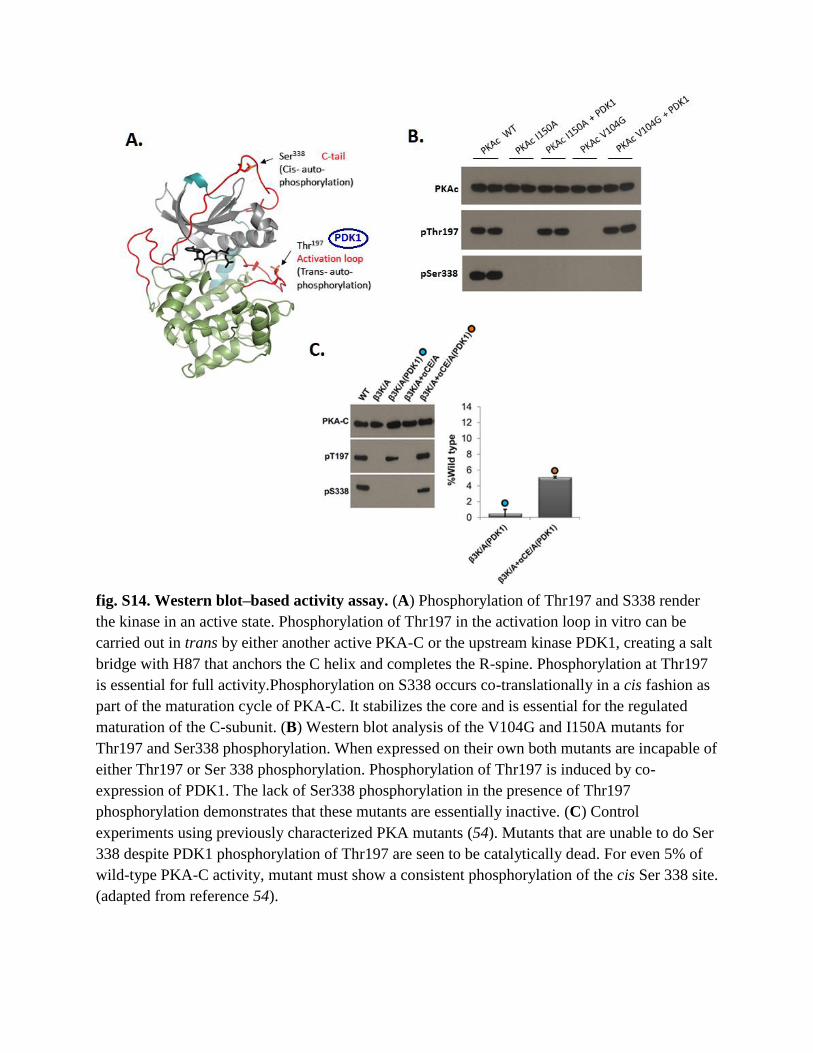
fig. S14. Western blot–based activity assay. (A) Phosphorylation of Thr197 and S338 render
the kinase in an active state. Phosphorylation of Thr197 in the activation loop in vitro can be
carried out in trans by either another active PKA-C or the upstream kinase PDK1, creating a salt
bridge with H87 that anchors the C helix and completes the R-spine. Phosphorylation at Thr197
is essential for full activity.Phosphorylation on S338 occurs co-translationally in a cis fashion as
part of the maturation cycle of PKA-C. It stabilizes the core and is essential for the regulated
maturation of the C-subunit. (B) Western blot analysis of the V104G and I150A mutants for
Thr197 and Ser338 phosphorylation. When expressed on their own both mutants are incapable of
either Thr197 or Ser 338 phosphorylation. Phosphorylation of Thr197 is induced by co-
expression of PDK1. The lack of Ser338 phosphorylation in the presence of Thr197
phosphorylation demonstrates that these mutants are essentially inactive. (C) Control
experiments using previously characterized PKA mutants (54). Mutants that are unable to do Ser
338 despite PDK1 phosphorylation of Thr197 are seen to be catalytically dead. For even 5% of
wild-type PKA-C activity, mutant must show a consistent phosphorylation of the cis Ser 338 site.
(adapted from reference 54).
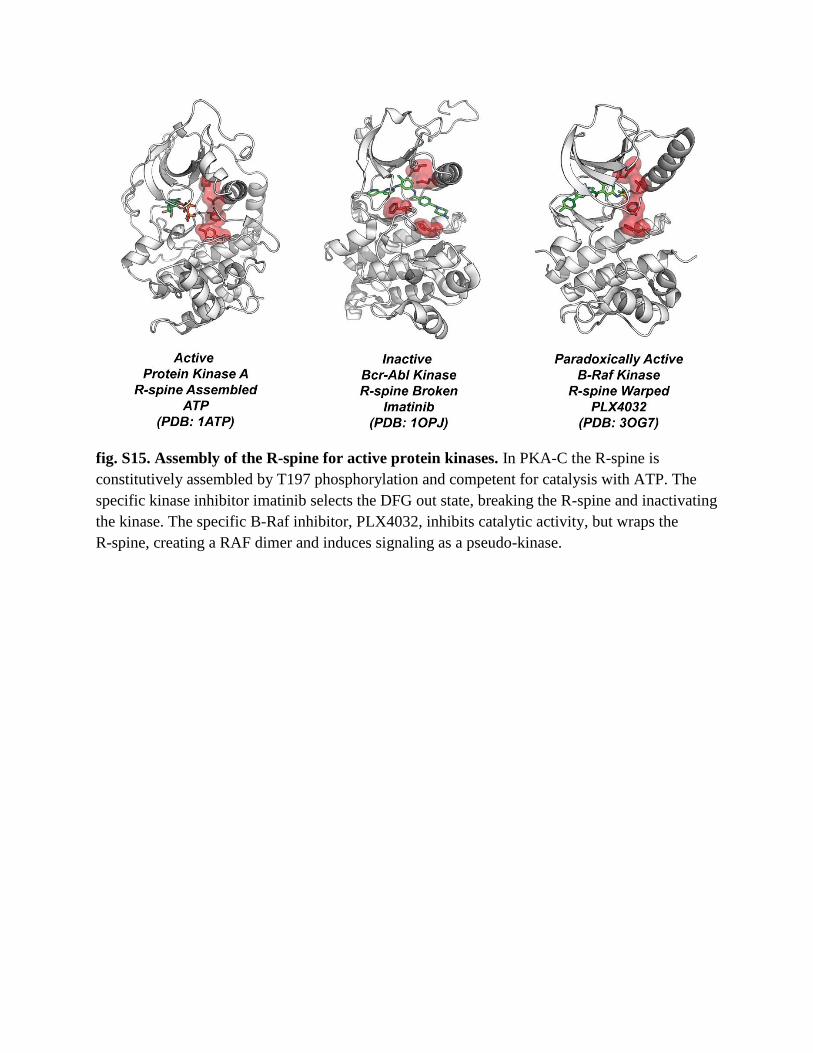
fig. S15. Assembly of the R-spine for active protein kinases. In PKA-C the R-spine is
constitutively assembled by T197 phosphorylation and competent for catalysis with ATP. The
specific kinase inhibitor imatinib selects the DFG out state, breaking the R-spine and inactivating
the kinase. The specific B-Raf inhibitor, PLX4032, inhibits catalytic activity, but wraps the
R-spine, creating a RAF dimer and induces signaling as a pseudo-kinase.
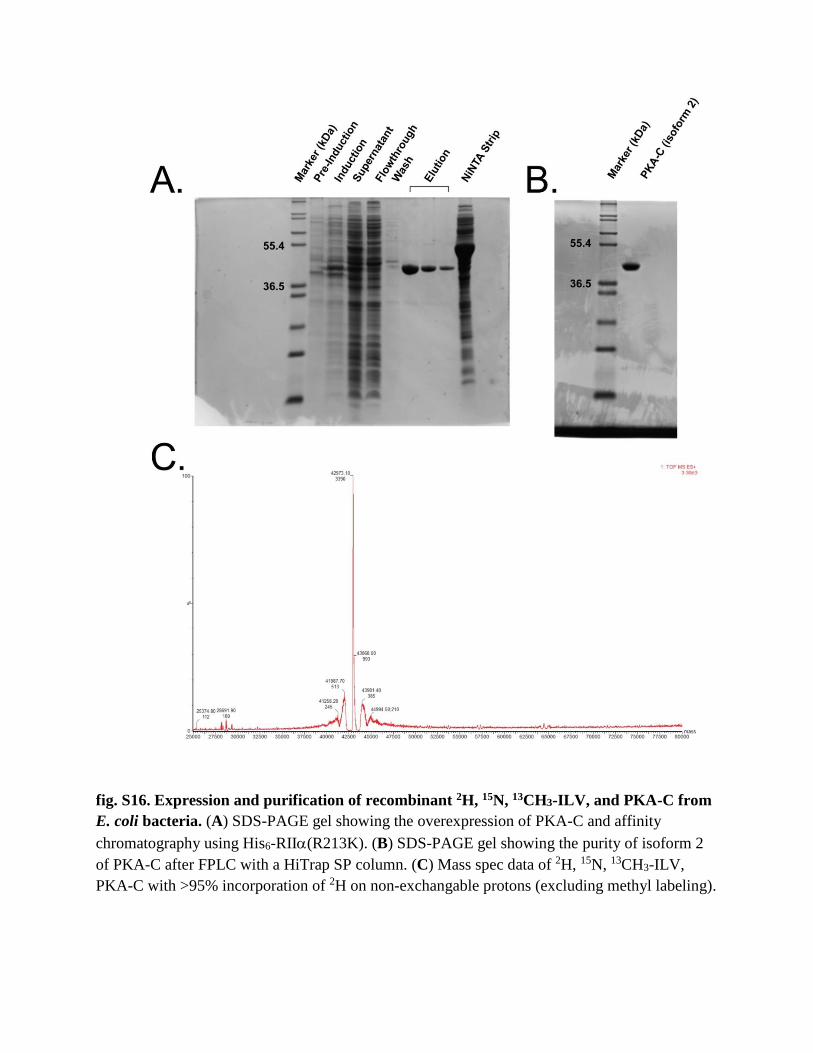
fig. S16. Expression and purification of recombinant 2H, 15N, 13CH3-ILV, and PKA-C from
E. coli bacteria. (A) SDS-PAGE gel showing the overexpression of PKA-C and affinity
chromatography using His6-RII(R213K). (B) SDS-PAGE gel showing the purity of isoform 2
of PKA-C after FPLC with a HiTrap SP column. (C) Mass spec data of 2H, 15N, 13CH3-ILV,
PKA-C with >95% incorporation of 2H on non-exchangable protons (excluding methyl labeling).
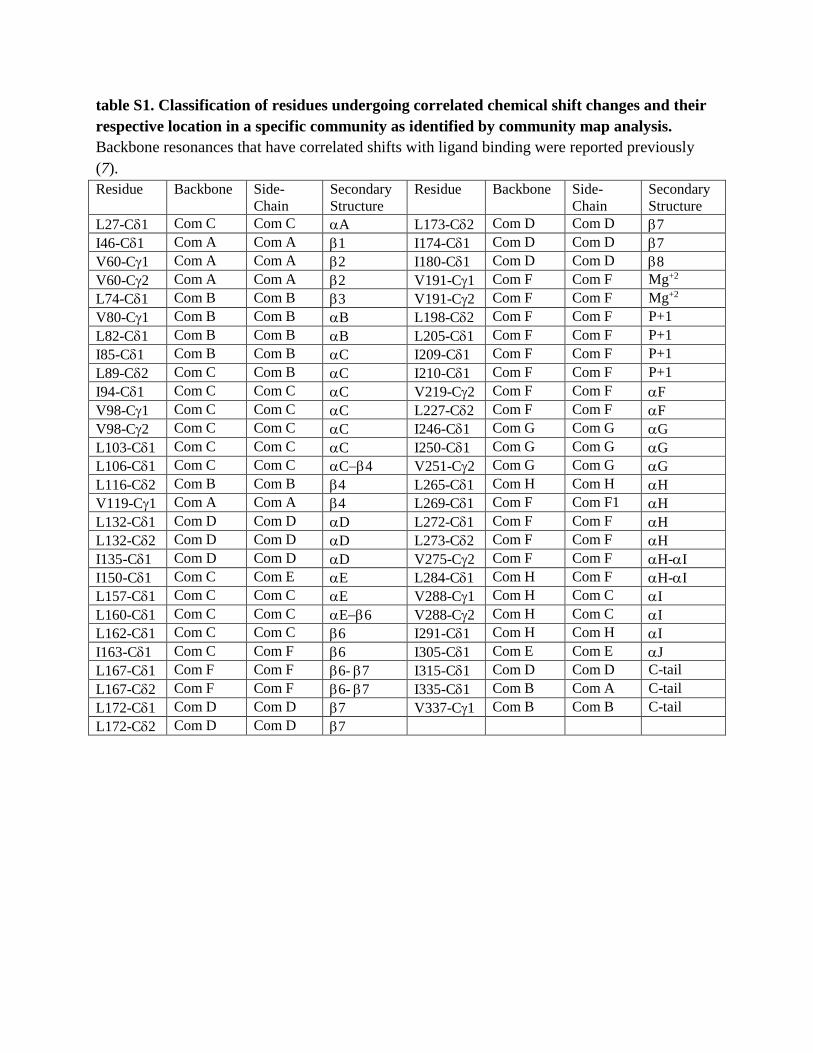
table S1. Classification of residues undergoing correlated chemical shift changes and their
respective location in a specific community as identified by community map analysis.
Backbone resonances that have correlated shifts with ligand binding were reported previously
(7).
Residue Backbone Side-
Chain
Secondary
Structure
Residue Backbone Side-
Chain
Secondary
Structure
L27-C1 Com C Com C A L173-C2 Com D Com D 7
I46-C1 Com A Com A 1 I174-C1 Com D Com D 7
V60-C1 Com A Com A 2 I180-C1 Com D Com D 8
V60-C2 Com A Com A 2 V191-C1 Com F Com F Mg+2
L74-C1 Com B Com B 3 V191-C2 Com F Com F Mg+2
V80-C1 Com B Com B B L198-C2 Com F Com F P+1
L82-C1 Com B Com B B L205-C1 Com F Com F P+1
I85-C1 Com B Com B C I209-C1 Com F Com F P+1
L89-C2 Com C Com B C I210-C1 Com F Com F P+1
I94-C1 Com C Com C C V219-C2 Com F Com F F
V98-C1 Com C Com C C L227-C2 Com F Com F F
V98-C2 Com C Com C C I246-C1 Com G Com G G
L103-C1 Com C Com C C I250-C1 Com G Com G G
L106-C1 Com C Com C C4 V251-C2 Com G Com G G
L116-C2 Com B Com B 4 L265-C1 Com H Com H H
V119-C1 Com A Com A 4 L269-C1 Com F Com F1 H
L132-C1 Com D Com D D L272-C1 Com F Com F H
L132-C2 Com D Com D D L273-C2 Com F Com F H
I135-C1 Com D Com D D V275-C2 Com F Com F H-I
I150-C1 Com C Com E E L284-C1 Com H Com F H-I
L157-C1 Com C Com C E V288-C1 Com H Com C I
L160-C1 Com C Com C E6 V288-C2 Com H Com C I
L162-C1 Com C Com C 6 I291-C1 Com H Com H I
I163-C1 Com C Com F 6 I305-C1 Com E Com E J
L167-C1 Com F Com F 6-7 I315-C1 Com D Com D C-tail
L167-C2 Com F Com F 6-7 I335-C1 Com B Com A C-tail
L172-C1 Com D Com D 7 V337-C1 Com B Com B C-tail
L172-C2 Com D Com D 7
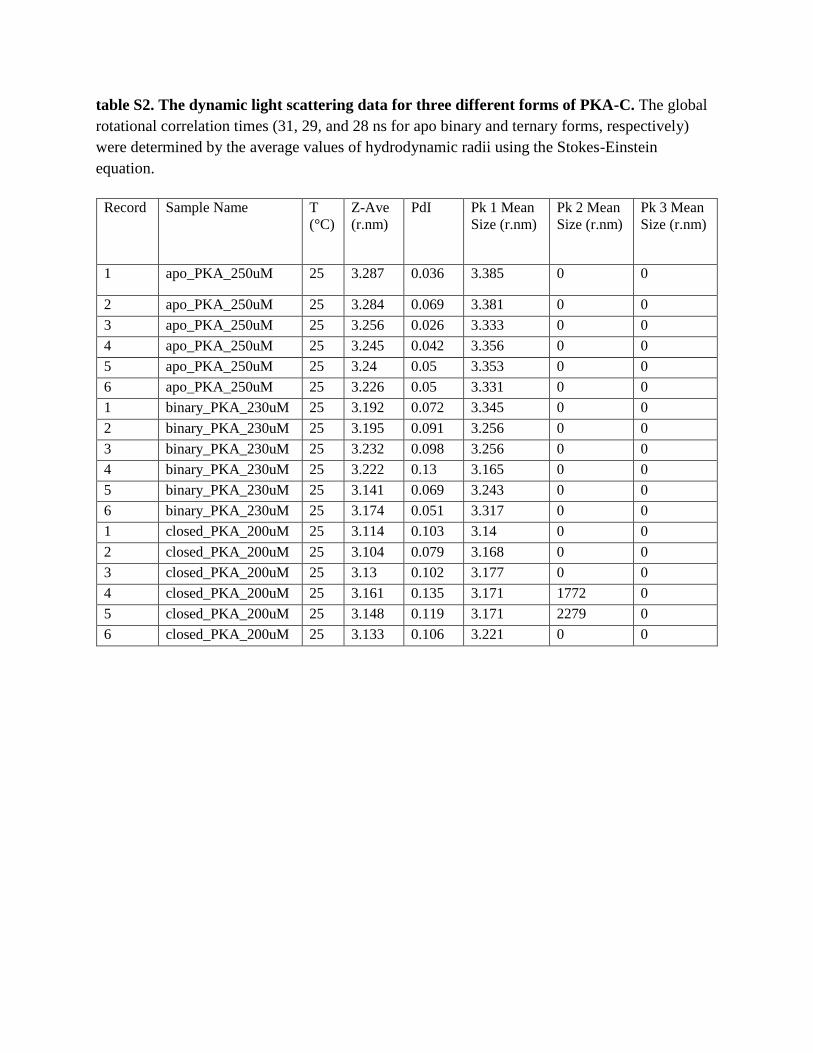
table S2. The dynamic light scattering data for three different forms of PKA-C. The global
rotational correlation times (31, 29, and 28 ns for apo binary and ternary forms, respectively)
were determined by the average values of hydrodynamic radii using the Stokes-Einstein
equation.
Record Sample Name T
(°C)
Z-Ave
(r.nm)
PdI Pk 1 Mean
Size (r.nm)
Pk 2 Mean
Size (r.nm)
Pk 3 Mean
Size (r.nm)
1 apo_PKA_250uM 25 3.287 0.036 3.385 0 0
2 apo_PKA_250uM 25 3.284 0.069 3.381 0 0
3 apo_PKA_250uM 25 3.256 0.026 3.333 0 0
4 apo_PKA_250uM 25 3.245 0.042 3.356 0 0
5 apo_PKA_250uM 25 3.24 0.05 3.353 0 0
6 apo_PKA_250uM 25 3.226 0.05 3.331 0 0
1 binary_PKA_230uM 25 3.192 0.072 3.345 0 0
2 binary_PKA_230uM 25 3.195 0.091 3.256 0 0
3 binary_PKA_230uM 25 3.232 0.098 3.256 0 0
4 binary_PKA_230uM 25 3.222 0.13 3.165 0 0
5 binary_PKA_230uM 25 3.141 0.069 3.243 0 0
6 binary_PKA_230uM 25 3.174 0.051 3.317 0 0
1 closed_PKA_200uM 25 3.114 0.103 3.14 0 0
2 closed_PKA_200uM 25 3.104 0.079 3.168 0 0
3 closed_PKA_200uM 25 3.13 0.102 3.177 0 0
4 closed_PKA_200uM 25 3.161 0.135 3.171 1772 0
5 closed_PKA_200uM 25 3.148 0.119 3.171 2279 0
6 closed_PKA_200uM 25 3.133 0.106 3.221 0 0
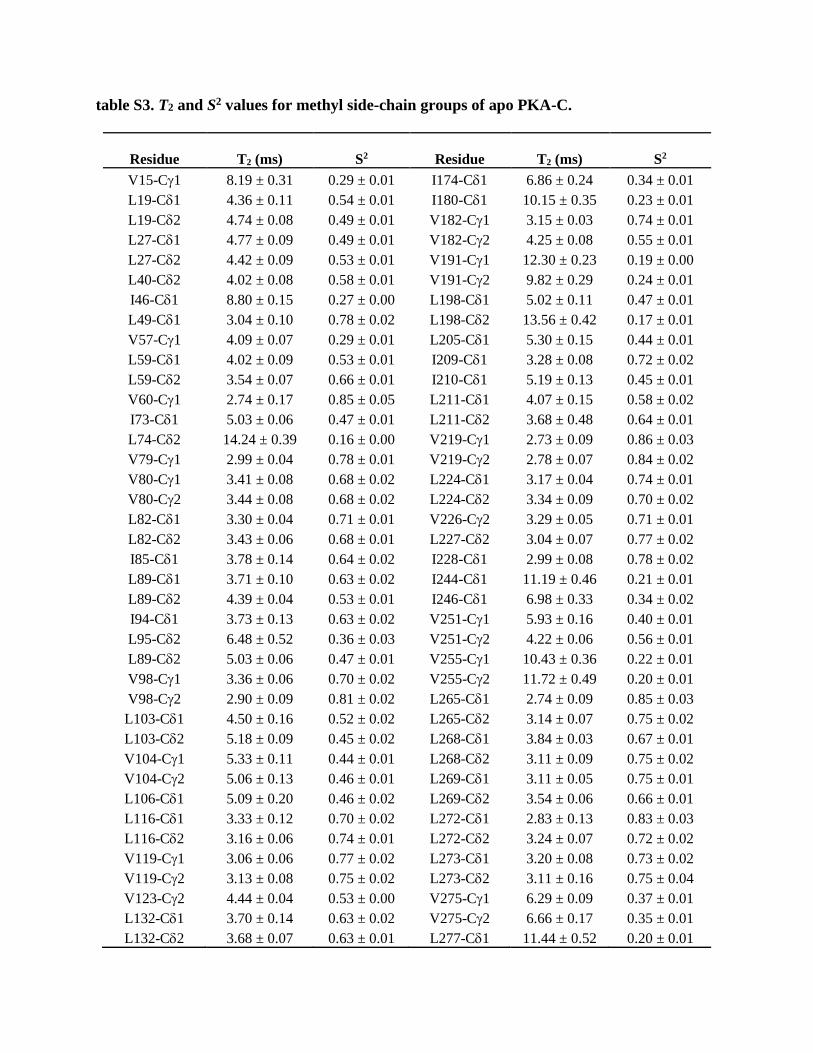
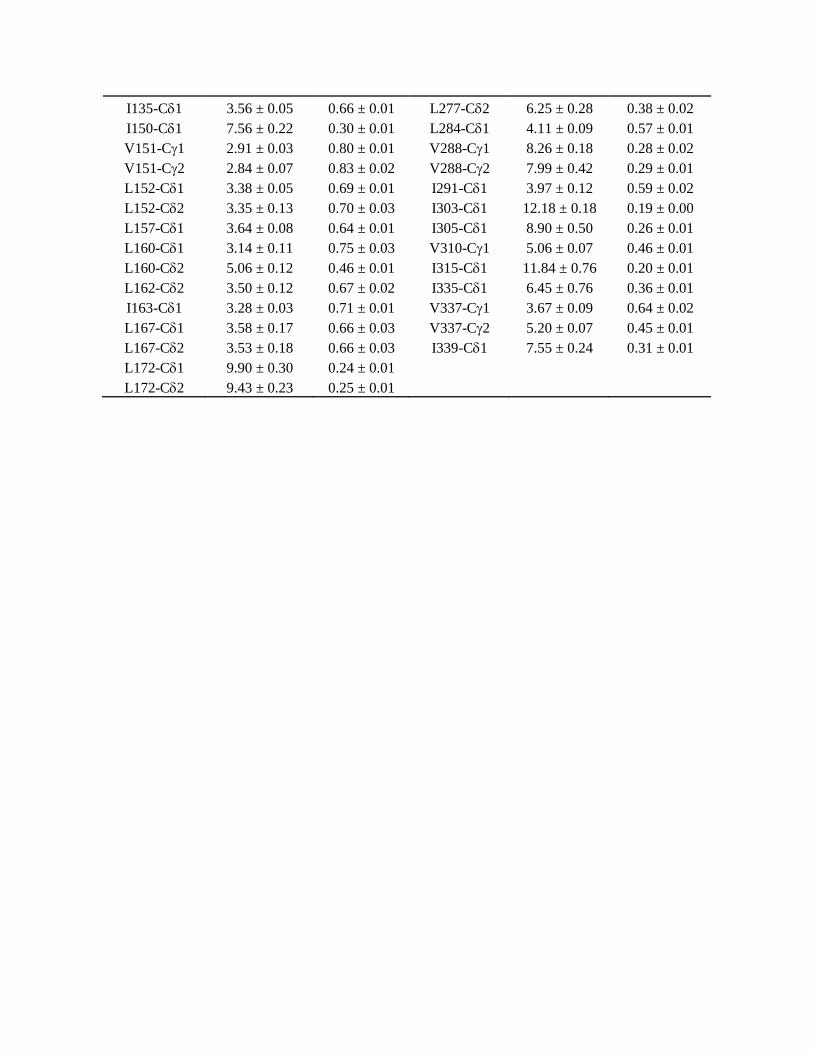
table S3. T2 and S2 values for methyl side-chain groups of apo PKA-C.
Residue
T2 (ms)
S2
Residue
T2 (ms)
S2
V15-C1 8.19 ± 0.31 0.29 ± 0.01 I174-C1 6.86 ± 0.24 0.34 ± 0.01
L19-C1 4.36 ± 0.11 0.54 ± 0.01 I180-C1 10.15 ± 0.35 0.23 ± 0.01
L19-C2 4.74 ± 0.08 0.49 ± 0.01 V182-C1 3.15 ± 0.03 0.74 ± 0.01
L27-C1 4.77 ± 0.09 0.49 ± 0.01 V182-C2 4.25 ± 0.08 0.55 ± 0.01
L27-C2 4.42 ± 0.09 0.53 ± 0.01 V191-C1 12.30 ± 0.23 0.19 ± 0.00
L40-C2 4.02 ± 0.08 0.58 ± 0.01 V191-C2 9.82 ± 0.29 0.24 ± 0.01
I46-C1 8.80 ± 0.15 0.27 ± 0.00 L198-C1 5.02 ± 0.11 0.47 ± 0.01
L49-C1 3.04 ± 0.10 0.78 ± 0.02 L198-C2 13.56 ± 0.42 0.17 ± 0.01
V57-C1 4.09 ± 0.07 0.29 ± 0.01 L205-C1 5.30 ± 0.15 0.44 ± 0.01
L59-C1 4.02 ± 0.09 0.53 ± 0.01 I209-C1 3.28 ± 0.08 0.72 ± 0.02
L59-C2 3.54 ± 0.07 0.66 ± 0.01 I210-C1 5.19 ± 0.13 0.45 ± 0.01
V60-C1 2.74 ± 0.17 0.85 ± 0.05 L211-C1 4.07 ± 0.15 0.58 ± 0.02
I73-C1 5.03 ± 0.06 0.47 ± 0.01 L211-C2 3.68 ± 0.48 0.64 ± 0.01
L74-C2 14.24 ± 0.39 0.16 ± 0.00 V219-C1 2.73 ± 0.09 0.86 ± 0.03
V79-C1 2.99 ± 0.04 0.78 ± 0.01 V219-C2 2.78 ± 0.07 0.84 ± 0.02
V80-C1 3.41 ± 0.08 0.68 ± 0.02 L224-C1 3.17 ± 0.04 0.74 ± 0.01
V80-C2 3.44 ± 0.08 0.68 ± 0.02 L224-C2 3.34 ± 0.09 0.70 ± 0.02
L82-C1 3.30 ± 0.04 0.71 ± 0.01 V226-C2 3.29 ± 0.05 0.71 ± 0.01
L82-C2 3.43 ± 0.06 0.68 ± 0.01 L227-C2 3.04 ± 0.07 0.77 ± 0.02
I85-C1 3.78 ± 0.14 0.64 ± 0.02 I228-C1 2.99 ± 0.08 0.78 ± 0.02
L89-C1 3.71 ± 0.10 0.63 ± 0.02 I244-C1 11.19 ± 0.46 0.21 ± 0.01
L89-C2 4.39 ± 0.04 0.53 ± 0.01 I246-C1 6.98 ± 0.33 0.34 ± 0.02
I94-C1 3.73 ± 0.13 0.63 ± 0.02 V251-C1 5.93 ± 0.16 0.40 ± 0.01
L95-C2 6.48 ± 0.52 0.36 ± 0.03 V251-C2 4.22 ± 0.06 0.56 ± 0.01
L89-C2 5.03 ± 0.06 0.47 ± 0.01 V255-C1 10.43 ± 0.36 0.22 ± 0.01
V98-C1 3.36 ± 0.06 0.70 ± 0.02 V255-C2 11.72 ± 0.49 0.20 ± 0.01
V98-C2 2.90 ± 0.09 0.81 ± 0.02 L265-C1 2.74 ± 0.09 0.85 ± 0.03
L103-C1 4.50 ± 0.16 0.52 ± 0.02 L265-C2 3.14 ± 0.07 0.75 ± 0.02
L103-C2 5.18 ± 0.09 0.45 ± 0.02 L268-C1 3.84 ± 0.03 0.67 ± 0.01
V104-C1 5.33 ± 0.11 0.44 ± 0.01 L268-C2 3.11 ± 0.09 0.75 ± 0.02
V104-C2 5.06 ± 0.13 0.46 ± 0.01 L269-C1 3.11 ± 0.05 0.75 ± 0.01
L106-C1 5.09 ± 0.20 0.46 ± 0.02 L269-C2 3.54 ± 0.06 0.66 ± 0.01
L116-C1 3.33 ± 0.12 0.70 ± 0.02 L272-C1 2.83 ± 0.13 0.83 ± 0.03
L116-C2 3.16 ± 0.06 0.74 ± 0.01 L272-C2 3.24 ± 0.07 0.72 ± 0.02
V119-C1 3.06 ± 0.06 0.77 ± 0.02 L273-C1 3.20 ± 0.08 0.73 ± 0.02
V119-C2 3.13 ± 0.08 0.75 ± 0.02 L273-C2 3.11 ± 0.16 0.75 ± 0.04
V123-C2 4.44 ± 0.04 0.53 ± 0.00 V275-C1 6.29 ± 0.09 0.37 ± 0.01
L132-C1 3.70 ± 0.14 0.63 ± 0.02 V275-C2 6.66 ± 0.17 0.35 ± 0.01
L132-C2 3.68 ± 0.07 0.63 ± 0.01 L277-C1 11.44 ± 0.52 0.20 ± 0.01
I135-C1 3.56 ± 0.05 0.66 ± 0.01 L277-C2 6.25 ± 0.28 0.38 ± 0.02
I150-C1 7.56 ± 0.22 0.30 ± 0.01 L284-C1 4.11 ± 0.09 0.57 ± 0.01
V151-C1 2.91 ± 0.03 0.80 ± 0.01 V288-C1 8.26 ± 0.18 0.28 ± 0.02
V151-C2 2.84 ± 0.07 0.83 ± 0.02 V288-C2 7.99 ± 0.42 0.29 ± 0.01
L152-C1 3.38 ± 0.05 0.69 ± 0.01 I291-C1 3.97 ± 0.12 0.59 ± 0.02
L152-C2 3.35 ± 0.13 0.70 ± 0.03 I303-C1 12.18 ± 0.18 0.19 ± 0.00
L157-C1 3.64 ± 0.08 0.64 ± 0.01 I305-C1 8.90 ± 0.50 0.26 ± 0.01
L160-C1 3.14 ± 0.11 0.75 ± 0.03 V310-C1 5.06 ± 0.07 0.46 ± 0.01
L160-C2 5.06 ± 0.12 0.46 ± 0.01 I315-C1 11.84 ± 0.76 0.20 ± 0.01
L162-C2 3.50 ± 0.12 0.67 ± 0.02 I335-C1 6.45 ± 0.76 0.36 ± 0.01
I163-C1 3.28 ± 0.03 0.71 ± 0.01 V337-C1 3.67 ± 0.09 0.64 ± 0.02
L167-C1 3.58 ± 0.17 0.66 ± 0.03 V337-C2 5.20 ± 0.07 0.45 ± 0.01
L167-C2 3.53 ± 0.18 0.66 ± 0.03 I339-C1 7.55 ± 0.24 0.31 ± 0.01
L172-C1 9.90 ± 0.30 0.24 ± 0.01
L172-C2 9.43 ± 0.23 0.25 ± 0.01
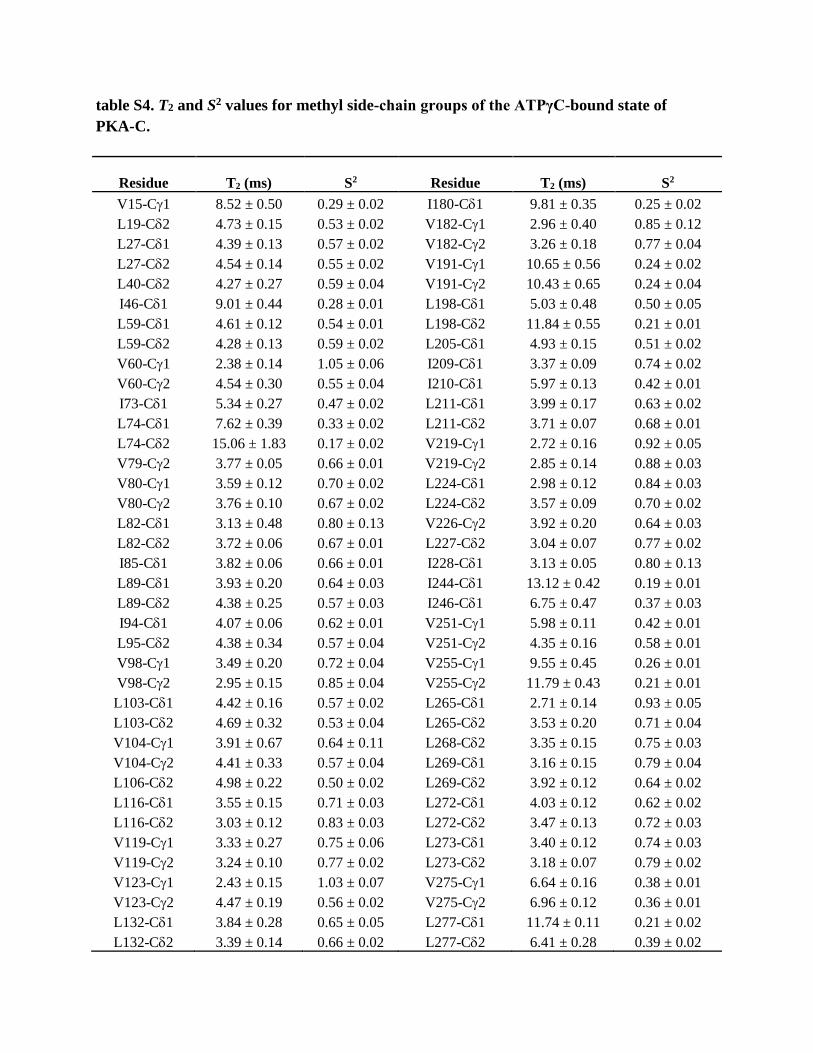
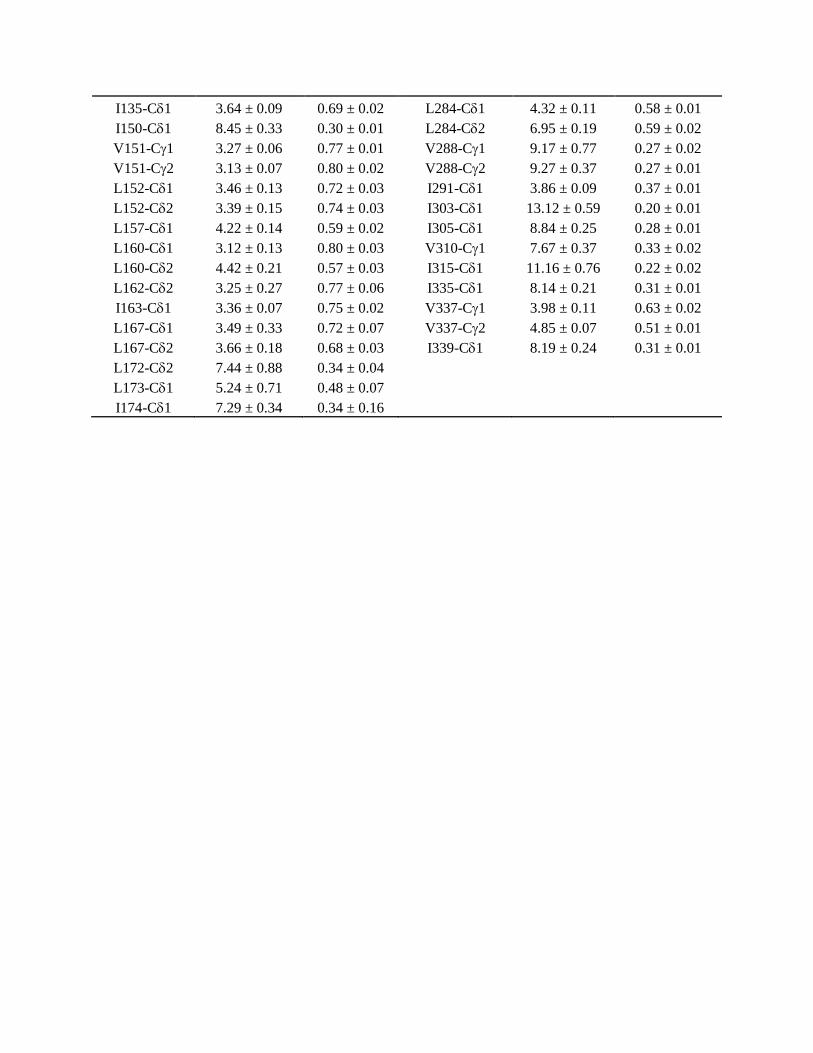
table S4. T2 and S2 values for methyl side-chain groups of the ATPγC-bound state of
PKA-C.
Residue
T2 (ms)
S2
Residue
T2 (ms)
S2
V15-C1 8.52 ± 0.50 0.29 ± 0.02 I180-C1 9.81 ± 0.35 0.25 ± 0.02
L19-C2 4.73 ± 0.15 0.53 ± 0.02 V182-C1 2.96 ± 0.40 0.85 ± 0.12
L27-C1 4.39 ± 0.13 0.57 ± 0.02 V182-C2 3.26 ± 0.18 0.77 ± 0.04
L27-C2 4.54 ± 0.14 0.55 ± 0.02 V191-C1 10.65 ± 0.56 0.24 ± 0.02
L40-C2 4.27 ± 0.27 0.59 ± 0.04 V191-C2 10.43 ± 0.65 0.24 ± 0.04
I46-C1 9.01 ± 0.44 0.28 ± 0.01 L198-C1 5.03 ± 0.48 0.50 ± 0.05
L59-C1 4.61 ± 0.12 0.54 ± 0.01 L198-C2 11.84 ± 0.55 0.21 ± 0.01
L59-C2 4.28 ± 0.13 0.59 ± 0.02 L205-C1 4.93 ± 0.15 0.51 ± 0.02
V60-C1 2.38 ± 0.14 1.05 ± 0.06 I209-C1 3.37 ± 0.09 0.74 ± 0.02
V60-C2 4.54 ± 0.30 0.55 ± 0.04 I210-C1 5.97 ± 0.13 0.42 ± 0.01
I73-C1 5.34 ± 0.27 0.47 ± 0.02 L211-C1 3.99 ± 0.17 0.63 ± 0.02
L74-C1 7.62 ± 0.39 0.33 ± 0.02 L211-C2 3.71 ± 0.07 0.68 ± 0.01
L74-C2 15.06 ± 1.83 0.17 ± 0.02 V219-C1 2.72 ± 0.16 0.92 ± 0.05
V79-C2 3.77 ± 0.05 0.66 ± 0.01 V219-C2 2.85 ± 0.14 0.88 ± 0.03
V80-C1 3.59 ± 0.12 0.70 ± 0.02 L224-C1 2.98 ± 0.12 0.84 ± 0.03
V80-C2 3.76 ± 0.10 0.67 ± 0.02 L224-C2 3.57 ± 0.09 0.70 ± 0.02
L82-C1 3.13 ± 0.48 0.80 ± 0.13 V226-C2 3.92 ± 0.20 0.64 ± 0.03
L82-C2 3.72 ± 0.06 0.67 ± 0.01 L227-C2 3.04 ± 0.07 0.77 ± 0.02
I85-C1 3.82 ± 0.06 0.66 ± 0.01 I228-C1 3.13 ± 0.05 0.80 ± 0.13
L89-C1 3.93 ± 0.20 0.64 ± 0.03 I244-C1 13.12 ± 0.42 0.19 ± 0.01
L89-C2 4.38 ± 0.25 0.57 ± 0.03 I246-C1 6.75 ± 0.47 0.37 ± 0.03
I94-C1 4.07 ± 0.06 0.62 ± 0.01 V251-C1 5.98 ± 0.11 0.42 ± 0.01
L95-C2 4.38 ± 0.34 0.57 ± 0.04 V251-C2 4.35 ± 0.16 0.58 ± 0.01
V98-C1 3.49 ± 0.20 0.72 ± 0.04 V255-C1 9.55 ± 0.45 0.26 ± 0.01
V98-C2 2.95 ± 0.15 0.85 ± 0.04 V255-C2 11.79 ± 0.43 0.21 ± 0.01
L103-C1 4.42 ± 0.16 0.57 ± 0.02 L265-C1 2.71 ± 0.14 0.93 ± 0.05
L103-C2 4.69 ± 0.32 0.53 ± 0.04 L265-C2 3.53 ± 0.20 0.71 ± 0.04
V104-C1 3.91 ± 0.67 0.64 ± 0.11 L268-C2 3.35 ± 0.15 0.75 ± 0.03
V104-C2 4.41 ± 0.33 0.57 ± 0.04 L269-C1 3.16 ± 0.15 0.79 ± 0.04
L106-C2 4.98 ± 0.22 0.50 ± 0.02 L269-C2 3.92 ± 0.12 0.64 ± 0.02
L116-C1 3.55 ± 0.15 0.71 ± 0.03 L272-C1 4.03 ± 0.12 0.62 ± 0.02
L116-C2 3.03 ± 0.12 0.83 ± 0.03 L272-C2 3.47 ± 0.13 0.72 ± 0.03
V119-C1 3.33 ± 0.27 0.75 ± 0.06 L273-C1 3.40 ± 0.12 0.74 ± 0.03
V119-C2 3.24 ± 0.10 0.77 ± 0.02 L273-C2 3.18 ± 0.07 0.79 ± 0.02
V123-C1 2.43 ± 0.15 1.03 ± 0.07 V275-C1 6.64 ± 0.16 0.38 ± 0.01
V123-C2 4.47 ± 0.19 0.56 ± 0.02 V275-C2 6.96 ± 0.12 0.36 ± 0.01
L132-C1 3.84 ± 0.28 0.65 ± 0.05 L277-C1 11.74 ± 0.11 0.21 ± 0.02
L132-C2 3.39 ± 0.14 0.66 ± 0.02 L277-C2 6.41 ± 0.28 0.39 ± 0.02
I135-C1 3.64 ± 0.09 0.69 ± 0.02 L284-C1 4.32 ± 0.11 0.58 ± 0.01
I150-C1 8.45 ± 0.33 0.30 ± 0.01 L284-C2 6.95 ± 0.19 0.59 ± 0.02
V151-C1 3.27 ± 0.06 0.77 ± 0.01 V288-C1 9.17 ± 0.77 0.27 ± 0.02
V151-C2 3.13 ± 0.07 0.80 ± 0.02 V288-C2 9.27 ± 0.37 0.27 ± 0.01
L152-C1 3.46 ± 0.13 0.72 ± 0.03 I291-C1 3.86 ± 0.09 0.37 ± 0.01
L152-C2 3.39 ± 0.15 0.74 ± 0.03 I303-C1 13.12 ± 0.59 0.20 ± 0.01
L157-C1 4.22 ± 0.14 0.59 ± 0.02 I305-C1 8.84 ± 0.25 0.28 ± 0.01
L160-C1 3.12 ± 0.13 0.80 ± 0.03 V310-C1 7.67 ± 0.37 0.33 ± 0.02
L160-C2 4.42 ± 0.21 0.57 ± 0.03 I315-C1 11.16 ± 0.76 0.22 ± 0.02
L162-C2 3.25 ± 0.27 0.77 ± 0.06 I335-C1 8.14 ± 0.21 0.31 ± 0.01
I163-C1 3.36 ± 0.07 0.75 ± 0.02 V337-C1 3.98 ± 0.11 0.63 ± 0.02
L167-C1 3.49 ± 0.33 0.72 ± 0.07 V337-C2 4.85 ± 0.07 0.51 ± 0.01
L167-C2 3.66 ± 0.18 0.68 ± 0.03 I339-C1 8.19 ± 0.24 0.31 ± 0.01
L172-C2 7.44 ± 0.88 0.34 ± 0.04
L173-C1 5.24 ± 0.71 0.48 ± 0.07
I174-C1 7.29 ± 0.34 0.34 ± 0.16
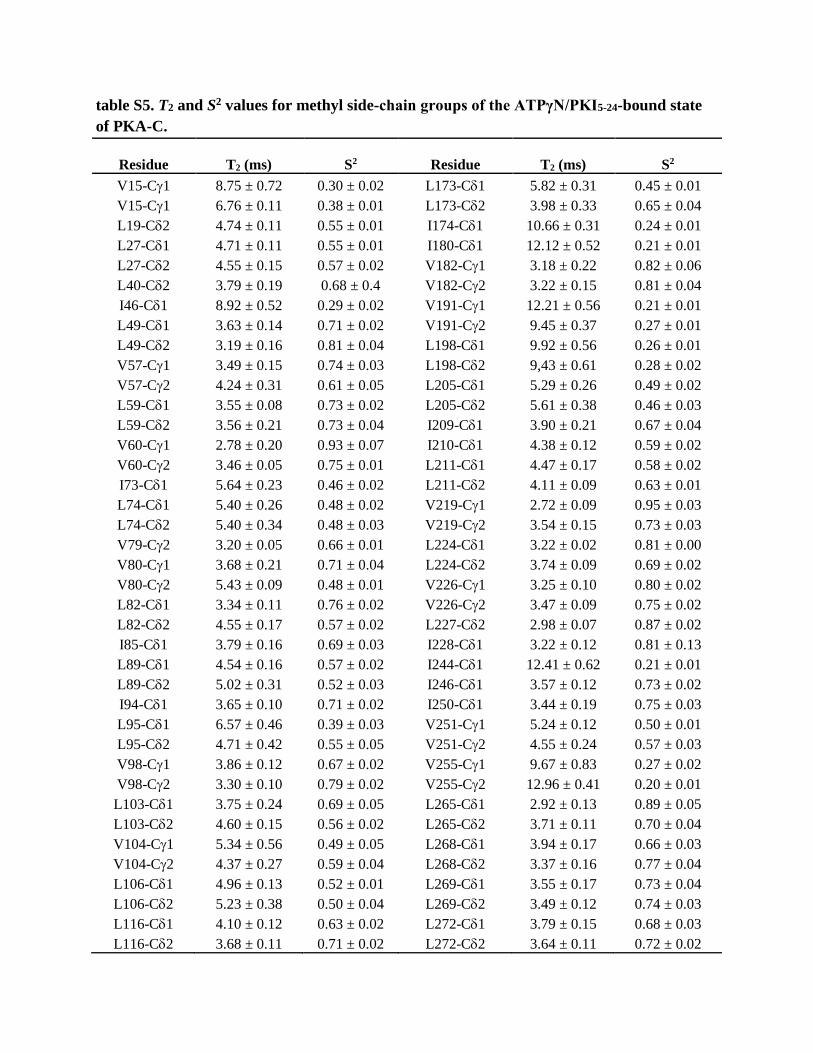
table S5. T2 and S2 values for methyl side-chain groups of the ATPγN/PKI5-24-bound state
of PKA-C.
Residue
T2 (ms)
S2
Residue
T2 (ms)
S2
V15-C1 8.75 ± 0.72 0.30 ± 0.02 L173-C1 5.82 ± 0.31 0.45 ± 0.01
V15-C1 6.76 ± 0.11 0.38 ± 0.01 L173-C2 3.98 ± 0.33 0.65 ± 0.04
L19-C2 4.74 ± 0.11 0.55 ± 0.01 I174-C1 10.66 ± 0.31 0.24 ± 0.01
L27-C1 4.71 ± 0.11 0.55 ± 0.01 I180-C1 12.12 ± 0.52 0.21 ± 0.01
L27-C2 4.55 ± 0.15 0.57 ± 0.02 V182-C1 3.18 ± 0.22 0.82 ± 0.06
L40-C2 3.79 ± 0.19 0.68 ± 0.4 V182-C2 3.22 ± 0.15 0.81 ± 0.04
I46-C1 8.92 ± 0.52 0.29 ± 0.02 V191-C1 12.21 ± 0.56 0.21 ± 0.01
L49-C1 3.63 ± 0.14 0.71 ± 0.02 V191-C2 9.45 ± 0.37 0.27 ± 0.01
L49-C2 3.19 ± 0.16 0.81 ± 0.04 L198-C1 9.92 ± 0.56 0.26 ± 0.01
V57-C1 3.49 ± 0.15 0.74 ± 0.03 L198-C2 9,43 ± 0.61 0.28 ± 0.02
V57-C2 4.24 ± 0.31 0.61 ± 0.05 L205-C1 5.29 ± 0.26 0.49 ± 0.02
L59-C1 3.55 ± 0.08 0.73 ± 0.02 L205-C2 5.61 ± 0.38 0.46 ± 0.03
L59-C2 3.56 ± 0.21 0.73 ± 0.04 I209-C1 3.90 ± 0.21 0.67 ± 0.04
V60-C1 2.78 ± 0.20 0.93 ± 0.07 I210-C1 4.38 ± 0.12 0.59 ± 0.02
V60-C2 3.46 ± 0.05 0.75 ± 0.01 L211-C1 4.47 ± 0.17 0.58 ± 0.02
I73-C1 5.64 ± 0.23 0.46 ± 0.02 L211-C2 4.11 ± 0.09 0.63 ± 0.01
L74-C1 5.40 ± 0.26 0.48 ± 0.02 V219-C1 2.72 ± 0.09 0.95 ± 0.03
L74-C2 5.40 ± 0.34 0.48 ± 0.03 V219-C2 3.54 ± 0.15 0.73 ± 0.03
V79-C2 3.20 ± 0.05 0.66 ± 0.01 L224-C1 3.22 ± 0.02 0.81 ± 0.00
V80-C1 3.68 ± 0.21 0.71 ± 0.04 L224-C2 3.74 ± 0.09 0.69 ± 0.02
V80-C2 5.43 ± 0.09 0.48 ± 0.01 V226-C1 3.25 ± 0.10 0.80 ± 0.02
L82-C1 3.34 ± 0.11 0.76 ± 0.02 V226-C2 3.47 ± 0.09 0.75 ± 0.02
L82-C2 4.55 ± 0.17 0.57 ± 0.02 L227-C2 2.98 ± 0.07 0.87 ± 0.02
I85-C1 3.79 ± 0.16 0.69 ± 0.03 I228-C1 3.22 ± 0.12 0.81 ± 0.13
L89-C1 4.54 ± 0.16 0.57 ± 0.02 I244-C1 12.41 ± 0.62 0.21 ± 0.01
L89-C2 5.02 ± 0.31 0.52 ± 0.03 I246-C1 3.57 ± 0.12 0.73 ± 0.02
I94-C1 3.65 ± 0.10 0.71 ± 0.02 I250-C1 3.44 ± 0.19 0.75 ± 0.03
L95-C1 6.57 ± 0.46 0.39 ± 0.03 V251-C1 5.24 ± 0.12 0.50 ± 0.01
L95-C2 4.71 ± 0.42 0.55 ± 0.05 V251-C2 4.55 ± 0.24 0.57 ± 0.03
V98-C1 3.86 ± 0.12 0.67 ± 0.02 V255-C1 9.67 ± 0.83 0.27 ± 0.02
V98-C2 3.30 ± 0.10 0.79 ± 0.02 V255-C2 12.96 ± 0.41 0.20 ± 0.01
L103-C1 3.75 ± 0.24 0.69 ± 0.05 L265-C1 2.92 ± 0.13 0.89 ± 0.05
L103-C2 4.60 ± 0.15 0.56 ± 0.02 L265-C2 3.71 ± 0.11 0.70 ± 0.04
V104-C1 5.34 ± 0.56 0.49 ± 0.05 L268-C1 3.94 ± 0.17 0.66 ± 0.03
V104-C2 4.37 ± 0.27 0.59 ± 0.04 L268-C2 3.37 ± 0.16 0.77 ± 0.04
L106-C1 4.96 ± 0.13 0.52 ± 0.01 L269-C1 3.55 ± 0.17 0.73 ± 0.04
L106-C2 5.23 ± 0.38 0.50 ± 0.04 L269-C2 3.49 ± 0.12 0.74 ± 0.03
L116-C1 4.10 ± 0.12 0.63 ± 0.02 L272-C1 3.79 ± 0.15 0.68 ± 0.03
L116-C2 3.68 ± 0.11 0.71 ± 0.02 L272-C2 3.64 ± 0.11 0.72 ± 0.02
V119-C1 3.58 ± 0.22 0.73 ± 0.04 L273-C1 3.43 ± 0.09 0.76 ± 0.02
V119-C2 3.37 ± 0.14 0.77 ± 0.03 L273-C2 3.48 ± 0.09 0.75 ± 0.02
V123-C1 2.79 ± 0.10 0.93 ± 0.03 V275-C1 6.45 ± 0.18 0.40 ± 0.01
V123-C2 3.45 ± 0.17 0.75 ± 0.04 V275-C2 8.79 ± 0.47 0.30 ± 0.02
L132-C1 3.47 ± 0.15 0.75 ± 0.03 L277-C1 11.06 ± 0.31 0.23 ± 0.01
L132-C2 3.67 ± 0.20 0.71 ± 0.04 L277-C2 7.72 ± 0.19 0.34 ± 0.01
I135-C1 6.18 ± 0.27 0.42 ± 0.02 L284-C1 4.35 ± 0.12 0.60 ± 0.02
I150-C1 5.95 ± 0.19 0.44 ± 0.01 L284-C2 4.01 ± 0.14 0.65 ± 0.02
V151-C1 3.19 ± 0.12 0.81 ± 0.03 V288-C1 8.77 ± 0.42 0.30 ± 0.01
V151-C2 3.35 ± 0.15 0.78 ± 0.03 V288-C2 7.44 ± 0.36 0.35 ± 0.02
L152-C1 3.55 ± 0.25 0.73 ± 0.05 I291-C1 4.71 ± 0.18 0.55 ± 0.02
L152-C2 3.67 ± 0.08 0.71 ± 0.02 I303-C1 12.68 ± 0.69 0.20 ± 0.01
L157-C1 3.06 ± 0.18 0.71 ± 0.02 I305-C1 9.09 ± 0.37 0.29 ± 0.01
L160-C1 3.60 ± 0.18 0.72 ± 0.02 V310-C1 4.30 ± 0.12 0.60 ± 0.02
L160-C2 4.38 ± 0.16 0.59 ± 0.04 I315-C1 11.60 ± 0.83 0.20 ± 0.01
L162-C1 3.72 ± 0.18 0.70 ± 0.04 I335-C1 9.21 ± 0.19 0.28 ± 0.01
L162-C2 3.32 ± 0.13 0.78 ± 0.03 V337-C1 4.11 ± 0.13 0.63 ± 0.02
I163-C1 3.57 ± 0.05 0.73 ± 0.01 V337-C2 4.81 ± 0.17 0.54 ± 0.02
L167-C1 3.56 ± 0.13 0.73 ± 0.03 I339-C1 8.37 ± 0.33 0.31 ± 0.01
L167-C2 3.16 ± 0.11 0.82 ± 0.03
L172-C1 3.62 ± 0.09 0.72 ± 0.02
L172-C2 3.16 ± 0.06 0.82 ± 0.02
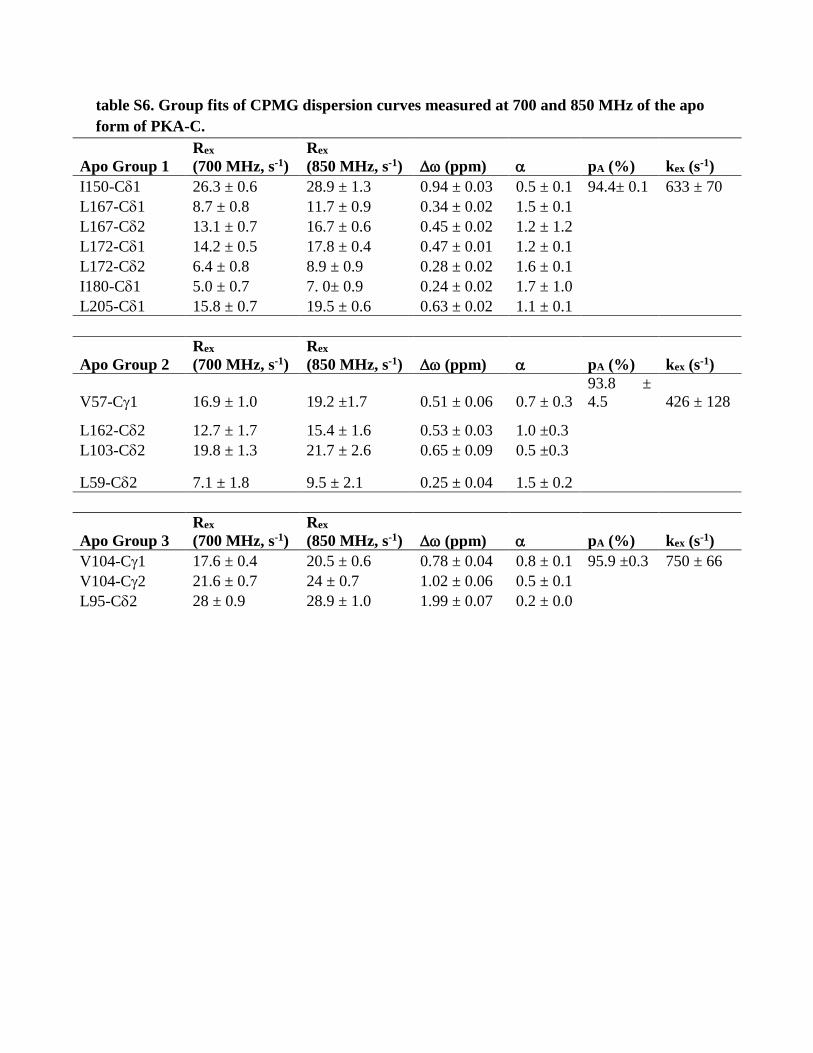
table S6. Group fits of CPMG dispersion curves measured at 700 and 850 MHz of the apo
form of PKA-C.
Apo Group 1
Rex
(700 MHz, s-1)
Rex
(850 MHz, s-1) (ppm) pA (%) kex (s-1)
I150-C1 26.3 ± 0.6 28.9 ± 1.3 0.94 ± 0.03 0.5 ± 0.1 94.4± 0.1 633 ± 70
L167-C1 8.7 ± 0.8 11.7 ± 0.9 0.34 ± 0.02 1.5 ± 0.1
L167-C2 13.1 ± 0.7 16.7 ± 0.6 0.45 ± 0.02 1.2 ± 1.2
L172-C1 14.2 ± 0.5 17.8 ± 0.4 0.47 ± 0.01 1.2 ± 0.1
L172-C2 6.4 ± 0.8 8.9 ± 0.9 0.28 ± 0.02 1.6 ± 0.1
I180-C1 5.0 ± 0.7 7. 0± 0.9 0.24 ± 0.02 1.7 ± 1.0
L205-C1 15.8 ± 0.7 19.5 ± 0.6 0.63 ± 0.02 1.1 ± 0.1
Apo Group 2
Rex
(700 MHz, s-1)
Rex
(850 MHz, s-1) (ppm) pA (%) kex (s-1)
V57-C1 16.9 ± 1.0 19.2 ±1.7 0.51 ± 0.06 0.7 ± 0.3
93.8 ±
4.5 426 ± 128
L162-C2 12.7 ± 1.7 15.4 ± 1.6 0.53 ± 0.03 1.0 ±0.3
L103-C2 19.8 ± 1.3 21.7 ± 2.6 0.65 ± 0.09 0.5 ±0.3
L59-C2 7.1 ± 1.8 9.5 ± 2.1 0.25 ± 0.04 1.5 ± 0.2
Apo Group 3
Rex
(700 MHz, s-1)
Rex
(850 MHz, s-1) (ppm) pA (%) kex (s-1)
V104-C1 17.6 ± 0.4 20.5 ± 0.6 0.78 ± 0.04 0.8 ± 0.1 95.9 ±0.3 750 ± 66
V104-C2 21.6 ± 0.7 24 ± 0.7 1.02 ± 0.06 0.5 ± 0.1
L95-C2 28 ± 0.9 28.9 ± 1.0 1.99 ± 0.07 0.2 ± 0.0
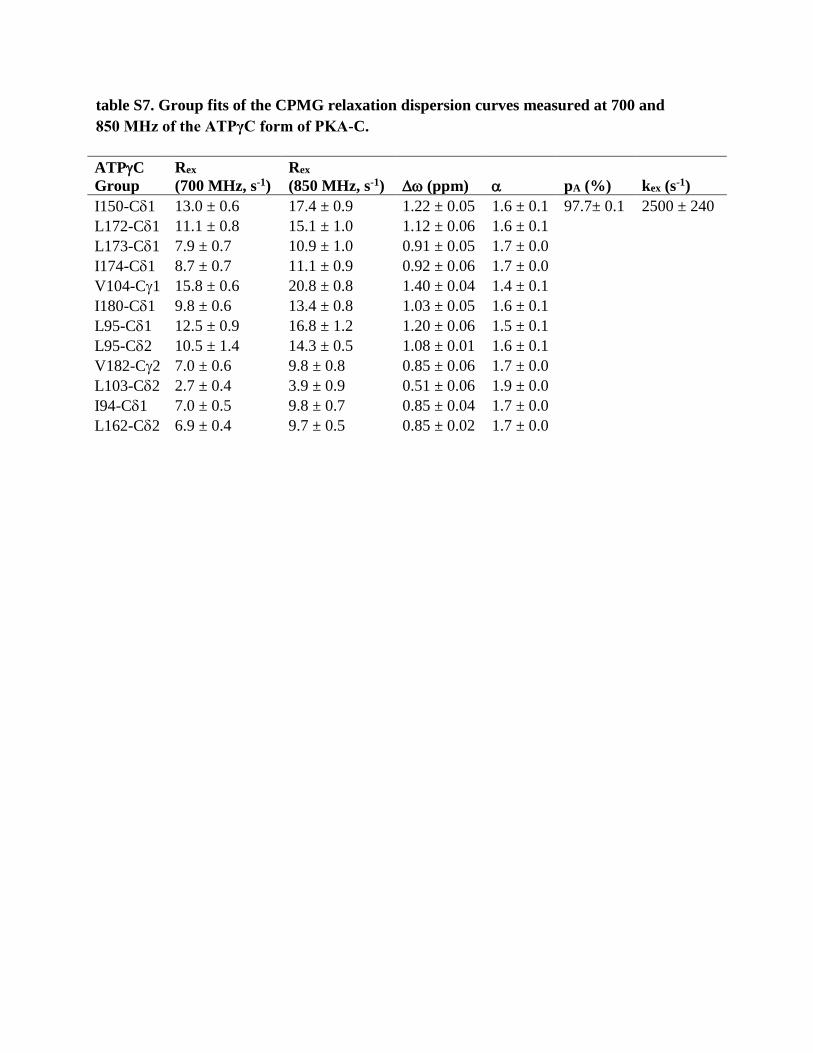
table S7. Group fits of the CPMG relaxation dispersion curves measured at 700 and
850 MHz of the ATPγC form of PKA-C.
ATPC
Group
Rex
(700 MHz, s-1)
Rex
(850 MHz, s-1) (ppm) pA (%) kex (s-1)
I150-C1 13.0 ± 0.6 17.4 ± 0.9 1.22 ± 0.05 1.6 ± 0.1 97.7± 0.1 2500 ± 240
L172-C1 11.1 ± 0.8 15.1 ± 1.0 1.12 ± 0.06 1.6 ± 0.1
L173-C1 7.9 ± 0.7 10.9 ± 1.0 0.91 ± 0.05 1.7 ± 0.0
I174-C1 8.7 ± 0.7 11.1 ± 0.9 0.92 ± 0.06 1.7 ± 0.0
V104-C1 15.8 ± 0.6 20.8 ± 0.8 1.40 ± 0.04 1.4 ± 0.1
I180-C1 9.8 ± 0.6 13.4 ± 0.8 1.03 ± 0.05 1.6 ± 0.1
L95-C1 12.5 ± 0.9 16.8 ± 1.2 1.20 ± 0.06 1.5 ± 0.1
L95-C2 10.5 ± 1.4 14.3 ± 0.5 1.08 ± 0.01 1.6 ± 0.1
V182-C2 7.0 ± 0.6 9.8 ± 0.8 0.85 ± 0.06 1.7 ± 0.0
L103-C2 2.7 ± 0.4 3.9 ± 0.9 0.51 ± 0.06 1.9 ± 0.0
I94-C1 7.0 ± 0.5 9.8 ± 0.7 0.85 ± 0.04 1.7 ± 0.0
L162-C2 6.9 ± 0.4 9.7 ± 0.5 0.85 ± 0.02 1.7 ± 0.0
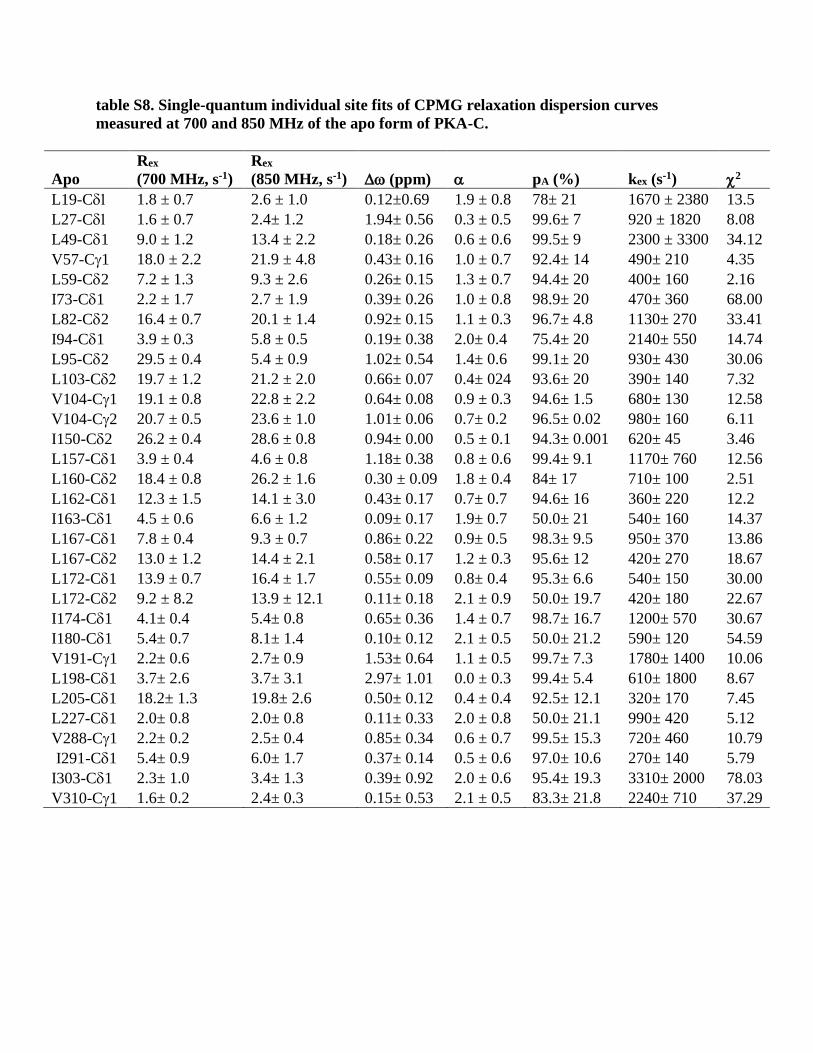
table S8. Single-quantum individual site fits of CPMG relaxation dispersion curves
measured at 700 and 850 MHz of the apo form of PKA-C.
Apo
Rex
(700 MHz, s-1)
Rex
(850 MHz, s-1) (ppm) pA (%) kex (s-1) 2
L19-C 1.8 ± 0.7 2.6 ± 1.0 0.12±0.69 1.9 ± 0.8 78± 21 1670 ± 2380 13.5
L27-C 1.6 ± 0.7 2.4± 1.2 1.94± 0.56 0.3 ± 0.5 99.6± 7 920 ± 1820 8.08
L49-C1 9.0 ± 1.2 13.4 ± 2.2 0.18± 0.26 0.6 ± 0.6 99.5± 9 2300 ± 3300 34.12
V57-C1 18.0 ± 2.2 21.9 ± 4.8 0.43± 0.16 1.0 ± 0.7 92.4± 14 490± 210 4.35
L59-C2 7.2 ± 1.3 9.3 ± 2.6 0.26± 0.15 1.3 ± 0.7 94.4± 20 400± 160 2.16
I73-C1 2.2 ± 1.7 2.7 ± 1.9 0.39± 0.26 1.0 ± 0.8 98.9± 20 470± 360 68.00
L82-C2 16.4 ± 0.7 20.1 ± 1.4 0.92± 0.15 1.1 ± 0.3 96.7± 4.8 1130± 270 33.41
I94-C1 3.9 ± 0.3 5.8 ± 0.5 0.19± 0.38 2.0± 0.4 75.4± 20 2140± 550 14.74
L95-C2 29.5 ± 0.4 5.4 ± 0.9 1.02± 0.54 1.4± 0.6 99.1± 20 930± 430 30.06
L103-C 19.7 ± 1.2 21.2 ± 2.0 0.66± 0.07 0.4± 024 93.6± 20 390± 140 7.32
V104-C1 19.1 ± 0.8 22.8 ± 2.2 0.64± 0.08 0.9 ± 0.3 94.6± 1.5 680± 130 12.58
V104-C2 20.7 ± 0.5 23.6 ± 1.0 1.01± 0.06 0.7± 0.2 96.5± 0.02 980± 160 6.11
I150-C2 26.2 ± 0.4 28.6 ± 0.8 0.94± 0.00 0.5 ± 0.1 94.3± 0.001 620± 45 3.46
L157-C1 3.9 ± 0.4 4.6 ± 0.8 1.18± 0.38 0.8 ± 0.6 99.4± 9.1 1170± 760 12.56
L160-C2 18.4 ± 0.8 26.2 ± 1.6 0.30 ± 0.09 1.8 ± 0.4 84± 17 710± 100 2.51
L162-C1 12.3 ± 1.5 14.1 ± 3.0 0.43± 0.17 0.7± 0.7 94.6± 16 360± 220 12.2
I163-C1 4.5 ± 0.6 6.6 ± 1.2 0.09± 0.17 1.9± 0.7 50.0± 21 540± 160 14.37
L167-C1 7.8 ± 0.4 9.3 ± 0.7 0.86± 0.22 0.9± 0.5 98.3± 9.5 950± 370 13.86
L167-C2 13.0 ± 1.2 14.4 ± 2.1 0.58± 0.17 1.2 ± 0.3 95.6± 12 420± 270 18.67
L172-C1 13.9 ± 0.7 16.4 ± 1.7 0.55± 0.09 0.8± 0.4 95.3± 6.6 540± 150 30.00
L172-C2 9.2 ± 8.2 13.9 ± 12.1 0.11± 0.18 2.1 ± 0.9 50.0± 19.7 420± 180 22.67
I174-C1 4.1± 0.4 5.4± 0.8 0.65± 0.36 1.4 ± 0.7 98.7± 16.7 1200± 570 30.67
I180-C1 5.4± 0.7 8.1± 1.4 0.10± 0.12 2.1 ± 0.5 50.0± 21.2 590± 120 54.59
V191-C1 2.2± 0.6 2.7± 0.9 1.53± 0.64 1.1 ± 0.5 99.7± 7.3 1780± 1400 10.06
L198-C1 3.7± 2.6 3.7± 3.1 2.97± 1.01 0.0 ± 0.3 99.4± 5.4 610± 1800 8.67
L205-C1 18.2± 1.3 19.8± 2.6 0.50± 0.12 0.4 ± 0.4 92.5± 12.1 320± 170 7.45
L227-C1 2.0± 0.8 2.0± 0.8 0.11± 0.33 2.0 ± 0.8 50.0± 21.1 990± 420 5.12
V288-C1 2.2± 0.2 2.5± 0.4 0.85± 0.34 0.6 ± 0.7 99.5± 15.3 720± 460 10.79
I291-C1 5.4± 0.9 6.0± 1.7 0.37± 0.14 0.5 ± 0.6 97.0± 10.6 270± 140 5.79
I303-C1 2.3± 1.0 3.4± 1.3 0.39± 0.92 2.0 ± 0.6 95.4± 19.3 3310± 2000 78.03
V310-C1 1.6± 0.2 2.4± 0.3 0.15± 0.53 2.1 ± 0.5 83.3± 21.8 2240± 710 37.29
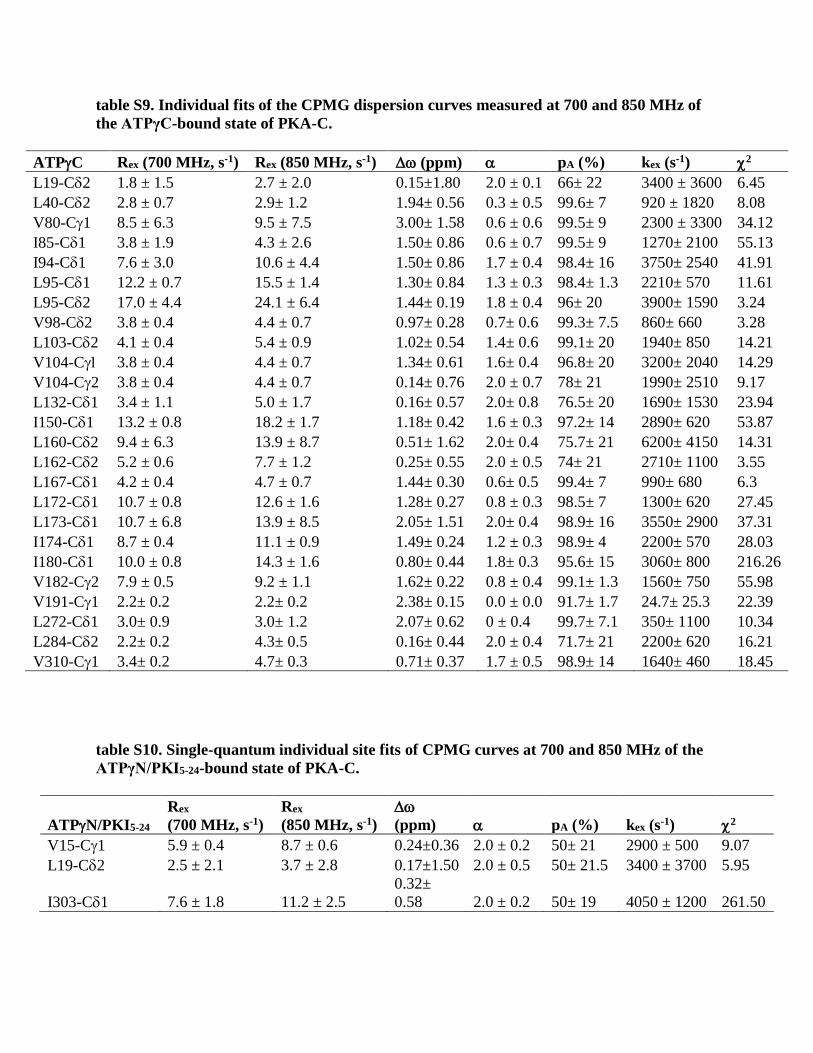
table S9. Individual fits of the CPMG dispersion curves measured at 700 and 850 MHz of
the ATPγC-bound state of PKA-C.
ATPC Rex (700 MHz, s-1) Rex (850 MHz, s-1) (ppm) pA (%) kex (s-1) 2
L19-C2 1.8 ± 1.5 2.7 ± 2.0 0.15±1.80 2.0 ± 0.1 66± 22 3400 ± 3600 6.45
L40-C2 2.8 ± 0.7 2.9± 1.2 1.94± 0.56 0.3 ± 0.5 99.6± 7 920 ± 1820 8.08
V80-C1 8.5 ± 6.3 9.5 ± 7.5 3.00± 1.58 0.6 ± 0.6 99.5± 9 2300 ± 3300 34.12
I85-C1 3.8 ± 1.9 4.3 ± 2.6 1.50± 0.86 0.6 ± 0.7 99.5± 9 1270± 2100 55.13
I94-C1 7.6 ± 3.0 10.6 ± 4.4 1.50± 0.86 1.7 ± 0.4 98.4± 16 3750± 2540 41.91
L95-C1 12.2 ± 0.7 15.5 ± 1.4 1.30± 0.84 1.3 ± 0.3 98.4± 1.3 2210± 570 11.61
L95-C2 17.0 ± 4.4 24.1 ± 6.4 1.44± 0.19 1.8 ± 0.4 96± 20 3900± 1590 3.24
V98-C2 3.8 ± 0.4 4.4 ± 0.7 0.97± 0.28 0.7± 0.6 99.3± 7.5 860± 660 3.28
L103-C2 4.1 ± 0.4 5.4 ± 0.9 1.02± 0.54 1.4± 0.6 99.1± 20 1940± 850 14.21
V104-C 3.8 ± 0.4 4.4 ± 0.7 1.34± 0.61 1.6± 0.4 96.8± 20 3200± 2040 14.29
V104-C2 3.8 ± 0.4 4.4 ± 0.7 0.14± 0.76 2.0 ± 0.7 78± 21 1990± 2510 9.17
L132-C1 3.4 ± 1.1 5.0 ± 1.7 0.16± 0.57 2.0± 0.8 76.5± 20 1690± 1530 23.94
I150-C1 13.2 ± 0.8 18.2 ± 1.7 1.18± 0.42 1.6 ± 0.3 97.2± 14 2890± 620 53.87
L160-C2 9.4 ± 6.3 13.9 ± 8.7 0.51± 1.62 2.0± 0.4 75.7± 21 6200± 4150 14.31
L162-C2 5.2 ± 0.6 7.7 ± 1.2 0.25± 0.55 2.0 ± 0.5 74± 21 2710± 1100 3.55
L167-C1 4.2 ± 0.4 4.7 ± 0.7 1.44± 0.30 0.6± 0.5 99.4± 7 990± 680 6.3
L172-C1 10.7 ± 0.8 12.6 ± 1.6 1.28± 0.27 0.8 ± 0.3 98.5± 7 1300± 620 27.45
L173-C1 10.7 ± 6.8 13.9 ± 8.5 2.05± 1.51 2.0± 0.4 98.9± 16 3550± 2900 37.31
I174-C1 8.7 ± 0.4 11.1 ± 0.9 1.49± 0.24 1.2 ± 0.3 98.9± 4 2200± 570 28.03
I180-C1 10.0 ± 0.8 14.3 ± 1.6 0.80± 0.44 1.8± 0.3 95.6± 15 3060± 800 216.26
V182-C2 7.9 ± 0.5 9.2 ± 1.1 1.62± 0.22 0.8 ± 0.4 99.1± 1.3 1560± 750 55.98
V191-C1 2.2± 0.2 2.2± 0.2 2.38± 0.15 0.0 ± 0.0 91.7± 1.7 24.7± 25.3 22.39
L272-C1 3.0± 0.9 3.0± 1.2 2.07± 0.62 0 ± 0.4 99.7± 7.1 350± 1100 10.34
L284-C2 2.2± 0.2 4.3± 0.5 0.16± 0.44 2.0 ± 0.4 71.7± 21 2200± 620 16.21
V310-C1 3.4± 0.2 4.7± 0.3 0.71± 0.37 1.7 ± 0.5 98.9± 14 1640± 460 18.45
table S10. Single-quantum individual site fits of CPMG curves at 700 and 850 MHz of the
ATPγN/PKI5-24-bound state of PKA-C.
ATPN/PKI5-24
Rex
(700 MHz, s-1)
Rex
(850 MHz, s-1)
(ppm) pA (%) kex (s-1) 2
V15-C1 5.9 ± 0.4 8.7 ± 0.6 0.24±0.36 2.0 ± 0.2 50± 21 2900 ± 500 9.07
L19-C2 2.5 ± 2.1 3.7 ± 2.8 0.17±1.50 2.0 ± 0.5 50± 21.5 3400 ± 3700 5.95
I303-C1 7.6 ± 1.8 11.2 ± 2.5
0.32±
0.58 2.0 ± 0.2 50± 19 4050 ± 1200 261.50
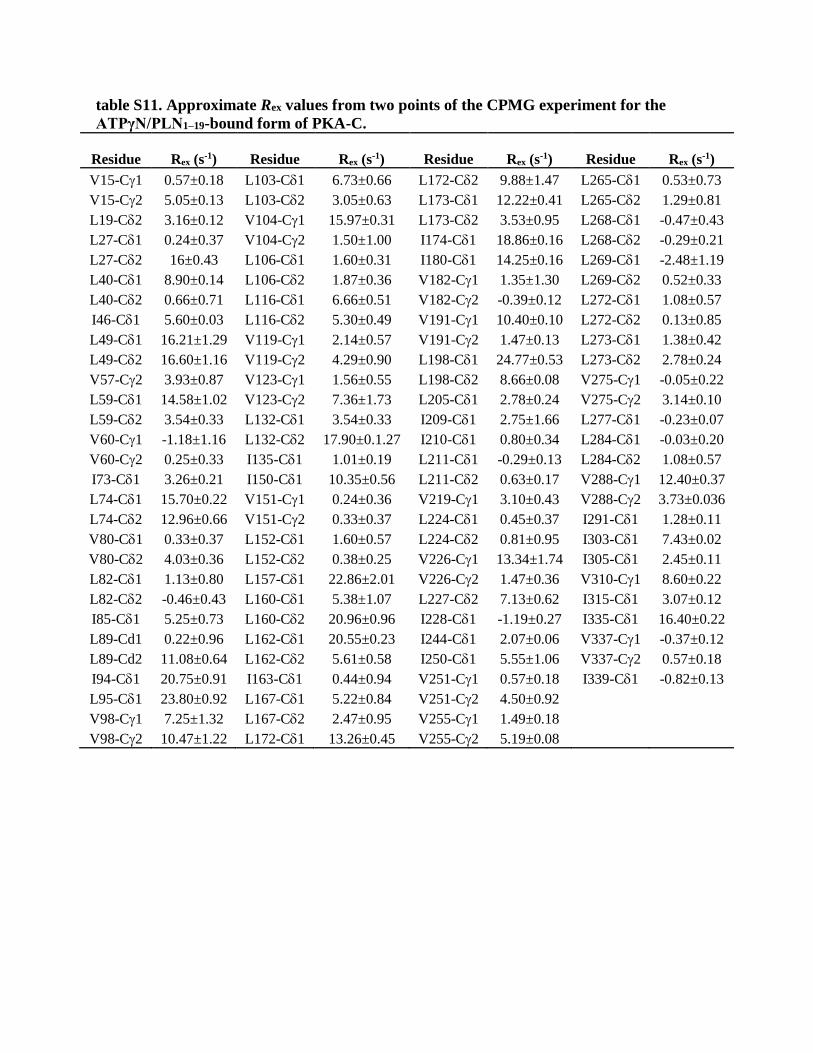
table S11. Approximate Rex values from two points of the CPMG experiment for the
ATPγN/PLN1–19-bound form of PKA-C.
Residue
Rex (s-1)
Residue
Rex (s-1)
Residue
Rex (s-1)
Residue
Rex (s-1)
V15-C1 0.57±0.18 L103-C1 6.73±0.66 L172-C2 9.88±1.47 L265-C1 0.53±0.73
V15-C2 5.05±0.13 L103-C2 3.05±0.63 L173-C1 12.22±0.41 L265-C2 1.29±0.81
L19-C2 3.16±0.12 V104-C1 15.97±0.31 L173-C2 3.53±0.95 L268-C1 -0.47±0.43
L27-C1 0.24±0.37 V104-C2 1.50±1.00 I174-C1 18.86±0.16 L268-C2 -0.29±0.21
L27-C2 16±0.43 L106-C1 1.60±0.31 I180-C1 14.25±0.16 L269-C1 -2.48±1.19
L40-C1 8.90±0.14 L106-C2 1.87±0.36 V182-C1 1.35±1.30 L269-C2 0.52±0.33
L40-C2 0.66±0.71 L116-C1 6.66±0.51 V182-C2 -0.39±0.12 L272-C1 1.08±0.57
I46-C1 5.60±0.03 L116-C2 5.30±0.49 V191-C1 10.40±0.10 L272-C2 0.13±0.85
L49-C1 16.21±1.29 V119-C1 2.14±0.57 V191-C2 1.47±0.13 L273-C1 1.38±0.42
L49-C2 16.60±1.16 V119-C2 4.29±0.90 L198-C1 24.77±0.53 L273-C2 2.78±0.24
V57-C2 3.93±0.87 V123-C1 1.56±0.55 L198-C2 8.66±0.08 V275-C1 -0.05±0.22
L59-C1 14.58±1.02 V123-C2 7.36±1.73 L205-C1 2.78±0.24 V275-C2 3.14±0.10
L59-C2 3.54±0.33 L132-C1 3.54±0.33 I209-C1 2.75±1.66 L277-C1 -0.23±0.07
V60-C1 -1.18±1.16 L132-C2 17.90±0.1.27 I210-C1 0.80±0.34 L284-C1 -0.03±0.20
V60-C2 0.25±0.33 I135-C1 1.01±0.19 L211-C1 -0.29±0.13 L284-C2 1.08±0.57
I73-C1 3.26±0.21 I150-C1 10.35±0.56 L211-C2 0.63±0.17 V288-C1 12.40±0.37
L74-C1 15.70±0.22 V151-C1 0.24±0.36 V219-C1 3.10±0.43 V288-C2 3.73±0.036
L74-C2 12.96±0.66 V151-C2 0.33±0.37 L224-C1 0.45±0.37 I291-C1 1.28±0.11
V80-C1 0.33±0.37 L152-C1 1.60±0.57 L224-C2 0.81±0.95 I303-C1 7.43±0.02
V80-C2 4.03±0.36 L152-C2 0.38±0.25 V226-C1 13.34±1.74 I305-C1 2.45±0.11
L82-C1 1.13±0.80 L157-C1 22.86±2.01 V226-C2 1.47±0.36 V310-C1 8.60±0.22
L82-C2 -0.46±0.43 L160-C1 5.38±1.07 L227-C2 7.13±0.62 I315-C1 3.07±0.12
I85-C1 5.25±0.73 L160-C2 20.96±0.96 I228-C1 -1.19±0.27 I335-C1 16.40±0.22
L89-Cd1 0.22±0.96 L162-C1 20.55±0.23 I244-C1 2.07±0.06 V337-C1 -0.37±0.12
L89-Cd2 11.08±0.64 L162-C2 5.61±0.58 I250-C1 5.55±1.06 V337-C2 0.57±0.18
I94-C1 20.75±0.91 I163-C1 0.44±0.94 V251-C1 0.57±0.18 I339-C1 -0.82±0.13
L95-C1 23.80±0.92 L167-C1 5.22±0.84 V251-C2 4.50±0.92
V98-C1 7.25±1.32 L167-C2 2.47±0.95 V255-C1 1.49±0.18
V98-C2 10.47±1.22 L172-C1 13.26±0.45 V255-C2 5.19±0.08