Embed Size (px)
Citation preview

SY2011-12 PVAAS ScatterplotsState to IU Region to LEA
Public Schools/Charter Schools/Comprehensive CTCs
Math, Reading, Writing, Science
Template
Contact your IU PVAAS contact or the PVAAS Statewide Team for PDE with any questions:
(717) [email protected]

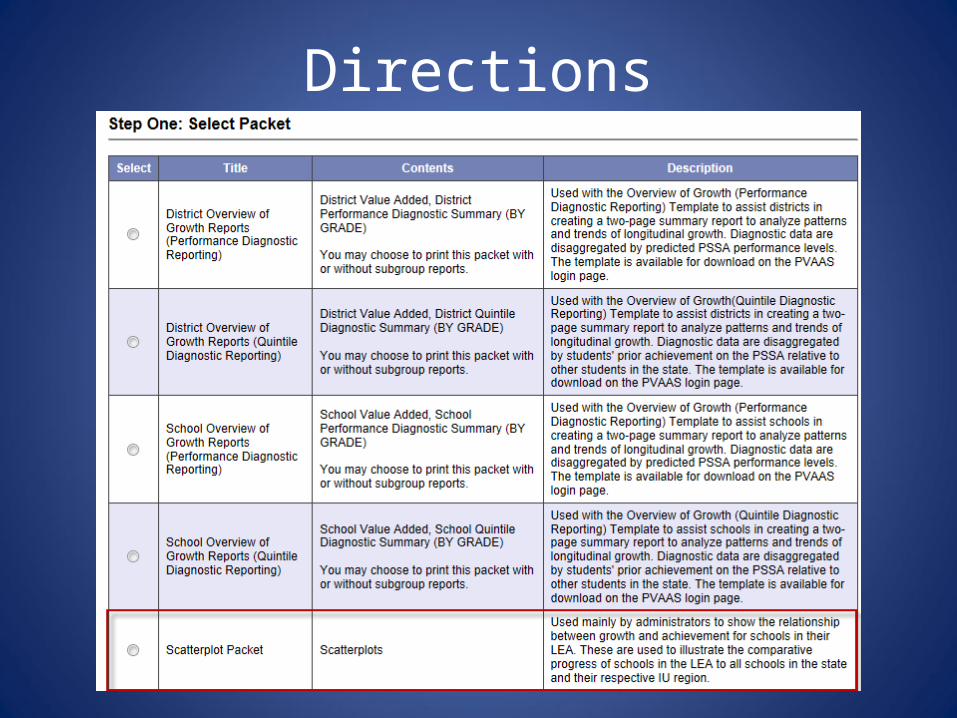
Directions• Use the “Data Packets” feature in PVAAS to retrieve a
PDF packet of your LEA’s scatterplots• Choose whether to include all four subject areas, or only
selected subject areas• Use screen captures of the scatterplots from the PVAAS
Data Packet (PDF document) to copy and paste each scatterplot into the correct slide (subject and grade level) in this PowerPoint template
• Delete any unnecessary slides for subject areas not selected

Directions
Directions

Directions

Directions

Directions
• After receiving notification that your packet is available, log back into PVAAS and select Packet Status under the Print menu.
• You may then click on the file name to retrieve your packet.

Statewide to IU Region to DistrictGrade 4 Math
Statewide Grade 4 Math
IU #Grade 4 Math
Insert IU-wide Scatterplot Here

SY2011-12 PVAAS ScatterplotsState to IU Region to LEA
Public Schools/Charter School/Comprehensive CTC
Math, Reading, Writing, Science
<Insert District Name, Logo><Insert Date>
SY2011-12 Scatter PlotsMath, Reading, Writing, and Science
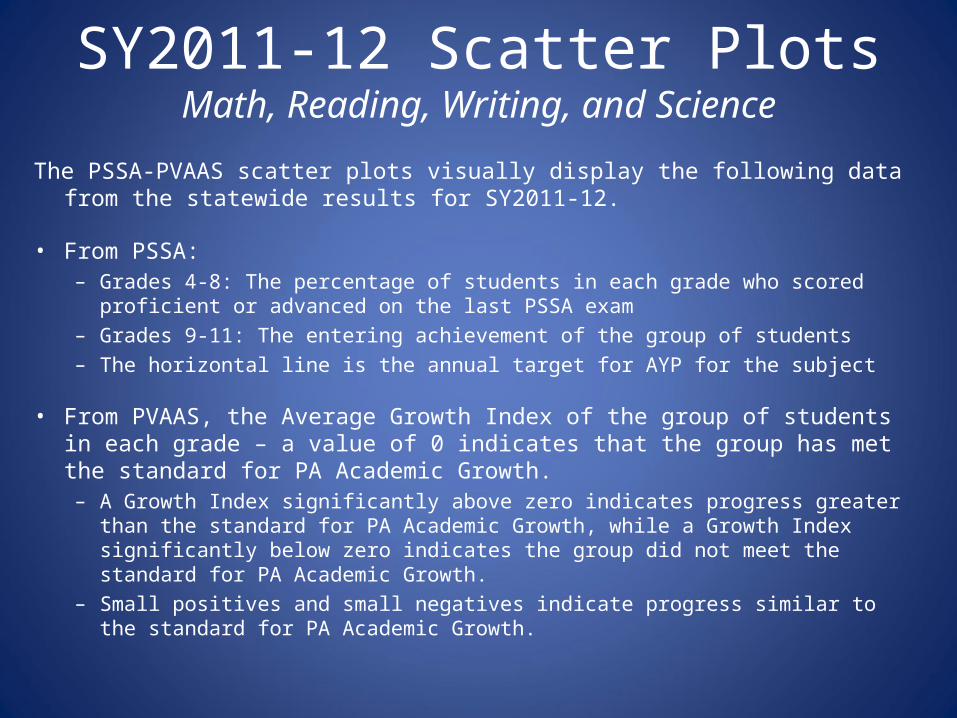
The PSSA-PVAAS scatter plots visually display the following data from the statewide results for SY2011-12.
• From PSSA:– Grades 4-8: The percentage of students in each grade who scored proficient or
advanced on the last PSSA exam– Grades 9-11: The entering achievement of the group of students– The horizontal line is the annual target for AYP for the subject
• From PVAAS, the Average Growth Index of the group of students in each grade – a value of 0 indicates that the group has met the standard for PA Academic Growth.– A Growth Index significantly above zero indicates progress greater than the standard
for PA Academic Growth, while a Growth Index significantly below zero indicates the group did not meet the standard for PA Academic Growth.
– Small positives and small negatives indicate progress similar to the standard for PA Academic Growth.

SY2011-12 Scatter PlotsMath, Reading, Writing, and Science
• Each dot represents a school which has been placed on the graph based on:– Grades 4-8: the percent of students proficient or advanced
and the Average Growth Index from PVAAS.– Science, Writing, and Grades 9-11 Math and Reading: the
entering achievement and the Average Growth Index from PVAAS.
• The following two slides explain the meaning of each of the quadrants on each scatter plot.

The Scatter Plot Coordinate System
Vertical Axis:
4-8: PSSA % Proficient or
Advanced
9-11: PSSA Entering
Achievement
Horizontal AxisPVAAS Growth
Index
AYP Percent Proficient Target
Horizontal Axis: Standard for PA
Academic Growth
12

Scatter Plot Quadrants and Their Meanings
Quad 1 - Excelling
Higher Achievement,Higher Growth
Quad 4 - Improving
Lower Achievement, Higher Growth
Quad 2 - SlippingHigher
Achievement,Lower Growth
Quad 3 - Underperforming
Lower Achievement,Lower Growth
13

Statewide to IU Region to DistrictGrade 4 Math
Statewide Grade 4 Math
IU #Grade 4 Math
Insert IU-wide Scatterplot Here
Insert IU-wide Scatterplot Here
Statewide to IU Region to DistrictGrade 5 Math
Statewide Grade 5 Math
IU #Grade 5 Math
Insert Statewide Scatterplot Here
Insert IU-wide Scatterplot Here

Statewide to IU Region to DistrictGrade 6 Math
Statewide Grade 6 Math
IU #Grade 6 Math
Insert Statewide Scatterplot Here
Insert IU-wide Scatterplot Here

Statewide to IU Region to DistrictGrade 7 Math
Statewide Grade 7 Math
IU #Grade 7 Math
Insert Statewide Scatterplot Here
Insert IU-wide Scatterplot Here

Statewide to IU Region to DistrictGrade 8 Math
Statewide Grade 8 Math
IU #Grade 8 Math
Insert Statewide Scatterplot Here
Insert IU-wide Scatterplot Here

Statewide to IU Region to DistrictGrade 9-11 Math
Statewide Grade 9-11 Math
IU #Grade 9-11 Math
Insert Statewide Scatterplot Here
Insert IU-wide Scatterplot Here

Statewide to IU Region to DistrictGrade 4 Reading
Statewide Grade 4 Reading
IU #Grade 4 Reading
Insert Statewide Scatterplot Here
Insert IU-wide Scatterplot Here
• State compared to LEA for Selected Grade(s) and Subject
• IU Region compared to LEA for Selected Grade(s) and Subject

Statewide to IU Region to DistrictGrade 5 Reading
Statewide Grade 5 Reading
IU #Grade 5 Reading
Insert Statewide Scatterplot Here
Insert IU-wide Scatterplot Here

Statewide to IU Region to DistrictGrade 6 Reading
Statewide Grade 6 Reading
IU #Grade 6 Reading
Insert Statewide Scatterplot Here
Insert IU-wide Scatterplot Here

Statewide to IU Region to DistrictGrade 7 Reading
Statewide Grade 7 Reading
IU #Grade 7 Reading
Insert Statewide Scatterplot Here
Insert IU-wide Scatterplot Here

Statewide to IU Region to DistrictGrade 8 Reading
Statewide Grade 8 Reading
IU #Grade 8 Reading
Insert Statewide Scatterplot Here
Insert IU-wide Scatterplot Here

Statewide to IU Region to DistrictGrade 9-11 Reading
Statewide Grade 9-11 Reading
IU #Grade 9-11 Reading
Insert Statewide Scatterplot Here
Insert IU-wide Scatterplot Here

Statewide to IU Region to DistrictGrade 5 Writing
Statewide Grade 5 Writing
IU #Grade 5 Writing
Insert Statewide Scatterplot Here
Insert IU-wide Scatterplot Here

Statewide to IU Region to DistrictGrade 8 Writing
Statewide Grade 8 Writing
IU #Grade 8 Writing
Insert Statewide Scatterplot Here
Insert IU-wide Scatterplot Here

Statewide to IU Region to DistrictGrade 11 Writing
Statewide Grade 11 Writing
IU #Grade 11 Writing
Insert Statewide Scatterplot Here
Insert IU-wide Scatterplot Here

Statewide to IU Region to DistrictGrade 4 Science
Statewide Grade 4 Science
IU #Grade 4 Science
Insert Statewide Scatterplot Here
Insert IU-wide Scatterplot Here

Statewide to IU Region to DistrictGrade 8 Science
Statewide Grade 8 Science
IU #Grade 8 Science
Insert Statewide Scatterplot Here
Insert IU-wide Scatterplot Here

Statewide to IU Region to DistrictGrade 11 Science
Statewide Grade 11 Science
IU #Grade 11 Science
Insert Statewide Scatterplot Here
Insert IU-wide Scatterplot Here

Next Steps
• <Insert any other relevant achievement or growth data>
• <Insert your LEAs plan of action based on this information>– Next Steps
• Who?• What?• When?

Questions
Contact your IU PVAAS contact or the PVAAS Statewide Team for PDE with
any questions:(717) 606-1911
https://pvaas.sas.com