Embed Size (px)
Citation preview

Technology Opportunities for Wind Energy
Sandia is a multiprogram laboratory operated by Sandia Corporation, a Lockheed Martin Company,for the United States Department of Energy’s National Nuclear Security Administration
under contract DE-AC04-94AL85000.
Jonathan R. White, Ph. D.Condition Monitoring and Testing Lead,Wind & Water Power Technologies
Sandia National [email protected](505) 284-5400
2010 iNEMI Alternative Energy Workshop

Outline
�Turbine design evolution
�Wind Energy 101 �Wind Energy 101
�Technology Challenges
�Sandia Research Efforts
�Summary

Turbine Design EvolutionTurbine Design Evolution

10 MW
Boeing747-400

Example Small Wind SystemsBergey Windpower
BWC XL.11 kW, 8.2 ft Dia.
Battery-Charging
Southwest Windpower
Skystream 3.71.8 kW12 ft Dia. Grid-Connect
Northern Power Systems
Energy Overview - 5
NorthWind 100/21100 kW, 69 ft dia.Grid-Connect
Endurance Wind Power Inc.
Endurance S-2504.25 kW, 18 ft Dia.Grid-Connect

Industry has Changed from Small Machines to Large Multi-Mega-Watt
Machines
�Above : Tehachapi, CA – 65kW, 900kW, and 3MW machines
� Left : Palm Springs, CA – field of 65kW with four larger machines in foreground (~750kW )

• Utility-Scale Wind Power1,000-3,000 kW wind turbines
– Installed on wind farms, 10–700 MW
– Interconnected to transmission– Professional maintenance crews– Class 4-6 wind resource
Small Wind Turbines Are
Different 1,500 kW
212 - 250 ft
– Class 4-6 wind resource
• Small Wind Powerup to 100 kW wind turbines
– Installed at individual homes, farms, businesses, schools, etc.
– Interconnected to distribution, on the “customer side” of the meter
– Few moving parts, high reliability, low maintenance
– Class 2-4 wind resource
10 kW
80 ft
Courtesy Jim Green, NREL

Logistics become difficult as size increases
2.5 MW, 45-meter Blade Static Test at NREL/NWTC 5 MW Access
“Wind turbine blade in transport by johnwhite79”http://farm1.static.flickr.com/179/402457734_32079269f1.jpg
http://www.renewableenergyworld.com/assets/images/story/2005/2/4/1332_5M_Heli1_final.jpg
~2 MW, ~40-meter

Current U.S. Installation
� Wind Energy Today (Q2 2010)
• Total installed capacity: +36,000MW (37
States) - ~2% of U.S. energy consumption
� 9,922 MW installed 2009
� All time record
� 3,200MW under construction
• Approximately 19 billion dollars invested
in 2009
• Installed cost: ~5-8¢/kWh
Almost 5.5 TW Available Resource (Total U. S. Electric Capacity ≈ 1 TW in 2007)
� Yearly Energy Installation % by Source

Offshore Wind� Technical challenges, higher costs
� Close to load centers
� >2000 MW (end 2009) installed in worldwide
• No U.S.installations
� Limited shallow depths in U.S.
� Several Proposals in U.S.
• Cape Cod (Cape Wind)• Cape Cod (Cape Wind)
• Long Island (LIPA)

Wind Energy 101Wind Energy 101

Wind Power Basics
Wind Power output is proportional to wind speed cubed.
(Drag)3.0max
32
1
≅= ∞
P
P
C
VACWindPower ρ
Air DensityRotor Area Wind Speed
(Lift)59.0
3.0
max
max
≅≅
P
P
C
C
1
3i wV V=
316 1
27 2 wP AVρ =
The Betz Limit
Energy Overview - 12

The Physics of the Power Curve Drives
Technology Development
� Power in the wind is proportional to wind speed cubed
� At best, we can capture 59% (the Betz limit)
� “Rated Power” governs the size and
Facts about Wind Technology
� “Rated Power” governs the size and cost of the entire turbine infrastructure
� Energy is power multiplied by the amount of time spent at that power level
� Capacity Factor is the ratio of total output to what would have been generated if always operating at Rated Power – Meaningful metric
� Wind shear puts higher winds at greater elevation
Energy Overview - 13

Understand External Conditions To Define
the Design Conditions
Land-Based
Turbine
Offshore
Turbine
Energy Overview - 14
Produced byNREL

Typical Wind Turbine
Configurations
Hub
Conventional Drive Train
Technology Overview - 15
Hub
BladeTower
Gear Box
Generator
Pitch System
Yaw System
Direct Drive System

Typical Wind Farm Components
� Turbine
� Foundations
� Electrical collection
system
Power quality � Power quality
conditioning
� Substation
� SCADA
� Roads
�Maintenance facilities

Technology OpportunitiesTechnology Opportunities

� Size� 1.5-5.0 MW� Towers: 65-100 meters� Blades: 34-50 meters
� Costs (traditional)• System ~ $3/lb
• Blades ~ $6/lb
• ~ $1.00/Watt (2002)
• $0.04-$0.06/kWh (2002)
� Recent cost of steel & copper increases have increased cost by 30 - 50%
� Currency exchange rate
� Limited Manufacturers & Suppliers
Wind Industry Trends & Challenges
2008: ~$1.6 – $2.0/Watt
•High-end Military ~ $1000/lb•Aerospace Industry ~ $100/lb
� Blades: 34-50 meters� Weight: 150-500 tons
Suppliers
Energy Overview - 18

Scenario Installed Capacity vs. Current
Installed Capacity
Current Blade Manufacturing (2009*): (~1.5MW Baseline – U.S. Market)
� ~19,850 New Blades� ~ 9,000lb of fiber glass� ~600lb of core mat.� ~3,500lb of resin
� ~178M lb of Fiber Glass
Global Market (2008):10
12
14
16
18
Ann
ual I
nsta
lled
Cap
acity
(G
W)Capacity additions in 20% Scenario
Installation
Source*: AWEA, 2009
Global Market (2008):� 27 GW of New Wind
� ~54,000 new blades�~ 486M lb of fiber glass
� ~121 GW Total Capacity
Market Potential:(20% Scenario – U.S. Market, 2016)
� ~33,000 New Blades� ~300M lb of Fiber Glass
0
2
4
6
8
Annual GW Installed
Installations 2007: 5,329 MW
Installations 2008: 8,358 MW*
Ann
ual I
nsta
lled
Cap
acity
(G
W)
2009: 9,922 MW
Energy Overview - 19

Critical Elements for 20% Scenario Planning
� Improved Performance
• 10% reduction in capital cost
• 15% increase in capacity factor
• Net result: 1.3-2.2 cents/KWh
�Mitigate Risk
• Reduce O&M costs by 35%• Reduce O&M costs by 35%
• Foster the confidence to support continued 20% per year growth in installation rates from now until 2018

Ribrant, J. “Reliability performance and maintenance
– A Survey of failures in wind power systems.” 2006.
~625 Turbines in Sweden (2000-2004)
Sensors: 14.1% Failures / 5.4% DowntimeElec Sys: 17.5% Failures / 14.3% DowntimeCtrl sys: 12.9% Failures / 18.3% DowntimeTotal: 44.5% Failures / 38% Downtime

~865 Turbines in Germany (2004-2005)
Ribrant, J. “Reliability performance and maintenance
– A Survey of failures in wind power systems.” 2006.
Sensors: 10% Failures / 4% DowntimeElec Sys: 24% Failures / 4% DowntimeCtrl sys: 17% Failures / 5% DowntimeTotal: 51% Failures / 13% Downtime
ISET 250 MW Wind Programme
Hahn, B. et al. “Reliability of Wind Turbines.” 2006.
Sensors: 10% FailuresElec Sys: 23% FailuresCtrl sys: 18% FailuresTotal: 51% Failures

Sandia Research EffortsSandia Research Efforts

Nuclear Weapons
43%
Defense Systems and Assessments
29%
Operating Budget
Sandia National Laboratories� FY09 permanent workforce: 8,478� FY09 budget: $2.4B
ComputingMath3%
ChemistryOther
Engineering
Technical Staff (3,921) by Degree
Homeland Security and
Defense8%
Energy, Resources and Non-
proliferation20%
Computing16%
3%Chemistry
5%
Physics6%
Other Sciences
7%
Other Fields16%
Electrical Engineering
17%
Mechanical Engineering
15%
Engineering15%

SNL’s Wind & Water Power
Program� Wind Technology� Materials and Manufacturing
� Structural, Aerodynamic, and Full System Modeling
� Sensors and Structural Health Monitoring
� Advanced Blade Concepts
� Lab - Field Testing and Data Acquisition
� System Reliability� Industry Data Collection
� Improve reliability of the existing technology and future designs
� Improve reliability of the existing technology and future designs
� Blade Reliability Collaborative
� System Integration & Outreach� Wind/RADAR Interaction
� Integration Assessment
� SNL Wind Farm Feasibility
� Advanced Water Power� Lead Lab for MHK Technology and
Environmental Analysis
� Supporting R&D on Conv. Hydro

Performance Enhancement
OptionsPower ResourcePower Curve
1000
1500
2000
2500
3000
3500
4000
Pow
er (
kW)
Wind, Energy
Larger Rotor Taller Tower
0
500
0 5 10 15 20 25 30 35 40
Windspeed (m/s)
Turbine pow er Betz Pow er
Rotor costs increase with diameter cubed,Rotor power grows with the diameter squared
Tower costs increase with height to the fourth power
We can only win this battle if we build rotors that are smarter and components that are lighter to beat the squared-cubed law.
0 5 10 15 20 25 30 35 40
Windspeed (m/s)
Rayleigh Probability Weibull Probability
Energy Overview - 27

Improved Performance Achieved through
Increased Capacity Factor� Larger Rotors: to sweep greater area
• Longer and lighter blades (new materials and designs)
• Load-mitigating control (passive and active)
� Taller Towers: to access greater resource
• Lower tower-head mass (lighter components)
• Innovations in towers, foundations, erection and maintenance access
� Reduced Losses: to deliver more of what is generated
• Power electronics, gearboxes, generators, medium-voltage, etc.
• Arrays, wakes, and siting issues• Arrays, wakes, and siting issues
Blade with Passive Load Mitigation
Knight & Carver “STAR” Rotor
WindPACT Baseline Design:
y = 0.1452x2.9158
WindPACT Static Load Design:
y = 0.2113x2.8833
WindPACT Final Design:
y = 0.1527x2.6921
LM Advanced Blade Design:
y = 0.4948x2.53
0
5000
10000
15000
20000
25000
30000
35000
0 10 20 30 40 50 60 70
Rotor Radius (m)
Mas
s (k
g)
WindPACT - Static load designTPI - baseline designWindPACT - Baseline designWindPACT - Final designLM Glasfiber BladesOffshore 5 MW TurbinesWindPACT - Commercial DataTPI Innovative Concept BladesOffshore 5 MW models
Baseline blade mass curve = WindPACT baselineAdvanced blade mass curve = LM advanced design

Paths to Improved Capacity Factor
� Advanced Rotor Technology • Extended rotor architectures
through load control� Cyclic & independent blade pitch control
for load mitigation
� Sweep and flap twist coupled architectures
� Active Aerodynamics
• Incorporate advanced materials for • Incorporate advanced materials for hybrid blades
• Light weight, high TSR with attenuated aeroacoustics
� Power Train Enhancements• Permanent Magnet Direct Drive
Architectures
• Split load path multi-stage generation topologies
• Reduced stage (1-2) integrated gearbox designs
• Convoloid gearing for load distribution
NPS 1.5MW Direct Drive Generator

Reductions in Capital Cost
� Learning Curve Effects
• Measures cost reduction in each doubling of capacity
� Greater Efficiency & New Technology
• Historical rates were about 9% per doubling
• 4.6 doublings from 2006 to 2030.
• A 10% reduction – 2.2% per doubling
� Opportunities – Design, Manufacturing, & � Opportunities – Design, Manufacturing, & Transportation
• Lighter – less material, advanced materials
• More automation
• Design for manufacturability
• Segmented Blades - ??
Courtesy TPI Composites

Innovation Evaluation Methodology
10
12
14
16
18
20
22
24
26
Win
d In
put V
x [m/s
]
1 8 .0 [m /s ] M W S N TM IEC Type A Tu rbu lence
Turbulent Wind Input
100 120 140 160 1808
Tim e (sec)
Rain Flow Counting
FAST/Aerodyn/Simulink Simulation
Turbine
9m/s11m/
s18m/
s
Rayleigh Wind5.5m/s
Rayleigh Wind
7m/s
Low Speed Shaft Torque -1.7 -4.9 -33.5 -3.1 -7.3
Blade Root Edge Moment 1.7 1.9 -2.5 0.8 0.8
Blade Root Flap Moment -31.2 -27.1 -30.4 -23.1 -26.3
Blade Root Pitch Moment -11.4 -4.5 -14.1 -7.1 -7
Tower Base Side-Side Moment -0.1 -8 -7.2 -0.9 -2.9
Tower Base Fore-Aft Moment -18.6 -16.5 -13.8 -5 -8
Tower Top Yaw Moment -53.2 -42.9 -43.4 -25.1 -32.2
Fatigue Damage Summary

9m Research Blades
Strategic use of
carbon for
weight reduction
Advanced Blade
Sensing
S-Blade
Passive aero-
structural load
mitigation
Structural
efficiency
improvement

Aero Actuator
Aero SensorsPressure Taps
(surface pressure)
Sensored and SMART Rotor Technology
Structural SensorsFiber Optic
(strain and temperature)
Strain Gage
(strain)(surface pressure)
5-Hole Pitot Tube
(AOA and Velocity)
(strain)
Accelerometer
(acceleration)
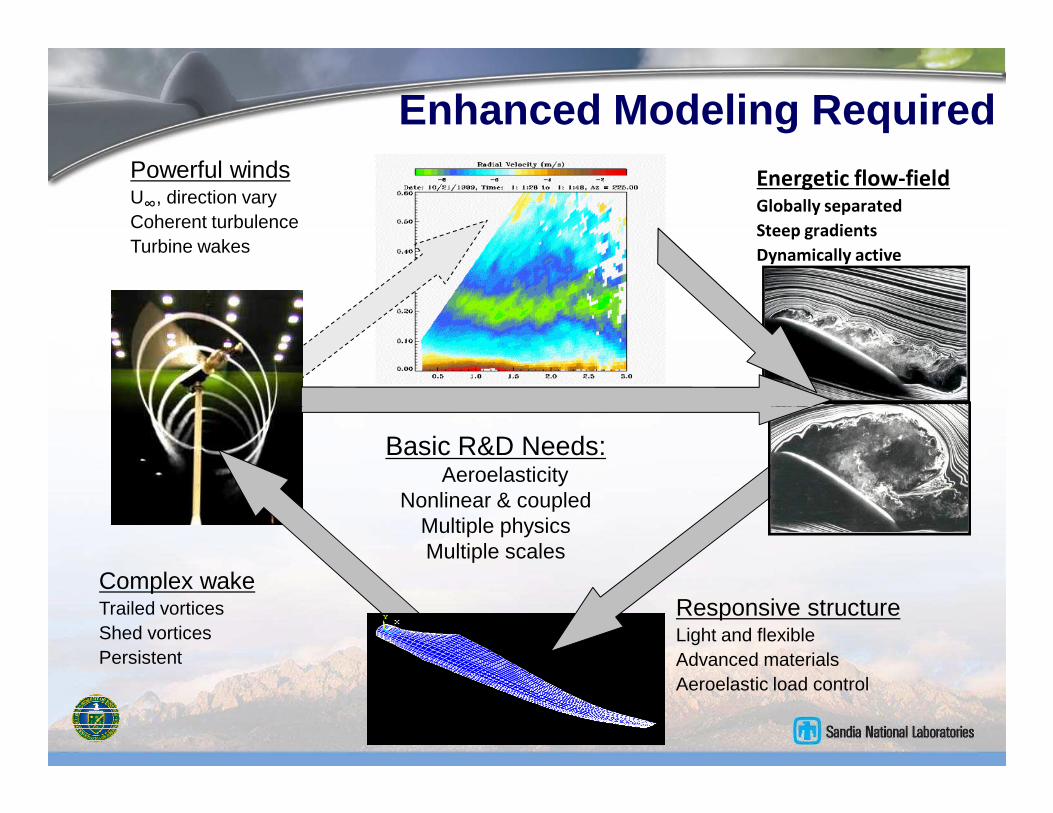
Energetic flow-fieldGlobally separated
Steep gradients
Dynamically active
Powerful windsU∞
, direction varyCoherent turbulenceTurbine wakes
Enhanced Modeling Required
Responsive structureLight and flexibleAdvanced materialsAeroelastic load control
Complex wakeTrailed vorticesShed vorticesPersistent
Basic R&D Needs:Aeroelasticity
Nonlinear & coupledMultiple physicsMultiple scales

Initiatives to
Mitigate Risk� Avoid Problems before they get
Installed
• Full Scale Testing
• Appropriate design criteria (specifications and standards)
• Validated design evaluation tools
� Monitor Performance
• “Tracking, tracking, tracking”
• Maintain reliability tracking database
• Define the problems before they get out of • Define the problems before they get out of hand
� Problem Resolution Initiatives
• Targeted activities in to address critical issues
• Example: Gearbox & Blade Collaborative
Photo by Lee Jay Fingersh

Reliability Database and Analysis
� Goal: Create an industry-wide capability that can track operating experience, benchmark reliability
performance, characterize issues, and identify opportunities for improving reliability of the national
wind energy investment.
� Program Focus:
• Manage and Analyze the National
Reliability Database
� Insightful analysis and benchmarking
� Feedback at system, component, and � Feedback at system, component, and
part levels
� Current (maintenance inputs)
� Future (design opportunities)
� Multi-level, secure, searchable data
• Strategic Partnerships
� Continuous access to operating data
• Direct industry support and
partnerships� Industry Impact & Opportunities:
• Increased availability, productivity, and reliability
• Continued confidence: financial sector and policy makers

Summary
� Utility Turbine Size has Evolved to 1.5+MW Range (65m + Rotor)
� 20% Wind Energy by 2030 Scenario Provides New DOE Wind Program Focus
• Increase installed wind from 35,000MW to 305,000 MW
� 50,000MW Offshore
� Technology Opportunities and Needs Exist:
• Increase Capacity Factor
� Reduce Blade Weight Growth for Larger Blades� Material research, enhance modeling, improve structural efficiency� Material research, enhance modeling, improve structural efficiency
� Implement Active Aero Load Control Technology� Integrate sensors & devices, reduce loads & fatigue
� Enhance Power Train
� Enhance Power Conversion
� Improve Tower Structure
• Reduce Capital Cost
� Improve Design for Manufacturing
� Enhance Manufacturing
• Improve O & M
� Enhance Design and Testing
� Monitor Performance
� Resolve Problems Promptly