Embed Size (px)
Citation preview
Telkom South Africa
Madiba Magic
James BarberAngela Fung
Sandeep ToshniwalBecky Voorheis
Case Background• Setting
– February 1997– Post-apartheid, privatization phase in South
Africa– Bidding war for 30% ownership in Telkom
• currently owned 100% by the SA government
• Protagonists– South African government– SBC Communications Inc.– Telekom Malaysia
Major Themes
I.Opportunity
II. Risks &Concerns
III. Thintana Consortium
IV. Valuation
Major Themes
I.Opportunity
II. Risks &Concerns
III. Thintana Consortium
IV. Valuation
I. Opportunity
• Telecommunications • Telkom• South Africa
I. Opportunity
• Telecommunications – Lucrative, “safe” investment in emerging
markets• fairly reliable cash flows• high growth prospects • ROE = 20-30% for “high readiness”
developing countries (McKinsey & Co.)• low betas when regressed on the
domestic market (higher when regressed on the U.S.)
I. Opportunity
• Telkom– The only wire-line telecommunications
provider in South Africa– State-enforced monopoly for 5 more years
with an option for a 6th (expires in 2003)– Needs a partner with technical skill– Open to using outside management
expertise
I. Opportunity• South Africa
– End of apartheid opened SA to foreign investment• new government friendly to foreign investment
– A hybrid of the 1st and 3rd worlds• highly developed manufacturing sector, infrastructure
– A “gateway” to Africa• “Sets the pace for the rest of Africa.” • the most diverse, advanced economy in Africa• 40% of telecom traffic in all of Africa
– Real option
• an export/import platform into Africa, Mid-East, Asia
I. Opportunity
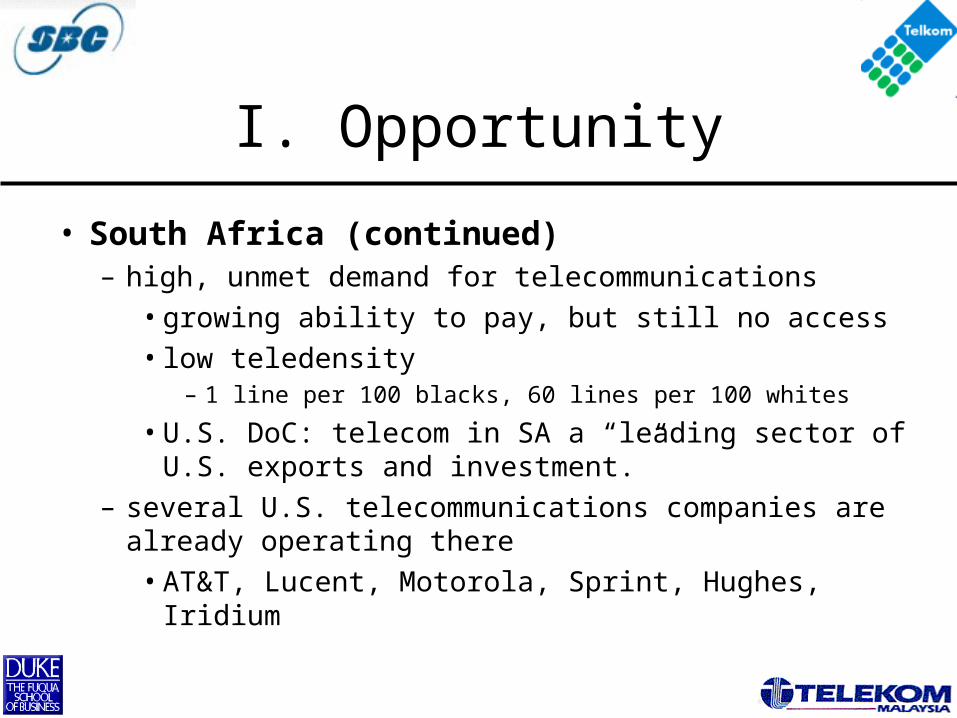
• South Africa (continued)– high, unmet demand for telecommunications
• growing ability to pay, but still no access• low teledensity
– 1 line per 100 blacks, 60 lines per 100 whites
• U.S. DoC: telecom in SA a “leading sector of U.S. exports and investment.”
– several U.S. telecommunications companies are already operating there• AT&T, Lucent, Motorola, Sprint, Hughes, Iridium
Major Themes
I.Opportunity
II. Risks &Concerns
III. Thintana Consortium
IV. Valuation
II. Risks & Concerns
• Country Risks • Company Risks
Country Risks
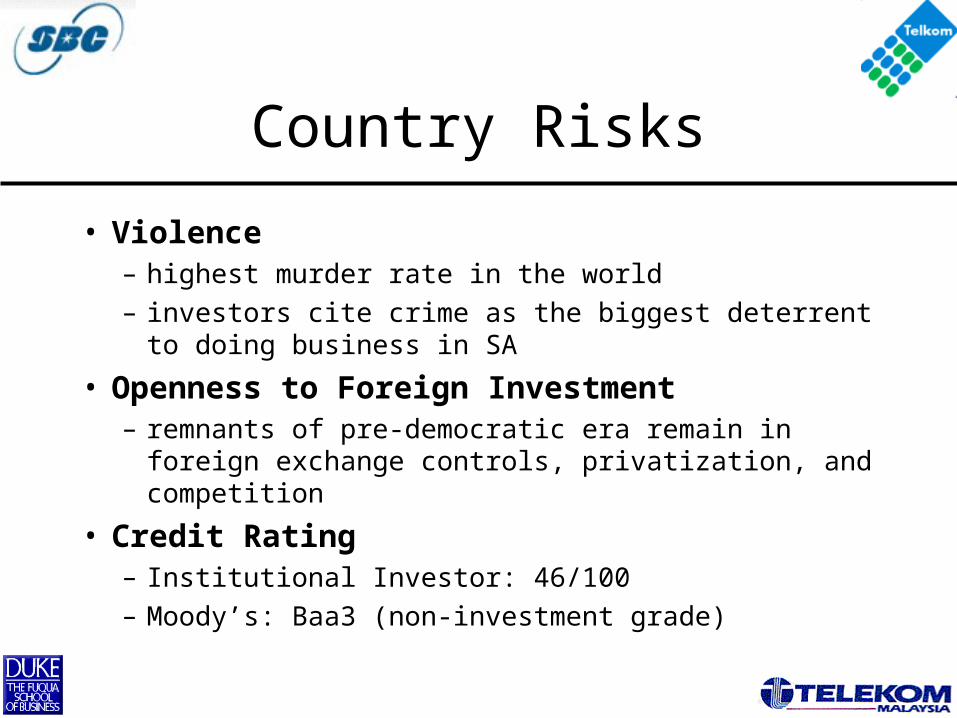
• Violence– highest murder rate in the world– investors cite crime as the biggest deterrent to
doing business in SA
• Openness to Foreign Investment– remnants of pre-democratic era remain in foreign
exchange controls, privatization, and competition
• Credit Rating– Institutional Investor: 46/100– Moody’s: Baa3 (non-investment grade)
Country Risks
• Poor Economy & Income Inequality– 2nd highest Gini Coefficient in the world (.61)– Low GDP/Capita, life expectancy, literacy, health
conditions– Rand consistently devalued since 1986– Johannesburg Stock Exchange (JSE) “weak” in recent
years
• Political Uncertainty– unproven leadership– right-wing backlash
Company Risks
• Technical Disrepair– # of customers actually shrinking (unheard of in 3rd world)– “high prices, slow service, aloof bureaucracy, bloated
workforce, and a network engineered for white neighborhoods.”
• Debt Burden– Telkom had borrowed to meet capital expenditures– extreme debt levels (some foreign denominated)
• D/E = 1.4 in 1996– average effective rate = 16.7%
Company Risks
• Competition from Cellular Service– not much more expensive and more reliable– more cost-effective, especially in rural areas– Telkom owned 50% of one provider (Vodacom),
SBC owned 15.5% of the only other one (MTN).
• Racial Tension– Telkom begins to promote blacks
• white backlash - 5,300 workers strike
Company Risks
• Copper Cable Theft– “As soon as we fix one line, another is stolen.”– sold for copper content– theft a “major concern” to SBC– 4,112 cables stolen in 1996 at a cost of $41.1
million Rand– switch to fiber-optics ... thieves have to dig up to
discover they’re not made of copper
Major Themes
I.Opportunity
II. Risks &Concerns
III. Thintana Consortium
IV. Valuation
III. Thintana Consortium
• Rationale & Structure• Telekom Malaysia• SBC Communications, Inc.
Rationale & Structure
• Previously rival bidders– better chance to beat Deutsche Telekom
together
• Joined to leverage their respective strengths– SBC: technology & modernization– Telekom Malaysia: developing countries
• 30% would be split– 18% SBC– 12% Telekom Malaysia
Telekom Malaysia
• Expertise in rural telecommunications• Presence in a number of emerging
markets, including Ghana, India, Malawi, Sri Lanka
• Worked with the SA government before
• Largest publicly-listed company in Malaysia
• Profitable
SBC Communications
• One of the world’s leading telecom firms– Fortune 25 company– Rated Most Admired Telecom Co in ‘95 & ‘96
• Aggressive M&A activity after deregulation
• Operations on 5 continents, 8 countries, and 13 U.S. states
• Focus on high-growth international markets
Major Themes
I.Opportunity
II. Risks &Concerns
III. Thintana Consortium
IV. Valuation
IV. Valuation
• Major uncertainties
• What actually happened & our model
Discussion
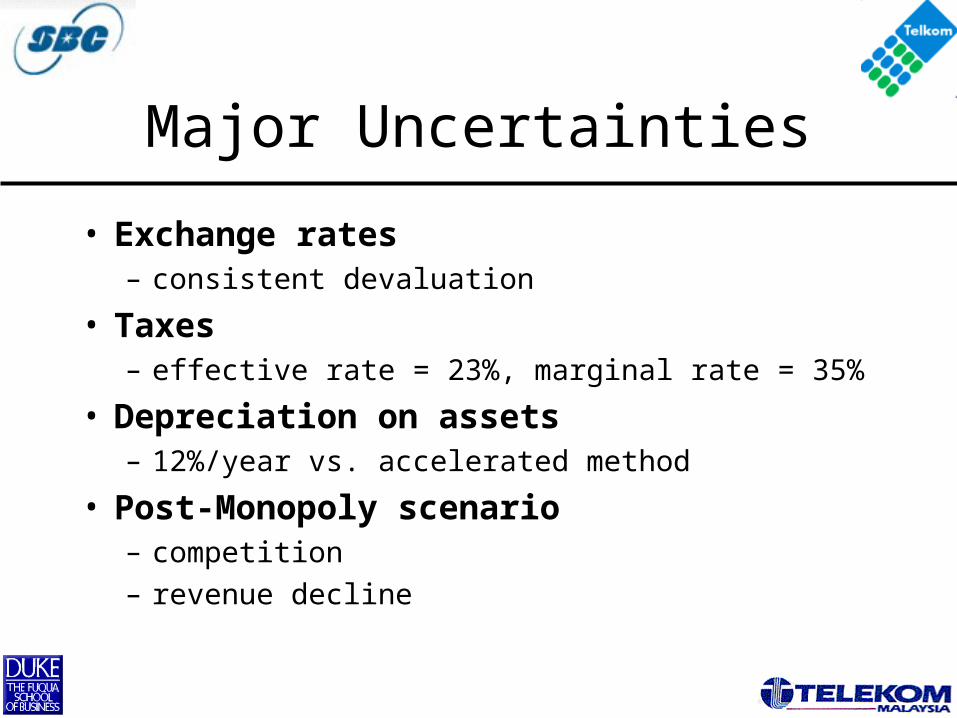
Major Uncertainties
• Exchange rates– consistent devaluation
• Taxes– effective rate = 23%, marginal rate = 35%
• Depreciation on assets– 12%/year vs. accelerated method
• Post-Monopoly scenario– competition– revenue decline
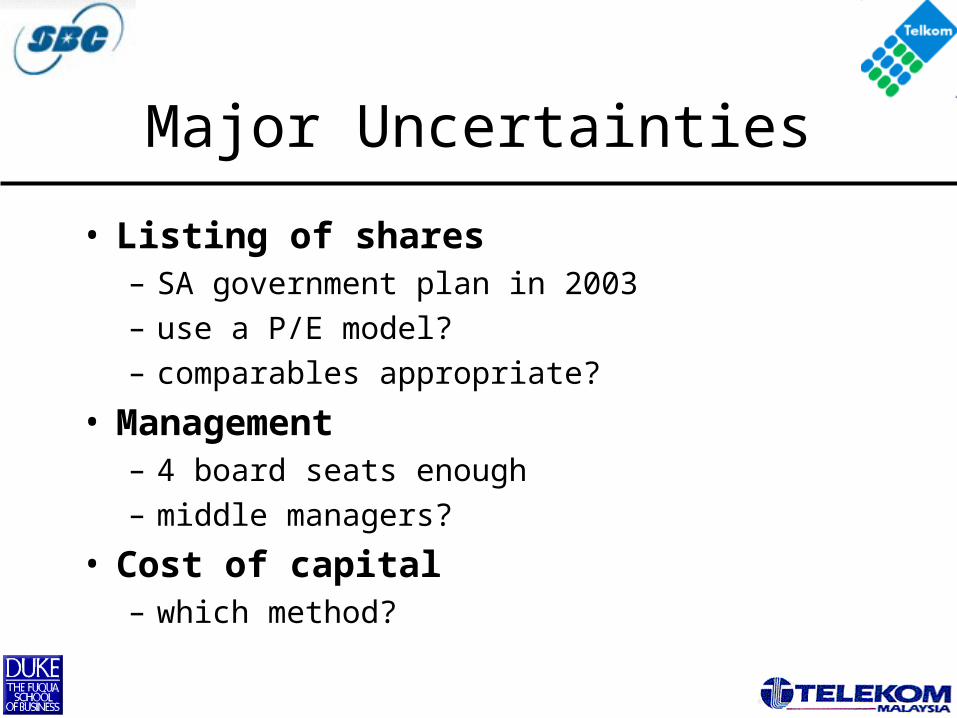
Major Uncertainties
• Listing of shares– SA government plan in 2003– use a P/E model?– comparables appropriate?
• Management– 4 board seats enough– middle managers?
• Cost of capital– which method?
Discussion
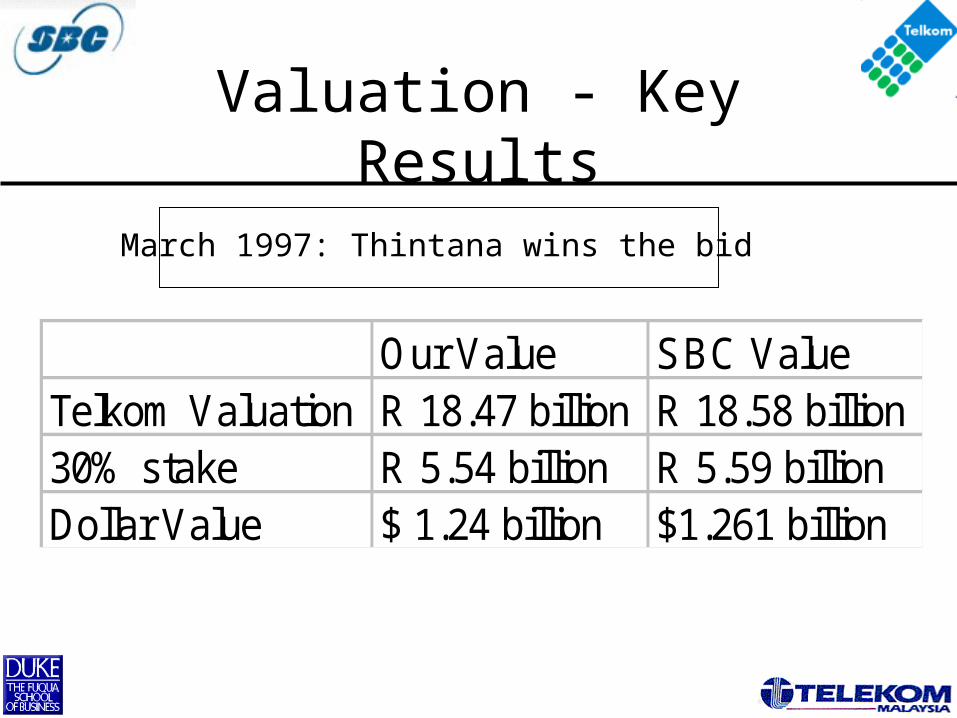
Valuation - Key Results
Our Value SBC ValueTelkom Valuation R 18.47 billion R 18.58 billion30% stake R 5.54 billion R 5.59 billionDollar Value $ 1.24 billion $1.261 billion
March 1997: Thintana wins the bid
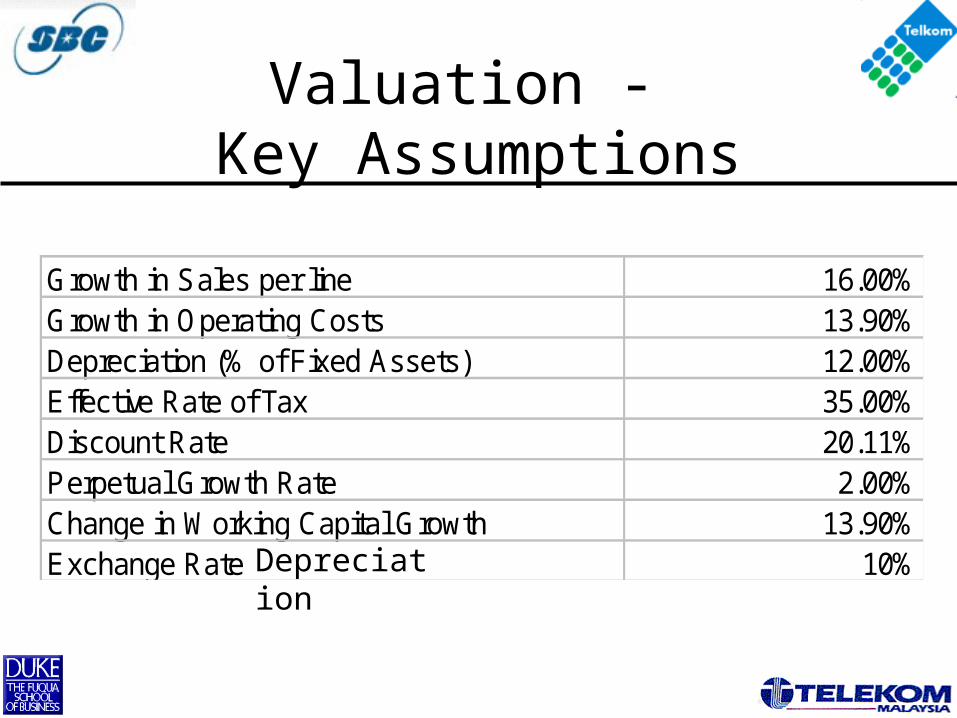
Valuation - Key Assumptions
Growth in Sales per line 16.00%Growth in Operating Costs 13.90%Depreciation (% of Fixed Assets) 12.00%Effective Rate of Tax 35.00%Discount Rate 20.11%Perpetual Growth Rate 2.00%Change in Working Capital Growth 13.90%Exchange Rate 10%Depreciation
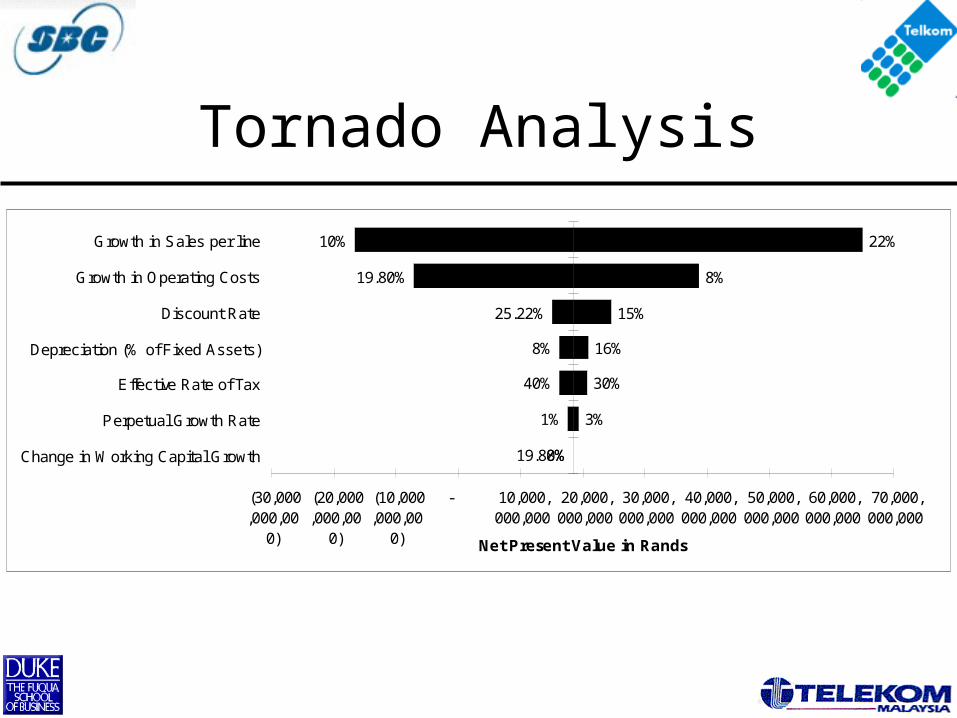
Tornado Analysis
10%
8%
15%
8%
30%
1%
8%
22%
19.80%
25.22%
16%
40%
3%
19.80%
(30,000,000,00
0)
(20,000,000,00
0)
(10,000,000,00
0)
- 10,000,000,000
20,000,000,000
30,000,000,000
40,000,000,000
50,000,000,000
60,000,000,000
70,000,000,000
Growth in Sales per line
Growth in Operating Costs
Discount Rate
Depreciation (% of Fixed Assets)
Effective Rate of Tax
Perpetual Growth Rate
Change in Working Capital Growth
Net Present Value in Rands
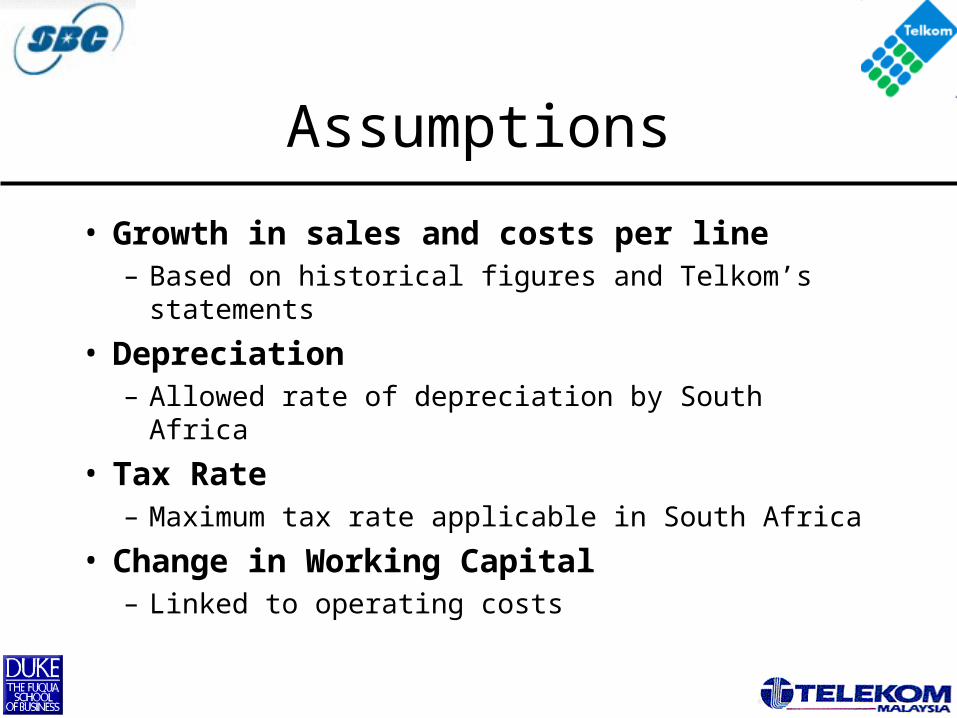
Assumptions
• Growth in sales and costs per line– Based on historical figures and Telkom’s
statements
• Depreciation– Allowed rate of depreciation by South Africa
• Tax Rate– Maximum tax rate applicable in South Africa
• Change in Working Capital– Linked to operating costs
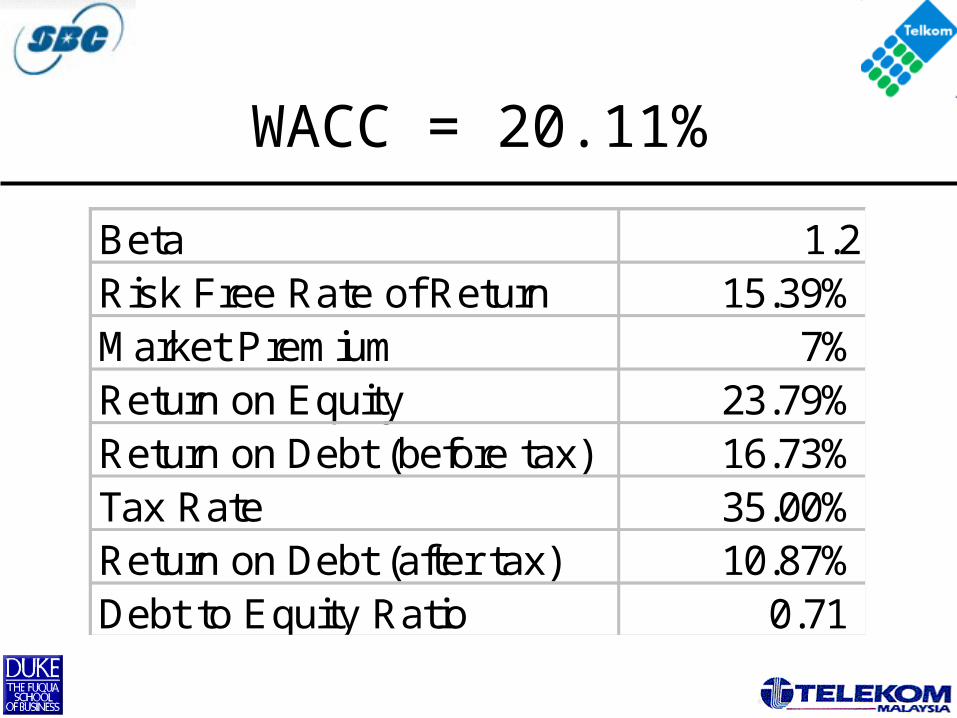
WACC = 20.11%
Beta 1.2Risk Free Rate of Return 15.39%Market Premium 7%Return on Equity 23.79%Return on Debt (before tax) 16.73%Tax Rate 35.00%Return on Debt (after tax) 10.87%Debt to Equity Ratio 0.71
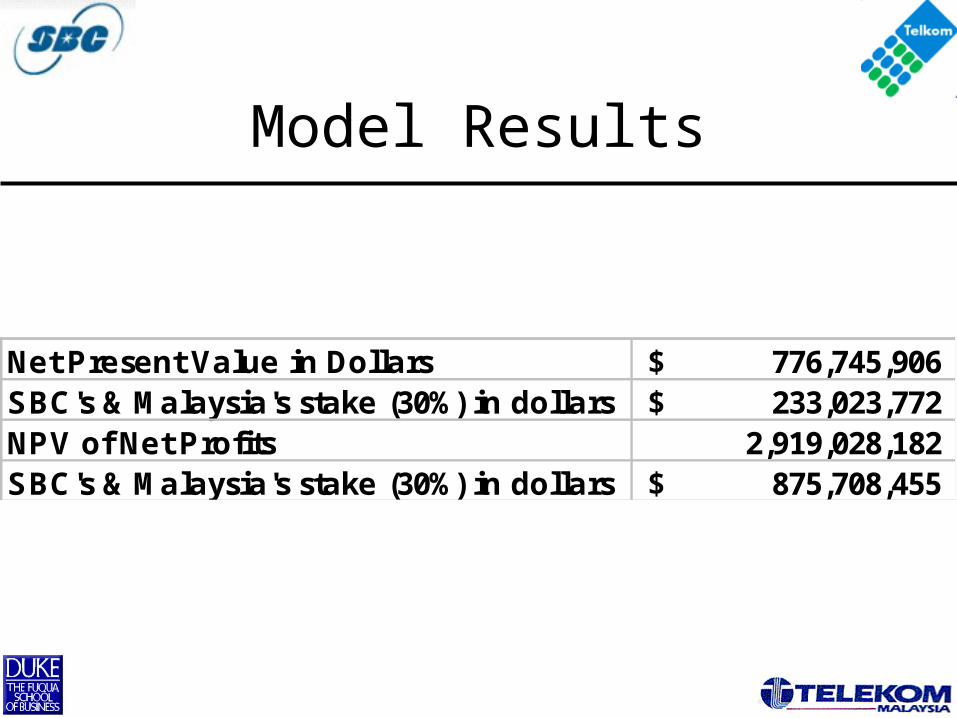
Model Results
Net Present Value in Dollars 776,745,906$ SBC's & Malaysia's stake (30%) in dollars 233,023,772$ NPV of Net Profits 2,919,028,182 SBC's & Malaysia's stake (30%) in dollars 875,708,455$