Embed Size (px)
Citation preview

Tennis Ball Stiffness and Durability E59 Project
19 December 2008
Ryan Carmichael
1
Table of Contents
Abstract……………………….…………………………………………..2
Introduction……………………………………………………………….3
Technical Discussion……………………………………………………..3
Experimental Setup and Procedure……………………………………….6
Wearing Setup…………………………………………………….7
Wearing Procedure………………………………………………..7
Pre-compression…………………………………………………..8
Testing Setup……………………………………………………...8
Testing Procedure…………………………………………………9
Results and Discussion………………………………………………..…10
Conclusions……………………………………………………………....13
Acknowledgements………………………………………………………14
References………………………………………………………………..14
Appendices……………………………………………………………….15
Appendix A: Test Data…………………………………………...15
Appendix B: Presentation Slides…………………………………17
Appendix C: ITF Testing Standards…………………………......22
2
Abstract______________________________________________________
Changes to tennis balls stiffnesses were compared after individual wearing
regimens of 20, 40, 50, 55, 70, and 80 impacts at either 37 or 45 mph. The 45 mph impact
speed was found to consistently soften balls to a greater degree than the 37 mph impact
speed. Additionally, further impacts oscillated between softening and hardening the balls,
while the balls as an overall trend progressively softened. These results are likely due to a
combination of accelerated internal pressure loss and the effect of impact on the polymer
molecules that make up the rubber core of the ball.
3
Introduction__________________________________________________
As properties of tennis balls have become better defined in the past several years,
the International Tennis Federation or ITF, as well as other leading sports researchers,
have begun to study the durability of tennis balls. On the professional level, the
degradation of tennis balls due to match wear is typically corrected for by replacing the
six balls used at any one time in a match with new balls after every nine games of play.
On the US collegiate level, the three balls used are replaced with fresh balls after every
set (minimum of six games) for division one play and every two sets (minimum of twelve
games) for division two and three play. Due to the absence of a strict ITF standard, these
ball change standards are based largely on a compromise between fiscal reasonability and
tennis players’ “feel” for changes to the ball.
Along with qualities such as texture and bounce height, a player’s “feel” is largely
based on the stiffness of the ball, which is generally thought to decrease slowly over play.
Stiffness plays a large role in a player’s “feel”, as the server will often select which ball
to serve based on a quick squeeze test of potential balls. Balls with greater stiffness
contact the racket for less time during a hit than softer balls, resulting in a significant
difference in control and reaction forces felt by the player’s arm. For particularly soft
balls, such forces can lead to injury such as tennis elbow. Despite the significant effect of
change in ball stiffness on play, little research has been done to investigate how or why
the stiffness of the tennis ball changes over play, with one major exception being a 2003
study by Capel-Davies and Miller of the ITF.
Technical Discussion___________________________________________
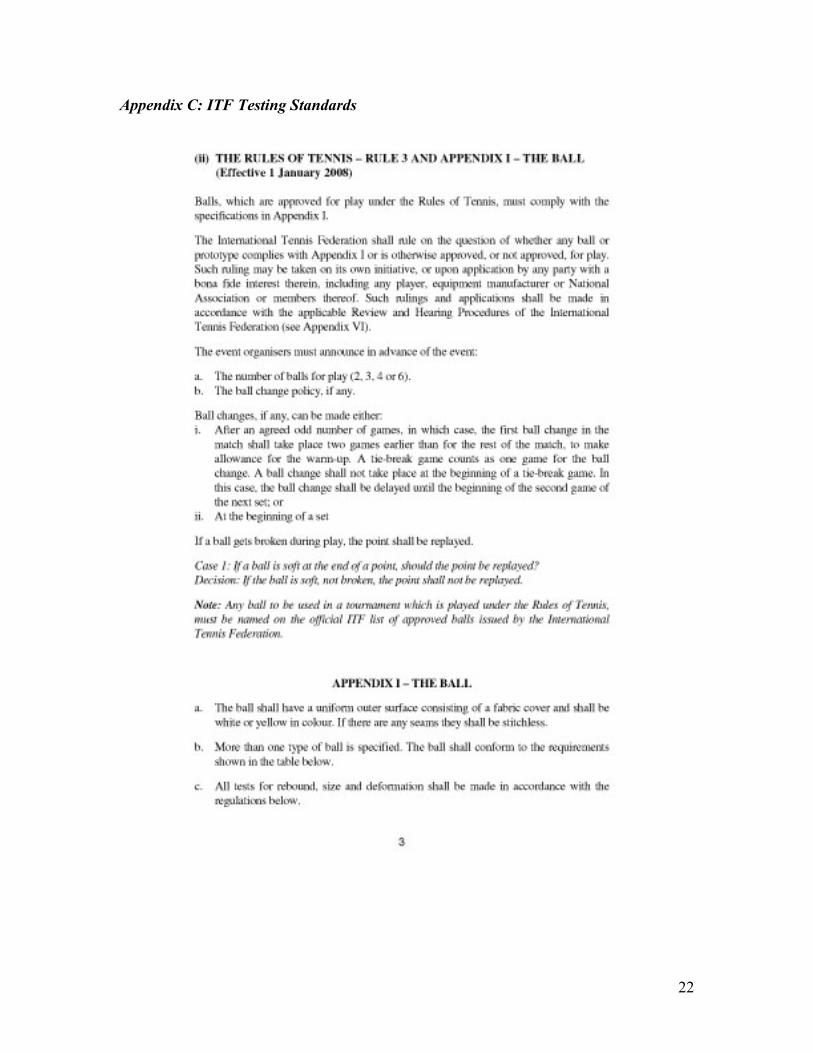
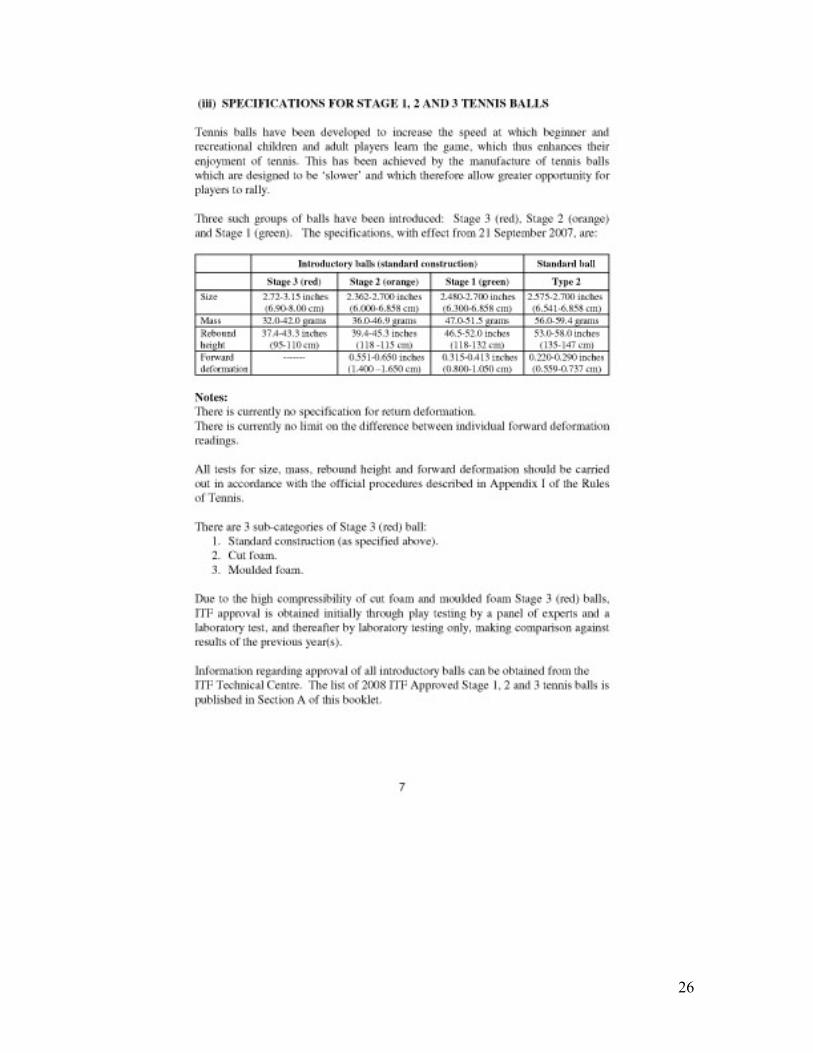
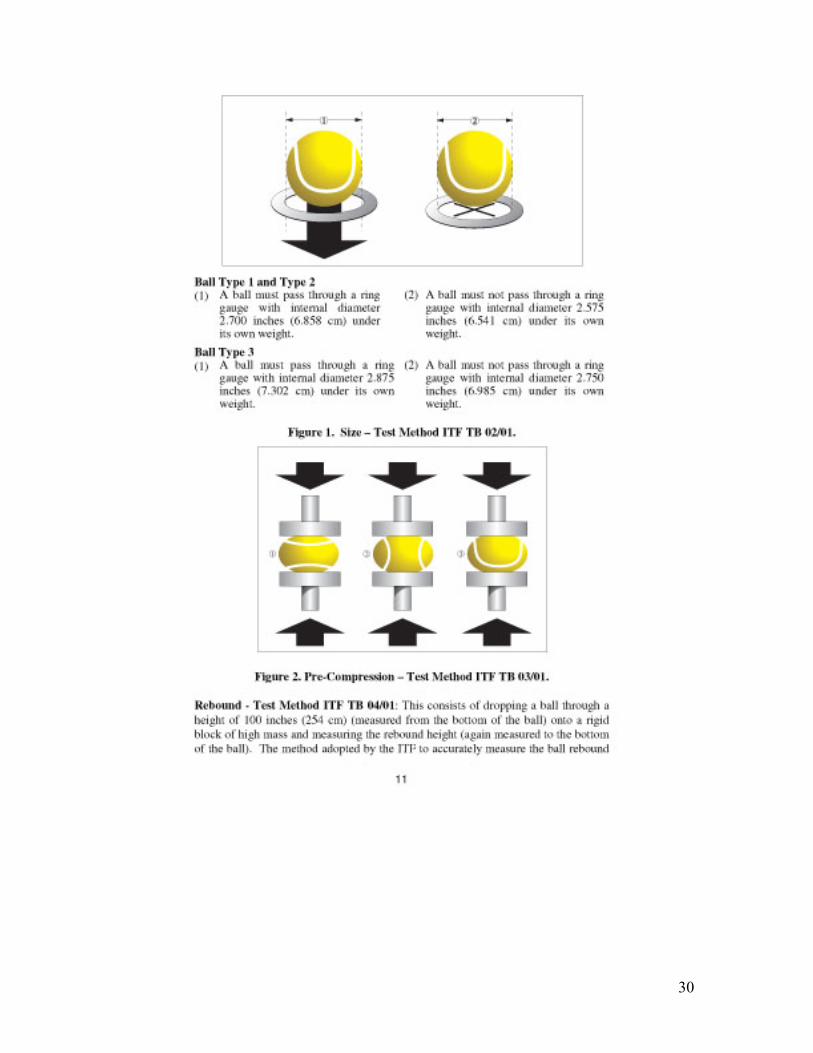
For a specific brand of tennis ball to be approved for use in an ITF standardized
game of tennis, it must pass five standard ITF approval tests, including those for return
and forward deformation, the two components of the approval testing that test ball
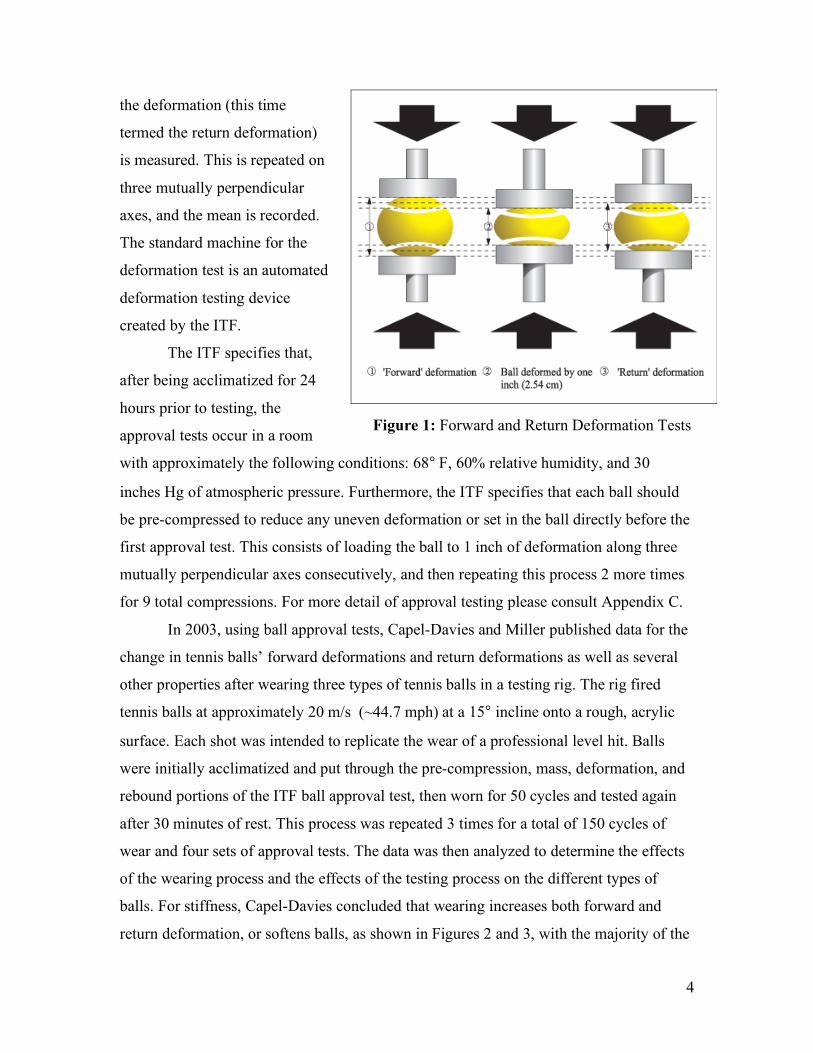
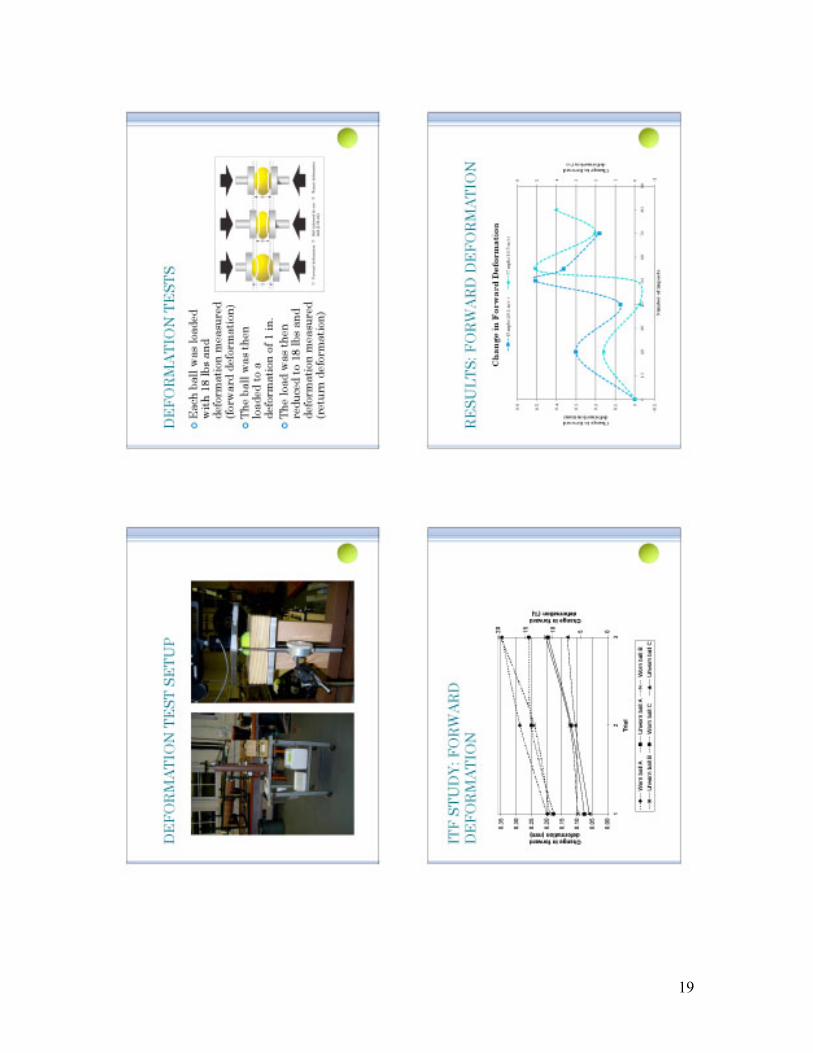
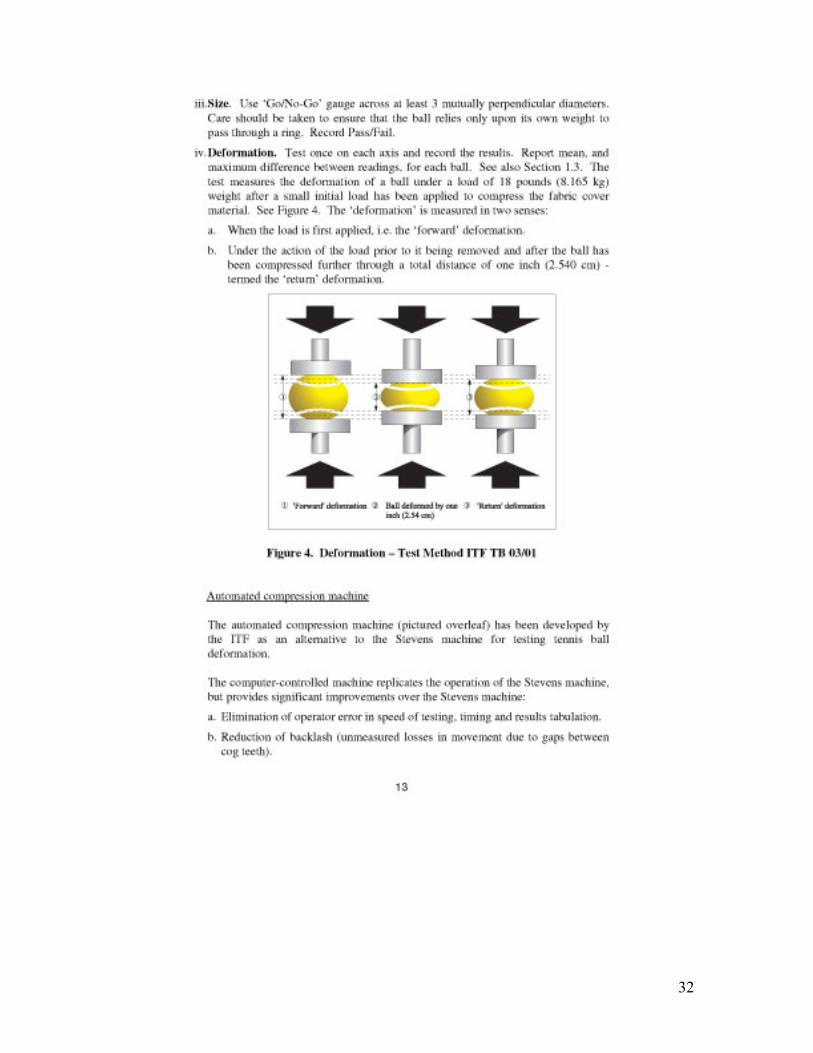
stiffness. The ITF deformation tests (shown in Figure 1) consist of the following steps: a
load of 18 lbs is applied to the tennis ball and deformation of the diameter of the ball is
measured and recorded. This is the forward deformation. The ball is then loaded to a
deformation of 1 inch, after which the load is smoothly removed back to 18 lbs and again
4
the deformation (this time
termed the return deformation)
is measured. This is repeated on
three mutually perpendicular
axes, and the mean is recorded.
The standard machine for the
deformation test is an automated
deformation testing device
created by the ITF.
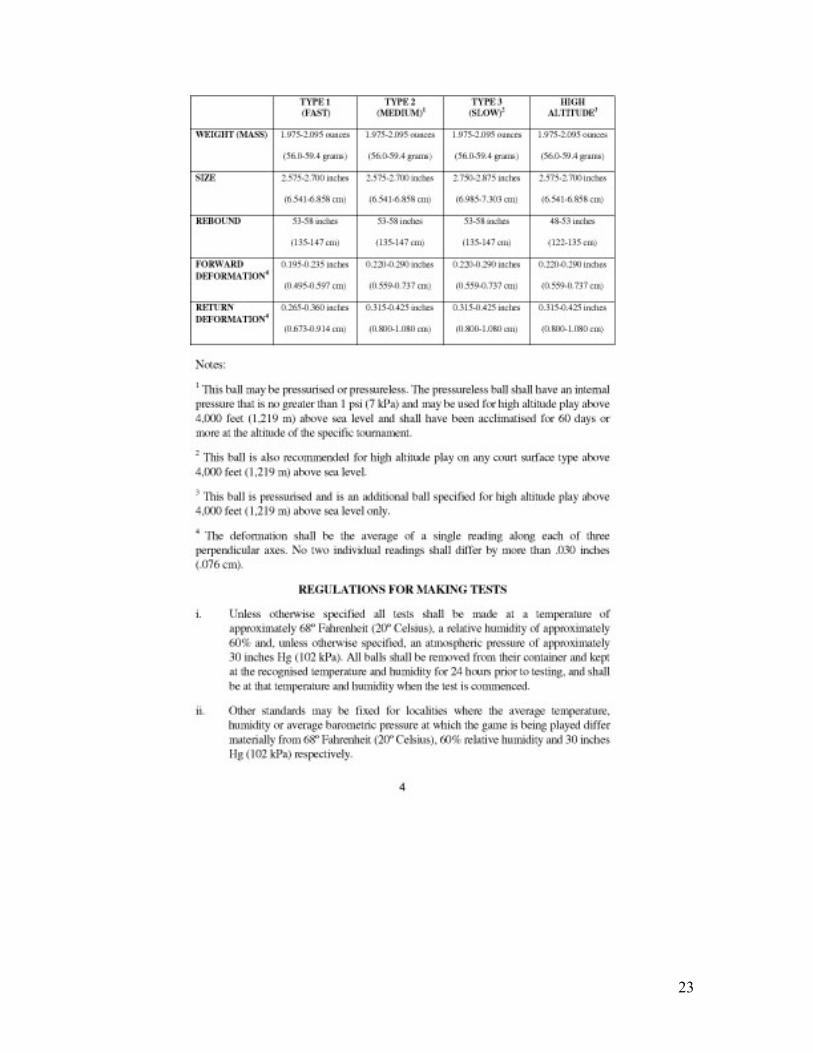
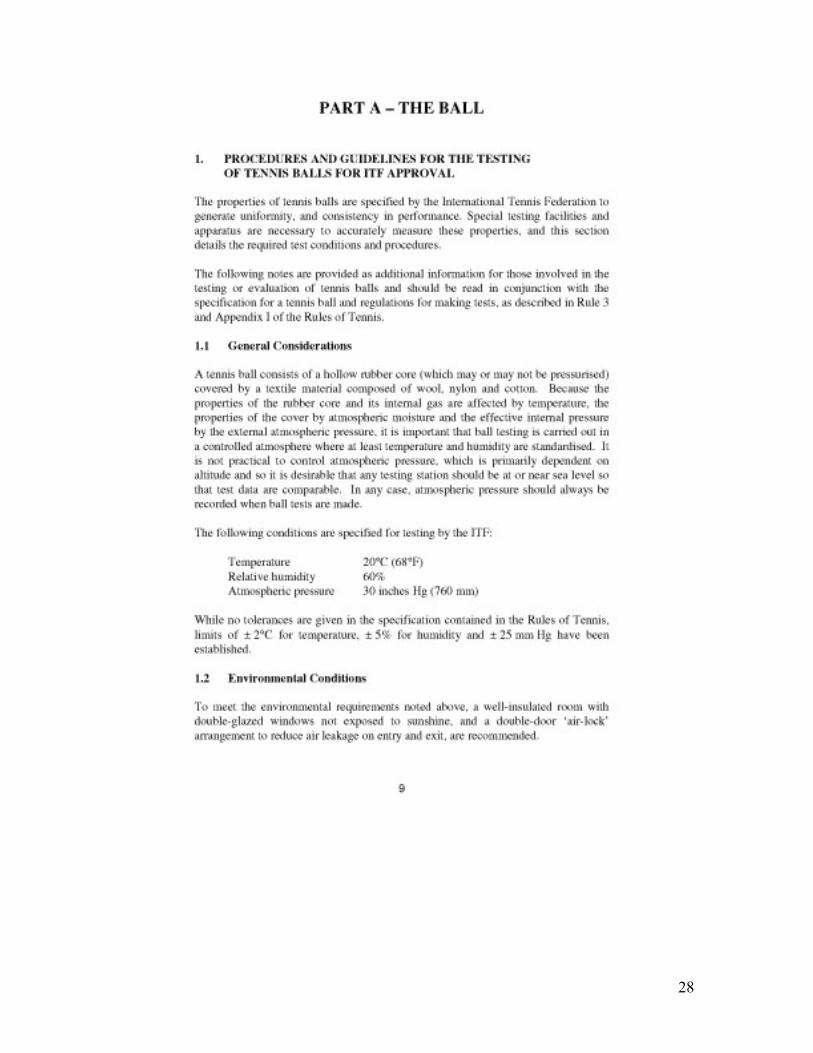
The ITF specifies that,
after being acclimatized for 24
hours prior to testing, the
approval tests occur in a room
with approximately the following conditions: 68° F, 60% relative humidity, and 30
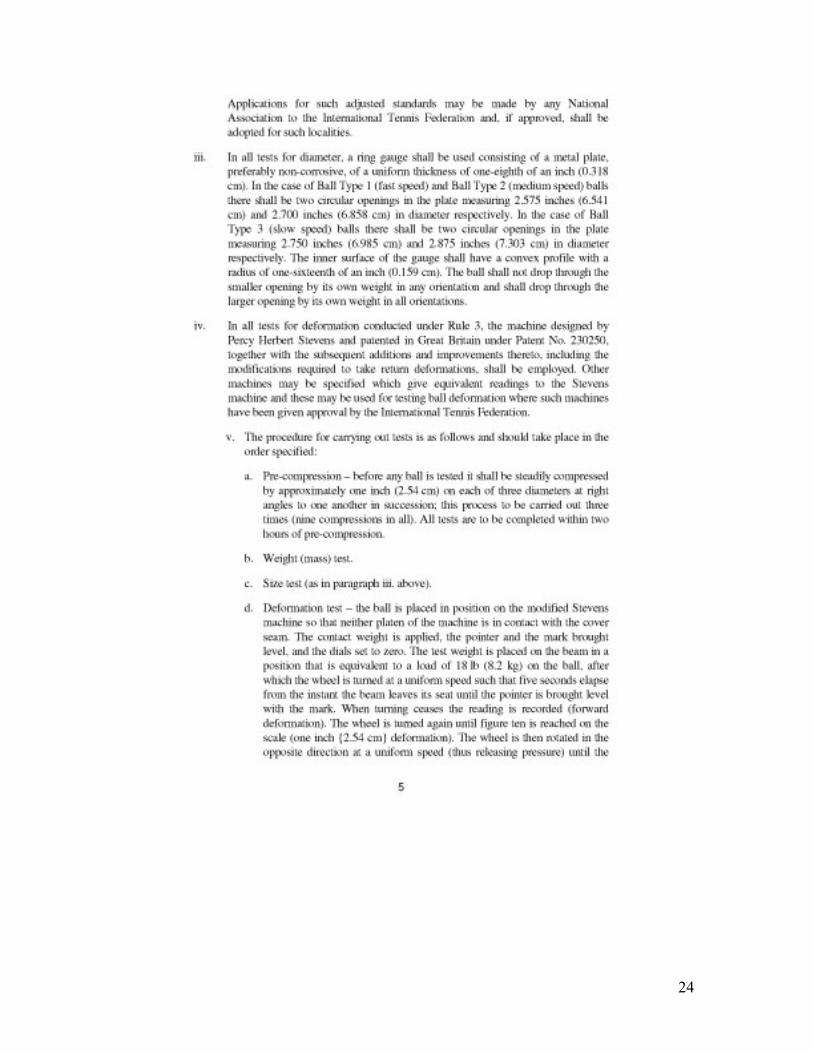
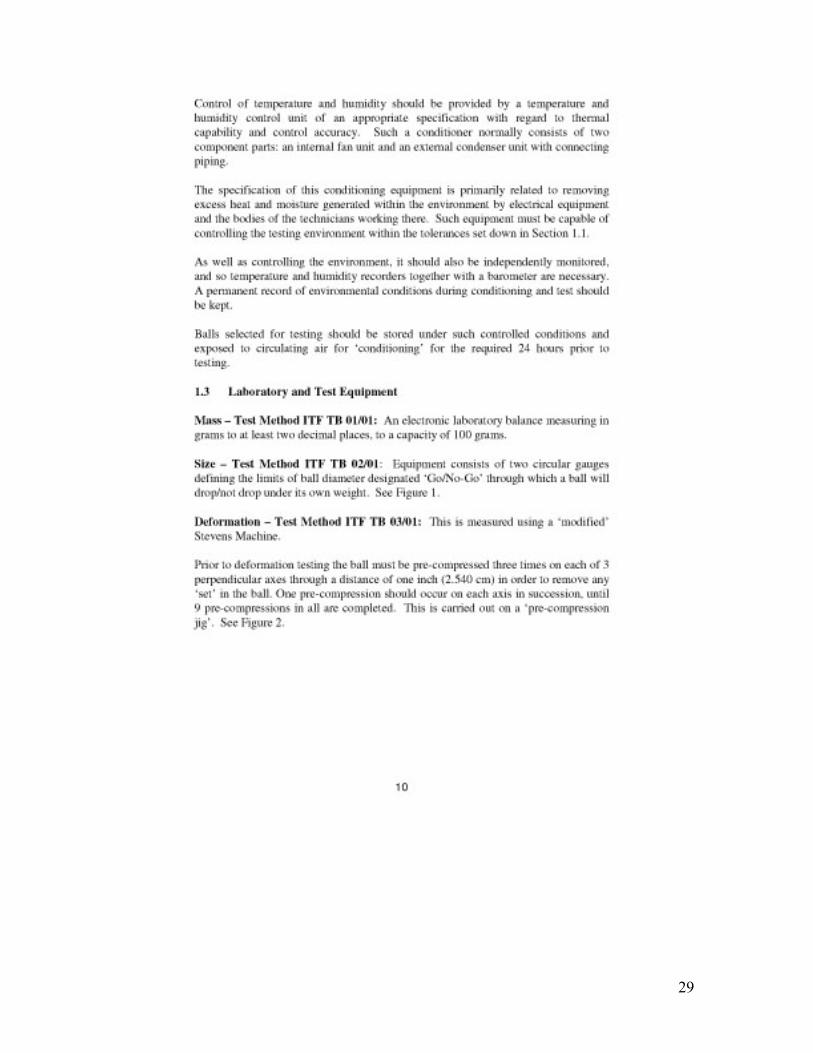
inches Hg of atmospheric pressure. Furthermore, the ITF specifies that each ball should
be pre-compressed to reduce any uneven deformation or set in the ball directly before the
first approval test. This consists of loading the ball to 1 inch of deformation along three
mutually perpendicular axes consecutively, and then repeating this process 2 more times
for 9 total compressions. For more detail of approval testing please consult Appendix C.
In 2003, using ball approval tests, Capel-Davies and Miller published data for the
change in tennis balls’ forward deformations and return deformations as well as several
other properties after wearing three types of tennis balls in a testing rig. The rig fired
tennis balls at approximately 20 m/s (~44.7 mph) at a 15° incline onto a rough, acrylic
surface. Each shot was intended to replicate the wear of a professional level hit. Balls
were initially acclimatized and put through the pre-compression, mass, deformation, and
rebound portions of the ITF ball approval test, then worn for 50 cycles and tested again
after 30 minutes of rest. This process was repeated 3 times for a total of 150 cycles of
wear and four sets of approval tests. The data was then analyzed to determine the effects
of the wearing process and the effects of the testing process on the different types of
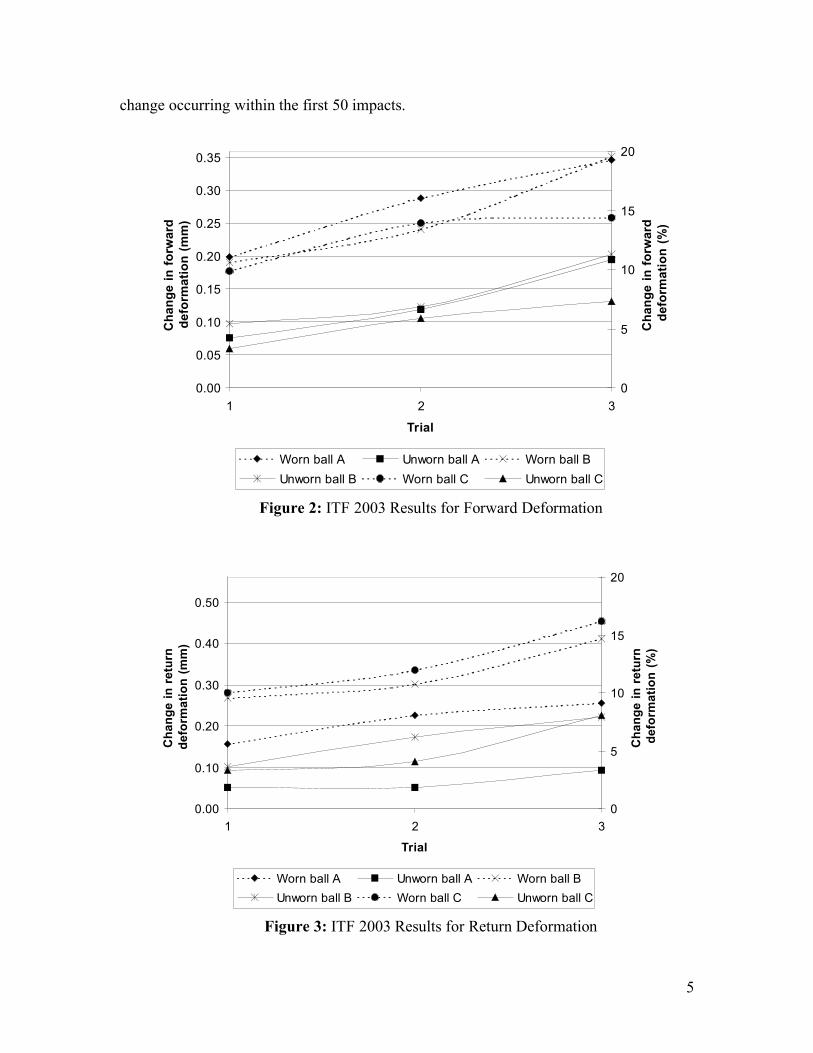
balls. For stiffness, Capel-Davies concluded that wearing increases both forward and
return deformation, or softens balls, as shown in Figures 2 and 3, with the majority of the
Figure 1: Forward and Return Deformation Tests
5
change occurring within the first 50 impacts.
Figure 2: ITF 2003 Results for Forward Deformation
Figure 3: ITF 2003 Results for Return Deformation
0.00
0.05
0.10
0.15
0.20
0.25
0.30
0.35
1 2 3
Trial
Ch
an
ge
in
fo
rwa
rd
de
form
ati
on
(m
m)
0
5
10
15
20
Ch
an
ge
in
fo
rwa
rd
de
form
ati
on
(%
)
Worn ball A Unworn ball A Worn ball B
Unworn ball B Worn ball C Unworn ball C
0.00
0.10
0.20
0.30
0.40
0.50
1 2 3
Trial
Ch
an
ge
in
re
turn
de
form
ati
on
(m
m)
0
5
10
15
20
Ch
an
ge
in
re
turn
de
form
ati
on
(%
)
Worn ball A Unworn ball A Worn ball B
Unworn ball B Worn ball C Unworn ball C
6
These results are supported by the 2006 work of Cubitt and Bramley of the
University of Bath, who claim that the major contributor to ball softening is air leaking
out of tennis balls’ rubber cores. They assert that because of the low-density polymers
used in tennis ball cores, the balls are relatively permeable by liquids and gases. Internal
pressure is lost by diffusion, adsorption, and desorption, with the latter two also
contributing to the degradation of the mechanical properties of the rubber cores, leading
to more rapid pressure loss. The low density of the polymers allows surrounding
mediums with moveable molecules to permeate the core’s molecular structure. This
stress-creating process causes tiny cracks to form, which propagate, resulting in more
rapid pressure loss and ball softening
Experimental Setup and Procedure_______________________________
The experimental procedure was carried out in three separate two-day testing
sequences. The first day consisted of wearing the tennis balls by shooting the balls
against a painted concrete wall. Approximately 24 hours later, the balls were put through
adaptations of the pre-compression and deformation test portions of the ITF ball-approval
testing.
It should be noted that while, for feasibility purposes, the testing procedure for
this project did not follow the ITF ball approval standards very precisely, the procedure
was kept consistent between test days. For instance, the compression method was slower
than that specified in the standards, and the balls were not tested under perfect, lab-
controlled atmospheric conditions. Because of these discrepancies, results cannot be
measured directly to those from true ball approval tests. However, because test methods
are consistent from ball to ball and from day to day, and because the results are measured
in stiffness changes from control balls exposed to identical atmospheric conditions, the
results accurately show the relationship between velocity of impact, number of impacts,
and ball stiffness, which is the goal of this project.
7
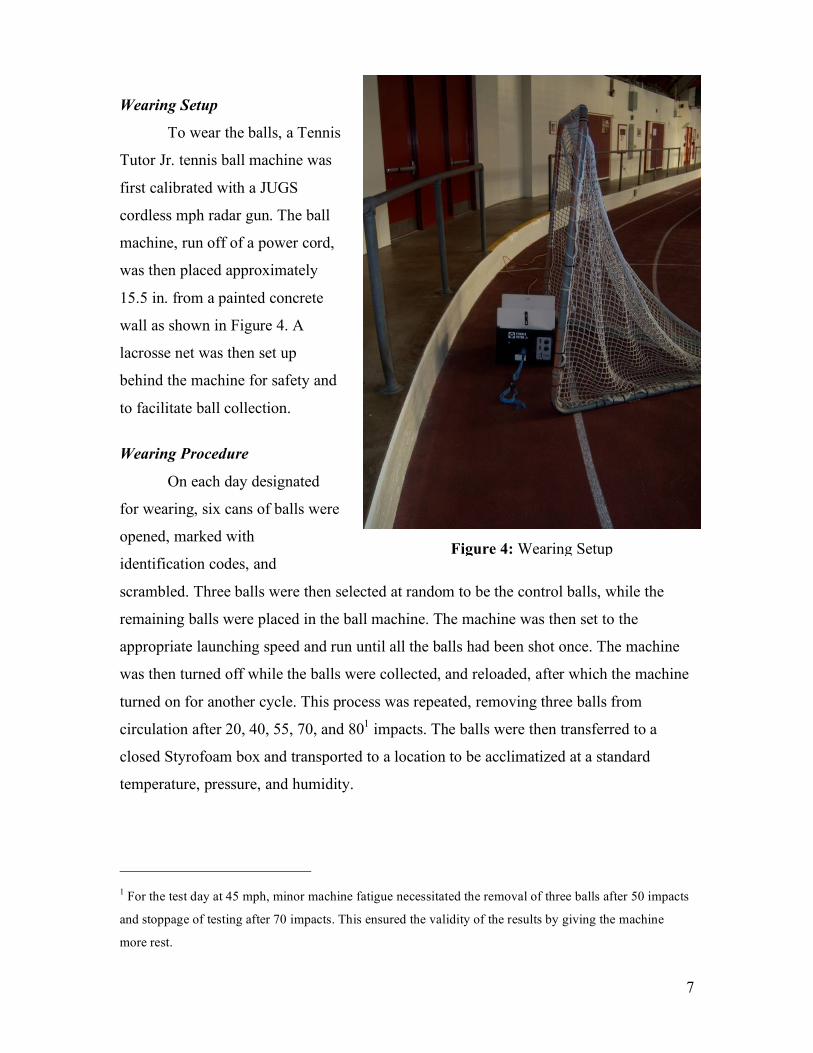
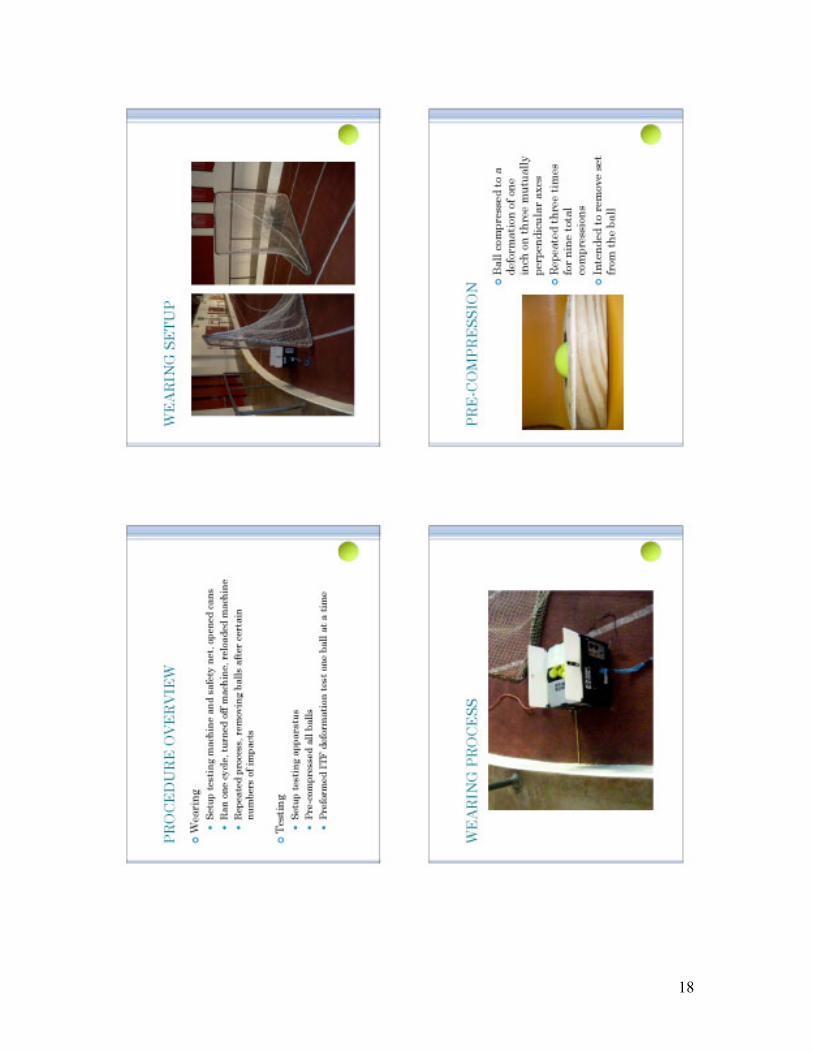
Wearing Setup
To wear the balls, a Tennis
Tutor Jr. tennis ball machine was
first calibrated with a JUGS
cordless mph radar gun. The ball
machine, run off of a power cord,
was then placed approximately
15.5 in. from a painted concrete
wall as shown in Figure 4. A
lacrosse net was then set up
behind the machine for safety and
to facilitate ball collection.
Wearing Procedure
On each day designated
for wearing, six cans of balls were
opened, marked with
identification codes, and
scrambled. Three balls were then selected at random to be the control balls, while the
remaining balls were placed in the ball machine. The machine was then set to the
appropriate launching speed and run until all the balls had been shot once. The machine
was then turned off while the balls were collected, and reloaded, after which the machine
turned on for another cycle. This process was repeated, removing three balls from
circulation after 20, 40, 55, 70, and 801 impacts. The balls were then transferred to a
closed Styrofoam box and transported to a location to be acclimatized at a standard
temperature, pressure, and humidity.
1 For the test day at 45 mph, minor machine fatigue necessitated the removal of three balls after 50 impacts
and stoppage of testing after 70 impacts. This ensured the validity of the results by giving the machine
more rest.
Figure 4: Wearing Setup
8
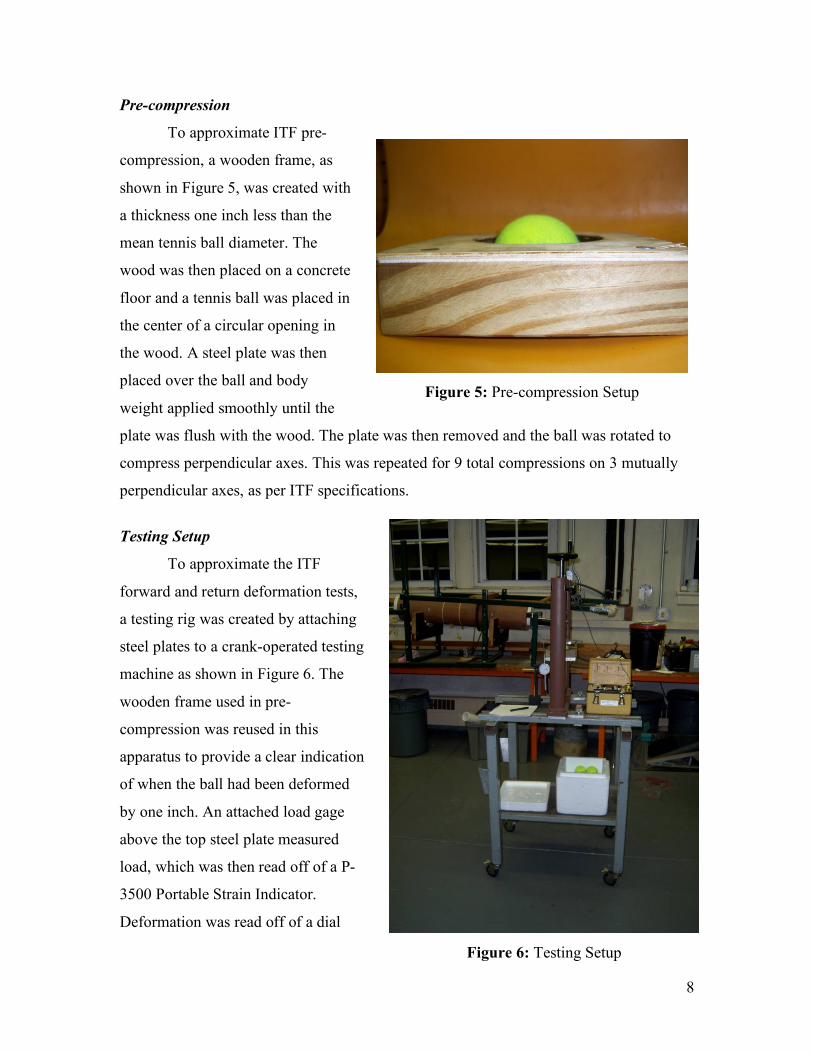
Pre-compression
To approximate ITF pre-
compression, a wooden frame, as
shown in Figure 5, was created with
a thickness one inch less than the
mean tennis ball diameter. The
wood was then placed on a concrete
floor and a tennis ball was placed in
the center of a circular opening in
the wood. A steel plate was then
placed over the ball and body
weight applied smoothly until the
plate was flush with the wood. The plate was then removed and the ball was rotated to
compress perpendicular axes. This was repeated for 9 total compressions on 3 mutually
perpendicular axes, as per ITF specifications.
Testing Setup
To approximate the ITF
forward and return deformation tests,
a testing rig was created by attaching
steel plates to a crank-operated testing
machine as shown in Figure 6. The
wooden frame used in pre-
compression was reused in this
apparatus to provide a clear indication
of when the ball had been deformed
by one inch. An attached load gage
above the top steel plate measured
load, which was then read off of a P-
3500 Portable Strain Indicator.
Deformation was read off of a dial
Figure 5: Pre-compression Setup
Figure 6: Testing Setup
9
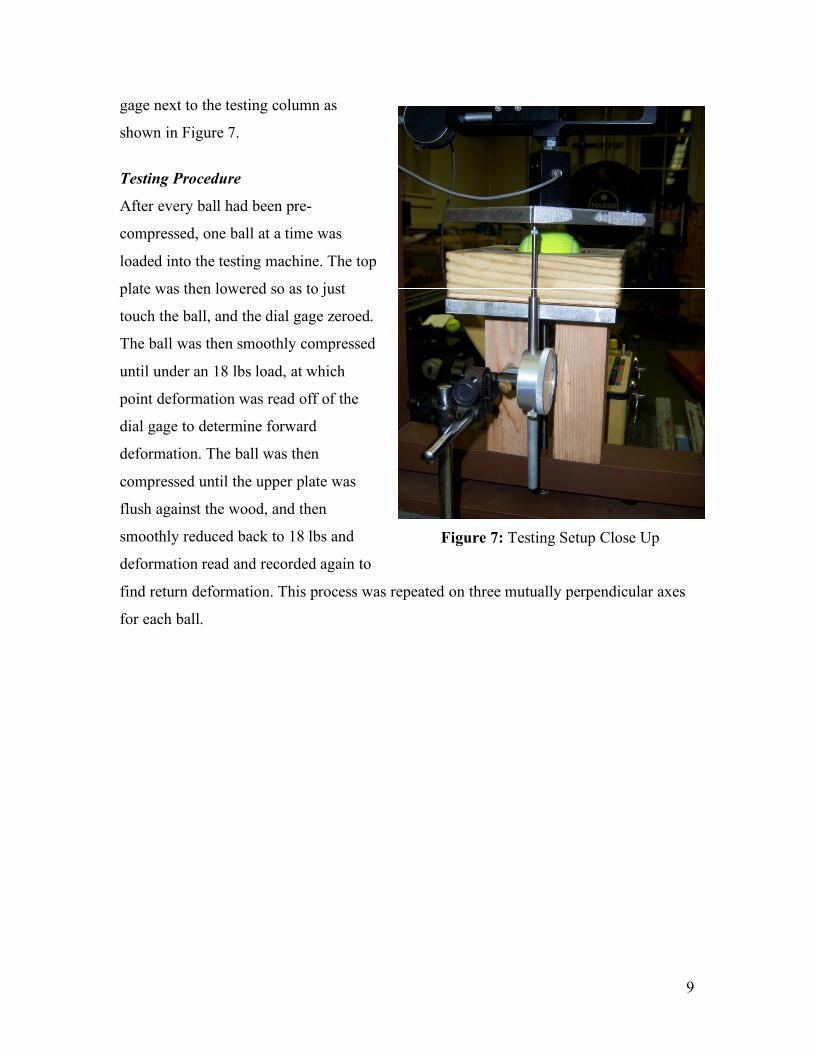
gage next to the testing column as
shown in Figure 7.
Testing Procedure
After every ball had been pre-
compressed, one ball at a time was
loaded into the testing machine. The top
plate was then lowered so as to just
touch the ball, and the dial gage zeroed.
The ball was then smoothly compressed
until under an 18 lbs load, at which
point deformation was read off of the
dial gage to determine forward
deformation. The ball was then
compressed until the upper plate was
flush against the wood, and then
smoothly reduced back to 18 lbs and
deformation read and recorded again to
find return deformation. This process was repeated on three mutually perpendicular axes
for each ball.
Figure 7: Testing Setup Close Up
10
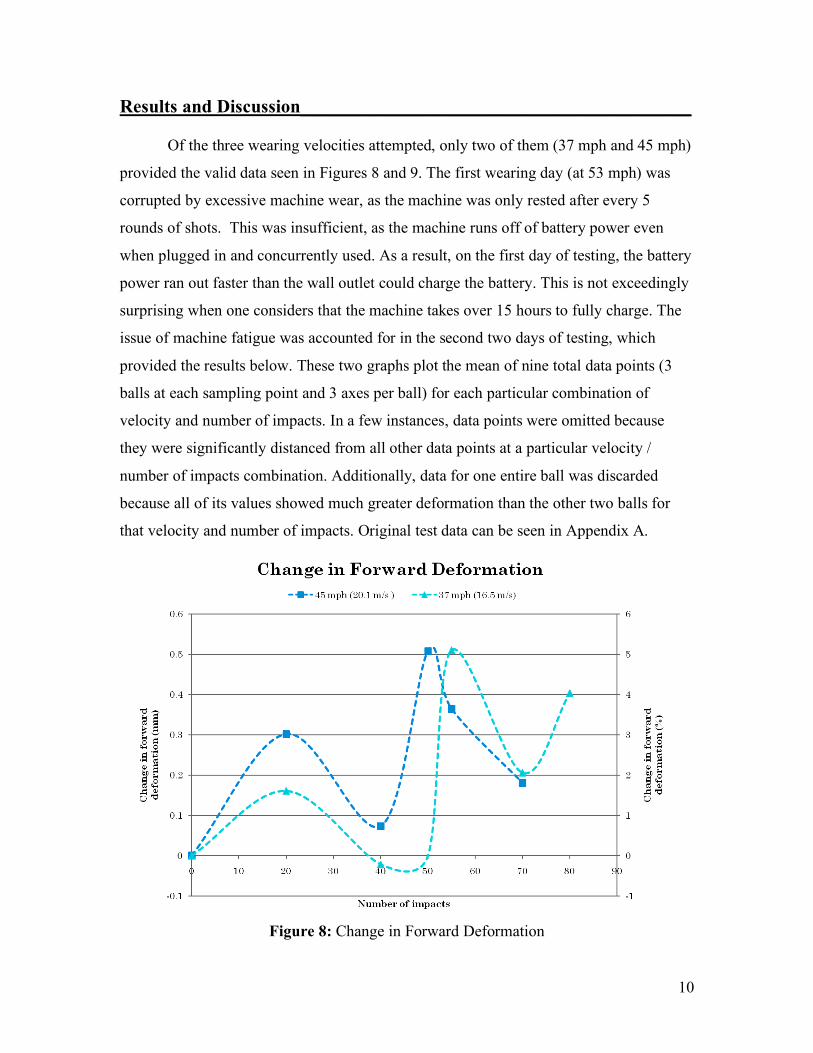
Results and Discussion__________________________________________
Of the three wearing velocities attempted, only two of them (37 mph and 45 mph)
provided the valid data seen in Figures 8 and 9. The first wearing day (at 53 mph) was
corrupted by excessive machine wear, as the machine was only rested after every 5
rounds of shots. This was insufficient, as the machine runs off of battery power even
when plugged in and concurrently used. As a result, on the first day of testing, the battery
power ran out faster than the wall outlet could charge the battery. This is not exceedingly
surprising when one considers that the machine takes over 15 hours to fully charge. The
issue of machine fatigue was accounted for in the second two days of testing, which
provided the results below. These two graphs plot the mean of nine total data points (3
balls at each sampling point and 3 axes per ball) for each particular combination of
velocity and number of impacts. In a few instances, data points were omitted because
they were significantly distanced from all other data points at a particular velocity /
number of impacts combination. Additionally, data for one entire ball was discarded
because all of its values showed much greater deformation than the other two balls for
that velocity and number of impacts. Original test data can be seen in Appendix A.
Figure 8: Change in Forward Deformation
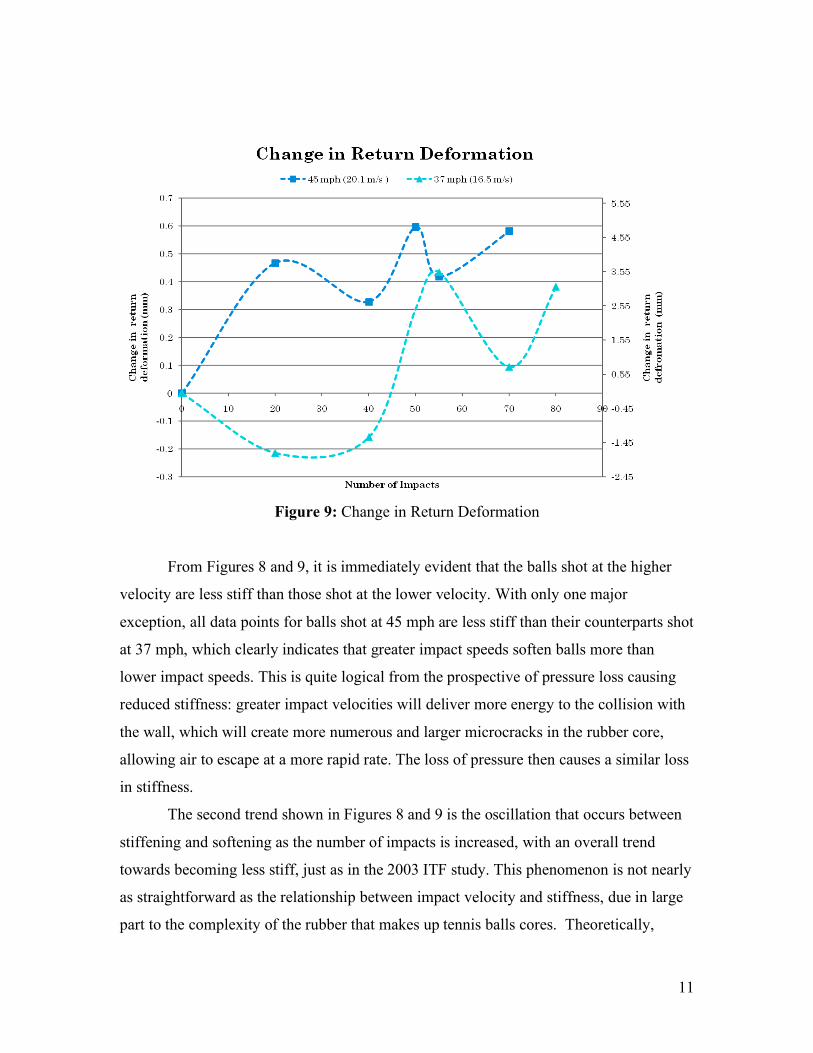
11
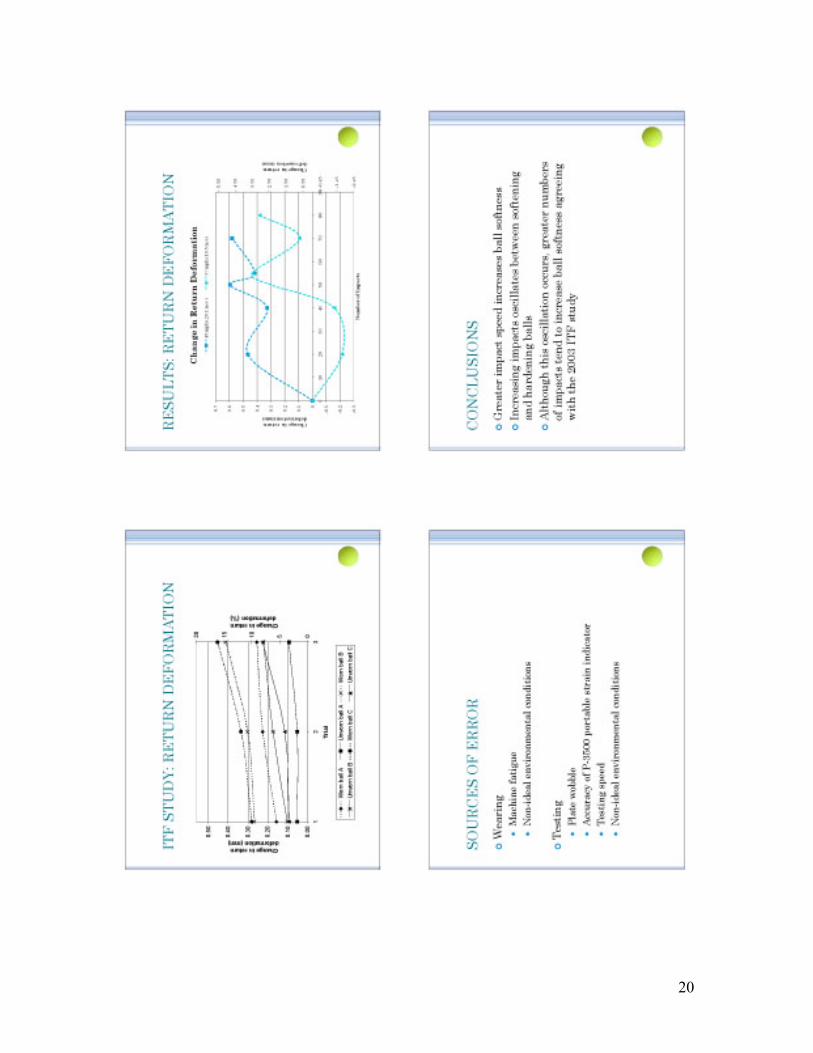
Figure 9: Change in Return Deformation
From Figures 8 and 9, it is immediately evident that the balls shot at the higher
velocity are less stiff than those shot at the lower velocity. With only one major
exception, all data points for balls shot at 45 mph are less stiff than their counterparts shot
at 37 mph, which clearly indicates that greater impact speeds soften balls more than
lower impact speeds. This is quite logical from the prospective of pressure loss causing
reduced stiffness: greater impact velocities will deliver more energy to the collision with
the wall, which will create more numerous and larger microcracks in the rubber core,
allowing air to escape at a more rapid rate. The loss of pressure then causes a similar loss
in stiffness.
The second trend shown in Figures 8 and 9 is the oscillation that occurs between
stiffening and softening as the number of impacts is increased, with an overall trend
towards becoming less stiff, just as in the 2003 ITF study. This phenomenon is not nearly
as straightforward as the relationship between impact velocity and stiffness, due in large
part to the complexity of the rubber that makes up tennis balls cores. Theoretically,
12
tennis balls have two major modes of changing stiffness: changes to the internal pressure
of the ball, and changes to the material making up the rubber core of the ball. As the
pressure change in the ball is only likely to be a pressure loss with repeated impacts, the
general trend of balls softening can be attributed to a slow leaking of air that causes a
drop in internal pressure. The oscillating nature of hardening and softening then must be
attributed to the more complex changes in the material itself.
The rubber cores, consisting mainly of vulcanized natural rubber, are comprised
of many polymer molecules, which have a tendency to coil as opposed to stretching into
straight lines. This coiling causes molecules to get tangled together, increasing the
stiffness of the rubber. Similarly, if the polymer chains straighten out, as they often do in
tension, then the stiffness of the rubber decreases. Additionally, under certain
circumstances, chains have the ability to chemically bond to each other creating cross-
links, which act as a more stable form of entanglement and stiffens the rubber. Such a
chemical reaction can be induced when the necessary activation energy is supplied
through exposure to UV rays or heat. The impact of a tennis ball with a concrete wall
creates enough heat to allow such a reaction to happen, but it also has enough impact
energy to break said bonds. Additionally, the tension and compression that impact creates
on various parts of the ball is significant enough to both entangle and straighten
polymers. As such, it is difficult to pin point exactly why this processes lines up to
oscillate between stiffening and softening the ball, and so the determination of the cause
of the oscillation will have to be left to future work, focused on the material changes
from a more chemically-focused perspective.
Finally, attention should be called to the data point in the return deformation
graph for 20 impacts at 37 mph. This point is the only major data point out of twenty total
points that does not fit the oscillation pattern. It is probably a representation of the error
inherent to the testing process adding constructively. The major inaccuracies of testing
were all known from before the testing ever started: compression speed wouldn’t be
uniform, the P-3500 was only accurate to the pound, and the top plate, off of which
deformation was measured, wobbled when the hand crank was turned. Recognition of
these sources of error from the beginning of testing led to a conscious effort to perform
the testing as uniformly as possible, and to disregard any individual data points that
13
deviated drastically from the mean. To address the testing speed concern, timing was
practiced such that deformation times were consistent within about two seconds. P-3500
accuracy was addressed by ceasing to turn the hand crank about a quarter turn past when
the P-3500 first read 18 lbs. Wobble was accounted for by using the same gentle two-
handed turning method throughout testing. By being as consistent as humanly possible,
the hope was that any machine error would add destructively, leaving accurate results.
This methodology appears to have worked reasonably well as only one of twenty major
data points appears significantly flawed.
Conclusions___________________________________________________ Faster impact velocities consistently soften balls to a greater degree than their
slower velocities, probably by creating larger microcracks in the tennis ball’s rubber core,
from which internal pressure is more rapidly lost. Additionally, further impacts oscillate
between softening and stiffening the balls, while the balls, as an overall trend,
progressively soften. This overall trend is likely a result of pressure loss, while the
oscillations are due to the complicated impact interactions of the low-density polymer
molecules that make up the rubber core of the ball.
14
Acknowledgements_____________________________________________
-Professor Faruq Siddiqui for insightful feedback and direction
-Grant L. Smith, Jr. for the configuration of the crank testing machine
-Ben Yagoda for use of the Tennis Tutor ball machine
-Stan Exeter for use of the JUGS radar gun
-Christyn Chambers for access the Swarthmore College Fieldhouse
-Jeremy Loomis for the acquisition of tennis balls
-James Spurr, Jamie Capel-Davies, and Meg Spencer for research assistance
References ___________________________________________________
Capel-Davies, J. and Miller, S. (2003) Durability of tennis balls worn in a test rig. Tennis
Science & Technology 2 (edited by S. Miller), pp. 113-121. London: International
Tennis Federation.
Hodgkins, Philip, Steve Rothberg, and Mike Caine. "Degradation of Tennis Balls and
their Recovery." Engineering of Sport 6 3 (2006): 63-68.
International Tennis Federation (2007). Rules of Tennis 2007. London: International
Tennis Federation
"ITF Approved Tennis Balls and Classified Court Surfaces: a guide to products and test
methods." International Tennis Federation: London, 2008.
"ITF Tennis: Technical." <http://www.itftennis.com/technical/> October 2008.
Spurr, J. and Capel-Davies, J. (2007) Tennis ball durability: simulation of real play in the
laboratory. Tennis Science & Technology 3 (edited by J. Capel-Davies), pp. 41-49.
London: International Tennis Federation.
Steele, Carolyn, Roy Jones, and Paul Leaney. "Factors in Tennis Ball Wear." Engineering
of Sport 6 1 (2006): 373-378.
"Theory of rubber conformation." University of Cambridge: DoITPoMS Teaching and
Learning Packages. 8 Dec. 2017 <www.doitpoms.ac.uk/tlplib/stiffness-of-
rubber/rubber-conformation.php >.
15
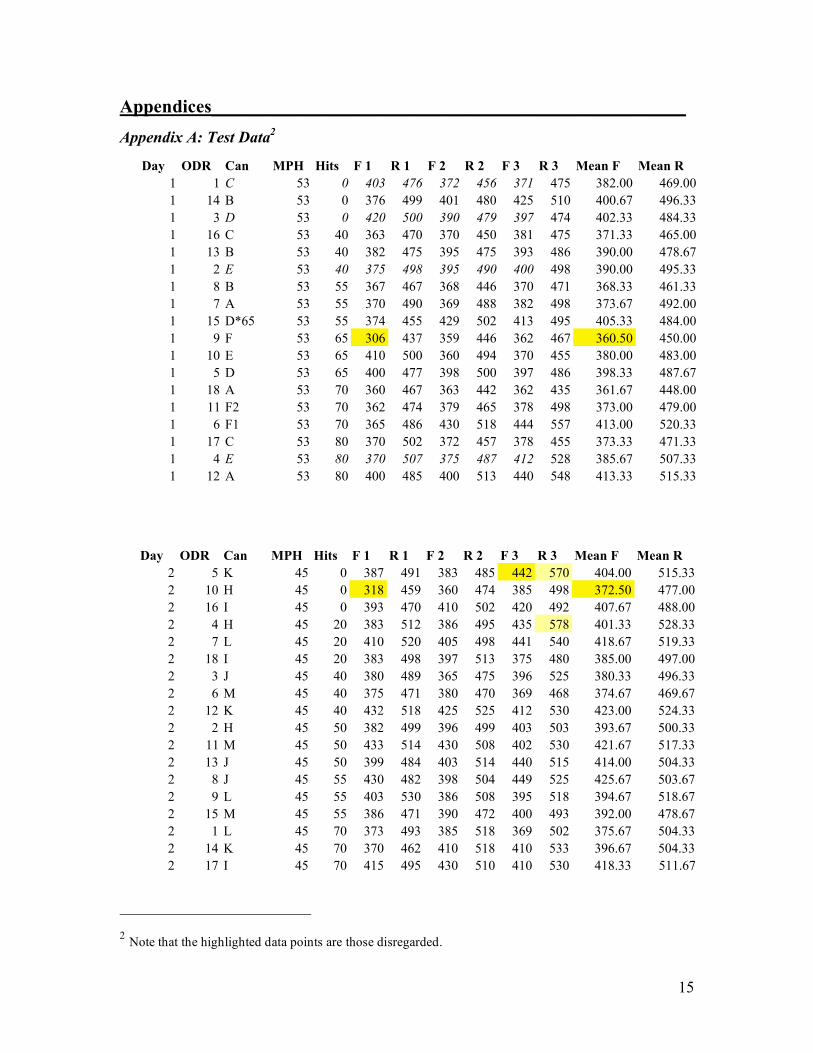
Appendices___________________________________________________ Appendix A: Test Data2
2 Note that the highlighted data points are those disregarded.
Day ODR Can MPH Hits F 1 R 1 F 2 R 2 F 3 R 3 Mean F Mean R
1 1 C 53 0 403 476 372 456 371 475 382.00 469.00
1 14 B 53 0 376 499 401 480 425 510 400.67 496.33
1 3 D 53 0 420 500 390 479 397 474 402.33 484.33
1 16 C 53 40 363 470 370 450 381 475 371.33 465.00
1 13 B 53 40 382 475 395 475 393 486 390.00 478.67
1 2 E 53 40 375 498 395 490 400 498 390.00 495.33
1 8 B 53 55 367 467 368 446 370 471 368.33 461.33
1 7 A 53 55 370 490 369 488 382 498 373.67 492.00
1 15 D*65 53 55 374 455 429 502 413 495 405.33 484.00
1 9 F 53 65 306 437 359 446 362 467 360.50 450.00
1 10 E 53 65 410 500 360 494 370 455 380.00 483.00
1 5 D 53 65 400 477 398 500 397 486 398.33 487.67
1 18 A 53 70 360 467 363 442 362 435 361.67 448.00
1 11 F2 53 70 362 474 379 465 378 498 373.00 479.00
1 6 F1 53 70 365 486 430 518 444 557 413.00 520.33
1 17 C 53 80 370 502 372 457 378 455 373.33 471.33
1 4 E 53 80 370 507 375 487 412 528 385.67 507.33
1 12 A 53 80 400 485 400 513 440 548 413.33 515.33
Day ODR Can MPH Hits F 1 R 1 F 2 R 2 F 3 R 3 Mean F Mean R
2 5 K 45 0 387 491 383 485 442 570 404.00 515.33
2 10 H 45 0 318 459 360 474 385 498 372.50 477.00
2 16 I 45 0 393 470 410 502 420 492 407.67 488.00
2 4 H 45 20 383 512 386 495 435 578 401.33 528.33
2 7 L 45 20 410 520 405 498 441 540 418.67 519.33
2 18 I 45 20 383 498 397 513 375 480 385.00 497.00
2 3 J 45 40 380 489 365 475 396 525 380.33 496.33
2 6 M 45 40 375 471 380 470 369 468 374.67 469.67
2 12 K 45 40 432 518 425 525 412 530 423.00 524.33
2 2 H 45 50 382 499 396 499 403 503 393.67 500.33
2 11 M 45 50 433 514 430 508 402 530 421.67 517.33
2 13 J 45 50 399 484 403 514 440 515 414.00 504.33
2 8 J 45 55 430 482 398 504 449 525 425.67 503.67
2 9 L 45 55 403 530 386 508 395 518 394.67 518.67
2 15 M 45 55 386 471 390 472 400 493 392.00 478.67
2 1 L 45 70 373 493 385 518 369 502 375.67 504.33
2 14 K 45 70 370 462 410 518 410 533 396.67 504.33
2 17 I 45 70 415 495 430 510 410 530 418.33 511.67
16
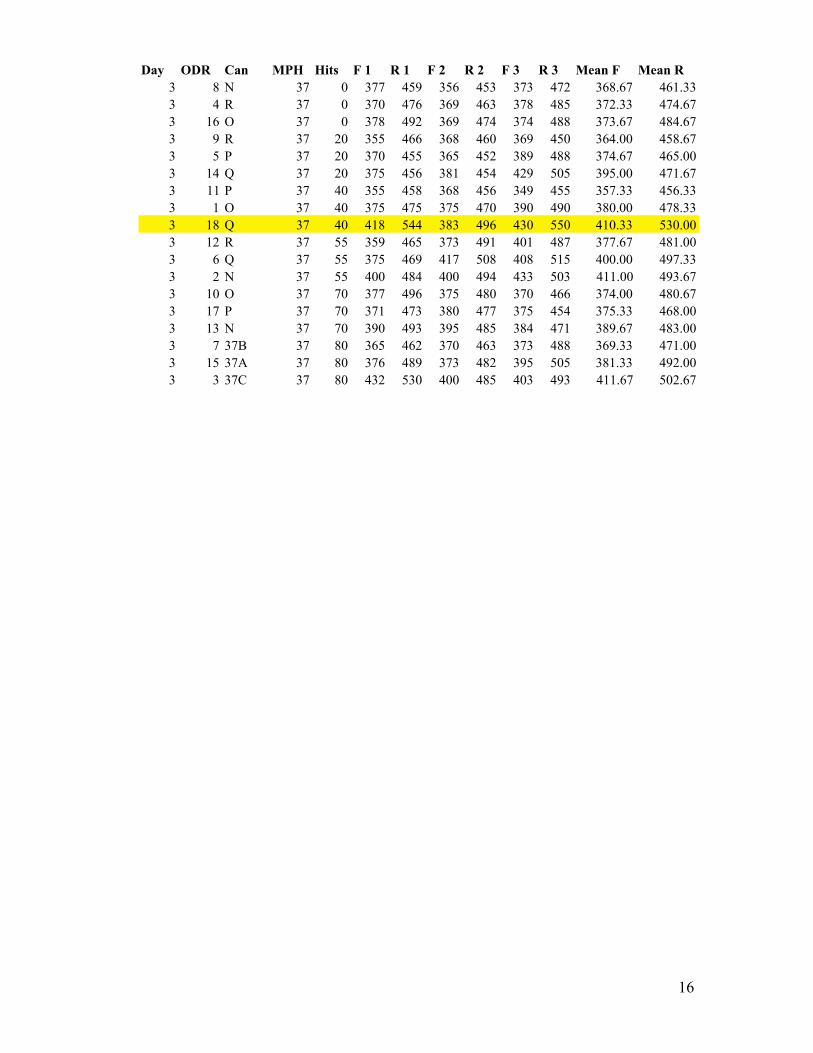
Day ODR Can MPH Hits F 1 R 1 F 2 R 2 F 3 R 3 Mean F Mean R
3 8 N 37 0 377 459 356 453 373 472 368.67 461.33
3 4 R 37 0 370 476 369 463 378 485 372.33 474.67
3 16 O 37 0 378 492 369 474 374 488 373.67 484.67
3 9 R 37 20 355 466 368 460 369 450 364.00 458.67
3 5 P 37 20 370 455 365 452 389 488 374.67 465.00
3 14 Q 37 20 375 456 381 454 429 505 395.00 471.67
3 11 P 37 40 355 458 368 456 349 455 357.33 456.33
3 1 O 37 40 375 475 375 470 390 490 380.00 478.33
3 18 Q 37 40 418 544 383 496 430 550 410.33 530.00
3 12 R 37 55 359 465 373 491 401 487 377.67 481.00
3 6 Q 37 55 375 469 417 508 408 515 400.00 497.33
3 2 N 37 55 400 484 400 494 433 503 411.00 493.67
3 10 O 37 70 377 496 375 480 370 466 374.00 480.67
3 17 P 37 70 371 473 380 477 375 454 375.33 468.00
3 13 N 37 70 390 493 395 485 384 471 389.67 483.00
3 7 37B 37 80 365 462 370 463 373 488 369.33 471.00
3 15 37A 37 80 376 489 373 482 395 505 381.33 492.00
3 3 37C 37 80 432 530 400 485 403 493 411.67 502.67
17
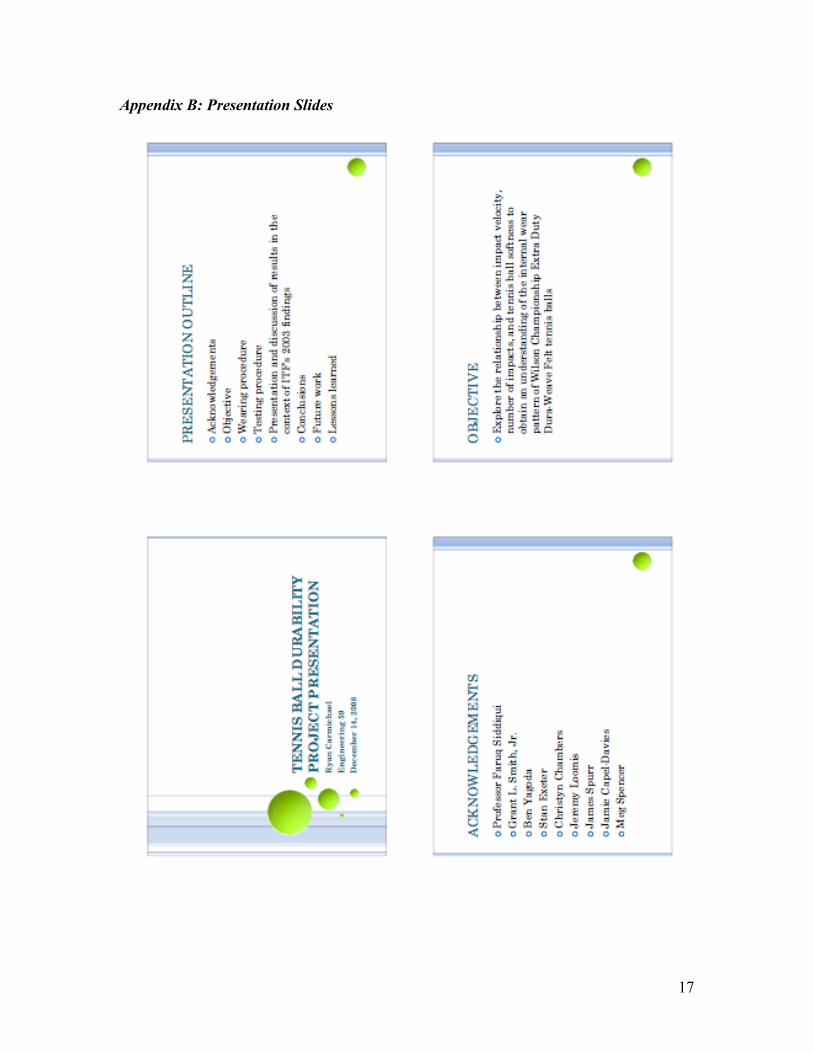
Appendix B: Presentation Slides
18
19
20
21
22
Appendix C: ITF Testing Standards
23
24
25
26
27
28
29
30
31
32
33
34