Embed Size (px)
Citation preview
This PDF is a selection from an out-of-print volume from the NationalBureau of Economic Research
Volume Title: Inflation: Causes and Effects
Volume Author/Editor: Robert E. Hall
Volume Publisher: University of Chicago Press
Volume ISBN: 0-226-31323-9
Volume URL: http://www.nber.org/books/hall82-1
Publication Date: 1982
Chapter Title: The Anatomy of Double-Digit Inflation in the 1970s
Chapter Author: Alan S. Blinder
Chapter URL: http://www.nber.org/chapters/c11462
Chapter pages in book: (p. 261 - 282)

12 The Anatomy ofDouble-Digit Inflationin the 1970sAlan S. Blinder
12.1 Introduction and Summary
The 1970s was the decade of inflation in the United States. While it maybe surprising to some that the average inflation rate for the decade as awhole was only 6.8%, this rate is double the long-run historical averageand nearly triple the rate of the previous two decades (see table 12.1). Inaddition to the high average inflation rate, we were plagued by extremelyvariable inflation rates during the 1970s. In both respects, the 1970s hadmuch in common with the 1940s and were very different from the 1960s(see table 12.1 again).
This paper seeks to explain inflation in the 1970s, and especially thetwo episodes of "double-digit" inflation: 1974 and 1979-80. There aremany parallels between the 1973-75 period and the 1978-80 period. Theunderlying nature of the two inflationary episodes was much the same;food and energy "shocks" precipitated both. In both periods, inflationwas very uneven; some prices rose extremely rapidly while others rosemoderately. Thus the inflation of the 1970s was accompanied by substan-tial changes in relative prices. The direction of causation here is notobvious; indeed, causation is unlikely to have been entirely unidirec-tional. While it is now part of the conventional wisdom that high rates ofinflation cause changes in relative prices, I wish to propound the viewhere that the lines of causation during the 1970s ran mostly the other way:large unavoidable adjustments in relative prices bred inflation.
Alan S. Blinder is professor of economics at Princeton University and a research associateof the National Bureau of Economic Research.
The opinions expressed are those of the author and not the NBER or the National ScienceFoundation. Research assistance from Danny Quah and helpful comments from the mem-bers of the NBER Project on Inflation are gratefully acknowledged.
261

262
Table
Alan
12.1
S. Blinder
Historical
Period
Inflation Data,
MeanInflation
1930-80
RateStandardDeviation
1930-401940-501950-601960-701970-80
-1.10%6.35%2.38%2.56%6.85%
5.733.471.521.292.20
1930-80 3.41% 4.38
Source: Bureau of Economic Analysis.Note: Based on implicit deflator for personal consumption expenditures, annual data.
The paper is organized as follows. After some general introductoryremarks on analyzing inflation (section 12.2), section 12.3 offers a briefrundown of the major events that conspired to produce double-digitinflation in 1974. For the most part, this section is an overly terse sum-mary of a recent book of mine on the Great Stagflation of the mid-1970s(Blinder 1979, especially chapters 5 and 6). Readers seeking furtherdetails are referred to the book. Section 12.4, by far the longest of thepaper, chronicles in much more detail—because it has not been chroni-cled before—the burst of inflation in 1978-80, pointing out similarities toand contrasts with the earlier episode. Finally, section 12.5 deals with anobjection that has often been raised to the type of inflation analysispresented here: if relative price shocks "caused" the inflation of the1970s, why did they not also cause rapid inflation in the 1950s and 1960s? Iwill argue that, the theorist's desire for tidiness and uniformity notwith-standing, the 1970s really were different.
A list of some of the major conclusions may be useful at the outset.1. The dramatic acceleration of inflation between 1972 and 1974 can
be traced mainly to three "shocks": rising food prices, rising energyprices, and the end of the Nixon wage-price controls program. Each ofthese can be conceptualized as requiring rapid adjustments of somerelative prices.
2. The equally dramatic deceleration of inflation between 1974 and1976 can be traced to the simple fact that the three factors just namedwere not repeated. In other words, double-digit inflation went away "byitself."
3. The state of demand thus had precious little to do with either theacceleration or the deceleration of inflation between 1972 and 1976. Thisis not to say that aggregate demand management was irrelevant toinflation, but only that it effects were minor compared to the supplyshocks.

263 Anatomy of Double-Digit Inflation in the 1970s
4. While the rate of inflation as measured in the CPI rose about eightpercentage points between 1977 and early 1980, the "baseline," or"underlying," rate may have risen by as little as three percentage points.The rest of the inflationary acceleration came from "special factors."
5. The initial impetus for accelerating inflation in 1978 came mainlyfrom the food sector, with some help from mortgage interest rates. Thefurther acceleration into the double-digit range in 1979 mainly reflectedsoaring energy prices and, once again, rising mortgage rates. Finally,mortgage interest carried the ball almost by itself in early 1980.
6. The 1970s really were different. Energy shocks are quite clearly aproduct of the brave, new post-OPEC world. Food shocks are not new. Weexperienced them in the 1940s, but somehow managed to get awaywithout them in the 1950s and 1960s.
12.2 The Two Inflations
Before marshaling the evidence, it will be useful to outline a concep-tual framework into which the facts can be fitted. I claim, and will try todocument in what follows, that the data support a story about inflation inthe contemporary United States that goes something like this.1
1. At any given moment, there is a normal, or "baseline," inflationrate toward which the actual inflation rate tends to gravitate. (This rate isalso referred to as the "underlying," or "core," rate of inflation.) Thisbaseline rate is determined by fundamental economic forces, basically asthe difference between the growth rates of aggregate demand and aggre-gate supply.
2. On the demand side, the weight of the historical evidence is that thegrowth rate of money is the dominant factor in the long run. It is in thisvery limited sense that Milton Friedman's famous dictum "Inflation isalways and everywhere a monetary phenomenon" has some validity.However, other factors like fiscal policy also influence the growth rate ofaggregate demand. On the supply side, the fundamental long-run force isthe trend rate of change of productivity, though occasional abrupt restric-tions in aggregate supply (so-called supply shocks) can dominate thesupply picture over short periods.
3. For empirical purposes, the baseline rate of inflation can be mea-sured either by the rate of change of wages minus the trend rate of changeof productivity2 or by the rate of change of prices exclusive of food prices,energy prices, and mortgage interest rates. The latter measure of baselineinflation is relied upon here.
4. The observed rate of inflation can deviate markedly from the base-line rate over short periods. The major reasons for such deviations areobvious from the empirical definition of the baseline rate. Rapid in-
264 Alan S. Blinder
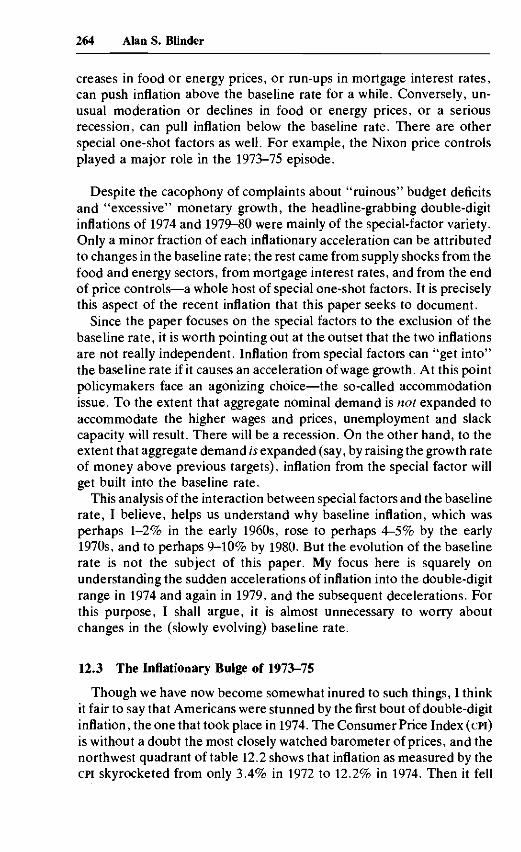
creases in food or energy prices, or run-ups in mortgage interest rates,can push inflation above the baseline rate for a while. Conversely, un-usual moderation or declines in food or energy prices, or a seriousrecession, can pull inflation below the baseline rate. There are otherspecial one-shot factors as well. For example, the Nixon price controlsplayed a major role in the 1973-75 episode.
Despite the cacophony of complaints about "ruinous" budget deficitsand "excessive" monetary growth, the headline-grabbing double-digitinflations of 1974 and 1979-80 were mainly of the special-factor variety.Only a minor fraction of each inflationary acceleration can be attributedto changes in the baseline rate; the rest came from supply shocks from thefood and energy sectors, from mortgage interest rates, and from the endof price controls—a whole host of special one-shot factors. It is preciselythis aspect of the recent inflation that this paper seeks to document.
Since the paper focuses on the special factors to the exclusion of thebaseline rate, it is worth pointing out at the outset that the two inflationsare not really independent. Inflation from special factors can "get into"the baseline rate if it causes an acceleration of wage growth. At this pointpolicymakers face an agonizing choice—the so-called accommodationissue. To the extent that aggregate nominal demand is not expanded toaccommodate the higher wages and prices, unemployment and slackcapacity will result. There will be a recession. On the other hand, to theextent that aggregate demand is expanded (say, by raising the growth rateof money above previous targets), inflation from the special factor willget built into the baseline rate.
This analysis of the interaction between special factors and the baselinerate, I believe, helps us understand why baseline inflation, which wasperhaps 1-2% in the early 1960s, rose to perhaps 4-5% by the early1970s, and to perhaps 9-10% by 1980. But the evolution of the baselinerate is not the subject of this paper. My focus here is squarely onunderstanding the sudden accelerations of inflation into the double-digitrange in 1974 and again in 1979, and the subsequent decelerations. Forthis purpose, I shall argue, it is almost unnecessary to worry aboutchanges in the (slowly evolving) baseline rate.
12.3 The Inflationary Bulge of 1973-75
Though we have now become somewhat inured to such things, I thinkit fair to say that Americans were stunned by the first bout of double-digitinflation, the one that took place in 1974. The Consumer Price Index (CPI)is without a doubt the most closely watched barometer of prices, and thenorthwest quadrant of table 12.2 shows that inflation as measured by theCPI skyrocketed from only 3.4% in 1972 to 12.2% in 1974. Then it fell
265 Anatomy of Double-Digit Inflation in the 1970s
Table 12.2 Inflation Rates in United States, 1972-80
19721973197419751976
1977197819791980:
First halfSecond half
All
CPIa
3.4%8.8%
12.2%7.0%4.8%
6.8%9.0%
13.3%
14.8%9.9%
Items
PCEb
3.7%7.3%
11.0%6.0%5.0%
5.9%7.8%9.5%
11.0%9.1%
Excluding Foodand Energy
CPIa
3.0%4.7%
11.3%6.7%6.1%
6.4%8.5%
11.3%
14.6%9.6%
PCEb
3.3%4.4%9.6%5.7%6.0%
6.1%6.8%7.1%
9.7%8.5%
"Twelve months ending in December of given year.Tour quarters ending in fourth quarter of given year.
almost as rapidly as it had risen, reaching 4.8% in 1976. The deflator forpersonal consumption expenditures (PCE) from the National IncomeAccounts exhibits similar behavior.
The reasons for this performance can be summarized in three words,none of which is "money": food, energy, and decontrol. The boom of1972-73 and the bust of 1974-75 notwithstanding, these three shocksalone can account for almost all of the acceleration and deceleration ofinflation in that period. While aggregate demand did play some role in theaccelerating inflation of 1973-74 and the decelerating inflation of1975-76, its role was minor compared with that of the three aforemen-tioned factors.
12.3.1 The Food Shock
Bad weather conditions both in the United States and, more impor-tantly, in much of the rest of the world sent retail food prices soaring in1973. The CPI for food, which had risen less than 5% during 1972,increased 20% during 1973 and 12% during 1974. This constituted amajor supply shock whose importance, I believe, has still not beenadequately appreciated.
Compare, for example, the inflation rates in the northwest and north-east quadrants of table 12.2. Using the CPI, the inflation rate increased 5.4percentage points from 1972 to 1973. But if food and energy prices areexcluded, the remaining acceleration was only 1.7 percentage points.When we remember that energy prices became a factor only in the closingmonths of 1973, it becomes clear that food prices accounted for most of
266 Alan S. Blinder
this large discrepancy. In fact, the impact of food price increases onoverall inflation probably is even larger than table 12.2 suggests. Foodprice increases, we may assume, get reflected in higher wages, and theresulting wage-price spiral pushes prices still higher. In Blinder (1979), Imade some rough estimates of the total effects of food prices on inflation,including both the direct effects that result from the fact that food is animportant component of the CPI and the indirect effects operating throughthe wage-price spiral. These estimates suggest that food prices accountedfor about 5 percentage points of the overall annual rate of inflationbetween mid-1973 and mid-1975. Some perspective on this is provided byrecalling that a 5% total inflation rate was, until quite recently, con-sidered extraordinarily high for the United States.
12.3.2 The Energy Shock
As is well known, the solidification of the Organization of PetroleumExporting Countries (OPEC) following the Arab-Israeli conflict in October1973 led to a quadrupling of the price of imported crude oil within a veryfew months. While this was an inflationary shock of the first rank, I thinkit important, especially in drawing comparisons with 1979, not to ex-aggerate the inflationary impact of the 1973-74 energy shock.
A direct comparison between the 1974 and 1979 OPEC shocks is post-poned to section 12.4, but a hint that the direct inflationary consequencesof the energy shock were not nearly as great as those of the food shock canbe seen in table 12.2. Inflation rates with and without food and energyprices are much closer together in 1974 (when energy was the majorfactor) than in 1973 (when food was the major factor).
Having issued this disclaimer, I feel compelled to repeat the obvious:energy prices were a major engine of inflation in late 1973 and early 1974.Calculations I made in Blinder (1979) suggest that the direct effects ofhigher energy prices on the PCE deflator raised the latter about 2.4%between 1973:3 and 1974:3. Most of this effect came within two quarters.To this must be added an (admittedly crude) estimate of the energy costs"embodied" in other consumer goods. Perry (1975) estimated this to beanother 1% or so, bringing the total energy shock to the overall pricelevel up to about 3.5%. Indirect effects through the wage-price spiralappear to have been roughly canceled out by the downward pull of therecession on inflation, so that my final estimates of the effects of higherenergy prices on the level of the PCE deflator were 3%, 3.5%, and 4.5% asof the third quarter of 1974, 1975, and 1976, respectively.3 Other re-searchers have come up with similar estimates.
12.3.3 Wage-Price Controls
Despite their obvious importance, it is quite clear from table 12.2 thatfood and energy prices alone cannot explain the acceleration and decel-
267 Anatomy of Double-Digit Inflation in the 1970s
eration of inflation in 1974—75; the ups and downs are just as pronouncedwhen food and energy prices are excluded as when they are included.However, it is not hard to find the culprit behind the gyrating inflationrate for nonfood, nonenergy prices: the imposition and subsequent de-mise of wage-price controls.
The United States began its first, and up to now its only, experimentwith mandatory controls over prices and wages in peacetime when Presi-dent Nixon announced a three-month "freeze" on 15 August 1971. Thecontrols subsequently evolved through several phases before lapsing atthe end of April 1974.
William Newton and I (Blinder and Newton 1981) recently published adetailed econometric study of the effects of controls on nonfood,nonenergy prices. The results are easy to summarize. If we consider afour-year period beginning just before controls started and ending inmid-1975 (long enough after the end of controls to allow for a postcon-trols "catch-up" period), it appears that controls had very little effect onthe average rate of inflation. They did, however, alter the time pattern ofinflation rates considerably—lowering inflation when it would otherwisehave been low (especially in 1972) and raising inflation when it wouldotherwise have been high (especially in 1974). Specifically, we estimatethat the rate of increase of nonfood, nonenergy prices was from 1.1 to 1.6percentage points lower in 1972 and from 0.9 to 1.3 points lower in 1973as a consequence of controls. Importantly, however, the end of controlsthen lifted inflation in 1974 some 1.7 to 3.1 percentage points higher thanit would have been without controls, as artificially depressed pricessnapped back. Since the extra catch-up inflation was concentrated in theperiod from February to October or November 1974, this phenomenonexplains why the overall inflation rate remained in the double-digit rangedespite the rapid drop in the rate of increase of energy prices.4
The estimates cited above are based on a conventional econometricwage-price model, a tool whose validity has justifiably been questioned inrecent years. In this case, however, the results of the econometric modelcan be buttressed by more impressionistic (but model-free) evidence.
If we study the detailed monthly time structure of the CPI purged offood and energy prices, it becomes quite apparent that double-digitinflation took place only during the nine-month period beginning inFebruary 1974. During these nine months the annual rate of inflation was13.4%. During the preceding nine months the annual rate of inflation wasonly 5.5%, and during the following nine months it was 6.4%. In a word,the rate of inflation of nonfood, nonenergy prices rose sharply andabruptly in February 1974, and fell almost as precipitously after Novem-ber 1974. The symmetry of the rise and fall of the inflation rate is notablehere, but is even more extreme if we look at quarterly data on the PCEdeflator purged of food and energy. According to this index, the annual
268 Alan S. Blinder
inflation rate during the period of peak inflation (1974:1 to 1974:4) was10.4%, while the inflation rates of both the preceding and followingthree-quarter periods were 5.4%. If the end of controls was not thereason for this symmetry, we have quite a coincidence to explain.
More nails are added to the coffin by disaggregating the indexes to seewhich specific prices experienced the sharpest accelerations and decelera-tions during this period. This exercise singles out automobile prices (bothnew and used) and prices of certain "other nondurable goods," especiallypaper goods, as the main culprits.
Used car prices fell at an annual rate of 12% during the prepeak period,rose at an annual rate of 38% during the period of peak inflation, and thenrose at only a 10% rate during the postpeak period. This remarkablyvolatile price performance, which was quite obviously a side effect of theoil crisis of 1974, accounts for a significant share of the total accelerationand deceleration of the nonfood, nonenergy CPI.
New car prices were virtually unchanged during the prepeak period,rose at a 14% annual rate during the peak period (February-November1974), and then rose at only a 5% rate during the postpeak period. It is nocoincidence, I suggest, that the auto industry was released from con-trols—subject to a pledge not to raise prices rapidly—in December 1973.The winter of 1973-74, when the oil crisis was at its height, was hardly apropitious time to raise car prices, so the automakers waited until springand new car prices shot up between May and September 1974. Since saleswere way down and inventories (relative to sales) were way up during thisperiod, it seems most unlikely that this was a case of demand pulling upprices. Instead, it has all the earmarks of a postcontrols catch-up.
Various paper goods displayed even more dramatic price behavior.Noting that "the paper industry faced problems in early 1974 that wentwell beyond controls, " that "the most difficult problem was a severeworld-wide shortage of raw materials, causing world prices to soar abovecontrolled domestic prices," and that "new capacity was needed aswell,"5 the Cost of Living Council (COLC) lifted controls on the industry inMarch 1974. But COLC insisted on written commitments from the bigproducers that they would exercise restraint until summer. Then, be-tween August and December 1974, retail prices of paper napkins rose at a43% annual rate while prices for toilet tissue skyrocketed at a 77%pace.
I conclude from this that more than regression estimates implicatedecontrol as the primary culprit responsible for the sharp accelerationand deceleration of nonfood, nonenergy prices in 1974.
12.3.4 Summary
The rate of inflation increased tremendously between 1972 and 1974.Three factors accounted for this stunning acceleration of inflation: foodprices, energy prices, and the end of price controls. Then, from 1974 to
269 Anatomy of Double-Digit Inflation in the 1970s
1976, the inflation rate tumbled almost as rapidly as it had climbed. Thereasons for the deceleration were the mirror images of the reasons for theacceleration: food price increases slowed, the OPEC shock was not re-peated, and the extra catch-up at the end of price controls was completed.
12.4 Accelerating Inflation, 1977-80
How does the recent experience compare with this history? Onceagain, inflation mounted rapidly from 1977 to early 1980.6 Once again,three factors led the way, and none of them was money. Two of thesewere repeat offenders from 1972-74: food prices and energy prices. Thethird was a newcomer: mortgage interest rates. The "special factors"nature of the 1977-80 acceleration of inflation is every bit as clear as it wasin 1972-74.
My examination of the recent inflation is organized as follows. First, Ilook briefly at each of the phenomena mentioned just above: food prices,energy prices, and mortgage interest rates, in each case stressing similar-ities and contrasts with the experience of the mid-1970s. Then I try to putthe three culprits together in order to lay bare the anatomy of the recentrecession.
12.4.1 The 1978-79 Food Shock
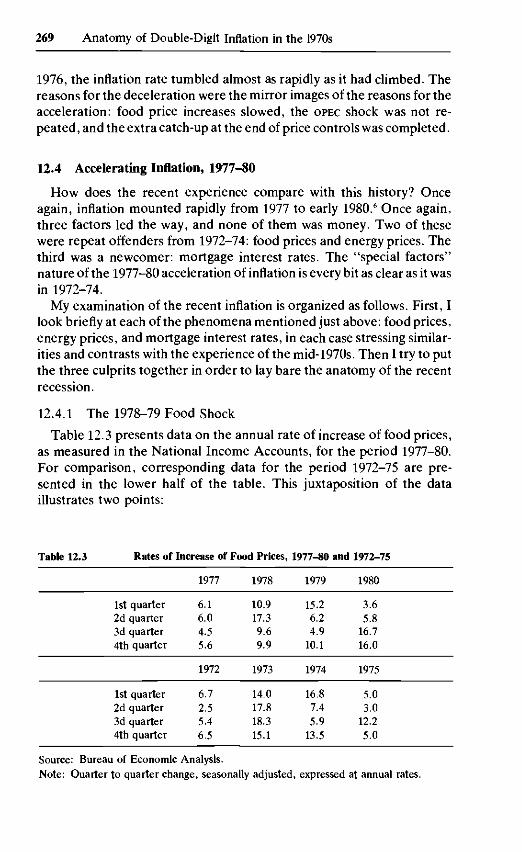
Table 12.3 presents data on the annual rate of increase of food prices,as measured in the National Income Accounts, for the period 1977-80.For comparison, corresponding data for the period 1972-75 are pre-sented in the lower half of the table. This juxtaposition of the dataillustrates two points:
Table 12.3 Rates of Increase of Food Prices, 1977-80 and 1972-75
1st quarter2d quarter3d quarter4th quarter
1st quarter2d quarter3d quarter4th quarter
1977
6.16.04.55.6
1972
6.72.55.46.5
1978
10.917.39.69.9
1973
14.017.818.315.1
1979
15.26.24.9
10.1
1974
16.87.45.9
13.5
1980
3.65.8
16.716.0
1975
5.03.0
12.25.0
Source: Bureau of Economic Analysis.Note: Quarter to quarter change, seasonally adjusted, expressed at annual rates.

270 Alan S. Blinder
1. The 1978-79 food shock, while it looked very similar at the outset,proved not to be nearly as severe as the 1973-74 shock, PCE food pricesrose 22% between 1977:4 and 1979:4 versus 29% between 1972:4 and1974:4.
2. While the 1978-79 food shock lasted about as long as its precursor(five quarters), the 1973-74 shock was followed by a period of blissfultranquillity in food prices. (Data for 1975 are in table 12.3. Food pricesduring 1976 were virtually constant.) By contrast the second half of 1980was a bad one for food prices.
Another interesting aspect of the recent food price performance isconcealed by the rather aggregated PCE data. It turns out that the prob-lems emanating from the food sector were remarkably concentrated. The"food inflation" was in large part a "meat inflation." Meat prices asmeasured in the CPI rose at extraordinarily high and variable rates during1978-79. During 1978 and the early part of 1979, the number of cattle onUnited States farms continued a decline that had started in early 1975.The size of the drop in the total cattle herd (over 16%) was the largestever recorded. Expectations that falling beef production in 1978 would beoffset by higher output of pork and poultry were dashed by severeweather in the winter of 1977-78, disease, rising feed costs, and uncer-tainty over government regulations on the use of nitrites. When ranchersfinally started rebuilding their herds in 1979, their actions reduced currentmarketings even further and prices continued to soar.7
The result of all these goings on was that meat prices dominated thefood price picture. During the eight quarters of 1978 and 1979, the meanannual inflation rate of food prices was 10.3% and the standard deviationwas 4.9%. However, if we remove the extraordinary behavior of meatprices, the remaining index (for food exclusive of meat) displays a meaninflation rate of only 8.4%. More significantly, the standard deviationdrops to only 1.6%.
One final point worth noting can be seen in table 12.3. While foodprices played a substantial role in the acceleration of inflation in the firsthalf of 1978, they played little role in the subsequent acceleration into thedouble-digit range in 1979.
12.4.2 The 1979 Energy Shock
The energy price run-up of 1979 had its origins in the political turmoilin Iran early in the year. The consequent disruption in supply, coupledwith desperate efforts to build inventories, led to chaos in the world oilmarket and rapidly escalating spot-market prices in the second quarter.OPEC followed with a series of price increases in April, July, and Decem-ber. Queues at gasoline stations were common in various locales in thespring and summer months.
Between December 1978 and March 1980, the average cost per barrel
271 Anatomy of Double-Digit Inflation in the 1970s
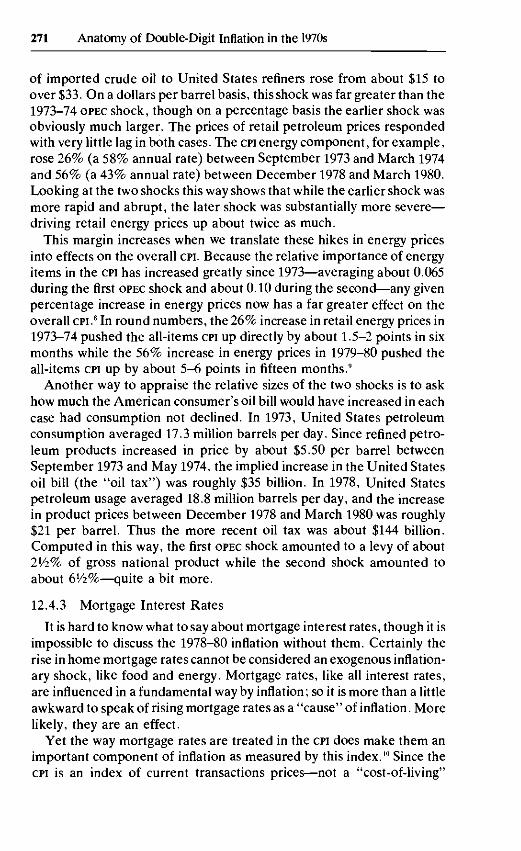
of imported crude oil to United States refiners rose from about $15 toover $33. On a dollars per barrel basis, this shock was far greater than the1973-74 OPEC shock, though on a percentage basis the earlier shock wasobviously much larger. The prices of retail petroleum prices respondedwith very little lag in both cases. The CPI energy component, for example,rose 26% (a 58% annual rate) between September 1973 and March 1974and 56% (a 43% annual rate) between December 1978 and March 1980.Looking at the two shocks this way shows that while the earlier shock wasmore rapid and abrupt, the later shock was substantially more severe—driving retail energy prices up about twice as much.
This margin increases when we translate these hikes in energy pricesinto effects on the overall CPI. Because the relative importance of energyitems in the CPI has increased greatly since 1973—averaging about 0.065during the first OPEC shock and about 0.10 during the second—any givenpercentage increase in energy prices now has a far greater effect on theoverall CPI.8 In round numbers, the 26% increase in retail energy prices in1913-1A pushed the all-items CPI up directly by about 1.5-2 points in sixmonths while the 56% increase in energy prices in 1979-80 pushed theall-items CPI up by about 5-6 points in fifteen months.9
Another way to appraise the relative sizes of the two shocks is to askhow much the American consumer's oil bill would have increased in eachcase had consumption not declined. In 1973, United States petroleumconsumption averaged 17.3 million barrels per day. Since refined petro-leum products increased in price by about $5.50 per barrel betweenSeptember 1973 and May 1974, the implied increase in the United Statesoil bill (the "oil tax") was roughly $35 billion. In 1978, United Statespetroleum usage averaged 18.8 million barrels per day, and the increasein product prices between December 1978 and March 1980 was roughly$21 per barrel. Thus the more recent oil tax was about $144 billion.Computed in this way, the first OPEC shock amounted to a levy of about2l/i% of gross national product while the second shock amounted toabout 6V2%—quite a bit more.
12.4.3 Mortgage Interest Rates
It is hard to know what to say about mortgage interest rates, though it isimpossible to discuss the 1978-80 inflation without them. Certainly therise in home mortgage rates cannot be considered an exogenous inflation-ary shock, like food and energy. Mortgage rates, like all interest rates,are influenced in a fundamental way by inflation; so it is more than a littleawkward to speak of rising mortgage rates as a "cause" of inflation. Morelikely, they are an effect.
Yet the way mortgage rates are treated in the CPI does make them animportant component of inflation as measured by this index.10 Since theCPI is an index of current transactions prices—not a "cost-of-living"
272 Alan S. Blinder
index, as it is commonly treated—the mortgage rate included in it is acurrent market rate.11 This rate, needless to say, is a price that preciousfew consumers pay. Yet it can have a dramatic effect on the CPI.
A simple back-of-the-envelope example will illustrate how this works.Suppose mortgage rates increase from 9% per annum to 10% per annum.Monthly payments on new mortgages will increase about 11%. If mort-gage payments have a 9% relative importance in the overall CPI, this willincrease the CPI by a full percentage point (0.09 times 11% = 0.99%). Ifthis occurs within a few months, the effect on the annual rate of increase ofthe CPI can be astronomical.
Because of this, it is probably wise to pay more attention to the PCEdeflator than to the CPI during periods in which mortgage interest ratesare rising (or falling) rapidly. Yet it is far from clear that the PCE deflator isthe "right" index to look at. Certainly mortgage interest rates should getsome weight in any proper index of the prices actually paid by consumers,even though these rates do not count in the GNP.12
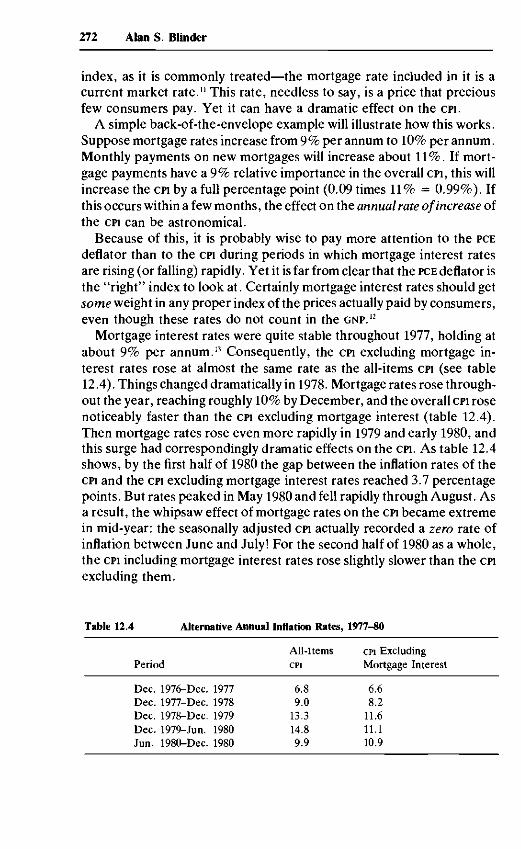
Mortgage interest rates were quite stable throughout 1977, holding atabout 9% per annum.13 Consequently, the CPI excluding mortgage in-terest rates rose at almost the same rate as the all-items CPI (see table12.4). Things changed dramatically in 1978. Mortgage rates rose through-out the year, reaching roughly 10% by December, and the overall CPI rosenoticeably faster than the CPI excluding mortgage interest (table 12.4).Then mortgage rates rose even more rapidly in 1979 and early 1980, andthis surge had correspondingly dramatic effects on the CPI. AS table 12.4shows, by the first half of 1980 the gap between the inflation rates of theCPI and the CPI excluding mortgage interest rates reached 3.7 percentagepoints. But rates peaked in May 1980 and fell rapidly through August. Asa result, the whipsaw effect of mortgage rates on the CPI became extremein mid-year: the seasonally adjusted CPI actually recorded a zero rate ofinflation between June and July! For the second half of 1980 as a whole,the CPI including mortgage interest rates rose slightly slower than the CPIexcluding them.
Table 12.4 Alternative Annual Inflation Rates, 1977-80
All-Items CPI ExcludingPeriod CPI Mortgage Interest
Dec.Dec.Dec.Dec.Jun.
1976-Dec.1977-Dec.1978-Dec.1979-Jun.1980-Dec.
19771978197919801980
6.89.013.314.89.9
6.68.211.611.110.9

273 Anatomy of Double-Digit Inflation in the 1970s
12.4.4 The Anatomy of Inflation in 1978-80
We are now in a position to put the pieces together and analyze the1978-80 acceleration of inflation. But first a word on methodology.
By some simple arithmetic it is possible to decompose the overallinflation rate into the parts contributed by food, energy, and all otherfactors.14 In making this split, 1977 provides a useful reference pointbecause in that year "special factors" inflation was unimportant, so theactual and baseline rates of inflation coincided (see table 12.1). Bycomparing the years 1978-80 with 1977, we can get an impression of howmuch of the recent acceleration of inflation was due to special factors andhow much represented an increase in the baseline rate. I should stressthat the analysis that follows is not "causal"; there is no model behind it.However, as we shall see, the data seem to be consistent with a model inwhich inflation from special factors passes directly into the overall infla-tion rate on a one-for-one basis in the short run.15
Consider first the composition of inflation according to the CPI, theindex most in the public eye. As row 1 of table 12.5 shows, inflationmounted steadily from 6.8% during 1977 to 14.8% during the first half of1980 (over 18% during the first quarter). The food and energy shocks wehave discussed can be seen quite clearly in rows 2 and 3. The contributionof food price increases to overall inflation rose by 0.7 points from 1977 to1978, and then stayed almost level between 1978 and 1980 (though thetwo halves of 1980 were quite different in this respect). As suggestedearlier, and in marked contrast to 1973-74, the food shock was transitoryand rather minor.
The same cannot be said of energy. Energy inflation made only "nor-mal" contributions to overall inflation in 1977 and 1978, but then reallytook off. Fully 2.5 points of the total 4.3 point acceleration of inflationfrom 1978 to 1979 can be traced directly to energy prices, as can a fraction
Table 12.5 Composition of CPI Inflation,
1.
2.3.4.
5.6.
Rate of inflation of CPIContributions of
FoodEnergyMortgage
interest costEverything else
Rate of inflation of"everything else"
1977
6.8%
1.40.6
0.74.1
6.0%
1978
9.0%
2.10.7
1.44.8
7.2%
1977-«0
1979
13.3%
1.93.2
2.55.8
8.7%
1980(first half)
14.8%
0.83.9
4.65.5
8.7%
1980(second half)
9.9%
2.80.1
0.56.4
10.1%
274 Alan S. Blinder
of the further acceleration in early 1980. Stable, energy prices then playeda major role in the deceleration of inflation in the second half of 1980.Further disaggregation (not shown in the table) reveals that gasolineprices accounted for the lion's share of the total contribution of energy.
Row 4 shows what many observers believe to be a serious measure-ment problem in the CPI—its extreme sensitivity to changes in mortgageinterest rates. Mortgage rates, we see, accounted for about one-third ofthe total acceleration from 1977 to 1978 (0.7 points out of 2.2), aboutone-quarter of the acceleration from 1978 to 1979 (1.1 points out of 4.3),and more than 100% of the acceleration from 1979 to early 1980 (2.1points out of a total of 1.5). The situation was just as extreme on thedownside. The contribution of mortgage interest rates to inflation de-clined by 4.1 percentage points from the first to the second half of 1980,whereas the overall inflation rate declined by 4.9 percentage points.
Looking at the acceleration period as a whole, we see that while theoverall inflation rate increased by 8 percentage points (from 6.8% to14.8%) between 1977 and the first half of 1980, fully 7.2 of these pointscan be traced directly to energy prices and mortgage interest costs. Fewerthan IV2 points can be attributed to the catchall "everything else" cate-gory that constitutes about two-thirds of the index. On the downside, thedeceleration of mortgage costs and energy prices was so extreme thatthey alone were sufficient to bring the inflation rate down about 8 per-centage points from the first half of 1980 to the second half. The actualdeceleration was limited to 5 percentage points by the misbehavior offood prices and by an ominous rise in the inflation rate of "everythingelse." This latter rate, which I take to approximate the baseline rate, rosegradually from 6% in 1977 to 8.7% in 1979, remained at that level duringthe first half of 1980, and then accelerated to a 10.1% annual rate duringthe second half of 1980.
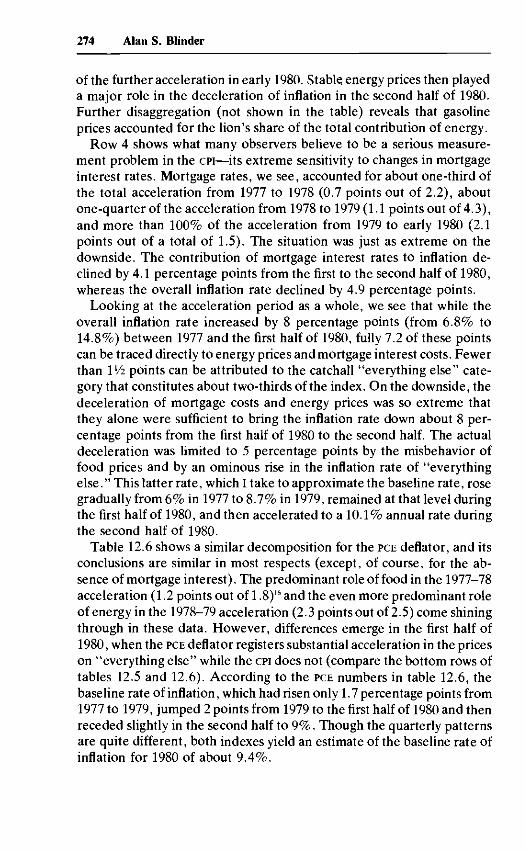
Table 12.6 shows a similar decomposition for the PCE deflator, and itsconclusions are similar in most respects (except, of course, for the ab-sence of mortgage interest). The predominant role of food in the 1977-78acceleration (1.2 points out of 1.8)16 and the even more predominant roleof energy in the 1978-79 acceleration (2.3 points out of 2.5) come shiningthrough in these data. However, differences emerge in the first half of1980, when the PCE deflator registers substantial acceleration in the priceson "everything else" while the CPI does not (compare the bottom rows oftables 12.5 and 12.6). According to the PCE numbers in table 12.6, thebaseline rate of inflation, which had risen only 1.7 percentage points from1977 to 1979, jumped 2 points from 1979 to the first half of 1980 and thenreceded slightly in the second half to 9%. Though the quarterly patternsare quite different, both indexes yield an estimate of the baseline rate ofinflation for 1980 of about 9.4%.
275 Anatomy of Double-Digit Inflation in the 1970s
Table 12.6 Composition of PCE Inflation, 1977-80
1.
2.3.4.5.
Rate of inflation ofa) PCE deflatorb) PCE chain index
Contributions ofFoodEnergyEverything else
Rate of inflation of"everything else"
1977
5.9%6.0%
1.20.64.3
6.0%
1978
7.8%7.8%
2.40.64.8
6.7%
1979
9.5%10.3%
1.82.95.5
7.7%
1980(first half)
11.0%10.8%
1.03.06.8
9.7%
1980(second half)
9.1%10.0%
3.30.46.3
9.0%
Note: Except for rounding error, rows 2, 3, and 4 add up to row \b.
The lesson to be learned from this exercise is pretty apparent. To theextent that inflation was propelled upward by special factors, we wouldexpect the inflation rate to fall of its own accord. This appears to be justwhat happened from the first half of 1980 to the second half: the "specialfactors" contributed - 6 points to the change in the inflation rate ( - 8points from energy and mortgage rates, + 2 points from food). A diminu-tion of inflation of this type should be expected even in the absence of arecession. We should strive to avoid in 1980-81 the post hoc, ergo propterhoc fallacy into which so many observers fell in 1975. In 1974-75 a steeprecession followed a sharp acceleration of inflation, and a stunning dropin the inflation rate quickly followed the recession. Many people continueto this day to give credit to the recession for breaking the back of thedouble-digit inflation whereas, in fact, it was the waning of special factorsthat did the trick. A similar scenario seems to have unfolded in 1980. Forreasons just outlined, the inflation rate fell from the dizzying 18% rates ofearly 1980 back to the 8-10% baseline range. Simultaneously, we experi-enced a recession. We ought to avoid the temptation to credit the reces-sion with knocking 8-10 points off the inflation rate—something norecession can do so quickly. Furthermore, to the extent that a recessionworks on inflation, its effects ought to show up in the baseline rate. This issomething that at this writing (March 1981), it is still too early to see.
12.5 Were the 1970s Really Different?
A common criticism of the analysis of inflation presented here, in mybook (Blinder 1979), and elsewhere,17 runs as follows. There are "specialfactors" every year. In every year, some components of any price indexare rising faster than the average. Thus, would it not be possible to usethis methodology to brand all inflation as "special factor" inflation?
276 Alan S. Blinder
I have two answers to this criticism, one brief and one protracted. First,my concern here and in my 1979 book is with the acceleration of inflationwell above the economy's "baseline" rate. No attempt is made to explainwhy the baseline rate itself increased. Such an explanation would focuson excessive aggregate demand (from money creation and othersources), lagging productivity growth, and so on, and there is little doubtthat the rate of growth of money would play a prominent role. But there isequally little doubt that the behavior of the money supply tells us almostnothing about the bursts of double-digit inflation in 1974 nd 1979-80.
Now for the longer rebuttal. The explanation of inflation in the 1970sthat I and others have propounded fundamentally revolves around foodshocks (in 1973-74 and 1978) and energy shocks (in 1973-74 and 1979).18
But have there not been food shocks and energy shocks before? It therewere, why was there not double-digit inflation then?
In the case of energy shocks, the answer is straightforward: we simplydid not have them until 1973. It is well known that the postwar periodthrough 1972 was characterized by cheap energy growing cheaper. FromJanuary 1957 (when it starts) until January 1973, the CPI energy index roseat an annual rate of 1.7% while the all-items CPI rose at an annual rate of2.7%. The greatest year-to-year change in the energy index was 4.5% in1970. By contrast, the annual rate of increase of CPI energy prices fromDecember 1972 to December 1979 was 15.2% (versus 8.8% for theall-items CPI). Energy prices rose 21.6% during 1974 and 37.4% during1979. The 1970s really were different, and I fail to see why a theory ofinflation is more "scientific" if it ignores this fact.
Things are far less clear with respect to food shocks, however. We haveno OPEC to latch on to as a watershed, and it is difficult to understand whatmade weather conditions so much more adverse in the 1970s than in the1960s and 1950s. Using CPI data since 1940, it is in fact possible to identifyseveral earlier "food shocks" (see table 12.7).
In 1941 and 1942, for example, the rates of increase of food prices wererespectively 16.4% and 17.5%. (It is probably no mystery why thisoccurred!) As a consequence, the rate of increase of the all-items CPIexceeded that of the CPI stripped of food items by 3.2 and 5.4 percentagepoints respectively. The acceleration of inflation between 1940 and 1942was 8.3 percentage points in the overall CPI, but only 3.3 points if fooditems are excluded. Similarly, the deceleration between 1942 and 1943was 6.1 percentage points including food but merely 0.5 percentagepoints excluding food.
Another severe food shock apparently occurred in late 1946 and early1947 as the wartime controls over food prices were dismantled.19 In 1946,the rate of inflation including food exceeded the rate of inflation exclud-ing food by 9.1 percentage points. From 1945 to 1946, the CPI inflationrate accelerated by an astounding 15.9 percentage points. But without

277 Anatomy of Double-Digit Inflation in the 1970s
Table 12.7 Rates of Change of the CPIand Selected Components, 1940-51
Food All-Items CPIYear Prices CPI less Food
19401941194219431944
19451946194719481949
19501951
2.616.417.53.10.2
3.031.511.2-0.8-3.7
9.67.4
1.09.79.33.22.1
2.318.29.02.7
-1.8
5.85.9
0.66.53.93.43.5
1.89.17.55.5
-0.8
4.15.0
Note: From December of previous year to December of stated year.
Table 12.8 Rates of Change of the CPIand Selected Components, 1952-72
Food All-Items CPIYear Prices CPI less Food
195219531954
19551956195719581959
19601961196219631964
19651966196719681969
197019711972
-1.1-1.3-1.6
-0.93.12.82.2
-0.8
3.1-0.91.51.91.4
3.43.91.24.37.2
2.24.34.7
0.90.6
-0.5
0.42.93.01.81.5
1.50.71.21.61.2
1.93.43.04.76.1
5.53.43.4
1.71.70
0.92.63.21.62.3
1.01.11.21.61.0
1.63.33.54.95.7
6.53.13.0
Note: From December of previous year to December of stated year.
278 Alan S. Blinder
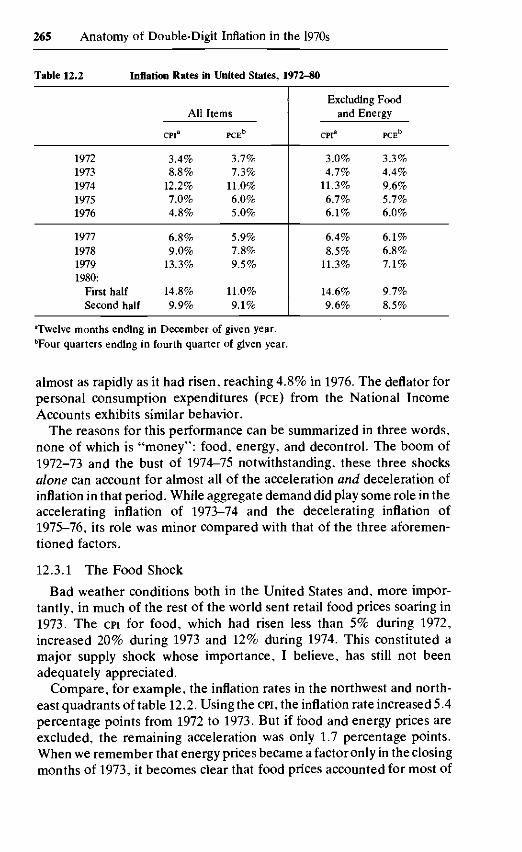
l 4 .0 r
79
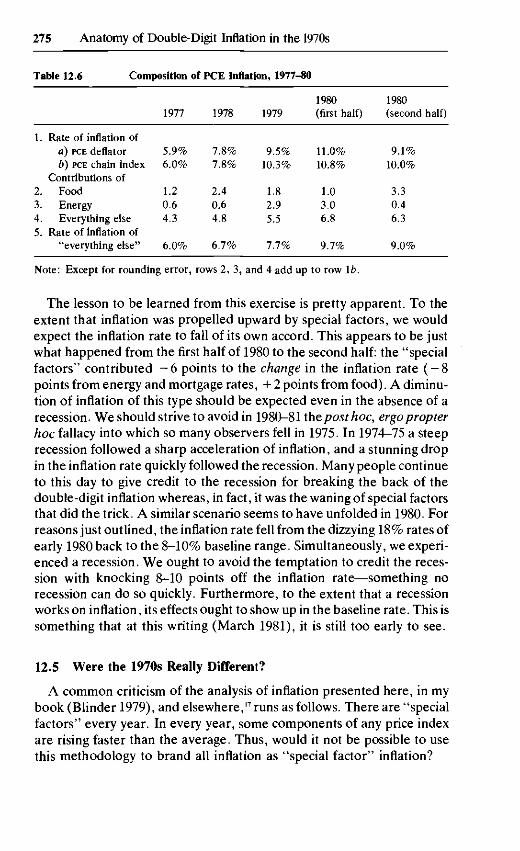
0 2.0 4.0 6.0 8.0 10.0 12.0PERCENTAGE CHANGE C.PI. EXCLUDING FOOD AND ENERGY
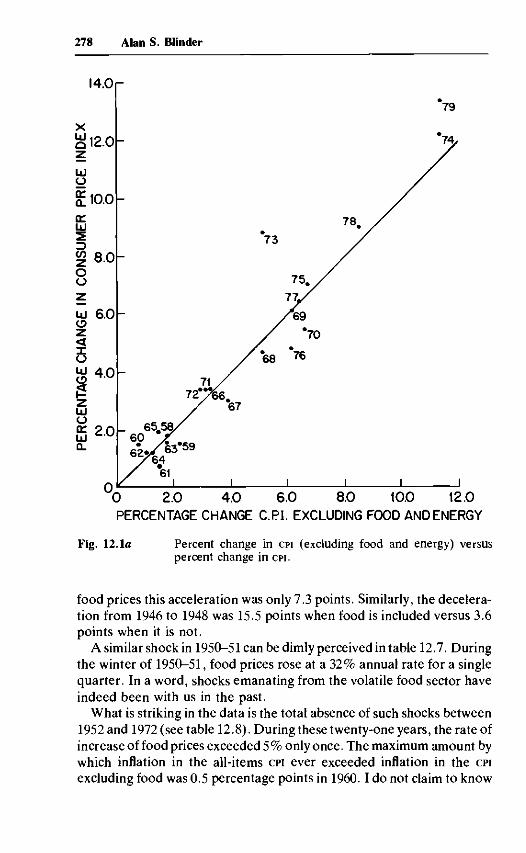
Fig. 12.1a Percent change in CPI (excluding food and energy) versuspercent change in CPI.
food prices this acceleration was only 7.3 points. Similarly, the decelera-tion from 1946 to 1948 was 15.5 points when food is included versus 3.6points when it is not.
A similar shock in 1950-51 can be dimly perceived in table 12.7. Duringthe winter of 1950-51, food prices rose at a 32% annual rate for a singlequarter. In a word, shocks emanating from the volatile food sector haveindeed been with us in the past.
What is striking in the data is the total absence of such shocks between1952 and 1972 (see table 12.8). During these twenty-one years, the rate ofincrease of food prices exceeded 5% only once. The maximum amount bywhich inflation in the all-items CPI ever exceeded inflation in the CPIexcluding food was 0.5 percentage points in 1960.1 do not claim to know
279 Anatomy of Double-Digit Inflation in the 1970s
8.0 10.0 12.0
PERCENTAGE CHANGE PC.E. DEFLATOREXCLUDING FOOD AND ENERGY
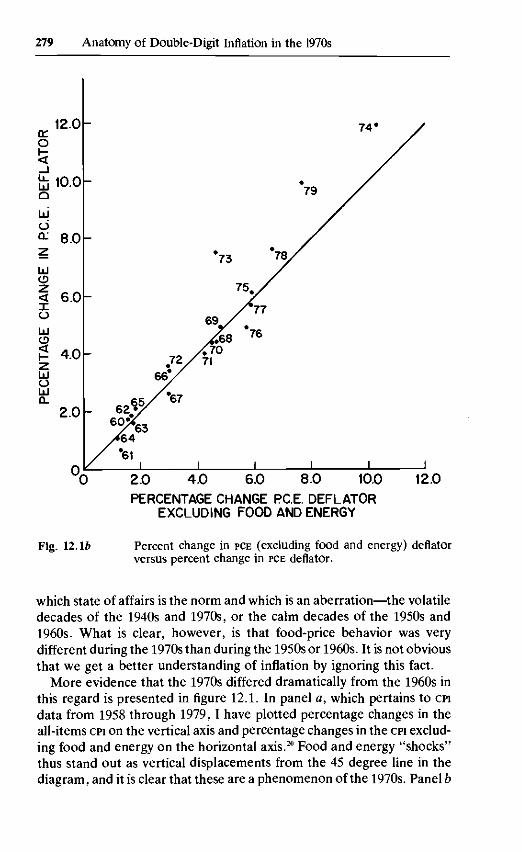
Fig. Percent change in PCE (excluding food and energy) deflatorversus percent change in PCE deflator.
which state of affairs is the norm and which is an aberration—the volatiledecades of the 1940s and 1970s, or the calm decades of the 1950s and1960s. What is clear, however, is that food-price behavior was verydifferent during the 1970s than during the 1950s or 1960s. It is not obviousthat we get a better understanding of inflation by ignoring this fact.
More evidence that the 1970s differed dramatically from the 1960s inthis regard is presented in figure 12.1. In panel a, which pertains to CPIdata from 1958 through 1979, I have plotted percentage changes in theall-items CPI on the vertical axis and percentage changes in the CPI exclud-ing food and energy on the horizontal axis.20 Food and energy "shocks"thus stand out as vertical displacements from the 45 degree line in thediagram, and it is clear that these are a phenomenon of the 1970s. Panel b
280 Alan S. Blinder
presents exactly parallel data for the PCE deflator covering 1960-79.21 Theconclusions are precisely the same. Serious supply shocks are apparent in1973,1974,1979, and, to a lesser extent, 1978; none are apparent before1973. The 1970s were indeed special.
Notes
1. Although there are important similarities, it would be a mistake to apply the followingscenario mechanically to other countries or to other historical epochs. My focus is squarelyon the contemporary United States.
2. These days it is hardly necessary to point out that trend productivity has proved to bean elusive concept.
3. See Blinder (1979), pp. 78-88.4. Energy prices in the CPI rose at an annual rate of 58% between September 1973 and
March 1974, and then at only a 10.3% annual rate between March and November 1974.5. United States Cost of Living Council (1974), p. 54.6. I start in 1977 rather than 1976 because the overall inflation rate was distorted in 1976
by the unusually moderate behavior of food prices. Excluding food and energy, the inflationrate was essentially constant in 1975-77, as table 12.2 shows.
7. United States President, Economic Report of the President, 1979, p. 40; ibid., Eco-nomic Report of the President, 1980, p. 33.
8. This is a good place to define the concept of "relative importance." The CPI is afixed-weight index. Hence, if P, is the CPI and Pit are the individual components in month t,then
P, = tWiPit,
where w, are the fixed weights. The proportionate rate of change of P is therefore
P,-x
The relative importance of item i at time t is defined as
and hence it can be seen that the rate of change of the CPI is a weighted average (with weightsrit) of the rates of change of its individual components. The useful point to note is that anitem's relative importance in the CPI automatically increases (decreases) as its price rises(falls) relative to the CPI as a whole.
9. These calculations measure only the direct contribution of energy prices to the CPI.They do not include either the indirect effects of increased energy costs on nonenergyproducts (e.g. higher gasoline prices make the cost of transporting food higher) or theeventual reverberations through the wage-price spiral.
10. For a fuller treatment of the issue, see Blinder (1980).11. Because of certain economic and accounting lags, the rate actually used is a weighted
average of market rates quoted in recent past months.
281 Anatomy of Double-Digit Inflation in the 1970s
12. This is not quite true. Imputed rents on owner-occupied housing are included in theGNP, and hence the "price" of this service is tacitly part of the PCE deflator. Imputed rentsdepend on observed rents, which in turn depend on mortgage rates (and many otherfactors). So the mortgage rate creeps in through the back door, though very slowly. Theissue is really one of timing.
13. The mortgage rate cited in this paragraph is the Federal Home Loan Bank Board'sseries on yields on new conventional mortgages. Monthly data can be found in United StatesPresident, Economic Report of the President, 1980, table B-64, p. 279.
14. When using the CPI, a fourth component is distinguished: mortgage interest costs.15. This is quite different from the implications of a classical quantity theory model in
which the overall inflation rate is controlled by the growth rate of money and special factorscause changes only in relative prices.
16. Reference is to the PCE chain index.17. See, for example, Gordon (1975, 1977) or Eckstein (1980).18. The Nixon price controls of 1971-7'4 also played a role, but primarily one of distorting
the time pattern of inflation in 1971-75. See above, section 12.3.3.19. I am grateful to Walter Salant for useful information on the decontrol process.20. Inflation rates recorded are from December of the previous year to December of the
stated year.21. Inflation rates here are for the four quarters ending in the fourth quarter of the stated
year.
References
Blinder, A. S. 1979. Economic policy and the Great Stagflation. NewYork: Academic Press.
Blinder, A. S. 1980. The Consumer Price Index and the measurement ofrecent inflation. Brookings Papers on Economic Activity 2: 539-65.
Blinder, A. S., and Newton, W. J. 1981. The 1971-1974 controls programand the price level: An econometric post-mortem. Journal of MonetaryEconomics 7 (July): 1-23.
Eckstein, O. 1980. Tax policy and core inflation. Study prepared for theJoint Economic Committee, United States Congress, 96th Congress,2d session, April.
Gordon, R. J. 1975. The impact of aggregate demand on prices. Brook-ings Papers on Economic Activity 3: 613-62.
. 1977. Can the inflation of the 1970s be explained? BrookingsPapers on Economic Activity 1: 253-77.
Perry, G. L. 1975. The United States. In E. R. Fried and C. L. Schultze,eds., Higher oil prices and the world economy, pp. 71-104. Washing-ton: Brookings Institution.
United States Bureau of Economic Analysis. 1976. The National Incomeand Product Accounts of the United States, 1929-1974. Washington:Government Printing Office.
282 Alan S. Blinder
. Survey of current business. Various issues.United States Cost of Living Council. Economic Stabilization Program
Quarterly Report. Various issues.United States President. Economic Report of the President together with
the Annual Report of the Council ofEconomic Advisors, various issues.