Embed Size (px)
Citation preview
1
The Changing Transitions to Adulthood in Comparative Perspective;
the Case of Pakistan*
Cynthia B. Lloyd The Population Council
Director, Social Science Research [email protected]
The largest cohort of young people in history – 1.5 billion - is currently growing up in developing countries in the context of rapid global change. Further growth in the overall number of young people ages 10-24 in developing countries is projected to continue until 2035. While globalization is bringing with it an expansion of opportunities, these opportunities are only available to those with sufficient human and social capital. Thus, one consequence of globalization has been rising inequality across and within countries as those with adequate preparation and access are able to take advantage of these new opportunities and better themselves and their families while those with less preparation and access stay behind. Regardless of one’s perspective on the pros and cons of globalization, it is hard to dispute the fact that traditional expectations regarding transitions to adulthood are increasingly likely to be based on outdated assumptions. Broad global forces are transforming the world in which the next generation will live and work; the choices these young people make or others make on their behalf will facilitate or constrain their ability to succeed as adults. The burden of enhancing successful transitions to adulthood rests not just with these young people’s parents but also with the government and the larger society. The challenge for young people growing up is all the greater in countries which have been late to enter the demographic transition because in these countries young people represent a relatively large share of the overall population and their numbers are growing most rapidly. Pakistan is one such country. In these contexts, the investments required to assure young people of adequate preparation for adulthood – an adulthood which is likely to be substantially different from that of their parents - will also have to be differentially large in proportional terms. In 2005, the U.N. estimates that over 32 percent of the population of Pakistan are ages 10 to 24 – roughly 52 million young people. In 25 years by 2030, the number of young people will have risen to 81 million - the size of the total population of Pakistan in 1980 (United Nations 2003).
* The generous support of the U.K. Department for International Development is gratefully acknowledged.
2
The recent release (December 15, 2004) of the U.S. National Research Council and Institute of Medicine’s panel report, Growing up Global: The Changing Transitions to Adulthood in Developing Countries (NRC/IOM 2005)1 along with the release of the results of the national survey of adolescents and youth in Pakistan (AYP) 18 months earlier (Sathar et al 2003) provide an opportunity to compare and contrast the situation of young people in Pakistan with broader global trends. The paper begins with some demographic background, and a discussion of how recent trends in schooling in Pakistan compare with broader trends in all developing countries as a group as well as in South Asia. It then follows the broad outlines of the NRC/IOM’s panel report in exploring transitions to adult work and family roles in comparative perspective. The concluding section of the paper draws on the panel’s program and policy recommendations which were developed after a careful review of lessons learned from recent policy research and program intervention research from around the world, all of which are relevant in some form in the Pakistani context. Nowhere in this paper is the social and cultural diversity within national populations of young people discussed; instead the focus of the paper is on broad national aggregates and trends. This is not to deny the importance of diversity; it is very important indeed. To be effective, policies and programs for young people along the lines suggested in the last section of the paper will need to take this diversity into account; in some cases more research will be required before programs and policies can be adequately designed to meet the specific needs of particular sub-populations of young people. I. A Demographic Perspective
“Concerns about how global forces are altering the passage into adulthood are all the more urgent because of the changing demographic profile of many developing countries. The acceleration of these global changes has coincided with unprecedented growth in the size of the population of young people in developing countries.” (NRC/IOM 2005, italics added for emphasis)
Table 1 provides an overview of population size and change over 50 years for (1) the world as a whole, (2) developing countries as a group, (3) Asia (excluding Japan), (4) the U.N. sub-region of South Central Asia of which Pakistan is a part and (5) Pakistan. We center our attention on 2005, looking back to 1980 twenty five years ago and looking ahead to 2030 which is twenty five years hence. We can see that, over the past 25 years, the percent of the population made up of young people ages 20-24 has fallen in the less developed regions as a whole (from 31.9 to 28.9 percent), in Asia (from 32 to 27.9 percent) and even in South-Central Asia (from 31.3 to 30.5 percent) but has risen in Pakistan from 30.5 to 32.4 percent. During this same period the annual growth rate in the population of young people in Pakistan averaged 3 percent, substantially greater than the annual growth rate during this same period for 1 I served as the chair of the NAS panel on transitions to adulthood in developing countries and the editor of the report.
3
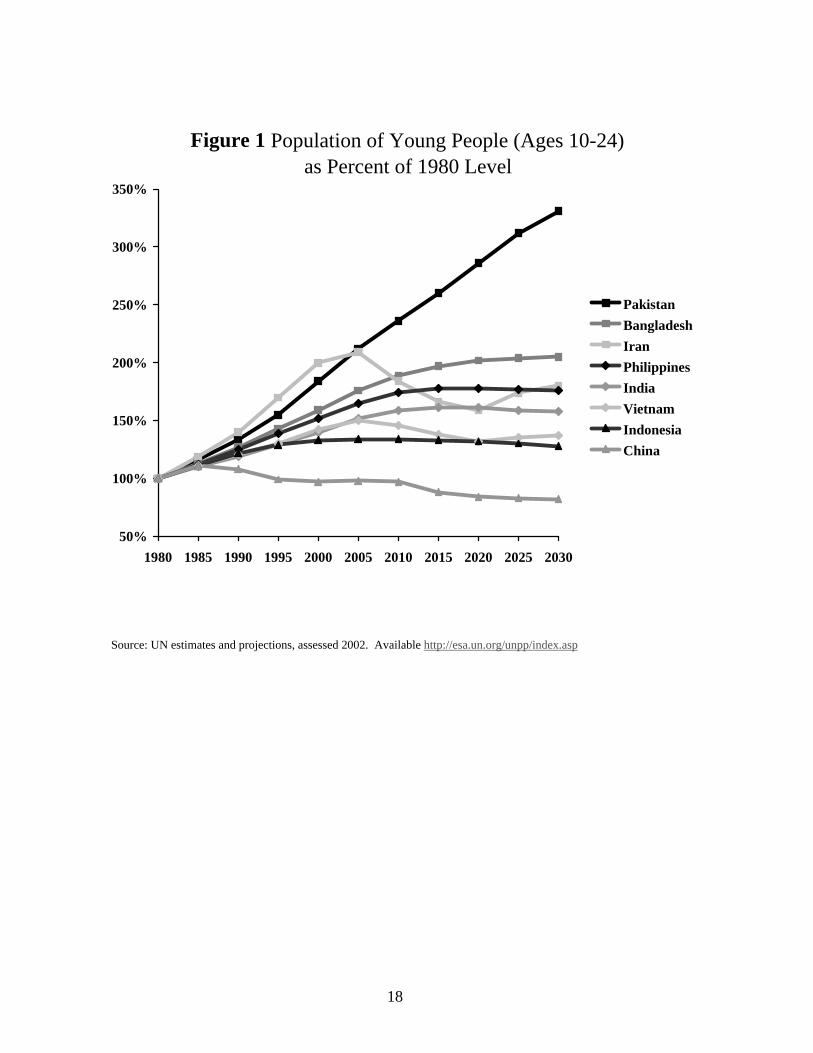
the sub-region of South-Central Asia (1.9 percent). Growth rates for this sub-region are largely dominated by growth rates in India, which makes up nearly 70 percent of the population of this sub-region. During the next 25 years, that annual growth rate in the population of young people in Pakistan will be much lower than it was for the previous 25 years. The slower growth rate of 1.8 annually will lead to a reduction in the share of the overall population made up of young people to 30 percent by the year 2030. Nonetheless, the continued growth in absolute numbers will mean that, according to the U.N. medium variant, the population of young people in Pakistan twenty five years from now will be equal to the total population of Pakistan in 1980, as noted above. Figure 1 presents some comparative growth rates in the size of the population of young people over this 50 year period for the most populous developing countries in Asia – China, India, Indonesia, Pakistan, Bangladesh, Vietnam, the Philippines, and Iran.2 In order to compare growth rates across populations of very different sizes, the base year 1980 is set to 100 and subsequent population estimates are set in relation to the base year. It is clear, that when using 1980 as a base, Pakistan has had and will continue to have the largest growth rate in the population of young people among its populous neighbors in Asia, presenting the government of Pakistan with a particular challenge given the pressing need to widen and deepen investments in young people. Nonetheless, this challenge should be lessened relative to the past by the reduced rate of growth. II. Recent levels and Trends in Schooling
“Learning occurs more intensely during childhood and adolescence than during other phases of the life cycle in all domains, whether it is the development of physical or cognitive skills or the acquisition of knowledge and the shaping of values and beliefs….Interventions affecting the timing and sequencing of learning and the quality of the learning environment during these years can have important implications for the development of adult productive capacities…. Failure to invest at this stage is extremely unlikely to be compensated for in any later stage.” (NRC/IOM, 2005, p. 3-1 of uncorrected prepublication, italics added for emphasis)
One of the most dramatic trends in developing countries over the last twenty to thirty years has been the rapid rise in both school participation and grade attainment, particularly for girls (NRC/ IOM 2005). This has occurred in countries which have prospered economically and in those which have not. Indeed, the pace of change has been more rapid throughout the developing world than the pace of change that occurred during the transition to universal schooling among today’s developed countries (Clemens 2004). These changes have meant that an increasing percent of adolescents in every country remain currently enrolled during their adolescent years 2 According to the United Nations medium variant projection for 2005 (U.N. 2003).
4
with growing numbers still attending school beyond the age of 15. Nonetheless, school participation and grade attainment rates lag for the poor, with poor girls at the greatest disadvantage. Among the eight U.N. Millennium Development Goals universally adopted by member states at the Millennium Summit in 2000 were two goals related to schooling; (1) the achievement of universal primary completion by 2015 and (2) the achievement of gender equality at all levels of schooling (United Nations 2000). Despite these encouraging trends noted above, however, diversity persists across countries in school enrollment and attainment rates, with many countries, particularly in Africa, unlikely to achieve these goals, even with the current impressive rates of progress. Comparable data on trends in schooling can be derived from the nationally representative surveys of households conducted as part of the Demographic and Health Survey Program (DHS). These are the data used in the NRC/IOM report. These household survey data, covering 52 countries in the 1990s, are representative of roughly 60 percent of the population of developing countries; the median date of these surveys is 1998.3 These data were preferred to the more widely cited UNESCO data because (1) the data for the numerator and the denominator of any indicator are based on the same underlying population, thus allowing the construction of proper cohort-specific indicators on a consistent basis over time, (2) the data collected from households are more likely to capture current attendance rather than opening day enrollment, thus providing a much more realistic measure of school participation, and finally (3) attendance rates from household data can be compared by household income or wealth groups as well as other household characteristics. Trends in schooling are estimated by calculating the differences in attendance4 and grade attainment rates between cohorts.5 Because the overwhelming majority of school-age children enter grade one by the age of 10, the reported percent who have ever attended school among children aged 10-14 represents the most recent estimate of the percent who have ever attended school for those born in the mid to late 1980s
3 China, which represents over 20 percent of the population of young people in the developing world is the most significant missing country. 4 It is now the general convention to refer to the percent reported by the household head or respondent in a household survey as still in school as “attending” rather than “enrolled.” This is because of the wording of the DHS question which asks whether or not each household member “is still in school.” 5 Mortality rates tend to be highest among the least educated. Thus, past school participation and attainment rates reported by older cohorts will overestimate actual school participation and attainment rates achieved in the past due to the better survival rates of the more educated. While mortality rates remain very low in most developing countries until the mid-40s, in the least developed countries where mortality rates are higher at every age, they begin to rise sharply after age 25 (United Nations 2003). Thus rates of improvement are most likely to be underestimated for the least developed countries, mostly sub-Saharan African countries, when comparisons extend back over 20 or 30 years. The bias in estimates will be minimal when comparisons focus on the younger cohorts (i.e. ages 10-25). Thus the pace of change reported here will underestimate the actual pace of change among the least developed countries. Nonetheless, these estimates show impressive rates of change.
5
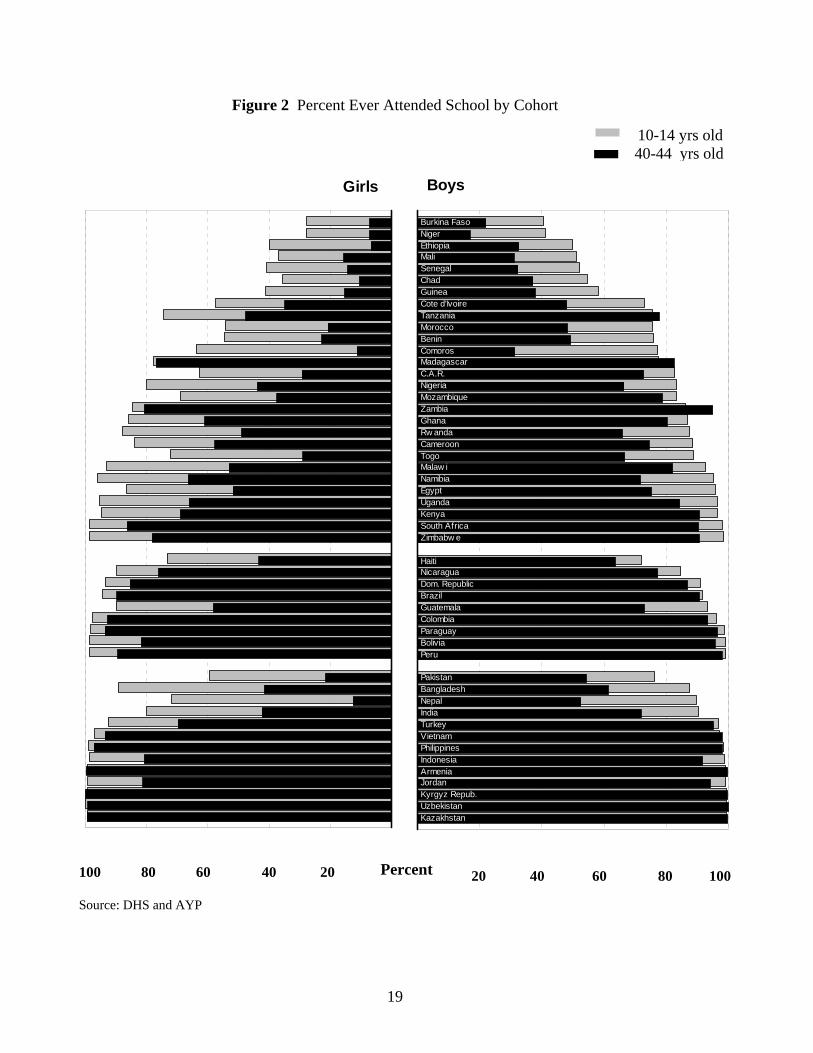
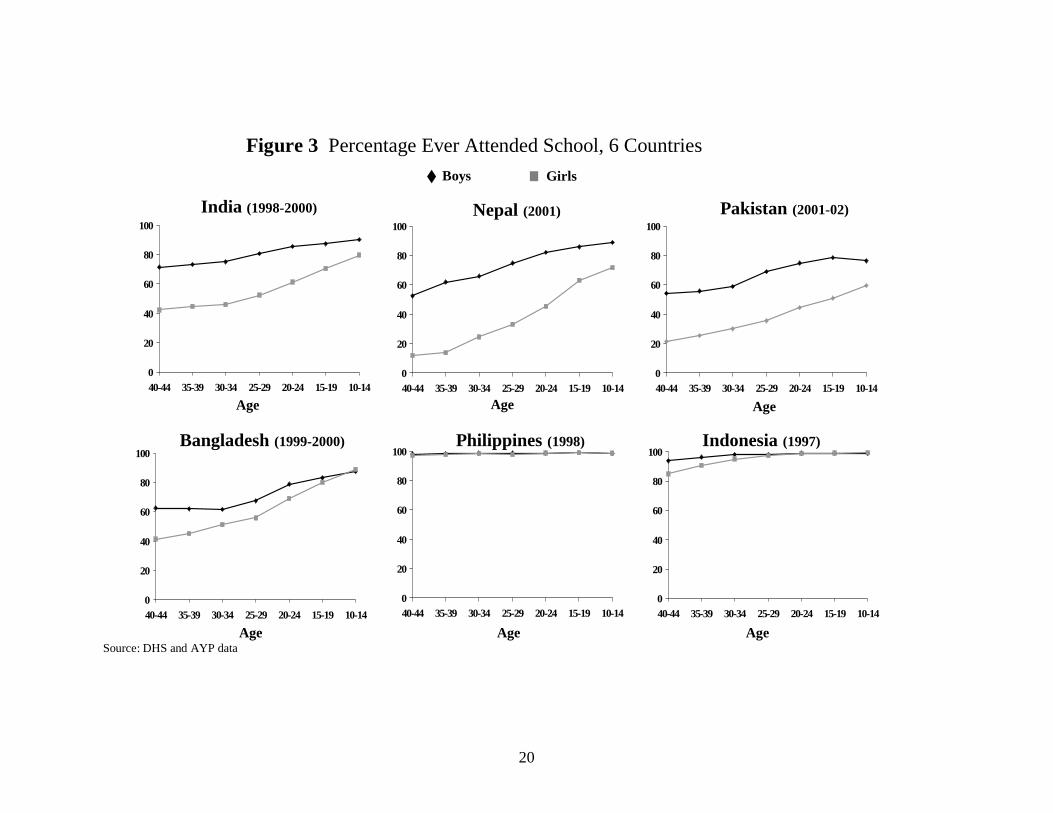
for survey conducted in the late 1990s and early 2000s. We compare these rates of ever attendance to those reported for household residents aged 20-24, 30-34 and 40-44 representing cohorts born in the mid-1950s, mid-1960s and the mid-1970s. The most recent DHS survey for Pakistan was conducted over 10 years ago in 1990-91. However, the other surveys in South Asia were conducted between 1997 and 2001. Fortunately, using the same methodology described above for deriving trends, we are able provide up-to-date comparable data for Pakistan by drawing on the nationally representative survey of households conducted as part of the 2001-02 National Adolescent and Youth Survey of Pakistan (AYP).6 The survey was conducted by the Population Council in collaboration with the Federal Bureau of Statistics and the sample was drawn using an updated sample frame derived from the 1998 census. Figure 2 presents a bar graph organized by region that shows the change in the percent ever attending school over the last 30 years for boys and girls for 52 countries – 51 countries based on a DHS survey conducted since 1992 and Pakistan based on the 2001-02 AYP. Ever attendance rates for the earliest period are shown in black and the subsequent increases are shown in gray. The ordering of countries within each region from low to high is determined by the most recent attendance rates for boys in each country. Gender differences can be noted by the relative distance of the bars for boys and girls separately. It is striking that absolute increases for girls have been much more notable than increases for boys, even in places where the male attendance rate remains far from universal. The increases for girls in sub-Saharan Africa are particularly notable. As a result, gender gaps have narrowed. The countries for which ever attendance rates among those aged 10-14 are below 70 percent are primarily in sub-Saharan Africa, but also include Pakistan for girls. These data make clear that, despite impressive gains, attendance rates in Pakistan remain below rates recorded in all other Asian countries, in Latin America and the Caribbean and even below many African countries. The very rapid growth in the population of young people over the last 25 years has clearly presented Pakistan with a significant challenge in basic schooling provision. In Figure 3, we focus on recent trends in 6 countries in South Asia where a nationally representative household survey has been conducted relatively recently. They include in addition to Pakistan: India, Bangladesh, Nepal, Indonesia and the Philippines. Of these 6 countries, the data for Pakistan is the most recent. Again, trends in the percent ever attending school are depicted over 30 years. In the Philippines and Indonesia, nearly universal attendance for both boys and girls had been achieved even 30 years ago. All other countries have shown impressive growth in attendance rates over this period, starting from very different levels. By the late 1990s near universal attendance had also been achieved in all countries but Pakistan 6 The household questions on schooling in the 2001/02 AYP were worded in exactly the same way as the DHS household survey instrument for ease of comparison.
6
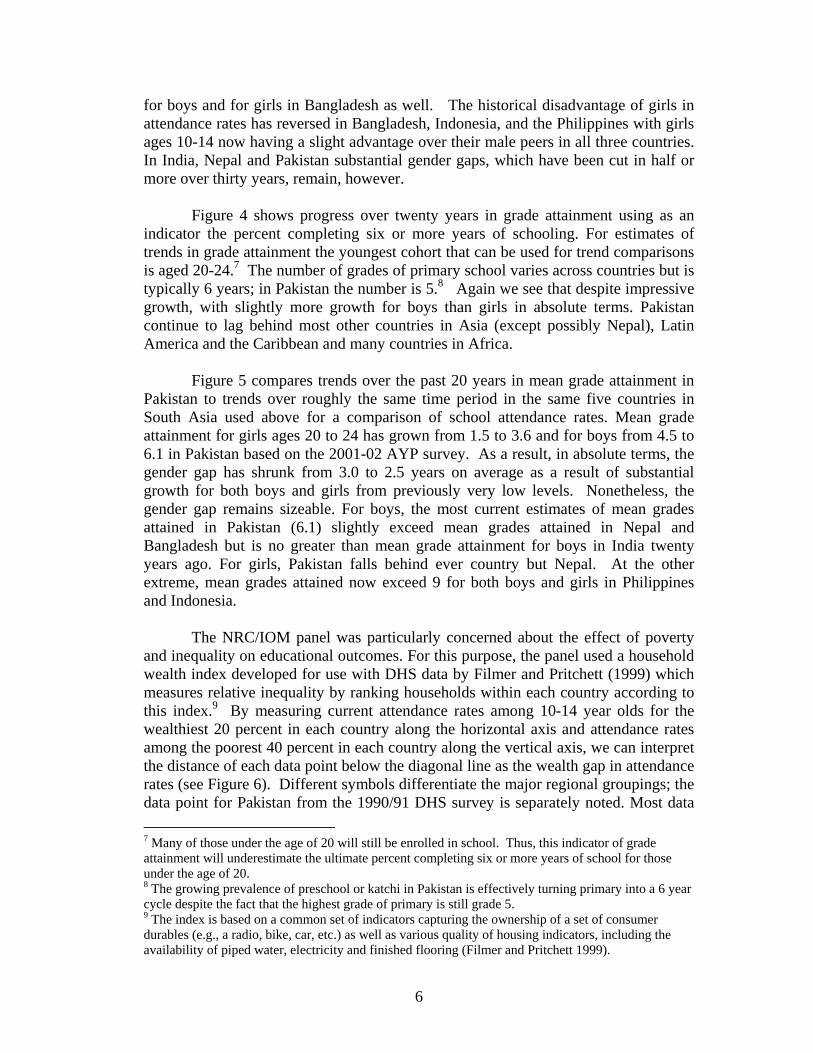
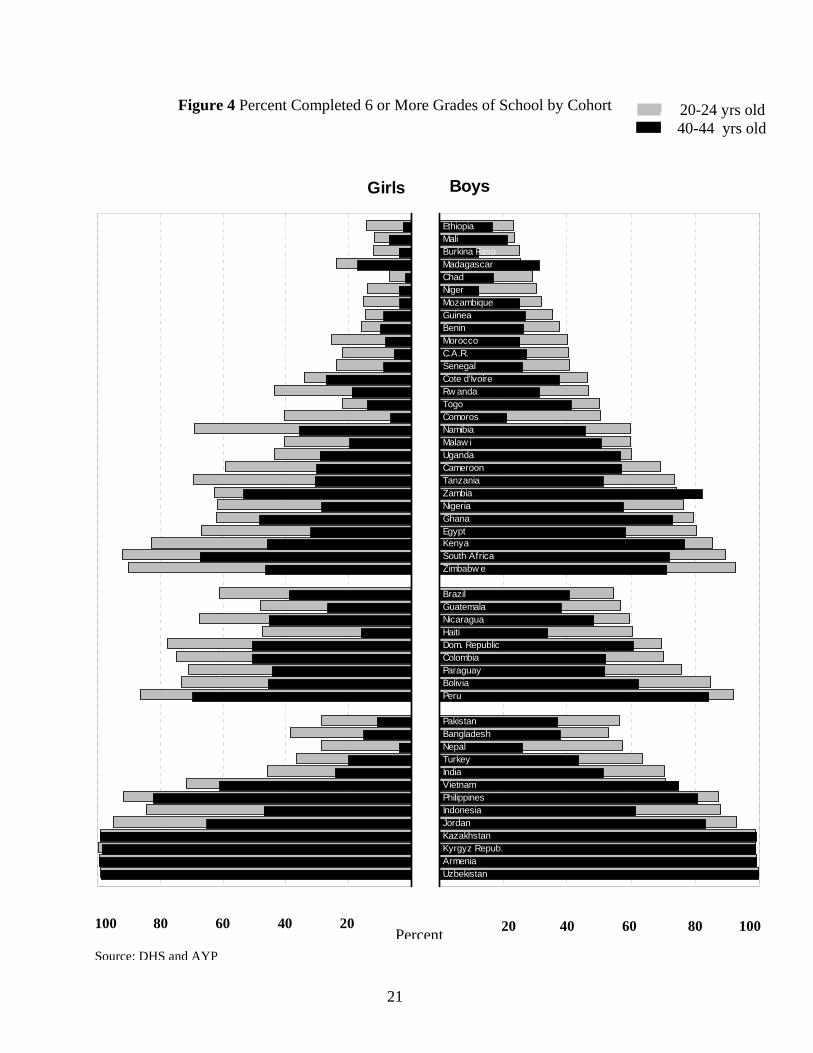
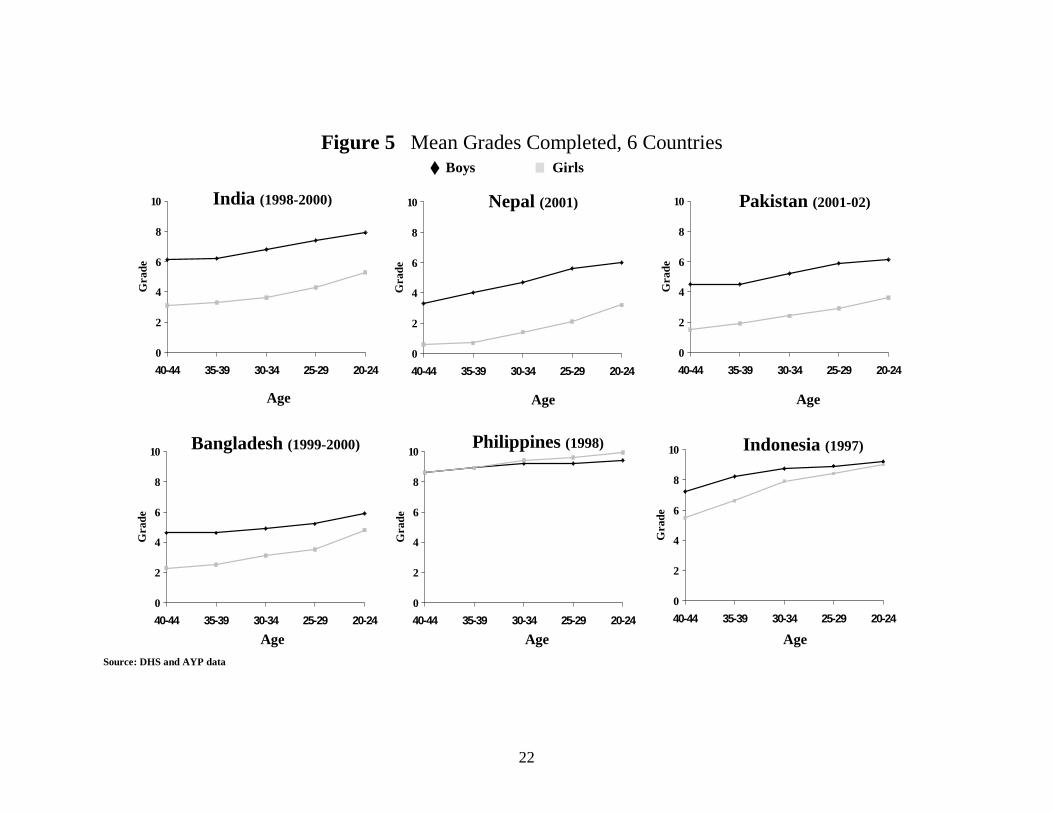
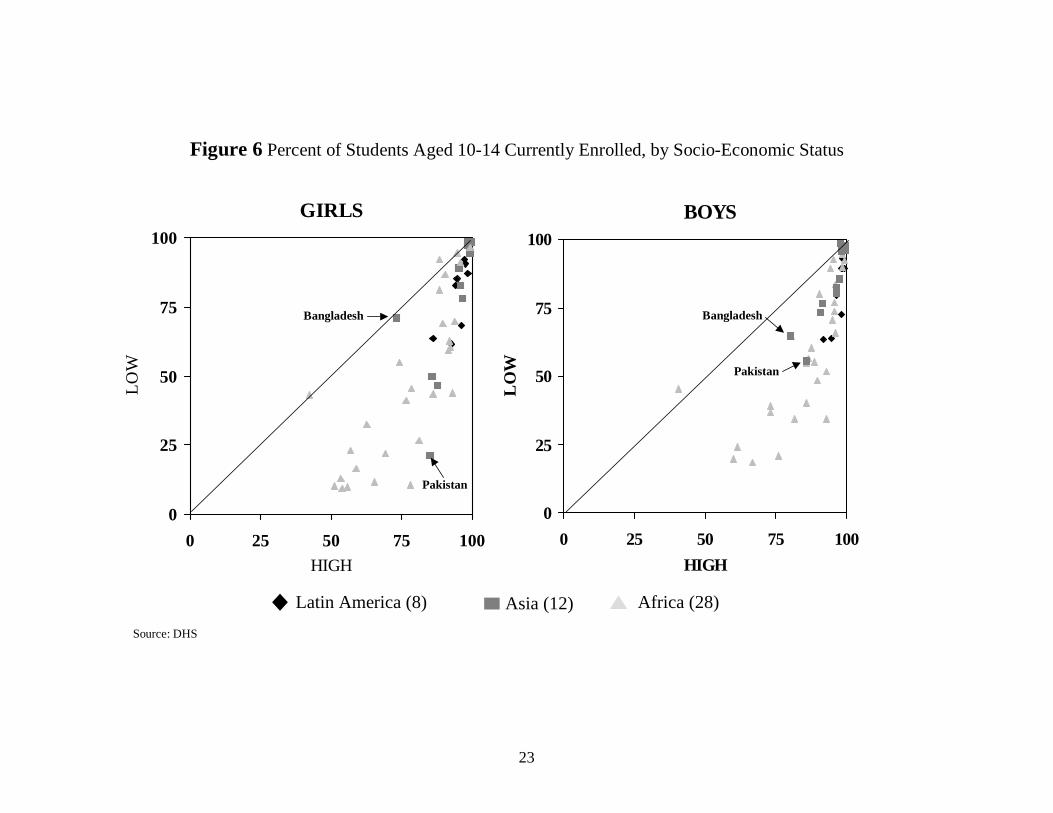
for boys and for girls in Bangladesh as well. The historical disadvantage of girls in attendance rates has reversed in Bangladesh, Indonesia, and the Philippines with girls ages 10-14 now having a slight advantage over their male peers in all three countries. In India, Nepal and Pakistan substantial gender gaps, which have been cut in half or more over thirty years, remain, however. Figure 4 shows progress over twenty years in grade attainment using as an indicator the percent completing six or more years of schooling. For estimates of trends in grade attainment the youngest cohort that can be used for trend comparisons is aged 20-24.7 The number of grades of primary school varies across countries but is typically 6 years; in Pakistan the number is 5.8 Again we see that despite impressive growth, with slightly more growth for boys than girls in absolute terms. Pakistan continue to lag behind most other countries in Asia (except possibly Nepal), Latin America and the Caribbean and many countries in Africa. Figure 5 compares trends over the past 20 years in mean grade attainment in Pakistan to trends over roughly the same time period in the same five countries in South Asia used above for a comparison of school attendance rates. Mean grade attainment for girls ages 20 to 24 has grown from 1.5 to 3.6 and for boys from 4.5 to 6.1 in Pakistan based on the 2001-02 AYP survey. As a result, in absolute terms, the gender gap has shrunk from 3.0 to 2.5 years on average as a result of substantial growth for both boys and girls from previously very low levels. Nonetheless, the gender gap remains sizeable. For boys, the most current estimates of mean grades attained in Pakistan (6.1) slightly exceed mean grades attained in Nepal and Bangladesh but is no greater than mean grade attainment for boys in India twenty years ago. For girls, Pakistan falls behind ever country but Nepal. At the other extreme, mean grades attained now exceed 9 for both boys and girls in Philippines and Indonesia. The NRC/IOM panel was particularly concerned about the effect of poverty and inequality on educational outcomes. For this purpose, the panel used a household wealth index developed for use with DHS data by Filmer and Pritchett (1999) which measures relative inequality by ranking households within each country according to this index.9 By measuring current attendance rates among 10-14 year olds for the wealthiest 20 percent in each country along the horizontal axis and attendance rates among the poorest 40 percent in each country along the vertical axis, we can interpret the distance of each data point below the diagonal line as the wealth gap in attendance rates (see Figure 6). Different symbols differentiate the major regional groupings; the data point for Pakistan from the 1990/91 DHS survey is separately noted. Most data 7 Many of those under the age of 20 will still be enrolled in school. Thus, this indicator of grade attainment will underestimate the ultimate percent completing six or more years of school for those under the age of 20. 8 The growing prevalence of preschool or katchi in Pakistan is effectively turning primary into a 6 year cycle despite the fact that the highest grade of primary is still grade 5. 9 The index is based on a common set of indicators capturing the ownership of a set of consumer durables (e.g., a radio, bike, car, etc.) as well as various quality of housing indicators, including the availability of piped water, electricity and finished flooring (Filmer and Pritchett 1999).
7
points lie substantially below the diagonal and this is even more true for girls than boys. On average for all countries included in the figure, the poorer group has current attendance rates that are 29 percent below the richest group for girls and 23 percent for boys (NRC/IOM 2005). In the case of Pakistan the poor are 35 percent below the richer group for boys and 75 percent below the richer group for girls. While a reduction in poverty rates would clearly increase the percent of young adolescents, particularly girls, continuing in school, gender attitudes and gender discrimination also remain important factors. The persistence of poverty and gender inequality remain the greatest barriers to education for all. There are few comparable data on student performance in developing countries. The best known data regularly published by UNESCO on literacy, which are based on self-reports, are now widely acknowledged by UNESCO and other United Nations agencies to be seriously flawed and will not be presented here. The most comprehensive and rigorous international testing effort conducted on a comparable basis has been the Programme for International Student Assessment (PISA) run by OECD which has involved the testing of 15-year-old students in reading, mathematics and science literacy. To date 7 developing countries (but not Pakistan) have participated (OECD 2001). Another testing effort run by the International Study Center at Boston College called the Third International Mathematics and Science Study (TIMSS) has involved the testing of students in 8th grade in 38 countries, of which 12 are developing countries (but not Pakistan) (Martin, Gregory and Stember 1999; Mullis et al 2000). In every case, test results for students in developing countries have fallen substantially below performance in even the worst performing of the participating developed countries raising serious concerns about school quality. A recent report by an European research group (ICG 2004) on the education sector in Pakistan has voiced concern about the content of the public school curricula in the physical and social sciences which were assessed as being too limited in coverage, outdated and sometimes inaccurate, leaving many young people ill-prepared for jobs in the more remunerative and rapidly growing sectors of the economy. In the meanwhile, the economic returns to schooling at the secondary and tertiary levels are consistently high and the gap between returns to higher and lower levels of schooling is widening, putting an increasing premium on secondary and tertiary schooling for later success in the labor market (NRC/IOM 2005). The reasons for this trend are not yet known and may vary by context. Among the possibilities are a shift in job composition due to new opportunities opened up by globalization and/or a decline in primary school quality relative to secondary school quality as a result of the rapid growth in primary school age populations. The more educated youth do not just benefit in terms of higher wages but also in terms of greater job stability and job mobility.
8
Evaluations of interventions to improve school access in Pakistan have focused primarily on the development of alternative community schools – sometimes private, sometimes through a private public partnership - in urban and rural Balochistan and documented increases in enrollment in the short run (Kim, Alderman and Orazen 1999; Kim, Alderman and Orazen 1998). Interventions to increase demand for schooling among poor families through well-targeted conditional grants or targeted subsidies have had documented success in Bangladesh and various Latin American countries (NRC/IOM 2005) and hold particular promise for Pakistan given very large differences in school participation and attainment by income group (Sathar et al 2003). Efforts to enhance school quality are also critical but not well documented. The very rapid growth in private schools in Pakistan even in rural areas over the last 10 years as well as the growing proportion of overall primary enrollment in private schools suggests that parents are willing to pay, sometimes substantial amounts, to assure their children of what they perceive to be better quality schooling in the private sector. In rural Punjab and NWFP, based on survey data collected in early 2004, the percent of 10-14 year-olds enrolled in private school has risen from 16 to 34 percent for boys and from 14 to 25 percent for girls (Lloyd, Mete, Sathar, Grant, forthcoming). Actual differences in quality may not be the same as perceived differences, however, because it is difficult for relatively uneducated parents to be knowledgeable about school inputs that are likely to make the most difference in student performance. III. Transitions to Adult Work Roles
“One of the most important transitions young people make as they grow older is the transition from being dependent on the economic support of their parents or other adults to being economically productive in their own right with the ability to support themselves and others…. Whatever form this work takes, the transition to becoming a productive member of society depends for its success, at least in part, on the achievement and maintenance of good health and the acquisition of marketable skills and capabilities for lifelong learning.” (NRC/IOM 2005, p.5-1, italics added for emphasis)
In summarizing the findings on trends in labor force participation, the NRC/IOM (2005) report found that the most typical pattern in most developing countries was a delay in the timing of labor force entry over the past twenty-five years and a concomitant decline in the percentage of young people participating in the labor force, particularly at younger ages. These trends can be explained by the rise in school enrollment and the delay in the timing of school exit. However, rising poverty rates in sub-Saharan Africa imply a less positive trend in child labor and recent evidence from the AYP survey in Pakistan (2001-02) suggests a slight rise in the percent of children, both boys and girls, under the age of 15 who were working over the previous five years (Sathar et al 2003).
9
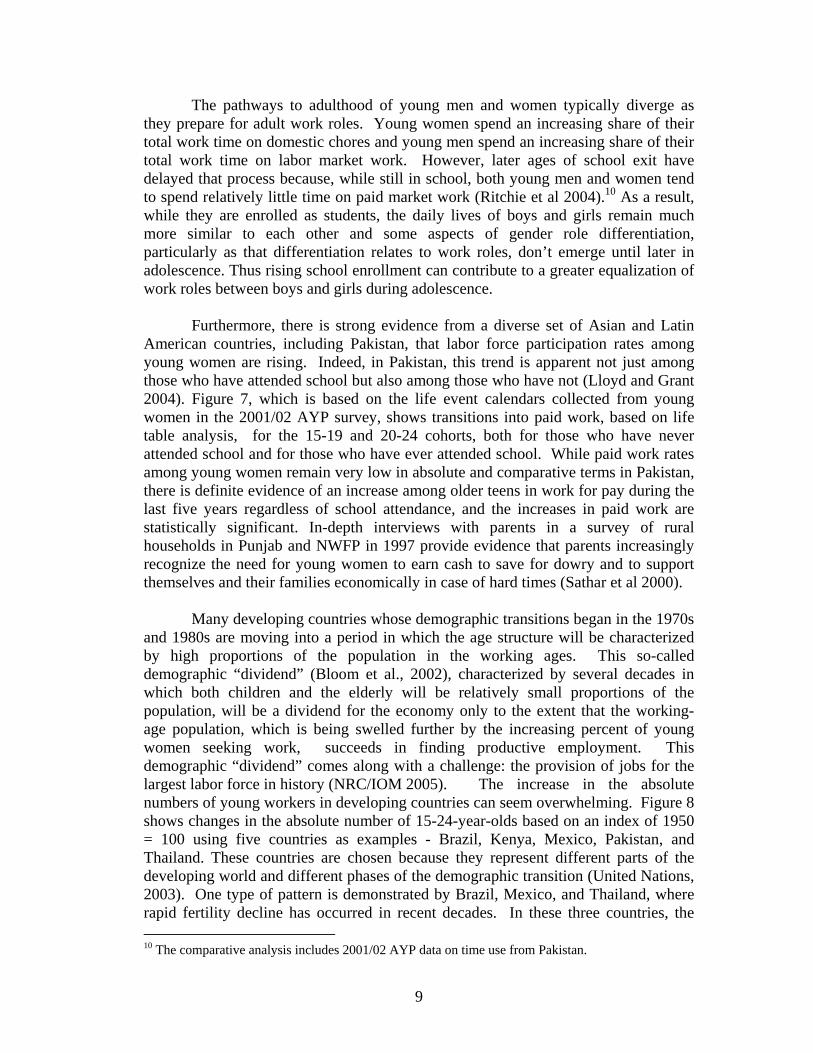
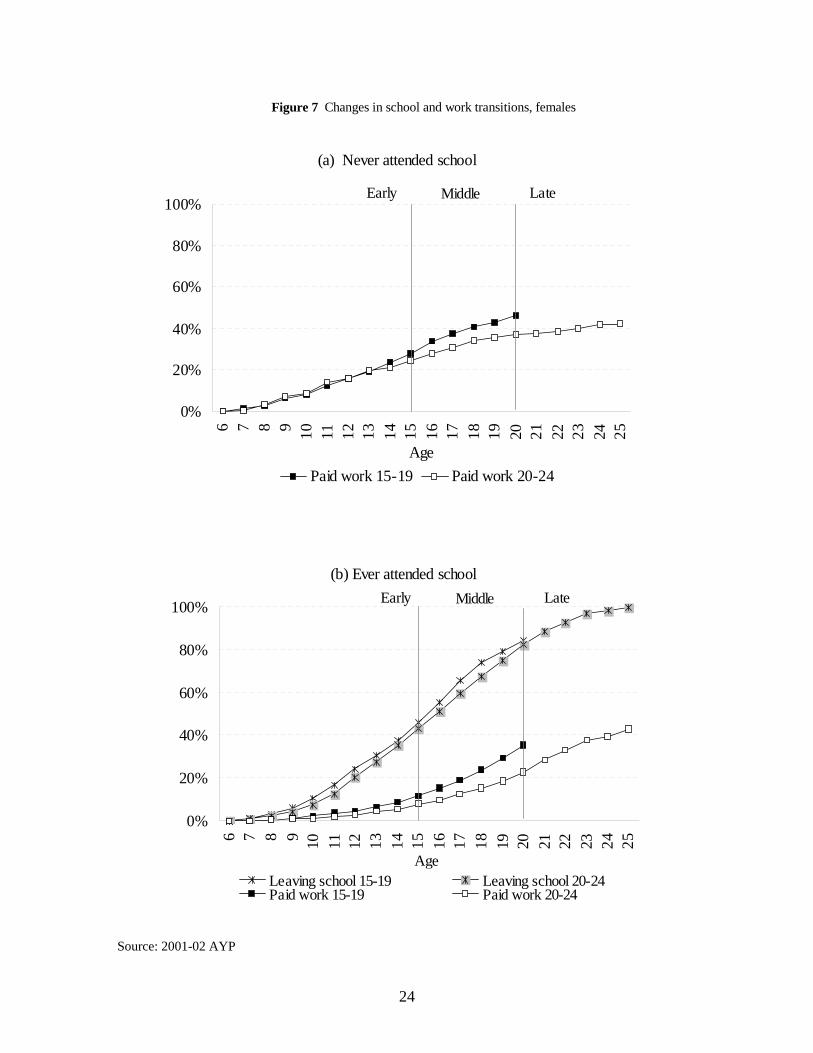
The pathways to adulthood of young men and women typically diverge as they prepare for adult work roles. Young women spend an increasing share of their total work time on domestic chores and young men spend an increasing share of their total work time on labor market work. However, later ages of school exit have delayed that process because, while still in school, both young men and women tend to spend relatively little time on paid market work (Ritchie et al 2004).10 As a result, while they are enrolled as students, the daily lives of boys and girls remain much more similar to each other and some aspects of gender role differentiation, particularly as that differentiation relates to work roles, don’t emerge until later in adolescence. Thus rising school enrollment can contribute to a greater equalization of work roles between boys and girls during adolescence. Furthermore, there is strong evidence from a diverse set of Asian and Latin American countries, including Pakistan, that labor force participation rates among young women are rising. Indeed, in Pakistan, this trend is apparent not just among those who have attended school but also among those who have not (Lloyd and Grant 2004). Figure 7, which is based on the life event calendars collected from young women in the 2001/02 AYP survey, shows transitions into paid work, based on life table analysis, for the 15-19 and 20-24 cohorts, both for those who have never attended school and for those who have ever attended school. While paid work rates among young women remain very low in absolute and comparative terms in Pakistan, there is definite evidence of an increase among older teens in work for pay during the last five years regardless of school attendance, and the increases in paid work are statistically significant. In-depth interviews with parents in a survey of rural households in Punjab and NWFP in 1997 provide evidence that parents increasingly recognize the need for young women to earn cash to save for dowry and to support themselves and their families economically in case of hard times (Sathar et al 2000).
Many developing countries whose demographic transitions began in the 1970s
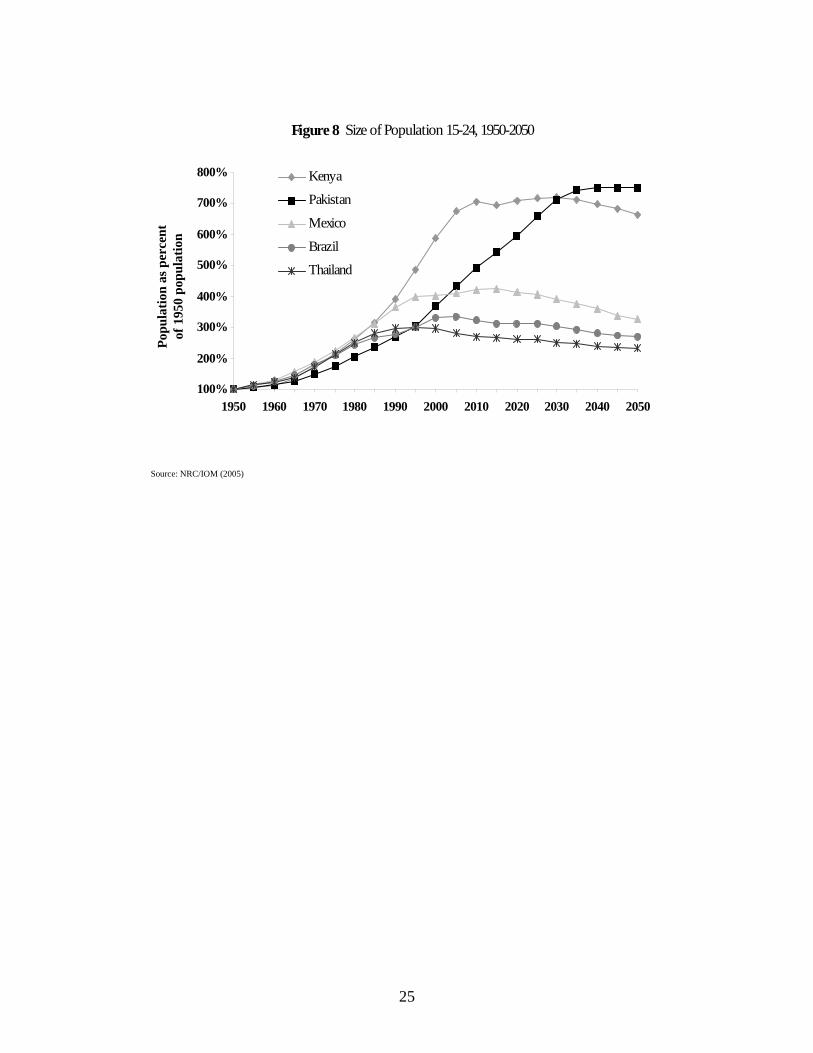
and 1980s are moving into a period in which the age structure will be characterized by high proportions of the population in the working ages. This so-called demographic “dividend” (Bloom et al., 2002), characterized by several decades in which both children and the elderly will be relatively small proportions of the population, will be a dividend for the economy only to the extent that the working-age population, which is being swelled further by the increasing percent of young women seeking work, succeeds in finding productive employment. This demographic “dividend” comes along with a challenge: the provision of jobs for the largest labor force in history (NRC/IOM 2005). The increase in the absolute numbers of young workers in developing countries can seem overwhelming. Figure 8 shows changes in the absolute number of 15-24-year-olds based on an index of 1950 = 100 using five countries as examples - Brazil, Kenya, Mexico, Pakistan, and Thailand. These countries are chosen because they represent different parts of the developing world and different phases of the demographic transition (United Nations, 2003). One type of pattern is demonstrated by Brazil, Mexico, and Thailand, where rapid fertility decline has occurred in recent decades. In these three countries, the 10 The comparative analysis includes 2001/02 AYP data on time use from Pakistan.
10
potential numbers of new labor force entrants peaked around 1990-1995 and has stabilized. Growth patterns in Kenya and Pakistan are strikingly different. While the growth of the 15-24 age group between 1950 and 2000 in Kenya was roughly similar to the growth observed in three other countries until 1985, it has diverged sharply since. In Kenya, where fertility was historically high and has come down rapidly in the last 15 years, the size of the youth population will level off in 2010 at about seven times its level in 1950. In the meantime, the size of the youth population in Pakistan will continue to grow steadily until 2035, reaching nearly eight times its size in 1950. In Pakistan, fertility decline has begun much more recently and taken off much more slowly than in Kenya.
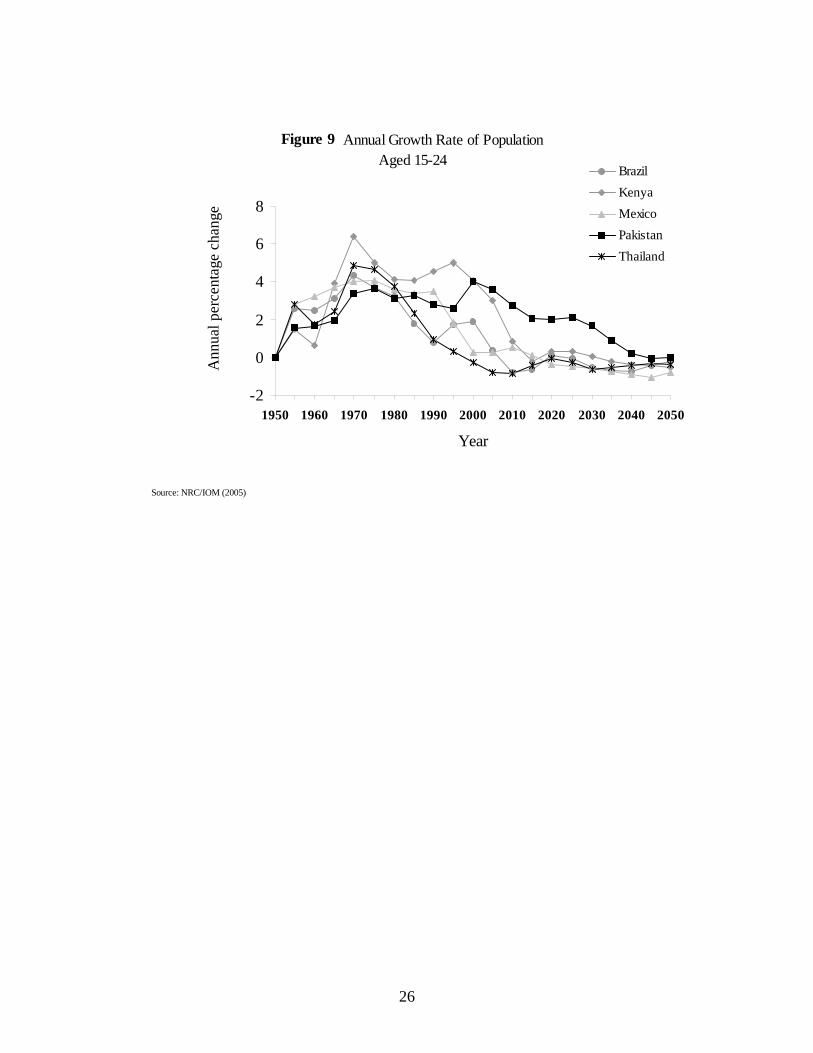
To put the absolute numbers in further perspective, Figure 9 plots the annual
growth rates for five-year periods for the same set of countries, beginning with the 1950-1955 period. The growth rate of this age group peaked at rates of 4 percent and above around 1970 for all countries except Pakistan. In Kenya, growth rates peaked at over 6 percent, nearly double the growth rates in Pakistan in the same year. Growth rates in Pakistan peaked in 2000 at around 4 percent, roughly the same growth rate as that of Kenya in 2000. In almost all developing countries, the growth rate of the youth labor force has been higher in recent decades than it will be in the coming decades. So while the challenge for youth employment will be substantial in countries like Kenya and Pakistan that have experienced unprecedented growth in the size of their youth population, the problem in proportional terms will be somewhat smaller in the future than it has been in the past.11
Sustained economic growth, much of it concentrated in the urban economy,
clearly played an important role in the historically unprecedented job creation that took place in many developing countries in the 1970s and 1980s. Whether economic growth of a similar magnitude will enable the countries of South Asia and Sub-Saharan Africa to create jobs for the large cohorts of young people that will enter the labor market in the coming decades is clearly an open question. IV. Transitions to Adult Family Roles
“in the context of rapid and persistent global changes…., the prerequisites for preparedness to be a parent are changing and the significance and consequences of early childbearing are assuming new meanings…. success as a first-time parent in many of the contexts in which young people are growing up today is more likely to be ensured if other adult transitions occur prior to parenthood. This is because each of these other transitions to adult roles – to work, to citizenship and to marriage – prepares the way for parenthood and contributes resources to success…. The moment that young people become first-time parents, they become major actors in shaping the health and well-being of the next generation.” (NRC/IOM, 2005, p. 8-1, italics added for emphasis)
11 This discussion was largely taken from Chapter 5 of NRC/IOM (2005)
11
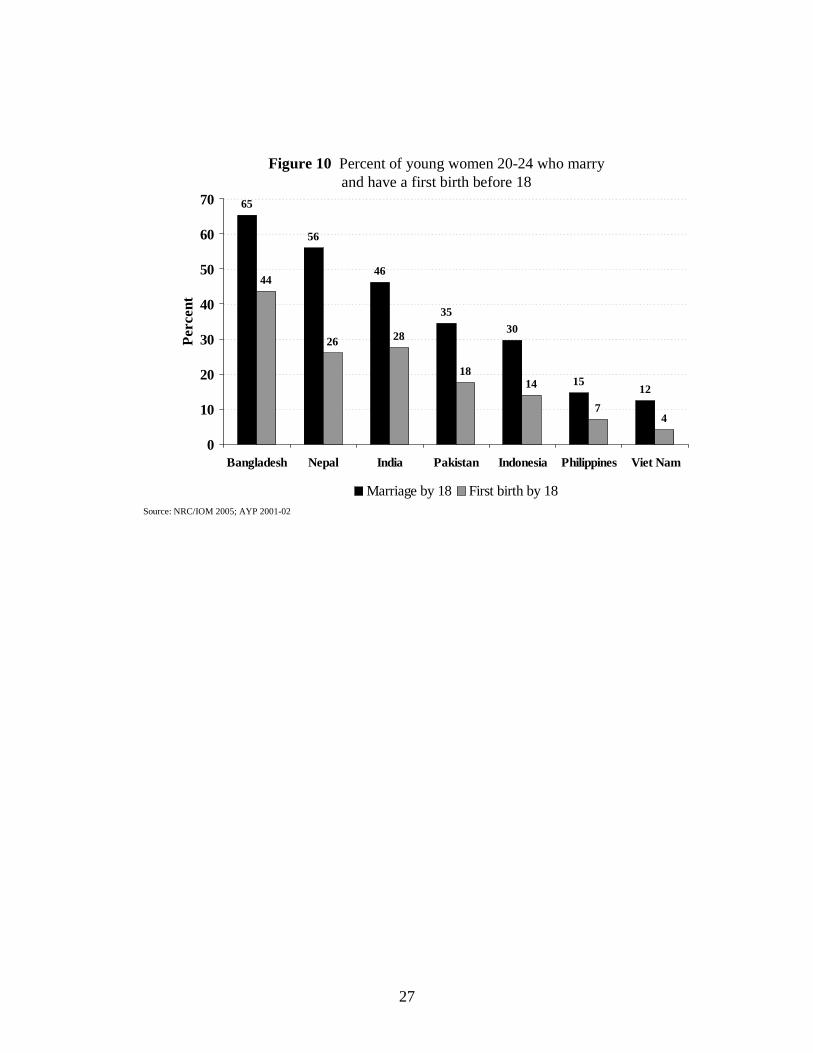
The UN Convention on the Rights of the Child defines childhood as extending to the age of 18. Despite the fact that most countries have signed this convention as well as the UN Convention on the Elimination of All Forms of Discrimination Against Women which states that “the betrothal of a child shall have no legal effect”, many young women in developing countries still marry below the age of 18 but relatively few young men do. Overall trends presented in Table 2 show a rise in marriage ages and a decline in the percent marrying below the age of 18 for young women in all regions but South America and Former Soviet Asia. Thus, progress towards the elimination of child marriage is being made but there is still a long way to go. While the percent marrying early in Pakistan is less than in some other South Asian countries (i.e. Bangladesh, India, Indonesia and Nepal (see Figure 10) and marriage ages in all these countries are continuing to rise, current rates of early marriage remain unacceptably high. In Pakistan, according to the 2001/02 AYP, many as 34.5 percent of 20-24 year olds having married before the age of 18 and 80 percent of these girls have never been to school.
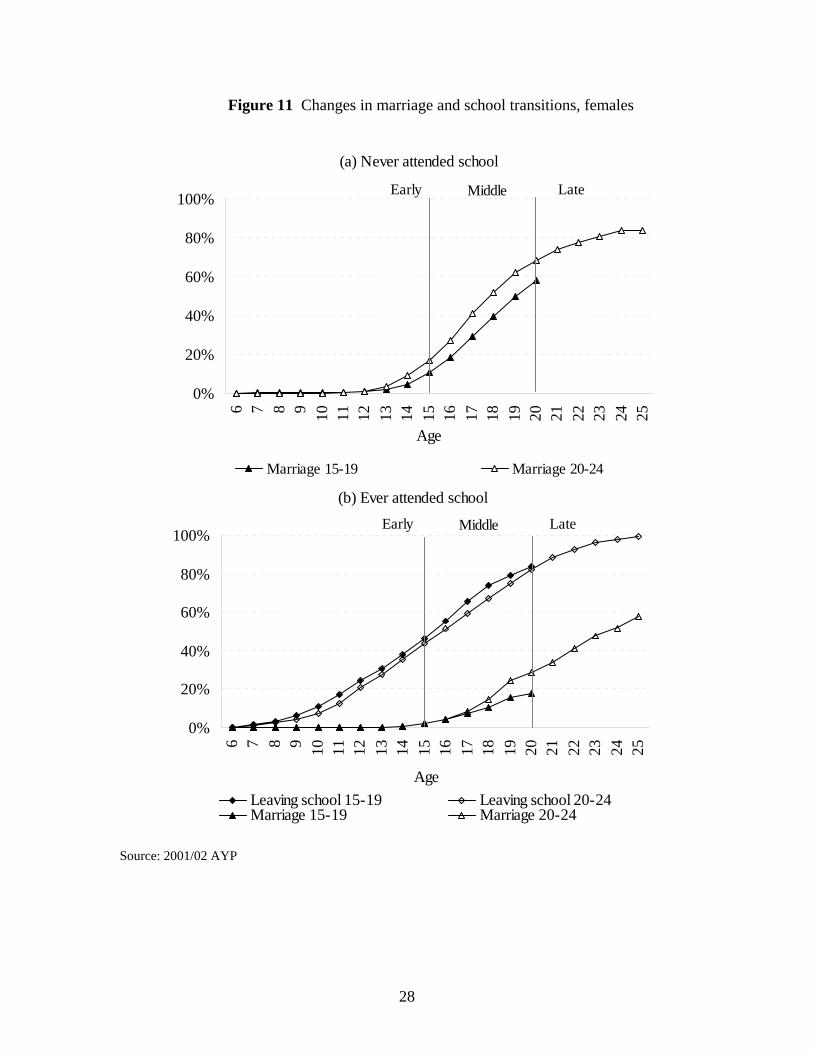
While marriage is much later for those girls who have ever attended school than for those who have never attended, the gap in terms of years between the time of school exit and the time of first marriage remains very large in Pakistan(see Figure 11). The estimated age, using life table techniques, at which 50 percent of school-going girls have left school is 14.6. The age at which 50 percent have married for the first time is 23.1 - a gap of over 7 years (Lloyd and Grant 2004). Thus, even among the 60 percent of girls in Pakistan already fortunate enough to go to school, there are plenty of years still available for potentially productive investments in schooling and training before marriage typically occurs. Therefore, school withdrawal for marriage is likely to be relative rare in Pakistan, given early school leaving ages.
The percent giving birth before the age of 18 has important implications for adolescent health as maternal mortality remains relatively high in South Asia and is differentially high for those given birth very young, typically below the age of 16 (NRC/IOM 2005). As the percent giving birth before the age of 18 is relatively low however, in Pakistan relative to some of its Asian neighbors due to later ages of marriage - 17.6 percent – maternal mortality is unlikely to be the primary cause of death among adolescents, although it is nonetheless an important cause (see Figure 10). However most women are married by the age of 24, however, and these young women, who are often newly married and having their first birth, do face challenges in getting the reproductive health services they need as new brides and mothers.
V. Implications for Policies and Programs
“Policies and programs designed to achieve positive and sustainable development and combat poverty confront both the opportunity and the challenge of promoting successful transitions to adulthood for a steadily growing population of young people living in developing countries. Substantial investments in the health and schooling of young people, if
12
designed and targeted effectively, will position these young people to participation constructively in shaping their own and their countries’ futures.” (NRC/IOM, p. ES-8 prepublication, italics added for emphasis) The NRC/IOM panel on transitions to adulthood in developing countries made
policy and program recommendations in five areas: (1) poverty, (2) gender equality and the empowerment of women, (3) schooling, (4) health, particularly reproductive health and (5) youth employment. The panel recommended first and foremost that all policies and programs designed to enhance successful transitions to adulthood for young people should be carefully targeted to the poor, particularly poor girls and young women who are often additionally disadvantaged. Secondly, the panel recognized that “addressing gender problems in society will call for interventions that affect all social classes and that give as much attention to boys’ attitudes and behaviors as to girls.”
Given all the good things that flow from schooling in support of successful transitions to adulthood — including better health, decent and productive jobs, not to mention better educated citizens and parents – and given the fact that the process of globalization itself is raising the bar on what can be seen as adequate levels of schooling for future generations, the panel felt that the achievement of universal primary schooling by 2015 as spelled out in the UN Millennium Goals will not be sufficient for the next generation to achieve success as adults. The rapidity of global change and the changing patterns of employment will require governments over the next decade to give much greater attention to the quality of primary schooling in order to build a base for a further rapid expansion in schooling at the secondary level. Further declines in fertility will also support further educational progress by slowing future population growth, freeing government resources for further educational investments and increasing the demand for schooling on the part of families.
In the area of gender equality and the empowerment of women, the panel identified three priority areas for programs and policies. The first is the promotion of gender equity in the classroom through gender training for teachers and school administrators. The second is the development of compensatory educational and training programs for disadvantaged and out of school youth, particular girls, so that these young people can regain the opportunities they missed as younger children before it is too late. Finally, the panel recommended the adoption of policies and program to support delays in marriage in places where girls still marry before the age of 18, a practice which is increasingly viewed by international groups around the world as a human rights violation. However, the panel recognized that for young women to benefit from delaying their marriages until 18, they will need to be provided with compensatory educational and training programs as noted above.
In the general health and reproductive health area, the panel noted that currently the provision of information and services for young people, whether they be married or unmarried, is generally limited to small scale efforts that reach a minority of those in need. The panel recommended that policy makers give priority to
13
increasing the provision of general health and reproductive health information in and out of school for all young people and to providing services to those young people who are married as well as to those young people that are unmarried but sexually active. Newly married couples and new parents are often neglected subgroups of the population in particular need of reproductive health services.
With respect to youth employment, the panel noted that young people are most likely to thrive in a healthy and flexible economy. Creating a healthy economy, however, does not just depend on individual entrepreneurship, local businesses and national governments but also on the global economy and in particular on trade policies that are often adopted in many far away developed countries. In particular the panel noted that trade sanctions against products produced with child labor or against countries known to violate international labor standards relating to child labor are likely to do more harm than good in contexts where poverty is persistent. Furthermore agricultural subsidies in the North undermine the growth of agricultural exports from developing countries. The panel also noted that research shows that young people are likely to fare better in labor markets where employers do not face excessive government regulations and where incentives are provided to firms to invest in on-the-job training of younger workers. This broad overview of potentially promising directions for policies and programs directed at young people provides some general guidelines; the actual specifics will vary according to context and according to the particular sub-population of young people of concern. In some cases, enough is known to design effective policies either from lessons learned elsewhere or at home; in many cases, however, it will be wise to include evaluation as an integral part of policy and program innovation. If rigorous evaluation is made a routine part of any phased implementation, lessons can be learned during a pilot phase of implementation and adjustments made before the project goes to scale, enhancing chances for success.
14
References Clemens, M. 2004. “The long walk to school: International education goals in historical perspective.” Washington. D.C. Center for Global Development. Filmer, Deon and Lant Pritchett, 1999. “The effect of household wealth on educational attainment: Evidence from 35 countries,” Population and Development Review 25(1): 115-132. International Crisis Group. 2004. Pakistan; Reforming the Education Sector, ICG Asia Report No. 84. Islamabad/Brussels: International Crisis Group. Kim, J, Alderman, H and Orazem, P.F., 1998. “Can cultural barriers be overcome in girls’ schooling? The community support program in rural Balochistan.” Working Paper Series on Impact Evaluation of Education Reforms, Development Research Group, the World Bank., No. 10. Kim, J, Alderman, H and Orazem, P.F., 1999. “’Can private school subsides increase the enrollment of the poor? The Quetta urban fellowship program,” World Bank Economic Review. 13(3) 443-465. Lloyd, Cynthia B and Monica Grant, 2005. “Growing up in contemporary Pakistan; The separate worlds of boys and girls,” The Changing Transitions to Adulthood; Selected Studies. Cynthia B. Lloyd, Jere R. Behrman, Nelly P. Stromquist and Barney Cohen eds. Washington, D.C: National Academies Press (forthcoming). Lloyd, Cynthia B, Cem Mete and Zeba A. Sathar. 2005. “The effects of gender differences in primary school access, type and quality on the decision to enroll in rural Pakistan,” Economic Development and Cultural Change (April forthcoming). Lloyd, Cynthia B. Mete, Cem, Sathar, Zeba and Grant, Monica. forthcoming. “The implications of changing education opportunities in rural Pakistan 1997-2004: school access, choice and quality” Population Association of America, Annual Meeting, Philadelphia, March 2005. Martin, M.O., Gregory, K.D. and Stemler, S.E.. 1999. TIMSS 1999 Technical Report. Available: wysiwyg://11/http://timss.bc.edu/timss1999i/tech_report.html. Mullis I.V.C. et al., 2000. TIMSS 1999 international mathematics report : Findings from IEA’s repeat of the third international mathematics and science study at the eighth-grade, available http://isc.bc.edu/timss1999i/math_achievement_report.html. National Research Council and Institute of Medicine. 2005. Growing Up Global; the Changing Transitions to Adulthood in Developing Countries, Panel on Transitions to Adulthood in Developing Countries. Cynthia B. Lloyd, ed. Washington, D.C: National Academies Press.
15
OECD. 2001. Knowledge and Skills for Life: First Results from OECD programme for International Student Assessment (PISA) 2000. Paris: OECD. Ritchie, Amanda, Lloyd, Cynthia B and Monica Grant. 2004. “Gender Differences in time use among adolescents in developing countries: the implications of rising school enrollment rates” Policy Research Division Working Paper No 193. New York: Population Council. Sathar, Zeba A., Cynthia B. Lloyd, Minhaj ul Haque, Judy A. Diers, Azeema Faizunnissa, Monica Grant and Munawar Sultana. 2003. Adolescents and Youth in Pakistan 2001-2002: A Nationally Representative survey. Islamabad. Population Council. Sathar, Zeba A, Cynthia B. Lloyd and Minhaj ul Haque. 2000. Investments in Children’s education and family building behavior in rural Pakistan: Finding from rural NWFP and Punjab. Islamabad: Population Council. United Nations. 2000. Millennium Development Goals United Nations. 2003. World Population Prospects: the 2002 revision CD-Rom. New York. United Nations. WHO. 2001. The World Health Report: 2001. Geneva: WHO.
16
Table 1 Population of young people Total Population Population (millions) Percent Population Annual Growth Rate (millions) Ages 10-24 Ages 10-24 Region 1980 2005 2030 1980 2005 2030 1980 2005 2030 1980-2005 2005-2030 World 4,435 6,454 8,130 1,336 1,755 1,875 30.1 27.1 23.0 1.1 0.3 Less Developed Regions
3,352
5,245
6,888
1,072
1,518
1,673
31.9
28.9
24.3
1.4
0.4
Asia (excluding Japan)
2,515
3,790
4,766
807
1,060
1,075
32.0
27.9
22.6
1.1
0.6
South-Central Asia1
981
1,615
2,192
307
493
549
31.3
30.5
25.0
1.9
0.4
Pakistan 81 161 272 25 52 81 30.5 32.4 30.0 3.0 1.8 Notes: Population estimates for 2005 and projections for 2030 are for United Nations medium variant Source: United Nations (2003) 1 South-Central Asia includes Afghanistan, Bangladesh, Bhutan, India, Iran, Kazakhstan, Kyrgyzstan, Maldives, Nepal, Pakistan, Sri Lanka, Tajikistan, Turkmenistan, and Uzbekistan.
17
Table 2 Percentage of women who married by age 18, by age at time of survey and region (weighted averages)
Africa
38.435.734.9Caribbean/Central America21.922.522.7South America
Middle East
52.048.237.7Totals45.535.123.2Western Asia/Northern Africa
Latin America and Caribbean14.210.915.9Former Soviet Asia57.654.241.5South-Central/South-Eastern Asia
Asia57.955.044.8Western/Middle Africa
52.845.736.5Eastern/Southern Africa
40-4430-3420-24Region
Source: NRC/IOM (2005)
18
Source: UN estimates and projections, assessed 2002. Available http://esa.un.org/unpp/index.asp
Figure 1 Population of Young People (Ages 10-24)as Percent of 1980 Level
50%
100%
150%
200%
250%
300%
350%
1980 1985 1990 1995 2000 2005 2010 2015 2020 2025 2030
PakistanBangladeshIranPhilippinesIndiaVietnamIndonesiaChina
19
Figure 2 Percent Ever Attended School by Cohort
100 80 60 40 20 Source: DHS and AYP
GuatemalaBrazilDom. RepublicNicaraguaHaiti
Burkina FasoNigerEthiopiaMaliSenegalChadGuineaCote d'IvoireTanzaniaMoroccoBeninComorosMadagascar
NigeriaC.A.R.
MozambiqueZambiaGhanaRw andaCameroonTogoMalaw iNamibiaEgyptUgandaKenyaSouth AfricaZimbabw e
ColombiaParaguayBoliviaPeru
PakistanBangladeshNepalIndiaTurkeyVietnamPhilippinesIndonesiaArmenia
Kyrgyz Repub.Jordan
UzbekistanKazakhstan
Boys Girls
20 40 60 80 100 Percent
10-14 yrs old 40-44 yrs old
20
0
20
40
60
80
100
40-44 35-39 30-34 25-29 20-24 15-19 10-14
Age Age
Philippines (1998)
Age
Nepal (2001)
Age
Bangladesh (1999-2000)
India (1998-2000)
Indonesia (1997)
Age
Pakistan (2001-02)
Age
Figure 3 Percentage Ever Attended School, 6 Countries
0
20
40
60
80
100
40-44 35-39 30-34 25-29 20-24 15-19 10-14
0
20
40
60
80
100
40-44 35-39 30-34 25-29 20-24 15-19 10-14
0
20
40
60
80
100
40-44 35-39 30-34 25-29 20-24 15-19 10-14
0
20
40
60
80
100
40-44 35-39 30-34 25-29 20-24 15-19 10-14
0
20
40
60
80
100
40-44 35-39 30-34 25-29 20-24 15-19 10-14
Boys Girls
Source: DHS and AYP data
21
Figure 4 Percent Completed 6 or More Grades of School by Cohort
20 40 60 80 100
20-24 yrs old 40-44 yrs old
Percent100 80 60 40 20 Source: DHS and AYP
Dom. RepublicHaitiNicaraguaGuatemalaBrazil
EthiopiaMaliBurkina FasoMadagascarChadNigerMozambiqueGuineaBeninMoroccoC.A.R.SenegalCote d'Ivoire
TogoRw anda
ComorosNamibiaMalaw iUgandaCameroonTanzaniaZambiaNigeriaGhanaEgyptKenyaSouth AfricaZimbabw e
ColombiaParaguayBoliviaPeru
PakistanBangladeshNepalTurkeyIndiaVietnamPhilippinesIndonesiaJordan
Kyrgyz Repub.Kazakhstan
ArmeniaUzbekistan
Boys Girls
22
0
2
4
6
8
10
40-44 35-39 30-34 25-29 20-24
Gra
de
Age Age
Philippines (1998)
Age
Nepal (2001)
Age
Bangladesh (1999-2000)
India (1998-2000)
Indonesia (1997)
Age
Pakistan (2001-02)
Age
Figure 5 Mean Grades Completed, 6 Countries
0
2
4
6
8
10
40-44 35-39 30-34 25-29 20-24
Gra
de
0
2
4
6
8
10
40-44 35-39 30-34 25-29 20-24
Gra
de
0
2
4
6
8
10
40-44 35-39 30-34 25-29 20-24
Gra
de
0
2
4
6
8
10
40-44 35-39 30-34 25-29 20-24
Gra
de
0
2
4
6
8
10
40-44 35-39 30-34 25-29 20-24
Gra
deSource: DHS and AYP data
Boys Girls
23
BOYS
0
25
50
75
100
0 25 50 75 100HIGH
LO
W
Figure 6 Percent of Students Aged 10-14 Currently Enrolled, by Socio-Economic Status
GIRLS
0
25
50
75
100
0 25 50 75 100HIGH
LOW
Latin America (8) Asia (12) Africa (28)
Pakistan
Bangladesh
Pakistan
Bangladesh
Source: DHS
24
Figure 7 Changes in school and work transitions, females
Source: 2001/02 AYSP
(a) Never attended school
0%
20%
40%
60%
80%
100%6 7 8 9 10 11 12 13 14 15 16 17 18 19 20 21 22 23 24 25
AgePaid work 15-19 Paid work 20-24
Early Middle Late
(b) Ever attended school
0%
20%
40%
60%
80%
100%
6 7 8 9 10 11 12 13 14 15 16 17 18 19 20 21 22 23 24 25
AgeLeaving school 15-19 Leaving school 20-24Paid work 15-19 Paid work 20-24
Early Middle Late
Source: 2001-02 AYP
25
Figure 8 Size of Population 15-24, 1950-2050
100%
200%
300%
400%
500%
600%
700%
800%
1950 1960 1970 1980 1990 2000 2010 2020 2030 2040 2050
Kenya
Pakistan
Mexico
Brazil
Thailand
Popu
latio
n as
per
cent
of 1
950
popu
latio
n
Source: NRC/IOM (2005)
26
Figure 9 Annual Growth Rate of Population Aged 15-24
-2
0
2
4
6
8
1950 1960 1970 1980 1990 2000 2010 2020 2030 2040 2050
Year
BrazilKenyaMexicoPakistanThailand
Ann
ual p
erce
ntag
e ch
ange
Source: NRC/IOM (2005)
27
Figure 10 Percent of young women 20-24 who marry and have a first birth before 18
65
56
46
3530
1512
44
26 28
1814
74
0
10
20
30
40
50
60
70
Bangladesh Nepal India Pakistan Indonesia Philippines Viet Nam
Perc
ent
Marriage by 18 First birth by 18Source: NRC/IOM 2005; AYP 2001-02
28
Figure 11 Changes in marriage and school transitions, females
Source: 2001/02 AYP
(b) Ever attended school
0%
20%
40%
60%
80%
100%
6 7 8 9 10 11 12 13 14 15 16 17 18 19 20 21 22 23 24 25
AgeLeaving school 15-19 Leaving school 20-24Marriage 15-19 Marriage 20-24
Early Middle Late
(a) Never attended school
0%
20%
40%
60%
80%
100%
6 7 8 9 10 11 12 13 14 15 16 17 18 19 20 21 22 23 24 25
Age
Marriage 15-19 Marriage 20-24
Early Middle Late