Embed Size (px)
Citation preview
The Developmental Welfare Stateno. 113 may 2005

National Economic and Social Council
Constitution and Terms of Reference
1. The main tasks of the National Economic and Social Council shall beto analyse and report on strategic issues relating to the efficientdevelopment of the economy and the achievement of social justice.
2. The Council may consider such matters either on its own initiativeor at the request of the Government.
3. Any reports which the Council may produce shall be submitted tothe Government, and shall be laid before each House of theOireachtas and published.
4. The membership of the Council shall comprise a Chairpersonappointed by the Government in consultation with the interestsrepresented on the Council, and
• Five persons nominated by agricultural and farming organisations;
• Five persons nominated by business and employers organisations;
• Five persons nominated by the Irish Congress of Trade Unions;
• Five persons nominated by community and voluntary organisations;
• Ten other persons nominated by the Government, including theSecretaries General of the Department of Finance, the Depart-ment of Enterprise, Trade and Employment, the Departmentof Public Enterprise, the Department of Social and Family Affairs,and a representative of the Local Government system;
4. Any other Government Department shall have the right of audienceat Council meetings if warranted by the Council's agenda, subject tothe right of the Chairperson to regulate the numbers attending.
5. The term of office of members shall be for three years. Casualvacancies shall be filled by the Government or by the nominatingbody as appropriate. Members filling casual vacancies may holdoffice until the expiry of the other members' current term of office.
6. The numbers, remuneration and conditions of service of staff aresubject to the approval of the Taoiseach.
7. The Council shall regulate its own procedure.
The Developmental Welfare State
May 2005
Published by the National Economic and Social Council
Copies of this Report may be obtained fromThe National Economic and Social Council, 16 Parnell Square, Dublin 1or the Government Publications Sales Office, Sun Alliance House, Molesworth Street, Dublin 2
Price: c15.00 Students: c5.00 Pn. A5/0621 ISBN: 0-7557-7079-X
Chairperson Mr. Dermot McCarthySecretary General,Department of the Taoiseach and Secretary to the Government
Deputy ChairpersonMs. Mary DoyleAssistant Secretary,Department of the Taoiseach
Government NomineesDr. Sean BarrettProfessor Brigid LaffanProfessor John FitzgeraldProfessor Eithne McLaughlinDr. Peter BaconMr. Tom ConsidineSecretary General,Department of Finance
Mr. Sean GormanSecretary General,Department of Enterprise,Trade and Employment
Mr. Brendan TuohySecretary General,Department of Communications,Marine and Natural Resources
Mr. John HynesSecretary General,Department of Social and Family Affairs
Mr. Niall CallanSecretary General, Departmentof Environment, Heritage and Local Government
Nominated by Business and Employers Organisations:Ms. Aileen O’DonoghueIBEC
Mr. Brian GeogheganIBEC
Mr. Liam KelleherCIF
Mr. Brendan ButlerIBEC
Mr. John DunneCCI
Nominated by the Irish Congress of Trade UnionsMr. Dave BeggICTU
Ms. Sally Anne KinahanICTU
Mr. Manus O’ RiordanSIPTU
Mr. Peter McLooneIMPACT
Mr. Jack O’ConnorSIPTU
Nominated by agricultural and farming organisationsMr. Seamus O’ DonohueICOS
Mr. Ciaran DolanICMSA
Mr. Damian McDonaldMacra na Feirme
Mr. Michael BerkeryIFA
Mr. Con LuceyIFA
Nominated by Community and Voluntary OrganisationsFr. Sean HealyCORI
Mr. Dónall Geoghegan NYCI
Ms. Deirdre GarveyThe Wheel
Mr. John Mark McCaffertySVP
Mr. John DolanDFI
SecretariatDr. Rory O’ DonnellDirector
Mr. Noel Cahill Economist
Mr. Bill ThompsonEconomist
Dr. John SweeneyEconomist
Ms. Jill MatthewsServed as a Social Policy Analyst in theSecretariat until March, 2005
Ms. Aoife HalliganResearch Assistant
Ms. Catherine O’BrienMs. Tracy CurranMs. Sheila Clarke
Membership of the National Economic and Social Council
ii
Table of Contents
Abbreviations viii
Preface ix
Acknowledgements xi
Executive Summary xiii
Chapter 1
Reasons for Revisiting and Reforming Ireland's Welfare State
1.1 Introduction 1
1.2 Social Challenges 2
1.3 Improving Responses 4
Chapter 2
Economic Performance and Social Protection
2.1 Introduction 9
2.2 Improving the Synergy Between Social and Economic Policies 11
2.3 Building a Social Model on High Levels of Employment 24
2.4 Conclusions 32
Chapter 3
Social Protection in Ireland — a Hybrid System
3.1 Introduction 35
3.2 The ‘Welfare Society’ and the Welfare State 36
3.3 A Broad View of Social Protection 39
3.4 Income Support Arrangements 44
3.5 Services Providing Social Protection 60
3.6 Public Capital Spending and Social Protection 75
3.7 Tax and Social Protection 78
3.8 A Provisional Balance Sheet 83
Chapter 4
Ireland's Social Protection in a Comparative Context
4.1 Introduction 95
4.2 Welfare State Differences in Practice 95
4.3 The Adequacy of Public Social Spending in Ireland 104
4.4 Public Social Spending and Outcomes 117
4.5 Conclusions 136
iv
Chapter 5
The Structure of Ireland’s Welfare State and the Principal Strategies Advanced for Reforming it
5.1 Introduction 139
5.2 Ireland’s Welfare State as Differentiated 141
5.3 The Case for More Universalism 143
5.4 The Case for a Stronger Insurance System 146
5.5 The Case for more Targeting 150
5.6 The European Context 152
Chapter 6
Re-conceptualising Ireland’s Welfare State
6.1 The Developmental Welfare State in Outline 155
6.2 Service Delivery in the Developmental Welfare State 159
6.3 Income Supports in the Developmental Welfare State 172
6.4 Activist Measures in the Developmental Welfare State 186
Chapter 7
The Developmental Welfare State: A Framework for Reform
7.1 Introduction 197
7.2 The Argument of This Report 197
7.3 The Essential Framework 201
7.4 Strategic Requirements for Effective Reform: How 205
7.5 Operational Requirements 211
7.6 Getting There: Priorities and Time Frame 214
7.7 Towards a More Comprehensive Approach 226
7.8 A Successful Society 228
References 232
National Economic and Social Council Publications 236
contents v
List of Tables
Table 2.1 Total Taxes (including Social Contributions) as a per Cent of GDP 14
Table 2.2 The Proportion of The Population Living in Working-Aged Households (Head aged under 60) Whose EquivalentIncome is Below 50 per cent of Median Equivalent Income 21
Table 2.3 Educational Profile of Employment in the Irish Economy 25
Table 2.4 Employment/Population Ratios, Total Population and Defined Sub Groups, Selected Countries, 2002 29
Table 3.1 Public Current Expenditure on Social Protection In Ireland, 2002 41
Table 3.2 Population Dependent on Social Assistance and Social Insurance,1993 and 2002 47
Table 3.3 Child-contingent State Income Support: Number of Child Beneficiaries and Expenditure Totals, 1993 and 2002 52
Table 3.4 Approved Consultant and NCHD Numbers, 1990–2003 64
Table 3.5 Projected Costs of Health Care and Pensions 67
Table 3.6 Students (Full-time Equivalents) and non-capital Public Expenditure per Student, 1985 and 2002 69
Table 3.7 Costs of ALMPs and Numbers of Participants, 1998–2002 73
Table 3.8 Public Capital Expenditure on Social Protection in Ireland, 2002 75
Table 3.9 The Taxation of Earnings in Ireland 79
Table 3.10 The Distributive Impact of Budgets 80
Table 3.11 Estimated Cost of Tax Allowances and Tax Reliefs for Social Purposes, 1993/94 – 1999/2000 (dm) 82
Table 4.1 Service Effort and Transfer Effort in European Welfare States, 1993 and 2001 97
Table 4.2 Service Emphasis and Reliance on Means-Testing in European Welfare States, 1993 and 2001 99
Table 4.3 Implicit Tax Rates on Consumption and Labour in European Welfare States, 1995–2002 101
Table 4.4 Implicit Tax Rates on Capital and Business Income and on Corporations in European Welfare States, 1995-2002 103
Table 4.5 Social Spending per capita and GNP per capita,d, constant 1995 prices 105
Table 4.6 Social Expenditure per Capita and GDP Per Capita,in PPS, EU 15 Member States, 2001 108
Table 4.7 Expenditure on Social Benefits by Function, 2001,PPS per Head of Relevant Population Sub-group 109
Table 4.8 Taxes and Social Spending in Ireland and Selected Comparator Countries (1997) 111
Table 4.9 Proportions of National Populations Aged 0–19 and 60 plus in 2002, and Changes in Those Proportions 1980–2002 115
Table 4.10 Expenditure on Health in Ireland and EU Member States, 2002 119
Table 4.11 Annual Public Expenditure on Educational Institutions in Ireland and EU Member States (2001) 121
Table 4.12 Indicators of Income Poverty for 2001 124
Table 4.13 Trends in Real Household Income at Different Points of the Income Ladder 126
Table 4.14 At-Risk-of-Poverty Rate, People Aged 65 years and over, 1998 129
Table 5.1 Economic Performance:Ireland and Comparator Countries Selected in 1992 145
Table 6.1 Overview of the Shift in Paradigm Governing Service Delivery 169
Table 6.2 Benefit Dependency Rates and Employment Rates among the Working-Age Population, and Unemployment Rates 1999 174
Table 6.3 Benefit Recipiency Rates in the Population of Working Age,by Types of Benefit Received, 1980, 1990 and 1999 176
Table 6.4 Overview of the Shift in Paradigm Governing Income Support Systems for People of Working Age 185
Table 6.5 Overview of the Shift in Paradigm Governing Activist Measures 195
Table 7.1 Monitoring Progress Towards the Development Welfare State 227
List of Figures
Figure 2.1 Total Tax As Percentage Of GDP, 1965- 1997 13
Figure 2.2 The ‘Golden Triangle’ of Flexicurity 19
Figure 5.1 The Differentiated Welfare State 141
Figure 6.1 The Developmental Welfare State: Core Structure 156
Figure 6.2 The Developmental Welfare State: Policy Thrusts 158
Figure 6.3 Deepening Dualism in the Differentiated Welfare State 163
Figure 6.4 The ‘Services Dividend’ in the Developmental Welfare State 171
Figure 7.1 The Developmental Welfare State 201
Figure 7.2 The Benefits of a Concentration on Early Childhood 216
List of Boxes
Box 2.1 Aligning Economic and Social Policy 10
Box 6.1 Views of the Irish Public on Education 161
Box 6.2 Performance Measurement 168
Box 6.3 Employment Services 191
vi
List of Charts
Chart 2.1 Employment in the Irish Economy by Median Education Of Job-holders 26
Chart 2.2 Employment growth by wage level in Europe and the United States,1993-2001. 27
Chart 3.1 Real Expenditure on Social Welfare,Selected Programmes, 1986–2002 (dm) 45
Chart 3.2 Unemployment and Benefit Recipiency Rates,Ireland – 1980, 1990 and 1999 53
Chart 3.3 Current Spending on Social Welfare,Health and Education — As Per Cent of GNP, 1985-2002 61
Chart 3.4 Current Real Public Expenditure on Health,Main Programmes, 1990-2003 61
Chart 3.5 Current Real Public Expenditure on Selected Health Services, 1990-2003 62
Chart 3.6 Real Current Expenditure on Primary,Secondary and Third Level Education, 1985–2002 69
Chart 3.7 Real non-capital Public Expenditure on Education per Student(Full-time Equivalent), 1985–2002 70
Chart 3.8 Real Capital Expenditure on Health,Education and Housing, 1985–2002 (dm) 76
Chart 3.9 Public Capital Expenditure on Housing,Education and Health as per Cent of GNP, 1985–20021 76
Chart 4.1 Expenditure on Social Protection in PPS per capita, 2001,Selected Countries 107
Chart 4.2 At-Risk-of-Poverty Rate Before any Social Transfers (top),After Pensions (middle) and After All Social Transfers (bottom), 2001 128
Chart 4.3 At-Risk-of-Poverty Rates, 0–15 year olds, 1994 and 2000 131
Chart 4.4 Value of Child Cash Benefits and Child Tax Benefits,£PPP per month, July 2001: couple, 2 children,one earner on half male average earnings 133
Chart 4.5 Value of Child Cash Benefits and Child Tax Benefits,£PPP per month, July 2001: lone parent, 2 children,earning half average male earnings 134
Appendix 3A Public Expenditure on Social Protection,
Principal Government Departments, 1985-2002 89
Appendix3B Tax Allowances and Tax Reliefs
for Social Purposes, 1993/94 to 1999/2000 90
Appendix3C The Growing Complexity of Ireland’s Social Policy
Institutional Framework 92
contents vii
ABPsArea BasedPartnerships
ALMPsActive Labour MarketProgrammes
A&EAccident andEmergency
CBChild Benefit
CDAChild DependantAllowance
CSOCentral StatisticsOffice
DCRGADepartment ofCommunity, Rural andGaeltacht Affairs
DoELGDepartment ofEnvironment and LocalGovernment
DESDepartment ofEducation and Science
DETEDepartment ofEnterprise, Trade andEmployment
DFDepartment ofFinance
DHCDepartment of Healthand Children
DJELRDepartment of Justice,Equality and LawReform
DSFADepartment of Socialand Family Affairs
DWSDevelopmentalWelfare State
ECHPEuropean CommunityHousehold Panel
EMUEconomic andMonetary Union
EUEuropean Union
FISFamily IncomeSupplement
GAIEGross AverageIndustrial Earnings
GDPGross DomesticProduct
GNPGross National Product
GNIGross National Income
GPGeneral Practitioner
HSEHealth ServicesExecutive
NESCNational Economic andSocial Council
OANCPOld Age Non-Contributory Pension
OACPOld Age ContributoryPension
OECDOrganisation forEconomic Co-operationand Development
QNHSQuaterly NationalHousehold Survey
OPFPOne Parent FamilyPayment
PAYGPay as You Go
PPSNPersonal Public ServiceNumber
PRETAPre-retirementAllowance
PRSAsPersonal RetirementSavings Accounts
PRSIPay Related SocialInsurance
RPRetirement Pension
UKUnited Kingdom
USUnited States
Abbreviations
viii
Preface
In its 2003 strategic overview, An Investment in Quality, the NESC reviewed andinterpreted Ireland’s long-run economic and social development and vulner-abilities. It argued that the remarkable economic progress of the past decade anda half results not only from obvious factors, such as inward investment and fiscalcorrection, but also from Irish policy and institutional adaptation. Among thesewas the creation of a flexible or ‘networked developmental state’—a web ofagencies and policies that create the conditions in which international enterpriseslocate in Ireland and Irish enterprises connect with global markets.
The Council argued that Ireland should aspire to create an equally effective andworld-class set of institutions and policies in the social sphere—a developmentalwelfare state. The term ‘developmental welfare state’ was chosen for two relatedreasons. First, the task of the social policy system should, first and foremost, be tosupport and facilitate the development of each person, enabling them to reachtheir full potential. Second, a key challenge for Ireland is to devise a welfare systemthat not only addresses social risks, needs and inequalities more adequately, butalso connects more fully with the dynamic economy. While the role of the state inthe economy has changed, the way in which it remains important is well capturedin the term ‘networked developmental state’. While the state retains a critical rolein meeting social needs, the direction it must take to support individual, social andeconomic well-being is captured in the term ‘developmental welfare state’.
In sketching the idea of a developmental welfare state, the Council suggested thatthe welfare system should be seen as consisting of three overlapping elements: taxand welfare transfers, the provision of services and activist initiatives. It assertedthat this way of thinking is helpful both in studying the evolution of the Irishwelfare system and in thinking about future options. This report demonstratesthat this new way of thinking of the welfare system does, indeed, increase ourunderstanding and provide a framework for reform.
This report provides a revised account of the evolution of the Irish welfare stateand a redescription of the serious social deficits that remain despite Ireland’sremarkable economic progress. The Council’s analysis balances a focus on incometransfers with increased recognition of the role of services in providing protectionagainst risks and of the important place that innovative social policy initiativesplay in achieving reform. Most important of all, it suggests a recasting of the socialdebate in a way that does not distinguish between the economic and the socialand can, therefore, build consensus—across the social partners, governmentand the wider society—on the need to urgently and radically address Ireland’ssocial deficits.
ix
While the report is sceptical of the application to Ireland of the standard inter-national textbook models of the welfare state, it engages closely with currentinternational thinking on what a new welfare state might look like. This is partic-ularly so in exploring the critical role that services must now play in addressingsocial exclusion, enabling participation, enhancing capabilities, supporting work/life balance and meeting care needs.
Indeed, the Council’s decision to undertake an over-arching study of Ireland’swelfare system can be seen as part of Ireland’s participation in the European ‘openmethod of coordination’. The open method of coordination is intended to create adisciplined comparison of member states’ policies for employment, social inclusionand economic reform. It asks Ireland to look beyond total employment growth andunemployment reduction, goals on which we score well, to re-examine the effec-tiveness of our activation measures, the adequacy of our training and life-longlearning, our achievement of flexible working arrangements, whether we arecreating equal opportunities in the labour market and the effectiveness of oursocial inclusion and anti-poverty policies. That examination shows that Ireland’semployment miracle has coincided with continuing high levels of benefit depend-ency, the persistence of significant social problems and the build-up of newpressures. This forces us to ask whether Ireland yet has a welfare, education andtraining system capable of supporting our aspiration to an inclusive society based on a high-participation, high-skilled, high-performance economy. While theEuropean process of comparison and coordination asks countries with moreentrenched welfare traditions to look beyond ‘system’ to assess the effectiveness oftheir individual welfare and labour market measures, it prompts Ireland to under-take a holistic examination of its overall social policy system.
x
Acknowledgements
In a report with a significant conceptual and analytic role as this one, the Secretari-at of NESC would first like to acknowledge the numerous authors of articles,reports and books — named or anonymous, national and international — whosework has been drawn on (with appropriate citation). This extends to former staffmembers of NESC who worked on social policy texts which have been importantinputs to this report. NESC, of course, retains full responsibility for how their workhas been used. The Council and Secretariat are grateful for the close attention paidto drafts by senior officials in government departments, in particular theDepartment of Social and Family Affairs. The interest and encouragement of theSecretariat’s colleagues in NESDO, of national and international experts (in partic-ular Joel Handler, Charles Sabel and Jonathan Zeitlin) and of a delegation from the Dutch Scientific Council for Government Policy under Dr Anton Hemerijck,also contributed to the report’s preparation. The Council acknowledges theexcellent work of its administrative staff — Sheila Clarke, Tracy Curran andCatherine O’Brien — in preparation of this report. Finally, the Secretariat would liketo record that nothing enriched the text so much as the inquiry and deliberation atCouncil meetings.
xi

Executive Summary
IntroductionIreland’s strong economic performance is a new context within which to seekmajor improvements in social protection. The challenge is both to facilitate as many people as possible in playing a role in the economy and provide tangibleproof—in the form of improvements in the quality of life for everyone—that goodeconomic performance is leveraging the creation of a more just and attractivesociety.
Ireland’s stronger economy is already supporting a much higher level of socialspending and there has been a significant amount of innovation and change ininstitutions and policies. Ireland’s welfare state and social policies, however, needto change further if they are to (i) address the deep rooted social disadvantage ofa section of the population that is showing little mobility off means-tested socialassistance, (ii) support people at work as they seek to maintain and improve theirparticipation in the economy, and (iii) set and reach wholly new standards in howpersons with disabilities and people in institutional care are supported.
A significant gap remains between what social actors see as necessary and what isaccomplished in practice. The implementation of formally agreed strategies can beweak, leadership is frequently contested, the data that would permit evaluation ofthe effectiveness of programmes is lacking, and social policy as a whole is notsufficiently aligned with the economic policies being pursued by the state. Thereare signs of process fatigue, uneven progress and even contradictory developmentsin the formation and implementation of social policy.
Progress in reinventing and repositioning Ireland’s social policies and welfare statewill require the same determination and some of the same processes thatimproved the country’s economic policies over the last two decades
Economic performance and social protectionThe international evidence is that good economic performance and improvedsocial protection are neither intrinsically opposed nor compelled to occur togetherin some automatic way. Rather, they can be made to support each other – wherethere is sufficient shared understanding and commitment on the part of thosewho shape and implement economic and social policies respectively.
Social policy is not simply an exercise in redistributing a surplus there to becreamed off after successful economic performance. The composition and mannerof social spending are as significant as its level. Poorly-designed social protection
xiii
can damage employment and reduce individuals’ participation in the labourmarket; well-designed social protection enables people to embrace more changeand take more risks than they would otherwise do. Social policy, therefore, mustassume its appropriate share of responsibility for the economic policies thatenable the widest possible number in the population to earn their livelihoods in adecent and humane way.
Significant social progress is, in fact, inherent in the successful unfolding of Ireland’score economic development strategies. For example, raising the employment ratefurther requires focussing attention on the obstacles faced—and supportsneeded—by relatively neglected groups in the working-age population; raisingskill levels increases the likelihood of people having satisfying jobs; providingopportunities for lifelong learning makes education no longer the prerogative of youth; fostering entrepreneurship means cultivating problem-solving skills,and so on.
At the same time, several of the major improvements in social protection nowrequired to address peoples’ needs more effectively will prove to be economicassets and contribute directly to ‘reinventing the economy’; for example, endingchild poverty, stemming educational disadvantage, tackling social exclusion, sup-porting people in their caring responsibilities, more flexible pension arrangements,and higher standards in publicly provided health care and education. In fact, theboundaries between traditionally separable economic and social policy domainshave become increasingly blurred.
Political judgement is needed to identify when imbalances between dynamism inthe economic sphere and security in the social sphere require correction, just aspolicy flexibility is needed to produce it. The interaction between economic andsocial policies is a key consideration in how Ireland’s welfare state continues tochange but, of course, it is not the only one. A society is more than its economy,and there are legitimate and important objectives for social policy that havenothing to do directly with fostering employability or productivity
A hybrid welfare state undergoing multiple changesSeeking to chart a course for the welfare state is, in part, an exercise in trying tounderstand what is happening to the family and civil society, and how the marketis being led by regulation, incentives and voluntary codes to deliver socialprotection. Ireland’s welfare state relies to a high degree—by internationalstandards—on the involvement of non-profit bodies. However, while the State isnot the sole actor in providing social protection, it is the principal one.
The heart of social protection by the State is frequently considered to be the socialwelfare it pays to ensure people have adequate money incomes. Access toservices—in health, education, housing and other areas—is also integral to socialprotection and, in some instances, more important to securing people’s livingstandards and participation in society than having a higher money income.
xiv
Major changes have taken place in the composition of social spending over the last 15 years. For example, spending on Child Benefit rose from 6 per cent of allsocial welfare spending in 1993 to 15 per cent in 2002; welfare receipt on the partof people of working-age did not decline despite the dramatic expansion inemployment and fall in unemployment—the composition of their welfare pay-ments altered in a major way and receipt is of extremely long duration for asignificant number of people; the cost of tax reliefs in support of occupationalpensions was considerably greater than spending on social welfare pensions by2002—the combined cost of reliefs and allowances supporting pensions and theincomes of people in their older years rose from 1.7 per cent of GNP in 1993 to 3.4per cent in 2000.
Significant changes have also taken place in public spending on services. Healthand educational spending is particularly important in enabling individuals to beself-reliant. Health spending, in real terms and as a percentage of GNP, rose sub-stantially after 1997. Users’ experiences of public health services has not improvedin line with the rise in spending and, in key instances, deteriorated. This makes theextent to which reform accompanies the allocation of further resources to thehealth services critical to their effective and efficient development and to publicconfidence in public services generally. Public educational spending per student atprimary, secondary and third level in real terms also rose significantly; as apercentage of GNP, however, it was lower in 2002 than in the 1980s. Educationalinstitutions are being challenged to look to hitherto neglected constituencies; theprovision of early childhood education and of adult education (second chanceeducation and continuing education) are far behind what the country will requireif it is to deliver on core social and economic objectives.
If Ireland's current welfare state were not showing significant resilience andadaptability, there would probably be a greater sense of crisis and it would beeasier to explore and accept radical changes. Yet Ireland's welfare state is beingchallenged—to revise systems that embody low expectations and achieve lowoutcomes for a minority, to support its population more adequately in changedtimes, and to institutionalise wholly new standards of participation and care for itsmost dependent and vulnerable members. In many instances, additional resourcesdo not guarantee the outcomes sought. New ways of working, new policy instru-ments and institutional innovations are required if additional resources are to beeffective in significantly improving on social outcomes.
It has never been more important to have some framework that would support theidentification and prioritisation of social spending, reduce oversights and imbal-ances to a minimum and give people a strong sense that fairness and justice arebeing applied to the allocation and use of the public resources produced by theirinvolvement in the country’s economic success.
executive summary xv
Ireland’s welfare state in a comparative contextIreland’s welfare state—by EU 15 standards—uses a moderate to low proportion ofnational resources in providing services and a low proportion in providing cashtransfers. This is despite Ireland having a level of wealth—whether measured inGDP, GNP or GNI per capita—that compares favourably with other EU memberstates. The reasons for the particularly wide gap between Ireland’s relative wealthand its relative social spending within the EU are a legitimate object of inquiry.
Some of the gap is due to having a young population and near full employment.Some of it is because growth in the economy has been so rapid that a decliningshare of GNP was still sufficient to finance large increases in social spending. Andsome of it is due to sections of the Irish population not enjoying the standards ofsocial protection which their counterparts in other advanced countries have insome areas. Significant policy developments are under way that will contribute toraising Irish standards in key areas.
Cash transfers as a percent of GNP are low compared to other countries principallybecause of the lower bill for pensions but also because of the Irish welfare state’shigh reliance on means-testing. Ireland is exceptional within the EU for the highproportion of its social spending which is means-tested. The contrast in Irelandbetween trends in absolute poverty (steadily declining) and relative poverty(steadily rising) is a striking aspect of the economic and social changes that havetaken place since the mid-1980s. It is not clear how these contrasting trends shouldbe reconciled. The evaluation of Ireland’s social welfare transfers in the light ofthese trends, in particular, is not a straightforward exercise. Few countries paysocial welfare at rates sufficient on their own to raise people above 60 per cent ofmedian income, yet most have lower proportions of their populations below thisline than Ireland. Differences in the level of social welfare payments acrosscountries need to be viewed in conjunction with eligibility conditions, conditionali-ty, and compensatory or supplementary access to services. Low at-risk-of-povertyrates tend to result from a combination of factors: the extent to which transferincome is combined with market income, the distribution of employment acrosshouseholds, the net wage to be had in low productivity jobs, the rates of socialwelfare payments, and short rather than long durations in receipt of social welfare.
Current public spending on health in Ireland is broadly comparable to othercountries in the share of national resources being devoted to it. That Ireland, never-theless, has poor relative health outcomes suggests better use can be made of theresources being devoted to health. This is not just a challenge to the managementof health organisations and the ethos of health professionals but underlines theneed for co-responsibility for health to be exercised right across Irish society (in useof alcohol, diet, etc.).
Current public spending on education in Ireland accounts for a comparatively smallshare of GNP by EU 15 standards. There are some grounds for satisfaction that thisspending is efficient in attaining outcomes, but largely when outcomes for youngpeople from non-disadvantaged backgrounds are considered. By contrast, educa-tional disadvantage has, so far, not been significantly reduced by higher spendingand low levels of spending by international standards are being incurred on behalfof pre-school children and older age groups.
xvi
Higher social spending is a means to an end and not, in itself, an achievement. Ineach society, including Ireland, unique circumstances determine the relationshipbetween social outcomes and levels of state spending. Several key variables inter-act with public spending to determine the outcomes achieved. These include theroles of the family and of the voluntary and community sector, establishedbehavioural patterns, the quality of management, the level and quality of trainingof staff, the ethos of public service in the professions, workplace practices, the easeof combining partial welfare support with some degree of earnings. It is importantthat strategies for social spending in each area reckon with the factors that co-produce the outcomes being sought.
Learning well from other countriesIreland’s current welfare state has disparate elements that resemble, respectively,the citizen-based Nordic welfare model, the social-insurance Continental Europeanmodel and the residual Anglo-Saxon welfare model. A case can validly be madethat the necessary reform of Ireland’s welfare state requires deliberately choosingto be more like one of these models. However, the welfare states of other countriesare based on characteristic cultures and institutions as much as, or more than, ondefined ideologies. There is also considerable ferment and the adoption of mixedelements within their current reform programmes. Some close observers nowdescribe them as hybrid also.
Significant learning from the more sharply defined welfare models of othercountries is possible and important in specific instances. In the new economic andsocial circumstances in which Ireland now finds itself, however, the hybrid characterof the Irish system is, more than ever, a potential strength. The challenge informulating an overarching strategy for Ireland’s welfare state is to identify whereand how elements of further universalism, extended social insurance andredesigned targeting are required, with emphasis on improved outcomes ratherthan greater ideological clarity. Institutional weaknesses and maladapted designstill characterise many of Ireland’s arrangements for providing social protectionand are responsible for poorer outcomes than it is possible to achieve even withthe same level of resources.
executive summary xvii
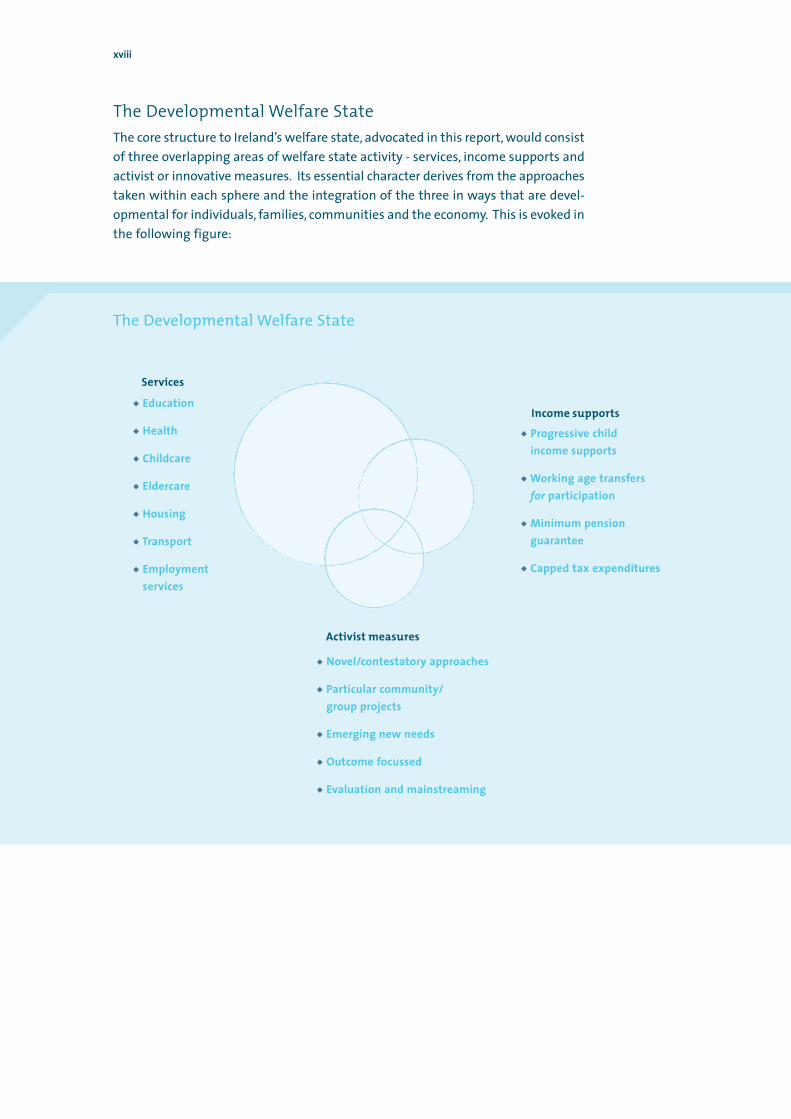
The Developmental Welfare StateThe core structure to Ireland’s welfare state, advocated in this report, would consistof three overlapping areas of welfare state activity - services, income supports andactivist or innovative measures. Its essential character derives from the approachestaken within each sphere and the integration of the three in ways that are devel-opmental for individuals, families, communities and the economy. This is evoked inthe following figure:
xviii
The Developmental Welfare State
Services
Income supports
Activist measures
s Education
s Health
s Childcare
s Eldercare
s Housing
s Transport
s Employmentservices
s Novel/contestatory approaches
s Particular community/group projects
s Emerging new needs
s Outcome focussed
s Evaluation and mainstreaming
s Progressive child income supports
s Working age transfersfor participation
s Minimum pensionguarantee
s Capped tax expenditures
Services. Access to the wide set of services listed in the figure is essential to attain-ing the workforce quality that underpins a competitive, knowledge-based economy,to maintaining social cohesion and combating social exclusion.The DevelopmentalWelfare State (DWS), therefore, regards the radical development of services as thesingle most important route to improving social protection. The first public policychallenge is to ensure that every member of Irish society has access to the leveland quality of service she or he needs, with quality and equity being assured.Government’s primary role, then, is to act as the regulator and guarantor of diversi-fied, high quality and equitable regimes for each type of service. This requires thatit harness the characteristic contributions of non-profit organisations and thecommercial sector. A subordinate challenge is to identify the appropriate scale andnature of direct public service provision.
Social protection that is paid for by the state does not have to be provided by thestate. A combination of strong public sector organisations and competition fromprivate and non-profit organisations is most likely to achieve the best balancebetween accountability, innovation and efficiency. Successful experiences in othercountries point to the need to accord service deliverers—in whatever sector theyoperate—more autonomy to decide how they use resources in the pursuit ofagreed outcomes and more incentive to innovate in the search for improvements,while structuring their accountability to service users and central government innew ways.
In the DWS, which this report advocates, direct public provision of social servicesremains one route among others, but subject to accountability based on outputsand to being challenged by research on how its outputs relate to outcomes. Thisdoes not mean assigning a residual role to public sector providers within servicesystems. Public sector providers can be characterised by low transaction costs (lessneed for regulators), equitable access, good working conditions, high levels of staffcommitment and strong public trust. When these latent characteristics in a publicsector organisation are developed, with neither efficiency nor service qualitydeteriorating, society has a particularly valuable asset.
The Developmental Welfare State envisages a ‘services dividend’ for Ireland’spopulation from the country’s strong economic performance. The vast majority ofthe population then use the same set of services and this strengthens socialcohesion. This is possible when the services themselves are not uniform outputsbut capable of gradation and adjustment to help diverse groups attain similaroutcomes. Mainstream providers adopt an approach of ‘tailored universalism’ andadjust their services to accommodate a more diverse public, including people whoare socially disadvantaged. This route is consciously preferred to the alternative ofdeveloping completely separate services for atypical groups. This increases the roleof services in combating social exclusion, as people who are socially disadvantagedhave access to high quality mainstream services which contributes significantly totheir mobility out of poverty.
executive summary xix
Incomes. It is a feature of the DWS that differentiated thinking is brought to bearon income supports for individuals at different stages in the lifecycle.
Children receive priority because of the greater awareness of the later problemsthat result from a poor start in life for individuals and from birth rates maintainedat a low level for society. It is accepted that parental circumstances should not bethe cause of any child being denied access to key developmental opportunities;while all children are supported, some are supported more than others (progressiveuniversalism).
Older people receive priority because of their growing numbers and the realisationthat, in old age, there is effectively nothing individuals can any longer do if theirincome from all sources is insufficient to keep them from poverty. It is acceptedthat the basic state pension has to be the major bulwark for keeping retired peoplefrom being at-risk-of poverty and that access to it, or its equivalent, has effectivelyto be open to every person in retirement.
For people of working age, the generalised improvements in education, health andother social supports lead to the expectation of a labour market that is steadilymore inclusive, while the attainment of higher employment rates, in turn, helps toplace the whole edifice of social protection on a firmer foundation. Tailored progre-ssion pathways become the rule rather than the exception for welfare recipients;payment rates raise all people to a minimum threshold of income adequacy whilepayment arrangements facilitate as many people’s eventual participation aspossible in employment or other social activities. Disincentive effects, where theyarise, are addressed by intensifying recipients’ engagement with selected serviceproviders rather than by depressing payment levels.
Activist or innovative measures. Innovative, pro-active measures are akin to theR&D sphere of the Developmental Welfare State. Through them organisations—inthe community and voluntary, public and private sectors—respond to unmet socialneeds, initially in a particular and once-off manner but with implications for main-stream service provision that are systematically identified. Their once-off andparticular nature leads to a number of possible outcomes. A specific challenge ismet and the initiative is stood down (e.g., after the successful regeneration of anarea). The responsibility and key design elements which the initiative pioneeredare adopted into a mainstream programme. The pilot nature of the initiative is suc-ceeded by a settled status as it becomes a niche service, with the organistionbehind it enjoying autonomy and long-term funding in return for meeting agreedperformance targets.
In many areas—helping jobless people to participate in the open labour market,stemming educational disadvantage, combating social exclusion and area disad-vantage, responding to homelessness, etc.—the collective challenge to Ireland’ssocial partners is not a minor one of how to retain and make small adjustments tocurrent schemes. Minimally, it is the deeper challenge of recognising the extent towhich current features of programme design and delivery need to be altered tomeet the increasingly complex and multifaceted needs of individuals, families andcommunities. Maximally, it is the challenge of re-conceptualising what the pro-grammes are for and how they should be delivered.
xx
This requires giving greater recognition to community and voluntary groups whopioneer ways of addressing the marginalised positions of individuals, families andcommunities—creating the right framework for their continuing emergence whileengaging them in networks and processes which raise their standards, increasetheir effectiveness and ensure transparency and accountability in return formedium to long-term security in funding. The Developmental Welfare State fostersthe willingness and ability of government departments and public agencies toplan and implement pilot projects that experiment with new approaches andprocedures. It is pro-active in extending a radically greater degree of autonomy tolocal actors and developing new forms of public-voluntary and public-privatepartnerships. These feature a strong emphasis on performance and accountability,provision for systematic learning and evaluation, and new forms of centre-localrelationships. A central aspect of these new relationships is agreement on theoutcomes being sought, how progress towards them is to be measured, the rightsof the centre to the necessary data for evaluation and to intervene in certaincircumstances, and the possibility for local actors of greater autonomy and securityin funding. All this requires statutory service providers to reconfigure their ownbudgets and models of delivery.
Strategic and operational requirements for moving forwardGovernance and leadership. Coalitions are needed to ensure comprehensiveresponses to social deficits. This requires ‘joined-up’ government to ensure effec-tive coordination across the public sector and the exercise of governance tointegrate the contributions of non-public bodies. The need for governance is arecognition that even the full exercise of state powers in many areas cannotguarantee the outcomes sought. Governance, however, throws up the challenge ofleadership and makes it particularly likely to be contested.
Rights and standards. Complexities and tensions within the rights tradition throwlight on how Ireland’s welfare state needs to develop. Vindicating socio-economicrights—or even specifying what they mean—is not in the power of courts or ofgovernments acting on their own, but requires wide societal engagement increating the policies and institutions that establish their content and meaning ina specific context. It becomes of paramount importance to concentrate on specify-ing, attaining and monitoring the standards that should govern the various areasof service provision (health, education, social welfare, housing, employmentservices, etc.).
Standards are both statements to service users and statements by service deliver-ers. They allow service users to see the content of their social and economic rightsin the context in which they are living, and express what the individual has a rightto expect and what she or he is committed to support being provided on her/hisbehalf for others. Standards also express how service deliverers understand whatit is within their competence to provide (based on current technological, knowl-edge and organisational frontiers) and what constitute the hallmarks of doing soprofessionally.
executive summary xxi

Integration at the local level. The agency of local actors (the primary care team,the school, the area partnership, the estate management body, etc.) can and shouldbe enhanced through bolder innovations featuring new types of relationshipsbetween central and local bodies. This is not the same as decentralising theoperations of central bodies. It requires a centre that is strong but not simplybecause it has a large network of regional or local offices or can use its fundingpower to influence what recipient organisations do. The strength in question is theability to acquire, process and disseminate knowledge on feasible standards andhow they can be attained, and to promote their adoption throughout a network ofdiverse and autonomous service providers
Operational requirements. Strategic requirements are one thing and the capacityto implement them another. Particular challenges have to be faced and overcomeif implementation deficits are to be addressed. In particular, high-level politicaldecisions and social partnership procedures must be supportive of the necessarychanges at the operational level; significant improvements in the management ofpublic expenditure are still required; public administration must develop its capa-bilities to activate, orchestrate and modulate networks of interdependent actors;management and workers must achieve a greater integration of the consultationand deliberation characterising partnership with organisational changes that areeffective in modernising service delivery and improving its efficiency.
Supporting people across the life cycle. A fundamental standpoint from which tojudge the adequacy and effectiveness of overall social protection is to assess therisks and hazards which the individual person in Irish society faces and thesupports available to them at different stages in the life cycle. The life cycle alsoprovides a good framework for choosing among competing priorities and mobili-sing the social actors to implement the Developmental Welfare State as thefollowing chart shows:
xxii
Monitoring Progress Towards the Development Welfare State
Who? What? How?
Integration of services,income support and Governance Standards
activist measures and leadership and rights
0-17
18-29
30-64
65+
People challenged in their personal autonomy
With respect to children, priority must to given to the poorest children in the statein the allocation of further resources for child-income support. In addition, no childshould be denied access to services critical to her or his development because ofinadequate parental income. With respect to people of working-age, the severalcontingency-based, social assistance payments should eventually, as a long-termproject, be merged into a ‘participation income’. Its rate would ensure adequacy tocover basic needs while supplements and supporting services would foster progres-sion. Meaningful participation is a legitimate expectation of people of working-age (their expectation of society and society’s expectation of them) and, only inrare cases, does an individual have no capacity to develop a greater degree of self-reliance. With respect to people in retirement, there is need for a regular, authori-tative and comprehensive review of their evolving needs and of the efficiency,effectiveness and responsiveness of the social protection extended to themthrough services and income supports of every type. While the adequacy of statesocial welfare pensions cannot be divorced from the sustainability of the arrange-ments for providing them, priority needs to be given to increasing the rates ofsocial welfare pensions.
Recasting the Irish social debateThose debating Ireland’s social progress risk being at cross purposes. One groupbelieve Ireland’s economic development has sacrificed compassion, socialstandards and solidarity; another that an increased emphasis on social protectionmust necessarily erode the economy’s cost competitiveness. The Council isconvinced that the development of a dynamic, knowledge-based economy hasinherent social implications that can serve social justice and a more egalitariansociety, and that the development of Ireland’s welfare state as outlined in thisreport is integral to sustaining the dynamism and flexibility of its economy. In aglobalised world, the strength of Ireland’s economy and the attractiveness of itssociety will rest on the same foundation – the human qualities of the people whoparticipate in them.
executive summary xxiii

Reasons For Revisiting andReforming Ireland’s Welfare State
1
1.1 Introduction
In its 2003 Strategy, the Council provided an account and understanding of Ireland’s economic and social development. An important part of thatunderstanding is that the state through its economic development institutionsplayed a significant role in enabling the economy to internationalise with a highdegree of success. In that Strategy report, the Council posed the challenge ofbringing a similar focus and creativity to Ireland’s welfare state. It stated itsconviction that ‘a new kind of welfare state, more suited to the economic, socialand technological realities of the 21st century’ is now an emerging possibility forIreland (2002: 51).
In the first place, this is because we have a stronger economy. It is alreadysupporting higher levels and new forms of social expenditure. More importantly,it makes the ambition of achieving major improvements in the standards of socialprotection that characterise Irish society a wholly reasonable one. It makesradically reducing or altogether eliminating the more damaging social deficits thatstill exist feasible and a stronger moral imperative. The ‘social dividend’ of strongeconomic performance must, however, take forms that are supportive of thecountry’s on-going ability to trade advantageously in the world economy. If thesocial policies adopted are not supportive of continued economic strength, theeventual result will be a return to poor social protection. Part of the challenge tosocial policy, therefore, is that it facilitate as many people as possible playing a rolein the economy and that it provide tangible results — in the form of parallelimprovements in the quality of life for everyone — that good economicperformance is leveraging the creation of a more just and attractive society.
Progress in reinventing and repositioning Ireland’s social policies and welfare statecan benefit from a similar determination and some of the same processes as havethe country’s economic policies over the last two decades — the sharedunderstandings; the focus on outcomes; the on-going re-conceptualisation and re-analysis of the basis of Ireland’s comparative advantage; the networking role of thestate and its agencies. While there are profound differences between achievingsocial progress and a strong economic performance, some lessons are transferable.The country’s economic resurgence from 1986 onwards was not due to imitatingwhat other countries had done but the consequence of forging a uniquely Irishpath to the internationalisation of its economy:‘it (was) the willingness and abilityto change policies, arrangements and institutions that ultimately underliesIreland’s (economic) success’ (NESC, 2003: 147). The manner in which we will realise
1
our social ambitions will, similarly, not be through importing a social model fromanother country or region but by developing a shared understanding of thestrengths and weaknesses of Ireland’s current welfare arrangements and of theorganisational, technological and performance frontiers which can be exploredthrough coordinated action.
In addition to the need to respond to economic success, a new kind of welfarestate is needed because Irish society itself is radically different to the societythat existed only a few decades ago. The population is significantly larger nowand continuing to grow, people are better educated, more fully employed andthey are living longer. The average household size is smaller and the types offamilies formed are more diverse. More of the population live in or near largesettlements, and these include a larger number of ethnic and cultural minorities.Not surprisingly, the values and expectations that people hold are alsochanging. There is a stronger appreciation of the individual and of her/his life assomething to be personally shaped. A significant erosion has taken place in thelegitimacy of traditional sources of authority — religious, political, business andprofessional. There is stronger social awareness and a growing unease at theextent of social disparities within Ireland, an increased exposure to othercountries’ standards and practices and greater access to information as a resultof the new ICT technologies.
1.2 Social Challenges
In the face of such deep social and economic transformations, the Council believesit is both opportune and necessary to re-visit the basic architecture and coreobjectives of Ireland’s social policies and welfare state, and in several key respectsto reform them. The Council sees three sets of social challenges as providing theimmediate motivation for doing so.
(1) Significant minorities in Ireland’s population are currently experiencing one ormultiple forms of social disadvantage, and present strategies and policies are notproving adequate in helping them.
This is evidenced particularly by the scale of educational disadvantage, the longduration of dependence on means-tested social welfare of a large number ofpeople, and the extent to which people are found in similar predicaments in thesame areas from one generation to the next. At a time when Ireland’s economyand society are benefiting from the participation of increasing numbers of peoplefrom overseas, a significant section of the Irish population remain singularly ill-equipped to participate in the economy themselves. If Ireland is to create alearning society and a knowledge-based economy, it cannot give up on thesepeople. As learning disadvantage, entrapment on low incomes and other socialdeficits persist, their consequences for the individuals, families and communitiesconcerned become more and more serious because the thresholds to competence,skills and income which give access to Ireland’s economy and society arecontinuing to rise.
2
(2) Significant numbers of people at work need access to a wide range of services if they are to attain and retain the lifetime employability, flexibility and adaptability required of them as members of Ireland’s workforce in aninternationalised economy.
This is particularly evident in the scarcity of available and affordable childcare, theneed for new services to support the growing number of people at work who haveresponsibilities for eldercare, and the challenge of making a reality of life longlearning. In other areas too a radical improvement in services is needed to ease thesignificant stress and wear of holding employment in Ireland. For example:parental entitlements and protection at work need significant improvement;access to public health services for people on low earnings should be less costly(currently, they lose entitlement to a medical card and have to pay a significantproportion of their net weekly income to visit a GP and buy medication); the reachand quality of public transport needs to be improved (Irish workers currently relyheavily on the private car and have long journey lengths by European standards).Attaining and sustaining high levels of employment has implications for servicesprovision that, in many instances, are being too slowly addressed.
(3) Values are changing, standards are rising, and attitudes and expectations are different with respect to what constitutes acceptable provision for personsvulnerable to social exclusion, for whatever reason.
This is particularly evident in the new understanding and approach being taken toprovision for persons with disabilities in the National Disability Strategy and toprovision for children in the 2001 Children’s Act. The greater awareness of humanrights generally is throwing light on the fact that Ireland has had assumptions,practices and standards in several areas of social protection that are simply nolonger acceptable (e.g., in its mental health institutions, children’s homes, prisons).The self-respect of a society — as well as its societal cohesion, social peace andpotential economic growth rate — is intimately related to the extent andstandards of social provision made for its most vulnerable members. Attempts toraise significantly the reach and standards of social protection for vulnerableindividuals and groups have already had, and will continue to have, significantimplications for social policy and resource allocation in every area — mainstreamsocial welfare, housing, health, education, training, and employment policies, andtailored social inclusion measures.
These three sets of social challenges originate from and within Irish society.To a significant extent they are bequeathed to us as unfinished business by theinherently uneven nature of economic and social development and by theparticular history, traditions and circumstances which have influenced Ireland’ssocial progress. In addition, Ireland’s welfare state faces challenges common to allEuropean welfare states because of profound demographic, social and economicchanges affecting the Western world. Many other countries are embarked onprocesses of welfare reform that are more deliberate and radical than anythingproposed for Ireland. There are good reasons why that is so. Frequently, theirwelfare states are more mature and more demonstrably under threat from newdevelopments. For example, the ageing of their populations is more advanced thanIreland’s; their pension systems are under-funded and paid for almost wholly by
reasons for revisiting and reforming ireland’s welfare State 3
the generation currently at work; their birth rates have bottomed out at very lowlevels; a greater part of their edifice of social security is built on social insurancemaking it difficult to employ profitably people with low levels of skill; earlyretirement has developed on a large scale, induced by measures designed to easeeconomic restructuring; immigrant populations are larger and haveunemployment rates much higher than for the indigenous population; couplerelationships are unstable and a growing proportion of the population are livingalone. For different combinations of these reasons, there is a realisation in manyEU and OECD countries that their welfare states and national systems of socialprotection must undergo a fundamental ‘recalibration’ if they are to meet thechallenge of new economic and social conditions.
Several of these challenges and pressures are already present in Ireland and likelyto grow in strength. Re-conceptualisation and reform of social protection andIreland’s welfare state cannot, therefore, be postponed indefinitely. Rather, Irelandneeds to participate actively in the search going on within the EU and throughoutthe industrialised world for the forms of social protection which better equippeople and their societies to meet the demographic, social and economicchallenges of the 21st century.
1.3 Improving Responses
This is not to imply that policy-making and institutions in Ireland have beenpassive in the face of existing social deficits and emerging social needs. On thecontrary, social spending has risen significantly in absolute terms and there hasbeen a significant amount of innovation and change in institutions and policies.Several holistic frameworks have been drawn up which seek to take a compre-hensive view of how social protection should be delivered to major sub-groups ofthe population1 while other national strategies address specific dimensions of thesuccessful society in an attempt to bring policies and programmes on stream thatwill provide the social protection a more employed, educated and diversepopulation requires. Individual government departments have undertaken orcommissioned reviews of specific policy areas and programmes in a bid to ensurethat what was developed for, and proved useful in, a previous Ireland is adjusted orsuperceded in whatever way is required by the new social and economiccircumstances that now characterise the country.
In all this, there is frequent acknowledgement that effectively addressing the ‘old’and ‘new’ social needs requires more ‘joined-up’ government and the moreeffective co-ordination of responses across government departments and publicagencies. The need is also frequently adverted to for new approaches togovernance that will integrate the expertise and diverse contributions of thepublic, private and voluntary sectors and effectively align actions horizontally
4
1. The National Anti-Poverty Strategy (1997), the National Children’s Strategy (2000), the National Disability Strategy (2004).
across government departments and vertically from the national to the local level.2
Social partnership and public sector modernisation are regarded as essential pre-requisites for successful change strategies and there is an openness to entertainwider roles for the voluntary and private sectors in the delivery of publicly fundedsocial protection.
However, a significant gap remains between what social actors see is necessaryand what is accomplished in practice. The implementation of formally agreedstrategies can be weak, leadership is frequently contested, the data that wouldpermit evaluation of the effectiveness of programmes is lacking, and social policyas a whole is not sufficiently aligned with the economic policies being pursued bythe state. There are signs of process fatigue, uneven progress and even contra-dictory developments in the formation and implementation of social policy.
The Council believes that major improvements in implementing nationalstrategies and following through on departmental policy reviews will be muchmore likely to occur if they can be situated within a shared understanding of whatshould now constitute the basic architecture of Ireland’s welfare state, and if it isrecognised that changes to it must be commensurate with the depth of changethat is taking place in the economy and society itself. The Council notes that thereare validly argued and sincerely held views on several specific questions concerningIreland’s social policies which are sharply divergent. For example:
s Whether the current level of public social spending is, or is not, below thestandards appropriate to a country at its level of economic development;
s Whether higher taxes to fund improved public services would damage theeconomy’s competitiveness by triggering compensating wage and priceincreases, or so improve the quality of life that people would accept lowerdisposable incomes in return;
s Whether reducing inequality in post-tax incomes, when the lowest incomes arenevertheless rising in real terms, is a legitimate objective for budgetary policyor creates an unnecessary risk of restraining entrepreneurship and businessdynamism;
s Whether managerial, organisational and other reforms in how services arecurrently provided could produce major improvements in service levels andservice quality within existing budgets, or whether increased budgets areessential to extending and improving services;
s Whether the number of people turning to privately provided social services(health, education, childcare) and with a negative perception of the quality ofpublicly provided services is now so large that no government in theforeseeable future can expect an electoral mandate to fund more and betterpublic services by raising taxes;
reasons for revisiting and reforming ireland’s welfare State 5
2. Responding in its own way to these needs and concerns, Sustaining Progress (2003) commits the social partners to developing newapproaches to providing social protection in seven key areas: i.e., access to housing and accommodation; the provision of an infra-structure of care; supporting people who are long-term unemployed, newly redundant or in low-skilled employment; tacklingeducational disadvantage; tackling alcohol and drug abuse; including everyone in the Information Society; and ending child poverty.It anticipates that ‘different combinations of new analyses, consultations, experimental policy initiatives, joint action by Governmentand the social partners, and deliberation based on experience’ will be brought to bear in finding satisfactory solutions (2003: 18).

s Whether the state’s responsibility for providing childcare is confined toensuring its provision to children at risk of social exclusion and the payment ofChild Benefit, or whether parents taking employment should receive publicsubsidies towards their expenditure on childcare;
s Whether the state should remain the key provider of essential social services orwhether more public money should be channelled (under new arrangementsfor accountability) to private and not-for-profit bodies;
s Whether increased income transfers are at the heart of alleviating poverty or can only produce better outcomes if they are linked to improved support services and clearer conditionality to reduce people’s duration onwelfare-only incomes;
s Whether income transfers to people of working-age should be indexed totrends in earnings or to changes in the cost of living;
s Whether socio-economic rights are self-evident and should be made justiciablein order to force the pace of necessary reform in institutions and policies, orwhether what they mean can only be clarified in interaction with institutionaland policy reform, the development of standards and practical demonstrationsof what is feasible;
s Whether priorities are currently appropriately balanced as between protectingliving standards in old age and living standards in childhood;
s Whether additional resources for the educational budget should go to thirdlevel education as a priority or to early childhood and primary education;
s Whether the instruments in use are the right ones to achieve the objectives set(e.g., Community Employment, Child Benefit).
Some difference of views on these issues is healthy and guarantees the on-goingevolution of policy. However, in stark terms, it can be argued that some people aresuffering unnecessarily because disagreement on specific social issues is beingallowed to block the overall scale and pace of reform needed in Ireland’s socialpolicies and welfare state. A shared understanding of the depth, reach andstrategic directions of the long-term reforms needed in current arrangements forproviding social protection — which is what this report provides — can contributeto ‘unblocking’ disagreements on single issues.
The perspectives advanced in this report are not intended as a top-down blueprint for welfare reform in Ireland. They do, however, express a significantconvergence of views on the Council on what the core social challenges in Irelandnow are and the lines along which Ireland’s welfare state needs reform3.The perspectives:
s Point to the institutional frameworks and operating procedures which thecomplexity of social issues today require in order to be effectively addressed;
s Build on what has been learned from innovations seen to be successful in thespecific cultural and historical contexts in which they operate;
6
3. Throughout this report the Secretary General of the Department of Finance did not consider it appropriate to comment on budgetary policy.
s Are not tied closely to any one ideological viewpoint or political programme butmake explicit values which are already widely subscribed to;
s Do not obviate the processes of consultation, partnership and participationwhich have developed to date but feed into them to make them more effectiveand satisfying for the participants.
The Council is committed to creating consensus on the strategic directions thatreform of Ireland’s welfare state should take but its experience has taught it thatthis will have to be anchored in a wider, shared vision for Ireland’s society andeconomy. For such a vision to be effective, it must be partly an understanding ofthe type of society that is aspired to and partly an understanding of the route thatwill connect the present with the desired future. The latter critically involves anappreciation of how economic and social developments interact, and of howeconomic and social policies have to align if the sought-for outcomes are to berealised. On the one hand, it is important that social policy and the parameters ofthe welfare state should not be wholly subordinated to the requirements ofimproving economic performance — a society is more than its economy, and thereare legitimate and important objectives for social policy that have nothing to dodirectly with fostering employability or productivity. On the other hand, it isimportant that the objectives and strategies for social protection should beinformed by a vision that does not take good economic performance for grantedbut assumes appropriate responsibility for complementing the policies thatensure it. Ireland is being called, by its economic success, to accelerate thedevelopment of its social supports, across their entire spectrum, but in a mannerthat is aligned with the characteristics of its economy.
This report seeks to provide a vision that meets both these concerns and an overview of how that might be done. Its intention is to provoke a re-conceptualisation of the objectives of social policy and of the role and basicarchitecture of Ireland’s welfare state that matches Ireland’s new economic andsocial realities, and which can serve as a route map for the social partners andacross the public sector. As the Council emphasised in its 2003 Strategy report,‘willingness to adopt the best arrangements is the central test of socialpartnership’ (NESC, 2003: 177).
reasons for revisiting and reforming ireland’s welfare State 7

Economic Performance and Social Protection
2
9
2.1 Introduction
Deciding where and how to improve the quality and cover of social protection inIreland over the coming years must be based on a thorough understanding of howeconomic and social policies interact in the conditions and circumstances facingsmall industrial nations in the 21st century. This does not mean restrictingdevelopments in social protection to what most evidently fits a social ‘investment’perspective. It means recognising that the boundaries between what have,traditionally, been thought of as separable economic and social policy domainshave become increasingly blurred.
Formerly, advances in social protection were largely thought of as a societaldividend which democratic political processes extracted after the event fromsuccessful economic performance. The most widely recognised direct economicfunction to social spending was its role as an automatic stabiliser over the courseof the business cycle. Increasingly, however, the factors that underpin economicand business success in Ireland in the medium- to long-term will depend directlyon human qualities — the hard and soft skills which people bring to the workforce,their learning capabilities and opportunities, the life-work balance they maintain,the autonomy and commitment they assume in their workplaces, the quality andchild-friendliness of their built environments. It is this wider set of conditionswhich will sustain and nurture the adaptability and flexibility of the Irishworkforce over the coming decades, keeping skilled workers in the country, andenabling labour productivity to rise by more than enough to compensate Irishbusiness for having to operate in what is already — by the standards of some oftheir competitors — a high cost environment.
For much of Ireland’s independence during the 20th century, people were itsgreatest asset, but in literary, religious and political discourse only. There was littleproof of this perspective in the economic and social realities of the time.On the contrary, many people of working age could find no satisfactory employ-ment and emigrated; many of the fortunate ones who found employment inIreland were underemployed or engaged in low-skilled, unsatisfying work; mostwomen were confined to domestic work in the home; many children, particularlythose in large families, were reared in poverty and many young people, particularlythose whose fathers were unskilled workers, received no education beyondprimary level; a large number of people with a physical, mental or social disabilitywere treated as liabilities to society.
This social history is invoked to throw Ireland’s new economic and social realitiesinto sharper relief. Today, such is the strength of demand for labour, manyemployers rely on immigrant workers; more employments require high levels ofknowledge and skill; women are as, or more, educated than men and there is astrong commitment to offering them employment on equal terms to men;nearly six out of ten young people enter third level education and the search is onto make education a lifelong activity beginning in early childhood and extendingthrough working life; there is a growing recognition that more Irish workplacesneed to reflect and enhance people’s creativity and responsibility; nationalstrategies have been developed to help afford all children the opportunity todevelop their full potential, to minimise disability as a social obstacle and to ensurethat social disadvantage does not become lasting social exclusion; a newlegislative and institutional framework has been developed to ensure universalregard in Irish life for the dignity of the human person and protection fromdiscrimination. Ireland, in short, is more entitled now than at any time since itsIndependence to claim that people are its greatest asset. Its economic and socialpolicies in the first decade of the 21st century are doing more to treat them as suchthan ever before.
10
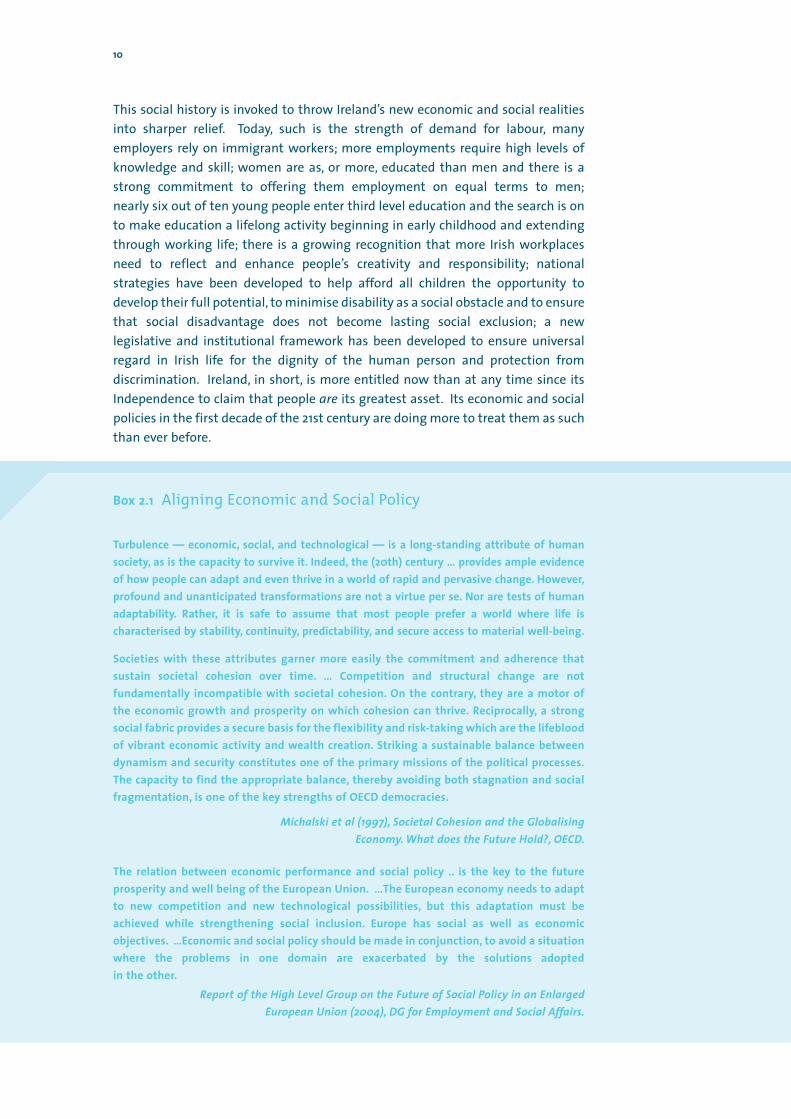
Box 2.1 Aligning Economic and Social Policy
Turbulence — economic, social, and technological — is a long-standing attribute of humansociety, as is the capacity to survive it. Indeed, the (20th) century … provides ample evidenceof how people can adapt and even thrive in a world of rapid and pervasive change. However,profound and unanticipated transformations are not a virtue per se. Nor are tests of humanadaptability. Rather, it is safe to assume that most people prefer a world where life ischaracterised by stability, continuity, predictability, and secure access to material well-being.
Societies with these attributes garner more easily the commitment and adherence thatsustain societal cohesion over time. … Competition and structural change are notfundamentally incompatible with societal cohesion. On the contrary, they are a motor ofthe economic growth and prosperity on which cohesion can thrive. Reciprocally, a strongsocial fabric provides a secure basis for the flexibility and risk-taking which are the lifebloodof vibrant economic activity and wealth creation. Striking a sustainable balance betweendynamism and security constitutes one of the primary missions of the political processes.The capacity to find the appropriate balance, thereby avoiding both stagnation and socialfragmentation, is one of the key strengths of OECD democracies.
Michalski et al (1997), Societal Cohesion and the GlobalisingEconomy. What does the Future Hold?, OECD.
The relation between economic performance and social policy .. is the key to the futureprosperity and well being of the European Union. …The European economy needs to adaptto new competition and new technological possibilities, but this adaptation must beachieved while strengthening social inclusion. Europe has social as well as economicobjectives. …Economic and social policy should be made in conjunction, to avoid a situationwhere the problems in one domain are exacerbated by the solutions adopted in the other.
Report of the High Level Group on the Future of Social Policy in an Enlarged European Union (2004), DG for Employment and Social Affairs.
However, recognising where economic and social advances have mutuallysupported each other does not mean there are areas where they have not.Trade-offs can and do exist between good economic performance and socialpolicies. Economic and technological turbulence can damage social cohesion and fracture society unless social policy responses are intelligently designed andwell resourced. Ill-designed social policies can undermine people’s cooperationwith economic change and contribute to undermining economic performance and,ultimately, the social protection that a country can provide its citizens in the long-run.
The following sections explore the evidence that good economic performance andimproved social protection are neither intrinsically opposed nor compelled to occurtogether in some automatic way. The conclusion is, rather, that they can be madeto support each other — where there is sufficient shared understanding andcommitment on the part of those who shape and implement a country’s economicand social policies respectively.
2.2 Improving the Synergy Between Social and Economic Policies
The question as to which comes first in the life of a society, economic or socialprogress, is largely a theoretical one. Social and economic history more usuallyshows they are deeply intertwined. At the micro level, the tensions and trade-offsbetween helping people in need, fostering their self-reliance and matching thecosts of social programmes to available resources are never wholly resolved byeven the most cleverly designed and efficiently administered programmes forsocial protection. On the contrary, some trade-offs between dynamism in theeconomic sphere and security in the social sphere nearly always exist and politicaljudgement is needed to identify when imbalances require correction, just as policyflexibility is needed to produce it. One of the operative premises of this study isthat policy reform in both the economic and social spheres should be guided by thegoal of making them mutually beneficial in the circumstances in which Irelandnow finds itself. This section offers perspectives from research that can guide thepursuit of this goal. The review is of selected research and not exhaustive. Itspurpose is to demonstrate the importance of re-conceptualising the boundariesbetween what are ‘economic’ and ‘social’ policies respectively in Ireland.
Research on the macro level
Chapter 4 will review evidence that a close and positive correlation exists betweenmeasures of wealth and levels of social spending within the EU 15.This is also notedby the OECD for industrialised countries generally (OECD, 2003: 25).
Economic Performance and Social Protection 11
This correlation says nothing about trends nor can it throw light on the issue ofcausality. For example, it is frequently argued that countries with relatively highstandards of social protection are being led by globalisation and increasedinternational competition to lower those standards and engage in a ‘race to thebottom’ in an effort to reduce social charges on enterprises and maintain thecompetitiveness of their economies. This perspective sees the welfare state ashaving to cede place to a ‘competition state’. The latter seeks to protect thecompetitiveness of enterprises located in its territory by reducing the legislativeand tax demands it makes on them, including by intervening minimally in thelabour market. In sharp contrast to this thesis, counter arguments are made thatthe welfare state is particularly complementary to globalisation for small, openeconomies such as Ireland’s. The welfare state, in this perspective, assumes therole of a ‘compensatory state’, balancing a commitment to the internationalisationof the economy with policies of domestic compensation that reduce risk and assistworkers and companies in becoming involved with on-going adaptation tostructural and workplace changes.
The core mechanism invoked by the competition state hypothesis is that growingcompetition for markets, inward investment and skilled workers between regionswith very different social standards makes taxation at the levels required to fundsocial protection in regions with high standards un-sustainable. This suggests thatthe level of tax receipts and/or social spending in regions with high standards comeunder pressure as economic ties grow with countries or regions where socialstandards are lower. However, the empirical evidence in support of this has beensurprisingly difficult to unearth, either for tax receipts or social spending.
For example, the competition state thesis suggests that the deepening andwidening of European economic integration would have put downward pressureon tax rates particularly in those countries where high taxation was funding highsocial spending. Baldwin and Krugman (2000) examined the trends in the tax ratewithin the EU in terms of a ‘rich core’ of advanced countries which they defined asGermany, Belgium, Luxembourg, France and Italy and a ‘poor periphery’ defined asGreece, Portugal, Spain and Ireland. They identified these two groupings ofcountries in the mid-1960s to see whether pressure from the lower tax countriesin the periphery in fact led to a ‘race to the bottom’. They found that, while taxrates in the rich core were initially much higher than in the periphery, the gapwidened further from the mid-1960s until the late 1970s and narrowed from thelate 1970s until the early 1990s. However, this narrowing of the gap came aboutnot due to declining tax rates in the core countries but to increases in theperiphery. Baldwin and Krugman refer to this as a ‘race to the top’ rather than a‘race to the bottom’.
12
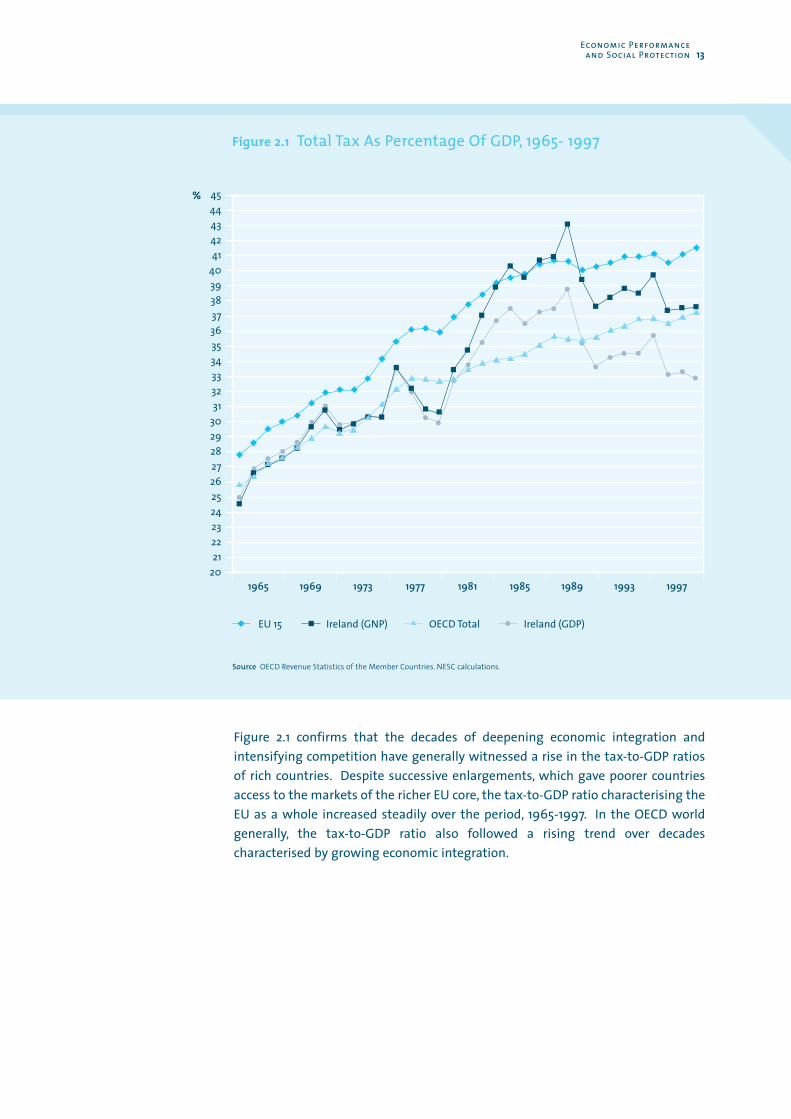
Figure 2.1 confirms that the decades of deepening economic integration andintensifying competition have generally witnessed a rise in the tax-to-GDP ratiosof rich countries. Despite successive enlargements, which gave poorer countriesaccess to the markets of the richer EU core, the tax-to-GDP ratio characterising theEU as a whole increased steadily over the period, 1965-1997. In the OECD worldgenerally, the tax-to-GDP ratio also followed a rising trend over decadescharacterised by growing economic integration.
Economic Performance and Social Protection 13
Figure 2.1 Total Tax As Percentage Of GDP, 1965- 1997
1965 1969 1973 1977 1981 1985 1989 1993 1997
EU 15
20
Ireland (GNP) OECD Total Ireland (GDP)
21222324252627282930313233343536373839404142434445%
Source OECD Revenue Statistics of the Member Countries. NESC calculations.
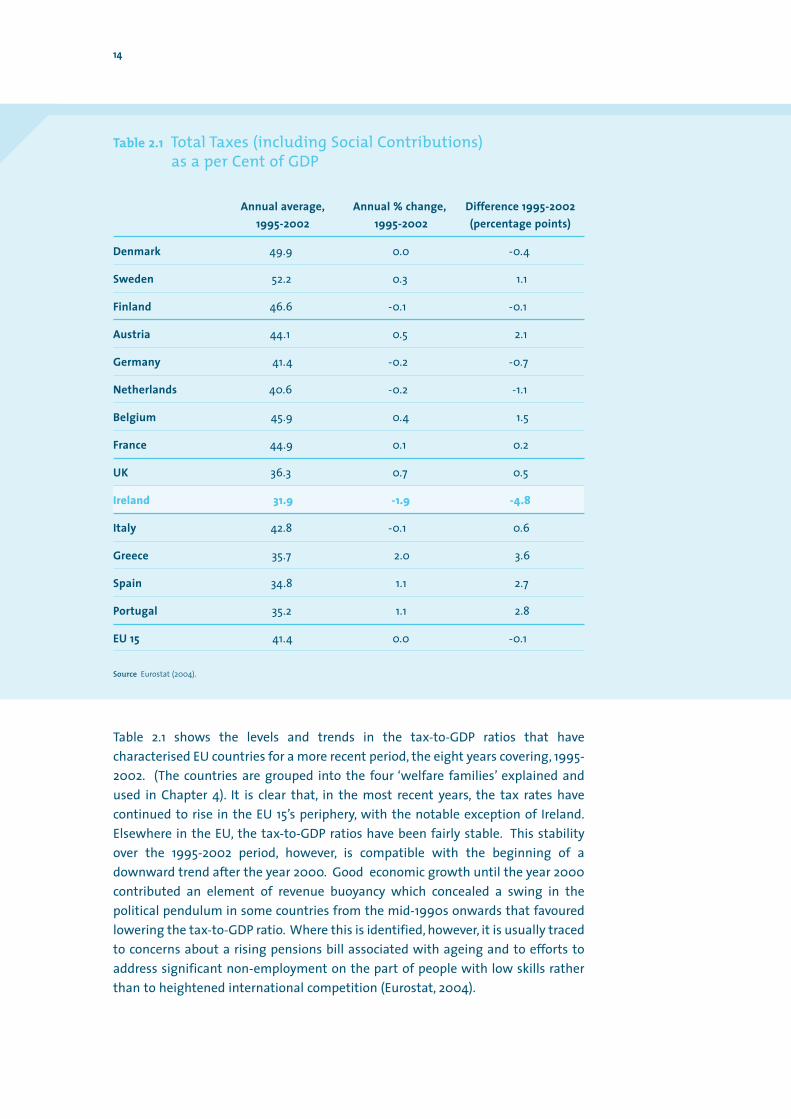
14
Table 2.1 shows the levels and trends in the tax-to-GDP ratios that havecharacterised EU countries for a more recent period, the eight years covering, 1995-2002. (The countries are grouped into the four ‘welfare families’ explained andused in Chapter 4). It is clear that, in the most recent years, the tax rates havecontinued to rise in the EU 15’s periphery, with the notable exception of Ireland.Elsewhere in the EU, the tax-to-GDP ratios have been fairly stable. This stabilityover the 1995-2002 period, however, is compatible with the beginning of adownward trend after the year 2000. Good economic growth until the year 2000contributed an element of revenue buoyancy which concealed a swing in thepolitical pendulum in some countries from the mid-1990s onwards that favouredlowering the tax-to-GDP ratio. Where this is identified, however, it is usually tracedto concerns about a rising pensions bill associated with ageing and to efforts toaddress significant non-employment on the part of people with low skills ratherthan to heightened international competition (Eurostat, 2004).
Table 2.1 Total Taxes (including Social Contributions) as a per Cent of GDP
Annual average, Annual % change, Difference 1995-2002 1995-2002 1995-2002 (percentage points)
Denmark 49.9 0.0 -0.4
Sweden 52.2 0.3 1.1
Finland 46.6 -0.1 -0.1
Austria 44.1 0.5 2.1
Germany 41.4 -0.2 -0.7
Netherlands 40.6 -0.2 -1.1
Belgium 45.9 0.4 1.5
France 44.9 0.1 0.2
UK 36.3 0.7 0.5
Ireland 31.9 -1.9 -4.8
Italy 42.8 -0.1 0.6
Greece 35.7 2.0 3.6
Spain 34.8 1.1 2.7
Portugal 35.2 1.1 2.8
EU 15 41.4 0.0 -0.1
Source Eurostat (2004).
The absence of evidence for any general downward trend in tax revenue acrossOECD countries until 2000 at least may be due to agglomeration economies.Baldwin and Krugman (2000) conclude that, while profit maximising firms —other things being equal — seek the lowest cost location, the level of taxation isonly one influence on their decision. Countries with generous welfare states andhigh taxation tend to be wealthy countries. They have a range of advantages formobile investors such as excellent infrastructure, established customer andsupplier bases, accumulated experience, well trained workforces and so on. Withinlimits, this allows rich countries to retain mobile factors of production despitehaving higher tax rates than poorer countries. In the latter, lower tax rates can helpattract mobile investment, which helps them to attain convergence with richercountries. As the poor countries become richer, the demand for public servicestends to increase so countries may be willing to accept higher tax levels. As notedabove, there is some evidence that this occurred in the EU. It should also be notedthat Ireland’s relatively recent status as a country generating a high level of GDPper capita does not mean it can yet count on these agglomeration economies.
A large literature explores the link between economic performance and levels ofsocial spending. Again, the competition state scenario of intensifying internationalcompetition leading to lower social spending finds little empirical support. DeGrauwe and Polan (2003), for example, find no evidence that social spending inOECD countries has declined with globalisation or that its level impacts negativelyon a country’s economic performance in the global economy. They look forevidence that successful economic performance came first and enabled highersocial spending as a subsequent political choice (the ‘grow first, spend later’ thesis),but their econometric work points to the causality running in the oppositedirection. Their preferred explanation is that higher social spending supports goodeconomic performance in OECD countries because it is associated with effectiveadministrations that use it in ways which reduce industrial conflict and increasethe willingness of populations to cooperate with change.
This perspective on social spending found strong support earlier in the work ofCameron (Cameron, 1978). Cameron studied a group of 18 OECD countries andshowed that the best single predictor of the increase in an OECD government’s taxrevenue (as a share of GDP) between 1960 and 1975 was the economy’s opennessin 1960 (exports plus imports divided by GDP). The correlation coefficient was 0.78.By way of explanation, Cameron argued that more open economies have higherrates of industrial concentration, which tend to foster higher unionisation, greaterscope for collective bargaining, and stronger labour confederations. These in turnresult in larger demands for government transfers — social security, pensions,unemployment insurance, job training, etc. — which mitigate external risk.
Subsequently, Rodrik (1998) studied a much larger group of countries whichincluded many developing ones. He believed Cameron’s explanation for his findingwould not be applicable to developing countries (which are dominant in the 100plus included in his study) where it was implausible to attach such importance tothe role of trade unions in most of them (see Kapstein and Milanovic, 2002, fordeveloping countries where it does apply). His own finding was that the empirical
Economic Performance and Social Protection 15
relationship between an economy’s openness and the level of governmentspending held primarily for government consumption in developing countrieswhile, in advanced countries, just as Cameron had found, it was primarily spendingon social security and other transfers that correlated with exposure to externalrisk. He, too, concluded that small countries, in particular, appear to benefit fromhigher social spending and ‘bigger government’. This is because, being small, theytend to have open economies that are vulnerable to fluctuations in the level andterms of international trade. “Societies seem to demand (and receive) anexpanded government role as the price for accepting larger doses of external risk.In other words, government spending appears to provide social insurance ineconomies subject to external shocks”, (Cameron, 1978).
Cameron and Rodrik, therefore, are in agreement that the evidence suggests publicspending is a risk-reducing instrument on which there is greater reliance in more open economies.
More open economies have greater exposure to the risks emanating fromturbulence in world markets. Larger government spending can be viewed insuch economies as performing an insulation function, insofar as thegovernment sector is the ‘safe’ sector (in terms of employment andpurchases from the rest of the economy) relative to other activities, andespecially compared to tradables. Hence, in countries significantly affectedby external shocks, the government can mitigate risk by taking command of a larger share of the economy’s resources. …. One might objectthat the government’s risk-reducing role would be best played through theestablishment of a safety net, in which case it would show up mainly ingovernment spending on social security and welfare, and not ingovernment consumption. This prediction is borne out in the case of themore advanced countries, which have the administrative capacity tomanage social welfare systems. In these countries, governmentconsumption is uncorrelated with exposure to external risk, while spendingon social security and welfare is strongly correlated. …In most developingcountries, however, income-transfer schemes tend to be rudimentary forreasons of administrative capacity. Consequently, their governments tendto rely on a broader set of instrumentalities – public employment, in-kindtransfers, and public-works programs – all of which show up in governmentconsumption-in order to broaden safety nets. (Rodrik, 1998).
Lindert (2004) examines the origins and course of public social spending in today’sindustrialised countries from the late 19th century onwards. He concludes: ‘ninedecades of historical experience fail to show that transferring a larger share of GDPfrom taxpayers to transfer recipients has a negative correlation with either thelevel or the rate of growth of GDP per person’ (2004: 18). He articulates two generalprinciples that serve as an explanation as to why the welfare state appears to havedone no net damage to growth in GDP per capita.
16
(i) Democracies with large public sectors show more care in designing taxes andtransfers so as to avoid compromising growth. For example, he finds evidence for‘a style of taxation that few have noticed when debating the effects of the welfarestate’ (31), viz., countries with large welfare states like Sweden tend to have a morepro-growth and regressive mix of taxes. Behaviour with a low elasticity bears thebrunt of taxation — labour’s earnings are taxed more than income from capital;consumption is taxed (e.g. VAT) more heavily than savings; and addiction goods(alcohol, tobacco, etc) are taxed heavily. These high-spending countries have alsofine-tuned the work incentives of their welfare and unemployment compensationprogrammes so as to limit welfare dependency, principally among young adults;several of their ‘transfers’ to the unemployed and poor are in effect purchases ofbehaviour and investments in job qualifications. This leads him to formulate ‘thebudget-stakes principle’ by which, the larger the budget, the greater the stakes indesigning social programmes in ways that minimise the unit costs of the extratransfers and taxes. High-budget welfare states, he believes, have done more toaddress the dangers of getting taxes and transfers wrong than have low-spendingcountries like the US - their administration costs are lower (there is a small relianceon means-testing) and their broad-based consumption and income taxes createlittle distortion.
(ii) In second place, Lindert argues that a broad universalism in taxes andentitlements fosters growth better than strict means testing and complicated taxprocedures. This is for three principal reasons. The wide tax bases to which taxesare applied (such as a general consumption tax) and the non-conditionality of thesocial protection provided mean nothing is gained by changing behaviour; taxavoidance is a starved industry as all alternatives are taxed at the same rate, basiclife choices (to take employment, parent alone, etc.) do not influence the level ofsocial support received, and marginal tax-cum-benefit-withdrawal rates are low.The administrative costs per euro collected and spent are low because proceduresare simple and there is little need for intrusive inspection or close monitoring.Finally, several of the universal services providing social protection also serve tomake people more employable and productive, e.g., public education, public health,childcare, maternity and parental leave.
Economic Performance and Social Protection 17
Research on the micro level
While there is no empirical support for the hypothesis that high social spending,in an increasingly competitive global economy, is inherently damaging toeconomic performance, there are many examples of how poorly designed socialprotection can damage employment and reduce individuals’ participation in thelabour market.
For example:
s Levying high social insurance on the wages of low skilled workers significantlyreduces the demand for them. It has been a characteristic reform strategy ofContinental European welfare states in particular to target reductions in socialinsurance on low skilled workers (Drèze and Malinvaud, 1994).
s If social protection is concentrated on people in existing jobs, new entrants tothe labour market shoulder disproportionate responsibility for ensuring someflexibility in the labour market, a dual labour market develops and considerabletalent remains underdeveloped or is lost to the economy (Saint-Paul, 1997).
s Reliance on disability benefits can become a form of disguised unemploymentand grow to absorb more resources than unemployment compensation if thepolicing of unemployment benefits is allowed to substitute for tackling thedeeper underlying issues of low skills and poor employment prospects.
s Sickness payments can become so attractive that taking time off for sicknessbecomes quasi built-in to employees’ expectations of a normal working year(Henrekson, 2004).
s Continuing with wholly unfunded pension arrangements whereby people atwork pay the pensions of those currently retired would be unfair to futureworkers whose numbers, relative to those in retirement, will be much smaller.
s While there is little evidence that people are attracted into long-term welfaredependency because of its availability, there is considerable evidence thatleaving it for employment can be made difficult by high marginal benefitwithdrawal rates.
While there are multiple examples from the international literature of what not todo, much more can be learned from the literature which points to how socialprotection can be designed so as to support people’s engagement with economicrestructuring. For example, a theoretical (Sinn, 1995, 1996) and empirical literature(Bird, 2001; Blanchflower, 2000) has explored the hypothesis that people protectedby benefits may embrace more change and take more risks they would otherwisedo, with outcomes that are positive for the functioning of the labour market andeconomic performance. Some examples are:
s a generous level of unemployment benefit for an interval of time enablespeople to hold out for a better job match than they would do if means-testedassistance immediately beckoned;
18
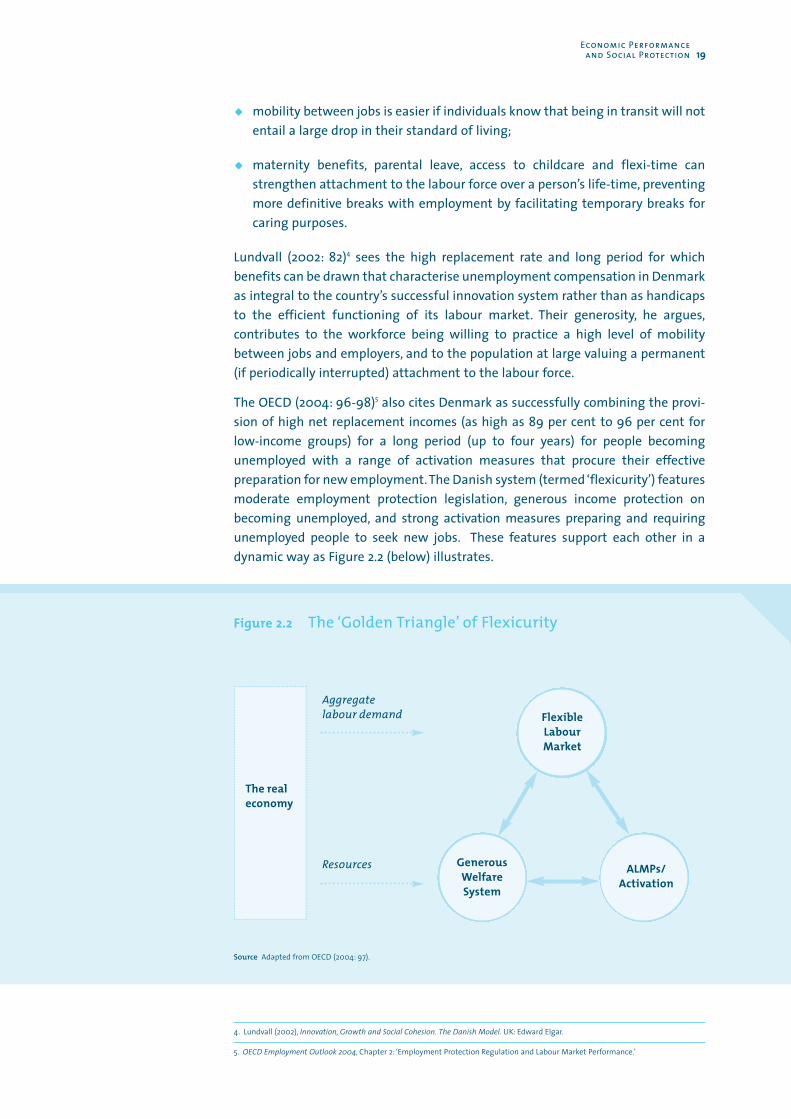
Economic Performance and Social Protection 19
s mobility between jobs is easier if individuals know that being in transit will notentail a large drop in their standard of living;
s maternity benefits, parental leave, access to childcare and flexi-time canstrengthen attachment to the labour force over a person’s life-time, preventingmore definitive breaks with employment by facilitating temporary breaks forcaring purposes.
Lundvall (2002: 82)4 sees the high replacement rate and long period for whichbenefits can be drawn that characterise unemployment compensation in Denmarkas integral to the country’s successful innovation system rather than as handicapsto the efficient functioning of its labour market. Their generosity, he argues,contributes to the workforce being willing to practice a high level of mobilitybetween jobs and employers, and to the population at large valuing a permanent(if periodically interrupted) attachment to the labour force.
The OECD (2004: 96-98)5 also cites Denmark as successfully combining the provi-sion of high net replacement incomes (as high as 89 per cent to 96 per cent forlow-income groups) for a long period (up to four years) for people becomingunemployed with a range of activation measures that procure their effectivepreparation for new employment.The Danish system (termed ‘flexicurity’) featuresmoderate employment protection legislation, generous income protection onbecoming unemployed, and strong activation measures preparing and requiringunemployed people to seek new jobs. These features support each other in adynamic way as Figure 2.2 (below) illustrates.
4. Lundvall (2002), Innovation, Growth and Social Cohesion. The Danish Model. UK: Edward Elgar.
5. OECD Employment Outlook 2004, Chapter 2: ‘Employment Protection Regulation and Labour Market Performance.’
Figure 2.2 The ‘Golden Triangle’ of Flexicurity
Source Adapted from OECD (2004: 97).
The realeconomy
FlexibleLabourMarket
ALMPs/Activation
GenerousWelfareSystem
Aggregate labour demand
Resources
From the perspective of the individual employee, the security provided is notagainst the loss of their existing job but against struggling to manage on a lowincome if unemployed and being without a new job for long. The OECD notesevidence that Danish employees have a strong feeling of security despite the highlevel of job mobility and low average job tenure in their economy. This policy of‘flexicurity’ does not come cheap. No country spends as high a proportion of itsGDP on unemployment compensation and labour market programmes asDenmark, but the country has consistently maintained the highest employmentrate in the EU 15. It is noteworthy in this regard that Denmark also has one of thehighest rates of adult participation in further education and learning in the OECD.
Goodin et al (1999)6 exploited the opportunity provided by the availability of longitudinal data sets (covering 10 years) in the US, West Germany and theNetherlands to track movements in the level and composition of people’s incomesover time. A major interest was whether receipt of state transfer payments wasassociated with a greater or lesser likelihood of an individual improving her or hisincome from market sources over time (the theory of welfare dependency wouldsuggest it should lessen it). They found clear evidence that the state whichintervened most promptly and vigorously to alter the distribution of marketincome was also the state in which those on low incomes were most likely toimprove their market earnings over time, viz., the Netherlands.
Table 2.2 presents an example of their findings. Column 3 suggests that some 18 percent of those poor in a given year in the USA on the basis of their market incomealone earned their way out of poverty over the next five years and 31 per cent overten years; this was in a country where taxes and transfers made virtually no impacton the proportion below the poverty line (column 4). By contrast, some 42 per centof those below the poverty line on the basis of their market income in a given yearhad earned their way above it within five years in the Netherlands and some 53 percent did so over ten years; the context in this case is of a Dutch welfare state whichredresses income poverty promptly and sees a dramatic drop in the likelihood ofthe same individual being below the poverty line the longer the time period thatis considered.
20
6. Goodin, R.E., B. Headey, R. Muffels & Henk-Jan Dirven (1999), The Real Worlds of Welfare Capitalism. Cambridge University Press.
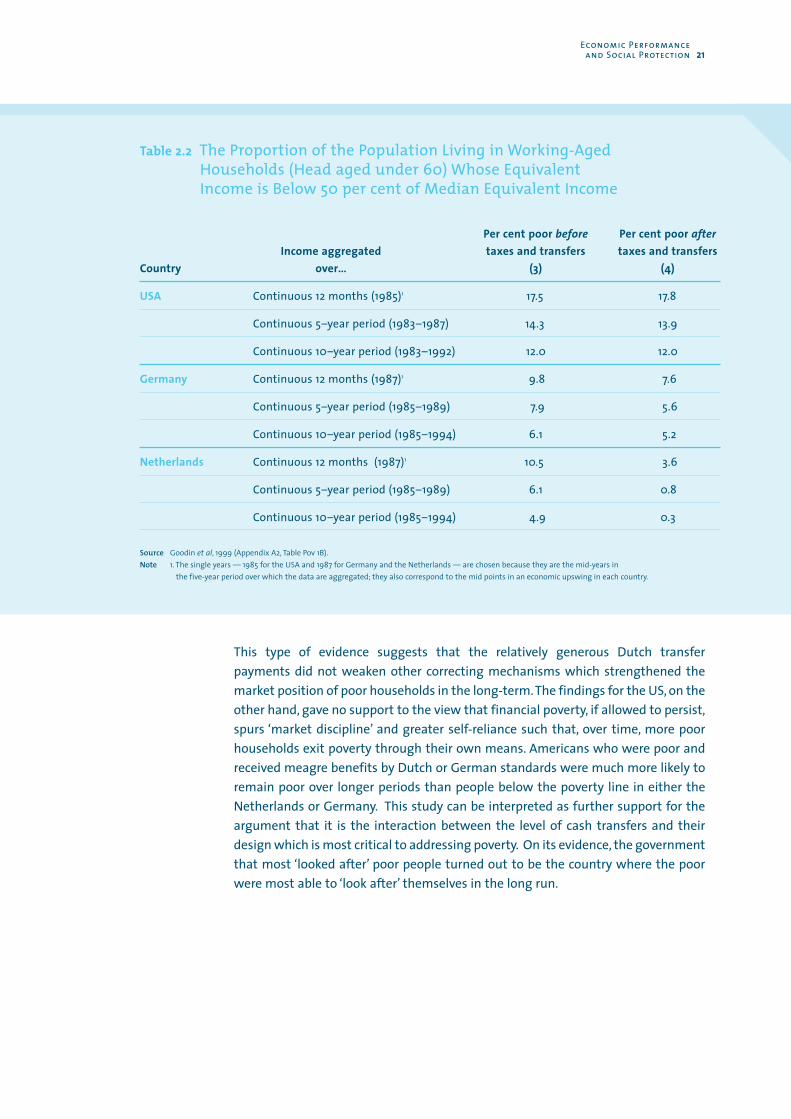
This type of evidence suggests that the relatively generous Dutch transferpayments did not weaken other correcting mechanisms which strengthened themarket position of poor households in the long-term.The findings for the US, on theother hand, gave no support to the view that financial poverty, if allowed to persist,spurs ‘market discipline’ and greater self-reliance such that, over time, more poorhouseholds exit poverty through their own means. Americans who were poor andreceived meagre benefits by Dutch or German standards were much more likely toremain poor over longer periods than people below the poverty line in either theNetherlands or Germany. This study can be interpreted as further support for theargument that it is the interaction between the level of cash transfers and theirdesign which is most critical to addressing poverty. On its evidence, the governmentthat most ‘looked after’ poor people turned out to be the country where the poorwere most able to ‘look after’ themselves in the long run.
Economic Performance and Social Protection 21
Table 2.2 The Proportion of the Population Living in Working-Aged Households (Head aged under 60) Whose EquivalentIncome is Below 50 per cent of Median Equivalent Income
Per cent poor before Per cent poor afterIncome aggregated taxes and transfers taxes and transfers
Country over… (3) (4)
USA Continuous 12 months (1985)1 17.5 17.8
Continuous 5–year period (1983–1987) 14.3 13.9
Continuous 10–year period (1983–1992) 12.0 12.0
Germany Continuous 12 months (1987)1 9.8 7.6
Continuous 5–year period (1985–1989) 7.9 5.6
Continuous 10–year period (1985–1994) 6.1 5.2
Netherlands Continuous 12 months (1987)1 10.5 3.6
Continuous 5–year period (1985–1989) 6.1 0.8
Continuous 10–year period (1985–1994) 4.9 0.3
Source Goodin et al, 1999 (Appendix A2, Table Pov 1B).Note 1. The single years — 1985 for the USA and 1987 for Germany and the Netherlands — are chosen because they are the mid-years in
the five-year period over which the data are aggregated; they also correspond to the mid points in an economic upswing in each country.

22
Learning from human resource policies in parts of the private sector
It is evidently more complex to understand and seek to influence policies for socialprotection in a national economy than to develop human resource policies for abusiness enterprise, even a very large one. Nevertheless, some of the reasons whyprivate sector enterprises, obliged by definition to pursue profit, nevertheless,invest in different forms of social protection are revealing because the employersare responding directly to motivational issues. Their reasons include that:7
s prompt access to high quality health care reduces time off work on the part ofkey employees;
s access to childcare and eldercare enables employees to maintain lessinterrupted work records, increasing their productivity in the long-term;
s access to counselling (e.g., for addiction, marital difficulties) may preventlengthy work absences or long periods of reduced productivity;
s access to study leave and FET opportunities can increase an employee’scapabilities to contribute to the company;
s investing in programmes making health and safety a priority and sharedconcern can lead to a more efficient and effective management of risk (e.g., inchemical companies, construction, etc.);
s employees can be motivated by good Corporate Social Responsibility activitiesand a higher calibre of recruit is also attracted;
s corporate image is one of a company’s most important assets and becomingincreasingly difficult to develop without a strategy for social investments;
s a company that is good to its employees will be one whom employees in turnsupport when difficult decisions and trade-offs are imposed by outsidecircumstances on management.
Experience and direct feed-back on costs and benefits lead individual enterprisesto decide on the level and nature of their spending on social or welfareprogrammes for their employees. No comparable transparency attaches to thebenefits to the national labour force that arise from better coverage and higherstandards in public health care, public education, social housing, public transport,social benefits and programmes for social inclusion. The clearest evidenceattaches to specific forms of public health and educational spending but the widercontribution of other forms of public social spending to societal cohesiongenerally, though unquantifiable, should not be dismissed.
Looking at a number of different examples of healthy egalitarian societies, animportant characteristic that they all seem to share is their social cohesion.They have a strong community life. Instead of social life stopping outside thefront door, public space remains a social space. The individualism and thevalues of the market are restrained by a social morality. People are more likelyto be involved in social and voluntary activities outside the home. These
7. See, for example, Report of the Round Table on ‘Improving knowledge about CSR and facilitating the exchange of experience and goodpractice’, April 2004, European Multi-Stakeholder Forum on CSR.
societies have more of what has been called ‘social capital’ which lubricates theworkings of the whole society and economy. There are fewer signs of anti-social aggressiveness, and society appears more caring. In short, the socialfabric is in better condition. (Wilkinson, 1996).
Higher social spending as inevitable
It is instructive to summarise the reasons why higher social spending and goodeconomic performance can be expected to go hand in hand and why rising levelsof public social spending, far from being a threat to economic growth, canvariously confirm and support it.
s A significant part of social spending in many countries is insurance-based andincome related. The more people previously earned, the higher are the cashtransfers paid to them in retirement, during illness, while unemployed, etc.
s With higher employment rates comes a switch from unpaid caring, largelycarried on within families, to the purchase of caring services from the marketand/or their provision by public bodies (childcare, eldercare, etc.).
s With higher levels of educational attainment and higher incomes generallycomes an increased demand for more and better social protection. Many formsof health care, in particular, have this status of being a luxury good.
s With higher employment and incomes, the opportunity costs to society of childpoverty, educational disadvantage, juvenile crime, teen parenthood, addiction,social exclusion, etc., are greater and the return to social spending which helpsavoid them is greater also.
s With higher regard for individual autonomy and rights comes an expectationof, and demand for, a wider range of supports at higher standards to beprovided members of society who face particular obstacles in achieving socialand economic participation (people with disabilities, those being dischargedfrom institutional care, members of ethnic minorities, etc.).
s With greater openness to international trade and exposure to risks exogenousto the national economy comes a stronger demand and rationale for govern-ment, particularly in small countries with relatively homogeneous societies, toprotect groups dislocated by economic restructuring. Where this ‘compensa-tion’ takes certain forms of social spending rather than subsidies to inefficientindustries or other protectionist measures which retard economic performancein the long run, it can ‘buy’ greater industrial peace, faster economicrestructuring and a higher economic growth rate than would otherwise occur.‘Corporate welfare’ also takes new forms such as supports for networking, linksbetween research and innovation, and the acquisition of new marketing andtechnical skills.
s With the growing importance of knowledge and innovation if enterprises inadvanced industrial countries are to remain competitive in internationalmarkets, greater attention is being paid to a wider range of working conditions(family friendliness, supplements to pensions, access to FET, health care, etc.) inorder to recruit and retain knowledge workers, and to the design of
Economic Performance and Social Protection 23
unemployment supports which maintain worker flexibility and productivityover the long term.
Ireland is currently a low social spender by international standards but this is destined to change for some if not all of the reasons listed above. Thecontemporary context of Ireland’s ambitions to develop a dynamic, knowledge-based economy should give new impetus to the search for appropriately designedand well-resourced social policies that are integral to this economic strategy.
2.3 Building a Social Model on High Levels of Employment
The most evident way in which successful economic performance improves socialprotection is through providing available and satisfying employmentopportunities. This has been an undeniable aspect of Ireland’s social progresssince the mid-1990s. However, higher employment rates and improved socialprotection do not automatically accompany each other. As employment ratesmove upwards, more of the people holding employment will have educational andskill attainments that are low by the standards of the full workforce and bevulnerable to lower earnings and poorer working conditions as a consequence.For this reason, one of the key distinguishing features of welfare state ‘families’is their respective treatment of low skilled employment.
The Scandinavian welfare model sets a high floor to wages for low skilled workersand compensates for the low demand for them on the part of the private sector byemploying large numbers (principally women) in local government to supply socialservices (e.g., childcare). The Continental European welfare state levies significantsocial insurance on all workers including the low skilled and responds to the highnon-employment among them by providing significant passive income transfers(as lightly monitored disability or unemployment benefits or as early retirementbenefits). The Anglo-Saxon model lets wages for the low skilled fall to levels thatprice them into private sector employment and provides wage subsidies in oneform or another to address the worst forms of poverty among them (the EarnedIncome Tax Credit in the US, the Working Family Tax Credit in the UK).
While it is clear that Ireland has not followed the Scandinavian model, it is lessevident that it can be fairly described as having taken the Anglo-Saxon orContinental European routes. On the one hand, low skilled employments in theprivate sector have come on stream, and in-work poverty has grown in significancedespite the existence of an in-work subsidy (FIS) and the institution of a minimum national wage (2000). On the other hand, social welfare paymentshave improved significantly in real terms, and there is evidence that earningsinequality makes only a very minor contribution to the proportion of thepopulation being recorded as at-risk-of-poverty (Callan et al, 2004). In fact, whileprivate services have come on-stream at the bottom end of the labour ladder, thehighest poverty risks in Ireland still attach to being non-employed rather than inemployment at a low wage, and significant non-employment continues tocharacterise groups in the population while employers have increasingly sourcedlow skilled workers overseas.
24
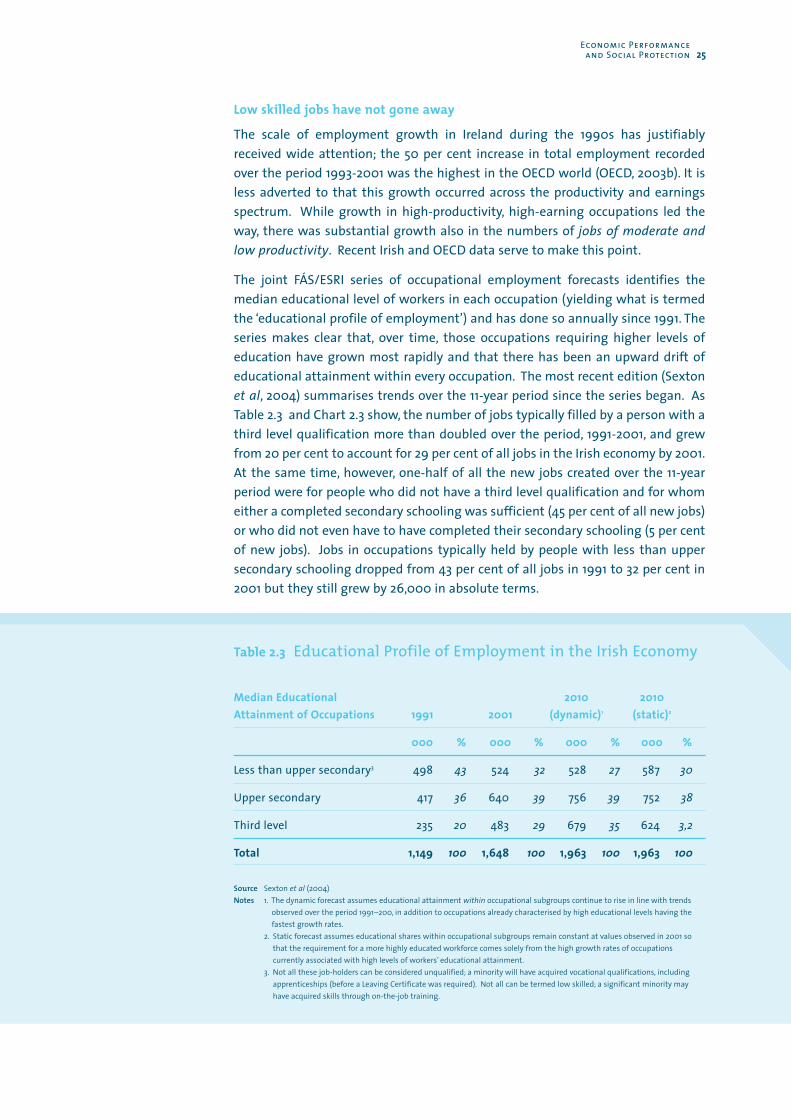
Low skilled jobs have not gone away
The scale of employment growth in Ireland during the 1990s has justifiablyreceived wide attention; the 50 per cent increase in total employment recordedover the period 1993-2001 was the highest in the OECD world (OECD, 2003b). It isless adverted to that this growth occurred across the productivity and earningsspectrum. While growth in high-productivity, high-earning occupations led theway, there was substantial growth also in the numbers of jobs of moderate andlow productivity. Recent Irish and OECD data serve to make this point.
The joint FÁS/ESRI series of occupational employment forecasts identifies themedian educational level of workers in each occupation (yielding what is termedthe ‘educational profile of employment’) and has done so annually since 1991. Theseries makes clear that, over time, those occupations requiring higher levels ofeducation have grown most rapidly and that there has been an upward drift ofeducational attainment within every occupation. The most recent edition (Sextonet al, 2004) summarises trends over the 11-year period since the series began. AsTable 2.3 and Chart 2.3 show, the number of jobs typically filled by a person with athird level qualification more than doubled over the period, 1991-2001, and grewfrom 20 per cent to account for 29 per cent of all jobs in the Irish economy by 2001.At the same time, however, one-half of all the new jobs created over the 11-yearperiod were for people who did not have a third level qualification and for whomeither a completed secondary schooling was sufficient (45 per cent of all new jobs)or who did not even have to have completed their secondary schooling (5 per centof new jobs). Jobs in occupations typically held by people with less than uppersecondary schooling dropped from 43 per cent of all jobs in 1991 to 32 per cent in2001 but they still grew by 26,000 in absolute terms.
Economic Performance and Social Protection 25
Table 2.3 Educational Profile of Employment in the Irish Economy
Median Educational 2010 2010 Attainment of Occupations 1991 2001 (dynamic)1 (static)2
000 % 000 % 000 % 000 %
Less than upper secondary3 498 43 524 32 528 27 587 30
Upper secondary 417 36 640 39 756 39 752 38
Third level 235 20 483 29 679 35 624 3,2
Total 1,149 100 1,648 100 1,963 100 1,963 100
Source Sexton et al (2004)Notes 1. The dynamic forecast assumes educational attainment within occupational subgroups continue to rise in line with trends
observed over the period 1991–200, in addition to occupations already characterised by high educational levels having the fastest growth rates.
2. Static forecast assumes educational shares within occupational subgroups remain constant at values observed in 2001 so that the requirement for a more highly educated workforce comes solely from the high growth rates of occupationscurrently associated with high levels of workers’ educational attainment.
3. Not all these job-holders can be considered unqualified; a minority will have acquired vocational qualifications, includingapprenticeships (before a Leaving Certificate was required). Not all can be termed low skilled; a significant minority may have acquired skills through on-the-job training.
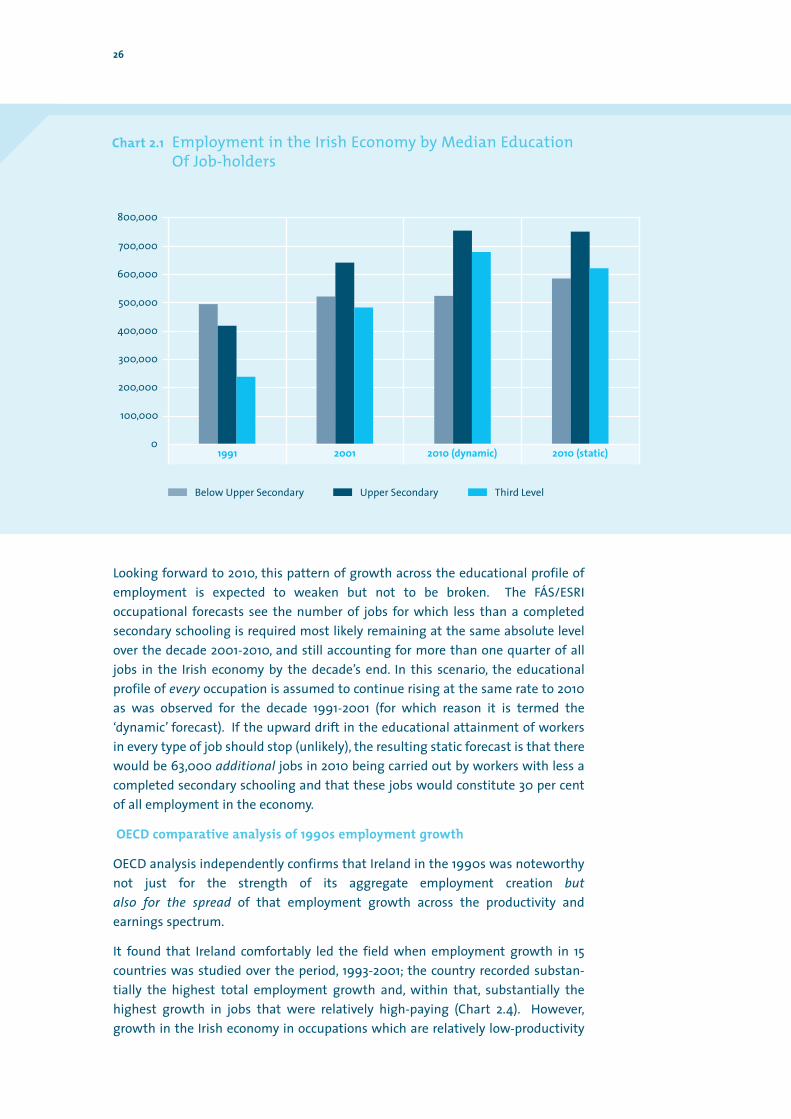
26
Looking forward to 2010, this pattern of growth across the educational profile ofemployment is expected to weaken but not to be broken. The FÁS/ESRIoccupational forecasts see the number of jobs for which less than a completedsecondary schooling is required most likely remaining at the same absolute levelover the decade 2001-2010, and still accounting for more than one quarter of alljobs in the Irish economy by the decade’s end. In this scenario, the educationalprofile of every occupation is assumed to continue rising at the same rate to 2010as was observed for the decade 1991-2001 (for which reason it is termed the‘dynamic’ forecast). If the upward drift in the educational attainment of workersin every type of job should stop (unlikely), the resulting static forecast is that therewould be 63,000 additional jobs in 2010 being carried out by workers with less acompleted secondary schooling and that these jobs would constitute 30 per centof all employment in the economy.
OECD comparative analysis of 1990s employment growth
OECD analysis independently confirms that Ireland in the 1990s was noteworthynot just for the strength of its aggregate employment creation butalso for the spread of that employment growth across the productivity andearnings spectrum.
It found that Ireland comfortably led the field when employment growth in 15countries was studied over the period, 1993-2001; the country recorded substan-tially the highest total employment growth and, within that, substantially thehighest growth in jobs that were relatively high-paying (Chart 2.4). However,growth in the Irish economy in occupations which are relatively low-productivity
Chart 2.1 Employment in the Irish Economy by Median Education Of Job-holders
700,000
600,000
500,000
400,000
300,000
200,000
100,000
01991
Below Upper Secondary
2001 2010 (dynamic) 2010 (static)
Upper Secondary Third Level
800,000
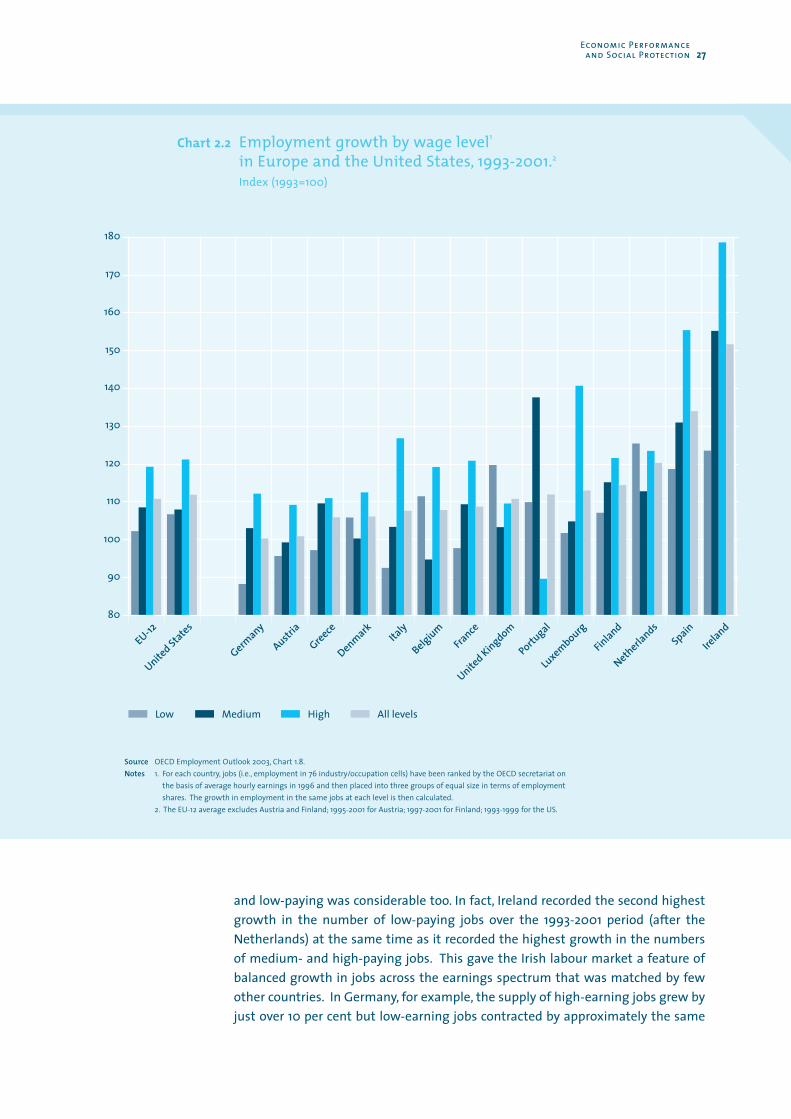
and low-paying was considerable too. In fact, Ireland recorded the second highestgrowth in the number of low-paying jobs over the 1993-2001 period (after theNetherlands) at the same time as it recorded the highest growth in the numbersof medium- and high-paying jobs. This gave the Irish labour market a feature ofbalanced growth in jobs across the earnings spectrum that was matched by fewother countries. In Germany, for example, the supply of high-earning jobs grew byjust over 10 per cent but low-earning jobs contracted by approximately the same
Economic Performance and Social Protection 27
Chart 2.2 Employment growth by wage level1
in Europe and the United States, 1993-2001.2
Index (1993=100)
Low Medium High All levels
80
90
100
110
120
130
140
150
EU-12
160
170
180
United States
Germany
Austria
Greece
DenmarkIta
ly
BelgiumFra
nce
United Kingdom
Portugal
Luxembourg
Finland
Netherlands
Spain
Ireland
Source OECD Employment Outlook 2003, Chart 1.8.Notes 1. For each country, jobs (i.e., employment in 76 industry/occupation cells) have been ranked by the OECD secretariat on
the basis of average hourly earnings in 1996 and then placed into three groups of equal size in terms of employmentshares. The growth in employment in the same jobs at each level is then calculated.
2. The EU-12 average excludes Austria and Finland; 1995-2001 for Austria; 1997-2001 for Finland; 1993-1999 for the US.
amount; in the UK, the number of low-earning jobs expanded by some 20 per cent,almost double the rate of expansion of high-earning ones.
The contribution and role of jobs of lesser productivity in raising employmentrates, providing a wide range of moderately priced services, widening the tax base,reducing welfare dependency and strengthening social cohesion is, frequently, notadverted to either in accounts of Ireland’s economic resurgence or of its ambitionsto become a dynamic, knowledge-based economy. Looking back, most of thereduction in unemployment, particularly long-term unemployment, can beattributed to the growth in relatively low productivity employments rather than inhigh-paying ones, and to the policy changes (lower taxes, retention of secondarybenefits, higher entry level wages, etc.) that increased the attractiveness of holdingsuch jobs. The switch from unemployment and welfare dependency toemployment, in turn, contributed significantly to reducing the level of consistentpoverty and the severity of social exclusion.
Looking forward, it may seem that acknowledging — let alone welcoming — an on-going role for relatively low-productivity, low-earning jobs in the economyweakens or contradicts the core strategy of moving enterprises, workers and theeconomy generally further up the value-added chain through higher investmentsin R&D and raising the skills and competences of the workforce. Yet the positionsare not contradictory. High-productivity enterprises and workers benefit from thecontributions of lower productivity workers in multiple ways. In fact, dynamicregional and national economies frequently resort to immigration to meetshortages of low skilled workers, a route which Ireland has already demonstratedsome capacity for taking (FÁS, 2004). This is not to deny that challenges of a neworder are posed to restraining inequality and fostering social cohesion, particularlyduring economic downswings when the low productivity workers are particularlyexposed to unemployment.
The drive to achieve a more knowledge-based and innovative economy throughhigher levels of investment in R&D and a more skilled workforce can be considereda precondition for successful economic performance and prosperity, but it is farfrom a sufficient condition for attaining the high employment rates such as thoseto which Ireland is committed in the Lisbon process. Attaining a total employmentrate of 70 per cent or more by 2010 does not hinge on increasing the numbersstudying at third level or taking science or maths at secondary and third level. Itdoes not hinge, in fact, on anything directly affecting the careers and labourmarket choices of high-productivity workers or those in a position proximately tobecome such. Rather, it hinges primarily on the labour market choices of suchgroups as people with caring responsibilities, people with less than uppersecondary education, older workers generally and people with disabilities.
The Lisbon process goes part of the way in acknowledging this by havingsubordinate targets of a 60 per cent employment rate for women and 50 per centfor older workers. The significance of the experience of relatively weaker groups toattaining high employment rates is confirmed by Table 2.4. It presents theemployment rates for subgroups in the populations of the four countries with thehighest, and the four with the lowest, total employment rates in the EU 15 in 2002. (Ireland is included separately for informational purposes).
28
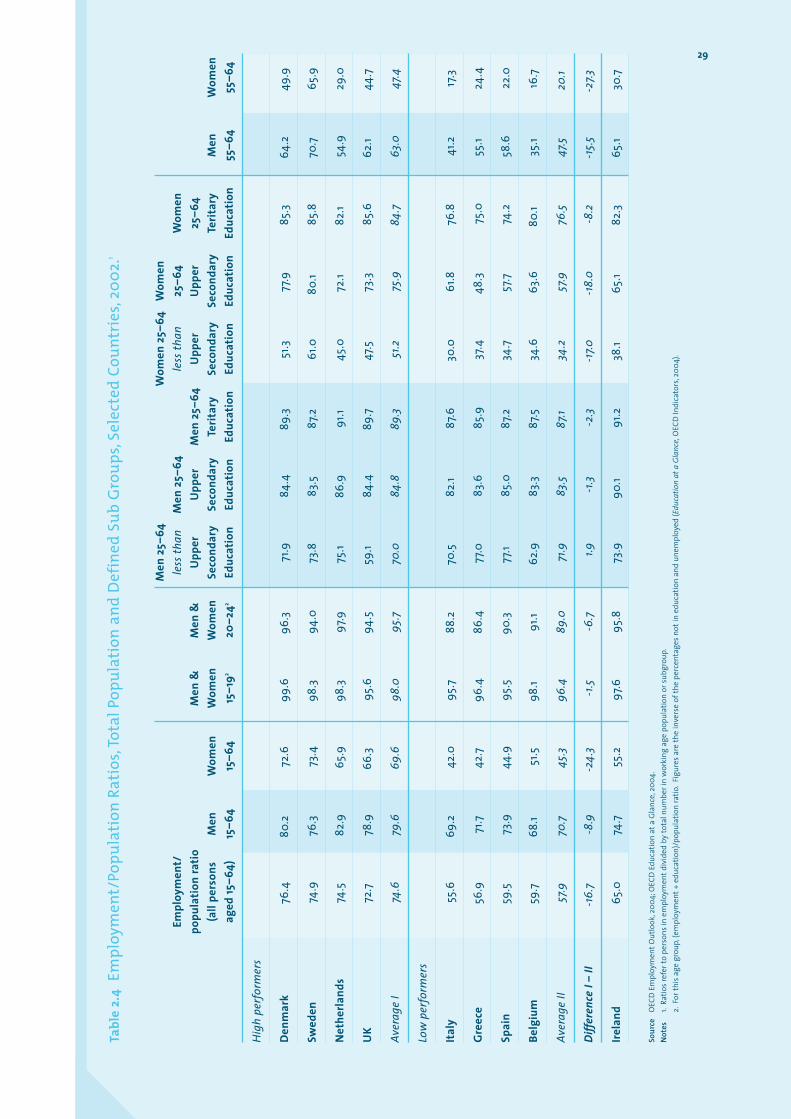
Tabl
e 2.
4Em
ploy
men
t/Po
pula
tion
Rat
ios,
Tota
l Pop
ulat
ion
and
Def
ined
Sub
Gro
ups,
Sele
cted
Cou
ntri
es,2
002.
1
Men
25–
64W
omen
25–
64W
omen
Em
ploy
men
t/le
ss th
anM
en 2
5–64
less
than
25–6
4W
omen
popu
latio
n ra
tio
Men
&
Men
&U
pper
U
pper
Men
25–
64U
pper
Upp
er25
–64
(all
pers
ons
Men
Wom
enW
omen
Wom
enSe
cond
ary
Seco
ndar
yTe
ritar
ySe
cond
ary
Seco
ndar
yTe
ritar
yM
enW
omen
aged
15–6
4)15
–64
15–6
415
–192
20–2
42Ed
ucat
ion
Educ
atio
nEd
ucat
ion
Educ
atio
nEd
ucat
ion
Educ
atio
n55
–64
55–6
4
Hig
h pe
rfor
mer
s
Den
mar
k76
.480
.272
.699
.696
.371
.984
.489
.351
.377
.985
.364
.249
.9
Swed
en74
.976
.373
.498
.394
.073
.883
.587
.261
.080
.185
.870
.765
.9
Net
herla
nds
74.5
82.9
65.9
98.3
97.9
75.1
86.9
91.1
45.0
72.1
82.1
54.9
29.0
UK
72.7
78.9
66.3
95.6
94.5
59.1
84.4
89.7
47.5
73.3
85.6
62.1
44.7
Aver
age
I74
.679
.669
.698
.095
.770
.084
.889
.351
.275
.984
.763
.047
.4
Low
per
form
ers
Italy
55.6
69.2
42.0
95.7
88.2
70.5
82.1
87.6
30.0
61.8
76.8
41.2
17.3
Gre
ece
56.9
71.7
42.7
96.4
86.4
77.0
83.6
85.9
37.4
48.3
75.0
55.1
24.4
Spai
n59
.573
.944
.995
.590
.377
.185
.087
.234
.757
.774
.258
.622
.0
Belg
ium
59.7
68.1
51.5
98.1
91.1
62.9
83.3
87.5
34.6
63.6
80.1
35.1
16.7
Aver
age
II57
.970
.745
.396
.489
.071
.983
.587
.134
.257
.976
.547
.520
.1
Diffe
renc
e I –
II-1
6.7
-8.9
-24.
3-1
.5-6
.71.9
-1.3
-2.3
-17.0
-18.
0-8
.2-1
5.5
-27.3
Irela
nd
65.0
74.7
55.2
97.6
95.8
73.9
90.1
91.2
38.1
65.1
82.3
65.1
30.7
Sour
ceO
ECD
Em
ploy
men
tOut
look
,200
4;O
ECD
Edu
catio
n at
a G
lanc
e,20
04.
Not
es1.
Ratio
s ref
er to
per
sons
in e
mpl
oym
entd
ivid
ed b
y to
tal n
umbe
r in
wor
king
age
pop
ulat
ion
or su
bgro
up.
2.Fo
r thi
s age
gro
up,(
empl
oym
ent+
edu
catio
n)/p
opul
atio
n ra
tio.F
igur
es a
re th
e in
vers
e of
the
perc
enta
ges n
otin
edu
catio
n an
d un
empl
oyed
( Edu
catio
n at
a Gl
ance
, OEC
D In
dica
tors
,200
4).
29
In 2002, Denmark, Sweden, the Netherlands and the UK had the highest employ-ment rates in the EU 15 and each comfortably surpassed the 70 per cent Lisbontarget; Italy, Greece, Spain and Belgium did least well and had employment ratesbelow 60 per cent. On average, there was a gap of some 17 percentage pointsseparating the employment rates attained by the top four and those attained by thebottom four. What contributes to this gap becomes clearer when employment ratesby gender, level of educational attainment and age are considered separately. Whatseparates the countries with high employment rates from those with lowemployment rates is, principally, that women are much more likely to be inemployment; for women in general the gap is 24 percentage points, for women withless than an upper secondary education it is 17 percentage points while for olderwomen the gap is the widest of all, at 27 percentage points. The position of mendiffers much less between the two sets of countries, except for older men wheremore than 15 percentage points separates the employment rates on average.Otherwise, men fare similarly and are even marginally more likely to be inemployment when low skilled in the poorly performing countries than in the betterperforming ones. Young adults (aged 20-24) also are more likely to be in eitheremployment or education in the top four performing countries than in the bottomperforming four, with a margin of almost seven percentage points in their favour.
This evidence, therefore, suggests that the groups whose transition into or outof employment makes the difference to employment rates reaching 70 per cent orhigher are not prime aged, well educated males but older people, women, andpersons with low levels of formal education. Each of these latter groups can beconsidered, in turn, to exhibit significant heterogeneity with specific constraintspotentially facing — for example — lone parents, people with disabilities,members of ethnic minorities, etc. These tend to be people for whom access toworthwhile employment of any sort can be significantly constrained by theabsence of support services and/or the high withdrawal rates of welfare supportthey otherwise receive only in recognition of a status outside the labour force.These are the areas where Irish policy may need to concentrate if further signifi-cant progress in raising the employment rate is to be recorded. Table 2.4 indicatesthat employment rates in Ireland for men, no matter their level of educationalattainment or age, and for women with a third level education, comparefavourably with the best in Europe but that women in general are accessingemployment considerably less, especially when they have lower levels ofeducational attainment and/or are older.
During Ireland’s impressive employment expansion, women’s employment rates,in broad terms, remained low for those who did not complete secondary schoolwhile they were high at the outset for those with a third level education. The risein the female employment rate was on the part of those who completed secondaryschool, a group which also grew steadily as a proportion of the female population(NESC, 2003: 382-387). Looking forward, there is still potential for higheremployment rates among women with a Leaving Certificate or equivalent but it isparticularly strong among women with low levels of education. However, more ofthese women are being constrained by the lack or high cost of childcare facilities(mothers of young children, lone parents, women with modest earning power). Forexample, a second earner in a couple family with two young children using
30
childcare, with earnings at two-thirds of average salary, has no net return fromwork after childcare costs (OECD, 2003c). Not surprisingly, employment ratesamong women drop particularly sharply in Ireland compared to other countriesafter the birth of a first and second child.8
Other groups in the population also face specific constraints to accessingemployment that is otherwise within their capability. These include older, lowskilled males who have been made redundant, persons with disabilities, earlyschool leavers, those needing treatment for an addiction, people discharged frominstitutional care (including ex-prisoners) and the members of disadvantagedminorities (the Traveller community, those granted refugee status, etc.).
In summary, the maintenance and modest expansion of employments requiringmoderate to low levels of skills has been an integral feature of Ireland’s recenteconomic resurgence. Where people on long-term social welfare were able toaccess these jobs, they have contributed significantly to reducing poverty andsocial exclusion. Changes in tax and social welfare, in PRSI and employmentlegislation have helped to protect the profitability of offering these jobs and theattractiveness of holding them.
However, a significant number of the low skilled who remain jobless are findingthat a lack of services and still unreformed aspects of the tax and welfare codesmake it difficult for them to access available employment or the vocational andeducational programmes that would enhance their prospects of doing so. Inseveral respects, Ireland’s welfare code is not particularly ‘employment friendly’(see 3.4.4 below). This contributes to a situation in which employment rates haveremained low for members of households reliant on social welfare, even thoughsignificant low skilled immigration has been needed to fill large proportions of thevacancies occurring in hotels and catering, factory production, childcare and otherareas (FÁS, 2003).9 It is likely that many of the immigrants willing to do low skilledwork in the Irish economy do not face the same constraints as Ireland’s low skilledjobless — for example, more of them are single, without the family roles or fixedresidence that makes people strongly prefer local labour markets and regularworking hours, most are not on social welfare and unaffected by high benefitwithdrawal rates, etc. Some have additional incentives such as the motivation tolearn English, the purchasing power of the remitted euro in their home country,the push factor of the bleak alternatives they faced before emigrating, etc.
The juxtaposition of significant demand for immigrant workers to performrelatively low skilled jobs alongside high non-employment rates among groups inthe Irish population has the potential to weaken the link between economic andsocial development in the coming years. Low skilled immigration lessens the needto identify and enhance the workforce skills of social welfare recipients of workingage; it contributes to moderating wage increases at the lower end of the labourladder to the benefit of consumers but reducing the incentive to leave social
8. DES (2004)
9. The major concern to protect the level of placements available on an on-going basis in the Community Employment Scheme is, inpart, a recognition that many barriers still effectively block people with weak labour market skills from accessing the mainstreamlabour market.
Economic Performance and Social Protection 31

welfare; it adds to housing demand and congestion; it is vulnerable tounemployment and more likely than skilled migration to add to demand for socialand health services. Appreciating that there is an on-going role in the Irisheconomy for workers with relatively weak levels of educational attainment, towhich a growing inflow of migrants has been responding but which a growingproportion of the working-age population in receipt of social welfare face specificobstacles in doing so, suggests that a more pro-active approach is now needed to integrating social welfare, access to services, and training and education pro-grammes so that worthwhile employment is a genuine option for all people withlow skills. It is likely that this integration will require simultaneous and balancedprogress in raising social welfare rates, ensuring that positive expectations ofrecipients are reflected in their administration, and improving the services thatsupport them in work.
2.4 Conclusions
People who believe Ireland’s economic development model has sacrificedcompassion, social standards and solidarity need to be convinced that thesuccessful pursuit of current economic objectives has inherent social implicationsthat will directly serve social justice and a more egalitarian society. For example:
a) Pushing the employment rate higher implies focussing attention on hithertorelatively neglected groups in the working-age population, the obstacles theyface and the supports they need;
b) Raising skill levels, other things being equal, will enhance more people’sstandard of living, work satisfaction and degree of control over their workinglives;
c) Concentrating on lifelong learning implies giving increased attention to peopleat work and not assuming public support for learning ends once youth is over;
d) Seeking flexibility in the workplace requires a deeper appreciation of theworker as an agent of change rather than a reluctant subject compelled bysuccessfully designed supervision and reward systems to behave in a mannerthat management can predict;
e) Higher real incomes, wider markets and greater competition will further extendconsumer choice and continue the process by which goods and serviceshitherto associated with elites (e.g., overseas holidays in the 1960s) becomeaccessible to wide groups in the population;
f) Emphasising entrepreneurship means cultivating problem-solving skills,individuality and respect for responsible risk-taking, particularly where theiropposites — rote learning, conformity and fear of failure — are mostentrenched.
32
In short, it is important to see social policy as not simply an exercise in redistribu-ting a surplus which is there to be creamed off after successful economicperformance, but as assuming its appropriate share of responsibility for theeconomic policies that enable the widest possible number in the population toearn their livelihoods in the marketplace in a decent and humane way. Significantsocial progress is inherent in the successful unfolding of the Ireland’s current coreeconomic development strategies. Taking a historical perspective, there may be aneed to acknowledge that Ireland has still to abandon vestiges of using stateconsumption as an instrument of social policy (best exemplified in the decadeswhen subsidies were paid to protected industries) and shift more deliberately toproviding social protection through protecting workers rather than jobs.
On the other hand, people who think that higher public social spending will onlycompound an already significant erosion of the economy’s cost competitivenessneed to be convinced that there are direct and positive economic consequencesfrom improving social protection in several areas. For example:
a) Eliminating childhood poverty will enable children to benefit more fromschooling, increase their employability and productivity when they reachworking-age and reduce spending on means-tested social benefits on theirbehalf when they are adults;
b) Stemming educational disadvantage, among young people and the adultpopulation, will increase people’s employability and productivity andstrengthen their attachment to the world of work;
c) Tackling social exclusion effectively adds new groups to the demand foreducation and increases their mobility within the world of work (for example,ensuring that the low-skilled migrants of today do not become the welfare-dependants of tomorrow);
d) Services which support people in their caring responsibilities for familymembers (childcare, eldercare, etc.) help them maintain an attachment to theworkforce and avoid long absences from it during which their skills deteriorate;
e) Reforms in pension arrangements could remove the obligation and incentivesfor some people to retire even when they are able to and willing to continueworking, improve the public return on tax expenditures, and ease the pressureon occupational pension schemes;
f) High standards in public health care and educational systems increase workerproductivity and reduce workplace absences on the part of those who haveonly public services on which to rely.
It is important to accept that the organisation of the economy is not a value-free orpre-social zone, and that successful economic performance is not prior to, orindependent of, social progress. Rather, in how people earn their livelihoods, thequality of a society is already largely determined. Several of the major improvementsin social protection now required to address peoples’ needs more effectively will alsoprove to be economic assets and contribute directly to ‘reinventing the economy’.
Economic Performance and Social Protection 33

Social Protection in Ireland:A Hybrid System
3
3.1 Introduction
Expressed at its simplest, social protection is about the cover against adverse livingcircumstances that members of a society are willing to extend to each other andwhich they expect of each other. It is provided largely but not exclusively by theState; it takes the form of income transfers and services,and is about prevention aswell as cure.
The hybrid nature of Ireland’s arrangements for providing social protection is onereason why it is difficult to identify a particularly Irish pattern in how its popula-tion is being, respectively, incentivised and supported to take part in the country’sincreasingly internationalised economy. By contrast, authors have been able to seeclearer patterns in how, for example, Denmark and the Netherlands havecombined adaptability to a changing economic environment with solidaristicwelfare systems (Madsen, 2002, 1999; Visser and Hemerijck, 2001, 1997). ‘Hybrid’usually refers to Ireland’s mix of means-tested, insurance-based and universalistincome support and service arrangements. However, it can also be taken to applyto the constellation of actors necessarily and currently involved in providingservices that are key to social protection, from self-employed family doctorsthrough not-for-profit church organisations to salaried public employees. Irelandis a good example of how ‘historical contingency, internal heterogeneity andinnovative hybridisation’ (Zeitlin and Trubeck, 2003: 14) have produced a ‘mongrel’welfare system of mixed parentage. This may, in fact, be proving more robustin adapting to globalisation and shifts in values than purebred ‘pedigreespecimens’ of welfare states with more accentuated regime characteristics(Crouch, 2001). On the one hand, it should be acknowledged that describing it asa ‘system’ risks implying the ensemble has more internal logic than is the case. Onthe other hand, it is possible that the resilience and capacity to adjust which it hasdemonstrated might not have been forthcoming if it were a welfare state withmore defined characteristics.
35
3.2 The ‘Welfare Society’ and the Welfare State
Most social protection in advanced industrial societies is organised through theState. However, the nature and manner of State interventions have always to beviewed in the context of how other, non-State pillars of social protection areperforming and developing, viz., the family, not-for-profit associations in civilsociety, and the market. Seeking to chart a course for the welfare State, therefore,is also, in part, an exercise in trying to understand what is happening to the family, to civil society and the extent to which the market is being led byregulation, incentives and voluntary codes to deliver social protection. While theprimary focus of this paper remains the State and public policy, these need to beplaced within the broader context of changes in Ireland’s ‘welfare society’.
3.2.1 The family
When large numbers of women remained in the home, the family was arguablythe single most important pillar of Ireland’s national system of social protection.In a large number of instances, the care of young children, older people and otherhousehold members with special needs hinged around the full-time presence of afit and capable household member, usually a woman. Relatively residual roleswere played by the State and organisations in civil society, and an even lesser oneby commercial bodies. The rise in women’s employment rates from the 1970sonwards began to weaken this pillar of caring and, during the 1990s, the ratesjumped further1 to open a significant deficit between the diminished capacity offamilies to provide care and the development of new caring capacity on the part ofthe state, not-for-profit bodies and commercial interests. Changes in the locationand cost of housing have also placed new constraints on the caring capacity of thefamily; the option to live within easy travel time of elderly parents has diminished,while urbanisation has reduced the number of households in a position to build a‘granny flat’ or adjacent bungalow for the older generation. A steady rise in loneparent households has increased the instances where, if household income is to beearned, support for children has to be forthcoming to the family from anotherpillar.2 By the year 2000, one third of all births in Ireland were to single mothers(ESRI, 2004).3
Demographic changes have also added to pressures on the caring role of thefamily. Parents and people with severe disabilities are living longer, while smallerfamily sizes mean people have fewer siblings with whom to share arrangementsfor ensuring their aged relatives living alone or in care receive family attention.The number of households in which a person aged 70 or over is living alone isincreasing steadily, a growing proportion of whom also need support to assisttheir independent living.4
36
1. In the eight years prior to 1994, women’s participation rate (ILO basis) in Ireland rose by four percentage points; in the eight yearsafter 1994, it rose by ten percentage points.
2. In the 2002 Census, 10.2 per cent of all private households were composed of a lone parent and children and no other adult, up from8.8 per cent in the 1991 Census.
3. It was 15.5 per cent in 1991.
4. Private households composed of one person aged 70 or over living alone increased by 26 per cent between 1991 and 2002; one thirdof all people aged over 70 were living on their own in 2002 (up from 29 per cent in 1991).
In a separate development, the proportions of Irish households formed of coupleswithout children and of people under 65 living on their own are rising sharply.These two categories of household grew the fastest during the 1990s; theircombined share of all private households rose by 6 percentage points between1991 and 2002 to reach 29 per cent.5 This has been a contributing factor to thestrong demand for housing in recent years. It may also reflect, at least in part, thehigher value being placed on the individual and on independent living. While theindividualisation of Irish life is occurring within and across households of everytype, the growing incidence of small households is a particular reminder of theneed to ensure that concepts of ‘family’, ‘household’ and ‘community’ adjust in linewith the emerging realities of Irish society. For example, new types of socialinteraction in addition to those traditionally generated across households by theirchildren may need to be facilitated in neighbourhoods.
The number of births has risen in recent years reflecting the growing proportion ofwomen of child-bearing age in the population, but women are still having fewerchildren on average than is needed to maintain the population in the absence ofimmigration. The total fertility rate in Ireland remains the highest in the EU but fellrapidly to below the replacement level during the 1990s and a gap has openedbetween the preferred and actual family size in Ireland as in other countries.6
Women are increasingly postponing the birth of their first child and the mean ageof mothers at childbirth in Ireland is one of the highest in the EU; it passed 30 forthe first time in 1999. The factors influencing couples to postpone childbirth ornever to become parents are complex. It is clear that the provision of socialprotection in Ireland going forward will have to forestall a situation arising wherethe accumulation of difficulties in accessing housing, balancing the care of youngchildren with employment, ensuring the security of children in their neighbour-hoods and their welcome in public places, etc., would lead to the type of demo-graphic crisis currently confronting the systems of social protection in other EUMember States.
3.2.2 Civil society
Since the beginning of the State in 1921, public authorities in Ireland have been ableto build public social services around the multiple contributions of private-non-profit organisations. Church bodies and movements were particularly prominent ineducation, health and social caring. Into the 21st century, many key institutionscontinue to deliver social protection which are not owned by the State but receivesubstantial public funding while having significant degrees of autonomy. Ireland’swelfare state is not unusual in relying extensively on the involvement of non-profitorganisations. For example, in the Netherlands and Belgium, many people receivepublicly subsidised education, health care and social services through privateinstitutions organised as three ideological ‘pillars’ (liberal, social democratic,Christian); in the US, a cultural mistrust of central government is reflected in strongpopular support for channelling public funds through private institutions ratherthan state providers. However, it is noteworthy that without having had the fierce
Social Protection in Ireland:A Hybrid System 37
5. 16 per cent of all private households were childless couples in 2002 (up from 12 per cent in 1991), while 13 per cent were singlepersons under 65 (up from 11 per cent).
6. The ‘total fertility rate’ is the number of children a woman can be expected to bear if the current age-specific fertility rates of womenwere to apply to her throughout her childbearing years (ages 15-49). ‘Birth rates’ are expressed as simple ratios of the number ofbirths in a given year to each 1000 in the population.
ideological conflicts that characterised some European countries when thefoundations of their welfare states were laid or as distinctive a mistrust of centralgovernment as characterises American culture, the role of private non-profit bodiesin Ireland’s welfare state is major by international standards.7
These bodies mobilise resources additional to what the State provides (prominentexamples include the public voluntary hospitals, many secondary schools, mostprimary schools and multiple agencies providing services to vulnerable groups).8
Significant parts of the budgets of major government departments providingsocial protection (Health and Children, Education and Science) are channelledthrough these private-non-profit institutions. In the past, their major involvementcontributed to a higher level of education, health and other social outcomes thatState resources alone would have procured. Change, however, has been emphatichere too.
A rapid decline in church personnel has reduced their presence in the operations oftheir own institutions, in some cases hastening their transformation into newtypes of foundations or trusts, in others occasioning retrenchment or closure. Thehigher levels of expertise and professional accreditation needed to providepractically every type of social protection have contributed to the emergence of amuch greater role for the professional and the specialist in influencing howservices are designed and delivered. A more educated and less deferential societyis demanding greater transparency, accountability and impartiality on the part ofall service-providers receiving public monies, including church bodies. Higheremployment rates and more consumer-oriented lifestyles are reducing the timefor volunteering in Irish society (partly offset by a higher general level of educa-tional attainment, as more educated groups appear to have a higher propensity toengage in community involvement and volunteering). The cumulative impact ofthese changes is that this pillar of social protection has also been undergoing amajor reconstitution; new types of associations have emerged (non-governmentalorganisations (NGOs) and local and community organisations), all non-profitinstitutions rely more on paid specialists than volunteers, and some church bodies have refocused their work to address more directly the needs ofdisadvantaged social groups.
3.2.3 The market
Significant commercial providers of health services, medical insurance, childcare,eldercare, schooling and other forms of social protection now exist in Ireland.Employers also provide significant levels of social protection, particularly in theform of occupational pensions and by supporting the health, work/life balance andskill levels of their employees as well. For example, 20 per cent of the value of allhealth insurance premiums is estimated to be paid by employers as employeebenefits (Department of Health and Children, 1999). Employers can alsolegitimately claim that the higher standards under which enterprises now operatethroughout the Single Market (on health and safety, working time and work/life
38
7. Their share of total employment in 1999 was the second highest (after the Netherlands and ahead of Belgium and the US) of 22countries studied (Salamon et al, 1999).
8. As an example, Ireland has 63 per cent of its upper secondary students enrolled in privately managed institutions (2001) and, of these,10 per cent are in institutions receiving more than 50 per cent of their funding from private sources. Along with Flanders (northernBelgium), Ireland was an outlier in this respect among 13 European countries studied (OECD, 2004: 162).
balance, equality legislation, etc.) have further increased the significance ofoccupational welfare in people’s lives. Changes in the level and composition ofprivate social expenditure (what households and employers spend), therefore, arean integral part of how a national system of social protection develops over time,though frequently a difficult one to document. As incomes rise, and in so far aspeople believe the choice and standards they want are not forthcoming frompublicly provided services, the commercial market for social protection can beexpected to get bigger. Traditionally, Ireland had a number of large employers whohad well-earned reputations for providing extensive welfare arrangements to theirexisting and retired employees (Guinness, some banks, etc). The surge in theprivate sector with the economic boom of the 1990s has made the expression ofsocial responsibility by enterprise, and the legal and financial mechanisms forencouraging it, of greater potential importance going forward. Several companieshave embraced — as part of a strategy for corporate social responsibility — a pro-active engagement with instances of social need, in partnership with local andcommunity interests, seeing the advantages of tailored and innovative actions notjust for disadvantaged communities and social groups but for their corporateimages, and the morale and productivity of their workforces. On the other hand,more companies are limiting their liabilities in pensions, in response to advancinglongevity and uncertain returns on their pension funds, by offering definedcontribution rather than defined benefit schemes to new employees and ceasingto offer final salary schemes.
3.3 A Broad View of Social Protection
While the State is not the sole actor in providing social protection, it is the principalone and has important functions in regulating, supporting and complementingwhat the other pillars are doing. It alone can guarantee standards and coverage insocial protection for the entire population and is expected to display resolutionand flexibility in levying the necessary resources and seeing that they are used tomaximum effect. In focussing on the role of the State, however, it is important toadopt a broad conception of what constitutes social interventions on its part. Thisis for three principal reasons.
The heart of social protection as provided by the State is frequently considered to be what it does by way of income transfers to ensure people have adequatemoney incomes (social security). However, access to services — in health, housing,social inclusion and other areas — is also integral to enjoying social protection and,in some instances, more important than having a higher money income. It isnoteworthy, in this context, that spending on programmes tackling educationaldisadvantage, is typically not included in conventional definitions of socialprotection (such as those adopted by Eurostat and the OECD9). Yet, a growingnumber of social problems in advanced industrial countries require significanteducational interventions if they are to be satisfactorily addressed, and the qualityof mainstream educational provision is critical to minimising social risks in later
Social Protection in Ireland:A Hybrid System 39
9. See Chapter 4, footnote 6.
life.10 Types of educational spending, therefore, have to be candidates in decidingthe priority uses of further public funds for social protection on behalf of severalgroups, e.g., children, young people, the members of ethnic minority groups, loneparents. It could even be argued that all public spending on education up to thecompulsory school leaving age11 should be included in social spending. Anintermediate position is adopted in this section between doing that and ignoringeducational spending altogether; educational spending with the clear objective ofcombating social disadvantage or fostering equity (procuring inclusion) isincluded.
Social protection includes a lot of what is done for people who are not poor inorder to prevent them falling into poverty, though it is most exemplified inprogrammes exclusive to people currently in poverty.12 In the former, programmesare preventative and geared to keeping the number of people who become victimsof adverse circumstances as low as possible (for example, child immunisationprogrammes, childcare). In the latter case, the State undertakes to remedy deficitsthat have arisen and are undermining the quality of people’s lives (for example,income poverty, educational disadvantage, etc.). Social spending on preventativeprogrammes from which the non-poor benefit frequently takes the form of taxexpenditures (it is easy to ‘give’ money to the non-poor by reducing their taxliabilities). Tax expenditures, therefore, are included in this review. A finalobservation on what lies within the parameters of social protection is that it cantake the form of capital spending which is creating or modernising theinfrastructures (social housing, day-care centres for people with intellectual orphysical disabilities, etc.) that will bring on stream a higher level and/or improvedstandard of services in the future.
Following on these observations, the full spectrum of interventions currentlyundertaken by the State for social purposes in Ireland is captured, as in a snapshot,by Table 3.1 for the year 2002. The focus is on public current spending only; a laterTable (3.8) summarises the principal forms of capital spending. The Table classifiespublic current spending on social protection as follows:
1. Cash transfers, distinguishing those that are means-tested, insurance basedand universal;
2. Services, distinguishing health, education, housing, active labour marketpolicies, and a miscellaneous set grouped under social inclusion; and
3. Tax Expenditures with a social purpose (a full list is provided in Appendix Table B).13
40
10. The OECD describes basic education, which it sees as continuing to completion of the senior cycle of secondary, as ‘the last stage in abasic schooling system whose key objective is to ensure that young people leave education with at least the minimum qualificationsrequired for employability and for further education and training’ (OECD, 2004: 8).
11. 16 in 2005. It is 18 is some EU member states.
12. The Council of Europe has opted to develop a strategy for social cohesion rather than a strategy for social inclusion. It argues thatsocieties have ‘not only to find ways of dealing with the problems of those who find themselves excluded from society but, also,more ambitiously, to see how to build more cohesive societies in which the risks of social exclusion will be minimised.’ It describessocial cohesion as ‘the capacity of a society to ensure the welfare of all its members, minimising disparities and avoidingpolarisation’. (Council of Europe, 2004, 2000)
13. While the tax treatment of low earnings is considered by this paper to be an important part of Ireland’s system of social protectionand discussed in the text, no attempt is made to cost it for inclusion in the Table.
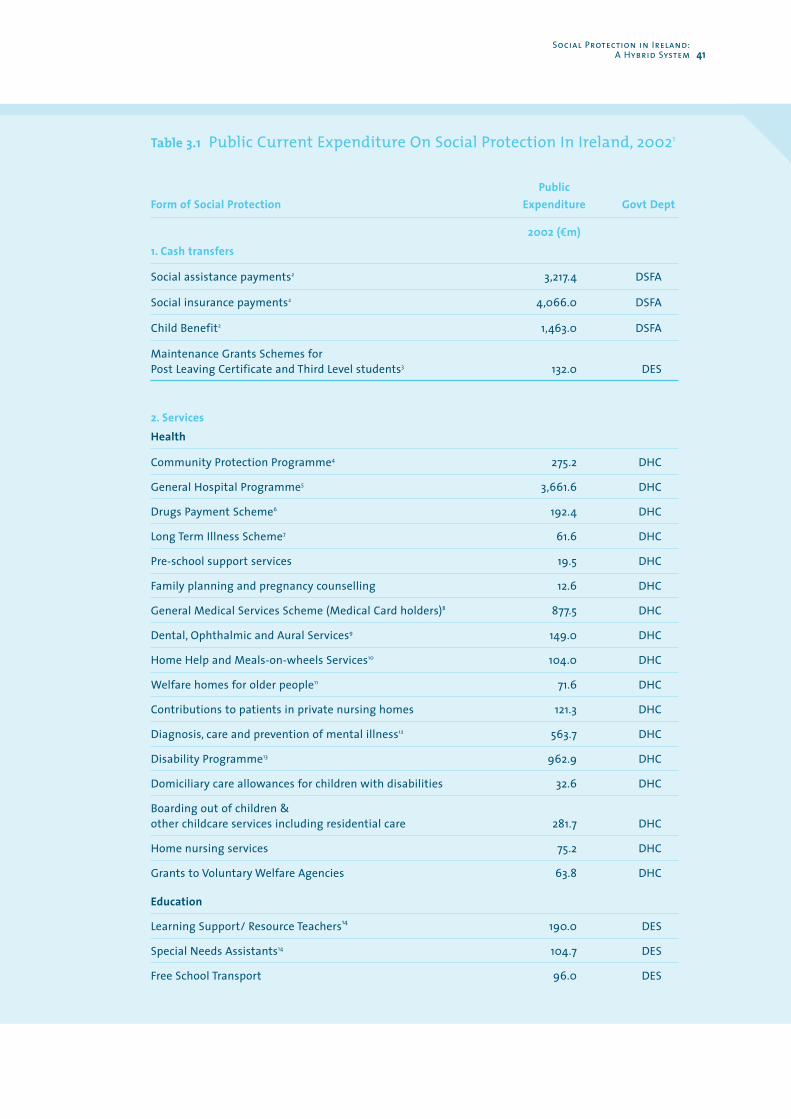
Social Protection in Ireland:A Hybrid System 41
Table 3.1 Public Current Expenditure On Social Protection In Ireland, 20021
Public Form of Social Protection Expenditure Govt Dept
2002 (em)1. Cash transfers
Social assistance payments2 3,217.4 DSFA
Social insurance payments2 4,066.0 DSFA
Child Benefit2 1,463.0 DSFA
Maintenance Grants Schemes for Post Leaving Certificate and Third Level students3 132.0 DES
2. Services Health
Community Protection Programme4 275.2 DHC
General Hospital Programme5 3,661.6 DHC
Drugs Payment Scheme6 192.4 DHC
Long Term Illness Scheme7 61.6 DHC
Pre-school support services 19.5 DHC
Family planning and pregnancy counselling 12.6 DHC
General Medical Services Scheme (Medical Card holders)8 877.5 DHC
Dental, Ophthalmic and Aural Services9 149.0 DHC
Home Help and Meals-on-wheels Services10 104.0 DHC
Welfare homes for older people11 71.6 DHC
Contributions to patients in private nursing homes 121.3 DHC
Diagnosis, care and prevention of mental illness12 563.7 DHC
Disability Programme13 962.9 DHC
Domiciliary care allowances for children with disabilities 32.6 DHC
Boarding out of children & other childcare services including residential care 281.7 DHC
Home nursing services 75.2 DHC
Grants to Voluntary Welfare Agencies 63.8 DHC
Education
Learning Support/ Resource Teachers14 190.0 DES
Special Needs Assistants14 104.7 DES
Free School Transport 96.0 DES
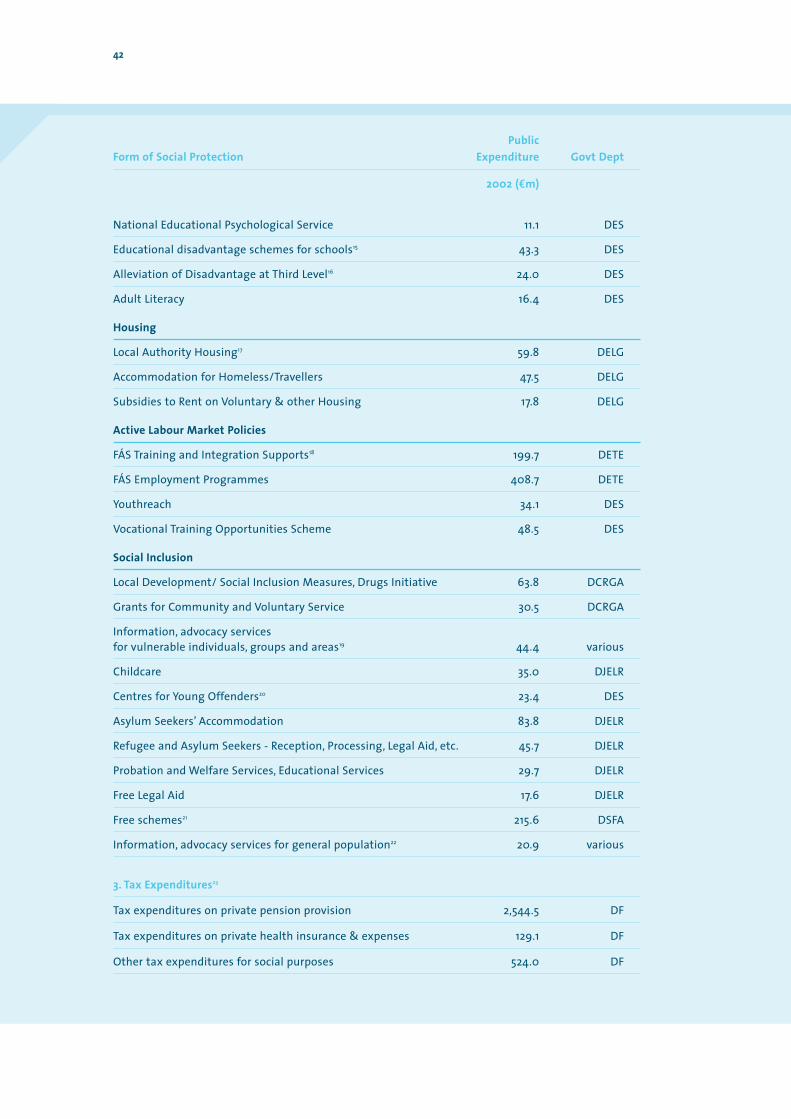
42
Public Form of Social Protection Expenditure Govt Dept
2002 (em)
National Educational Psychological Service 11.1 DES
Educational disadvantage schemes for schools15 43.3 DES
Alleviation of Disadvantage at Third Level16 24.0 DES
Adult Literacy 16.4 DES
Housing
Local Authority Housing17 59.8 DELG
Accommodation for Homeless/Travellers 47.5 DELG
Subsidies to Rent on Voluntary & other Housing 17.8 DELG
Active Labour Market Policies
FÁS Training and Integration Supports18 199.7 DETE
FÁS Employment Programmes 408.7 DETE
Youthreach 34.1 DES
Vocational Training Opportunities Scheme 48.5 DES
Social Inclusion
Local Development/ Social Inclusion Measures, Drugs Initiative 63.8 DCRGA
Grants for Community and Voluntary Service 30.5 DCRGA
Information, advocacy services for vulnerable individuals, groups and areas19 44.4 various
Childcare 35.0 DJELR
Centres for Young Offenders20 23.4 DES
Asylum Seekers’ Accommodation 83.8 DJELR
Refugee and Asylum Seekers - Reception, Processing, Legal Aid, etc. 45.7 DJELR
Probation and Welfare Services, Educational Services 29.7 DJELR
Free Legal Aid 17.6 DJELR
Free schemes21 215.6 DSFA
Information, advocacy services for general population22 20.9 various
3. Tax Expenditures23
Tax expenditures on private pension provision 2,544.5 DF
Tax expenditures on private health insurance & expenses 129.1 DF
Other tax expenditures for social purposes 524.0 DF
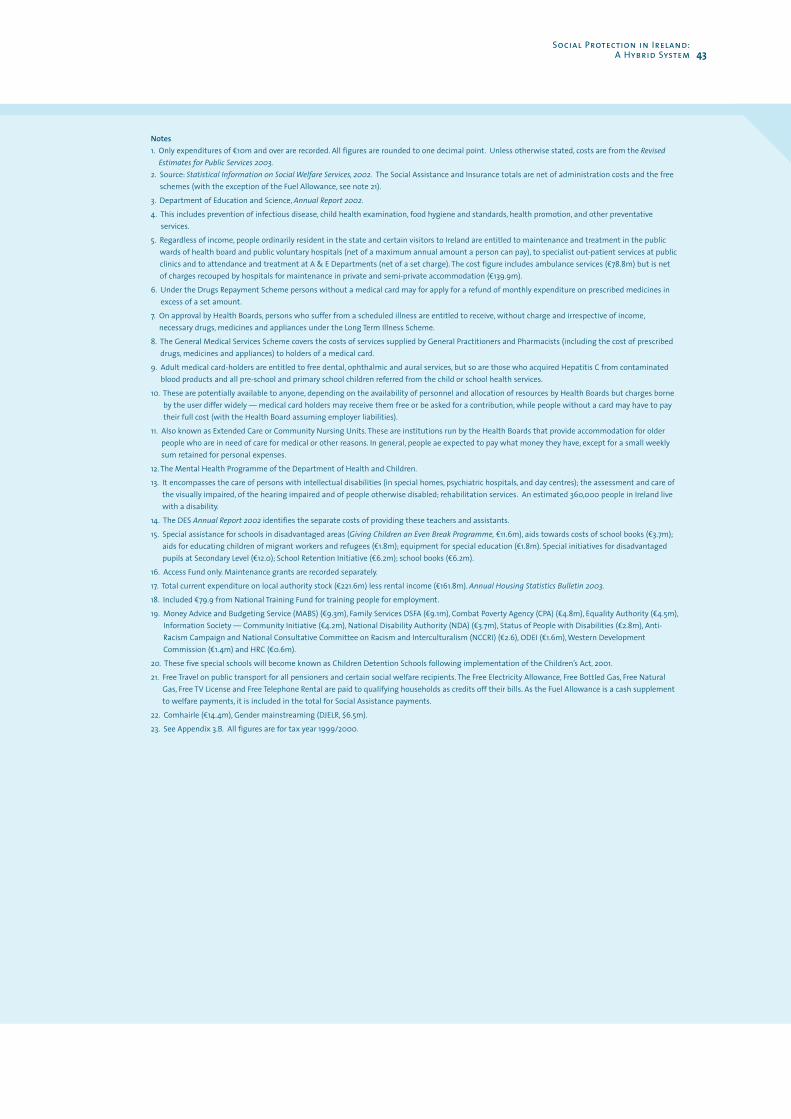
Social Protection in Ireland:A Hybrid System 43
Notes1. Only expenditures of c10m and over are recorded. All figures are rounded to one decimal point. Unless otherwise stated, costs are from the Revised
Estimates for Public Services 2003.2. Source: Statistical Information on Social Welfare Services, 2002. The Social Assistance and Insurance totals are net of administration costs and the free
schemes (with the exception of the Fuel Allowance, see note 21).
3. Department of Education and Science, Annual Report 2002.
4. This includes prevention of infectious disease, child health examination, food hygiene and standards, health promotion, and other preventativeservices.
5. Regardless of income, people ordinarily resident in the state and certain visitors to Ireland are entitled to maintenance and treatment in the publicwards of health board and public voluntary hospitals (net of a maximum annual amount a person can pay), to specialist out-patient services at publicclinics and to attendance and treatment at A & E Departments (net of a set charge). The cost figure includes ambulance services (c78.8m) but is netof charges recouped by hospitals for maintenance in private and semi-private accommodation (c139.9m).
6. Under the Drugs Repayment Scheme persons without a medical card may for apply for a refund of monthly expenditure on prescribed medicines inexcess of a set amount.
7. On approval by Health Boards, persons who suffer from a scheduled illness are entitled to receive, without charge and irrespective of income,necessary drugs, medicines and appliances under the Long Term Illness Scheme.
8. The General Medical Services Scheme covers the costs of services supplied by General Practitioners and Pharmacists (including the cost of prescribeddrugs, medicines and appliances) to holders of a medical card.
9. Adult medical card-holders are entitled to free dental, ophthalmic and aural services, but so are those who acquired Hepatitis C from contaminatedblood products and all pre-school and primary school children referred from the child or school health services.
10. These are potentially available to anyone, depending on the availability of personnel and allocation of resources by Health Boards but charges borneby the user differ widely — medical card holders may receive them free or be asked for a contribution, while people without a card may have to paytheir full cost (with the Health Board assuming employer liabilities).
11. Also known as Extended Care or Community Nursing Units. These are institutions run by the Health Boards that provide accommodation for olderpeople who are in need of care for medical or other reasons. In general, people ae expected to pay what money they have, except for a small weeklysum retained for personal expenses.
12. The Mental Health Programme of the Department of Health and Children.
13. It encompasses the care of persons with intellectual disabilities (in special homes, psychiatric hospitals, and day centres); the assessment and care ofthe visually impaired, of the hearing impaired and of people otherwise disabled; rehabilitation services. An estimated 360,000 people in Ireland livewith a disability.
14. The DES Annual Report 2002 identifies the separate costs of providing these teachers and assistants.
15. Special assistance for schools in disadvantaged areas (Giving Children an Even Break Programme, c11.6m), aids towards costs of school books (c3.7m);aids for educating children of migrant workers and refugees (c1.8m); equipment for special education (c1.8m). Special initiatives for disadvantagedpupils at Secondary Level (c12.0); School Retention Initiative (c6.2m); school books (c6.2m).
16. Access Fund only. Maintenance grants are recorded separately.
17. Total current expenditure on local authority stock (c221.6m) less rental income (c161.8m). Annual Housing Statistics Bulletin 2003.
18. Included c79.9 from National Training Fund for training people for employment.
19. Money Advice and Budgeting Service (MABS) (c9.3m), Family Services DSFA (c9.1m), Combat Poverty Agency (CPA) (c4.8m), Equality Authority (c4.5m),Information Society — Community Initiative (c4.2m), National Disability Authority (NDA) (c3.7m), Status of People with Disabilities (c2.8m), Anti-Racism Campaign and National Consultative Committee on Racism and Interculturalism (NCCRI) (c2.6), ODEI (c1.6m), Western DevelopmentCommission (c1.4m) and HRC (c0.6m).
20. These five special schools will become known as Children Detention Schools following implementation of the Children’s Act, 2001.
21. Free Travel on public transport for all pensioners and certain social welfare recipients. The Free Electricity Allowance, Free Bottled Gas, Free NaturalGas, Free TV License and Free Telephone Rental are paid to qualifying households as credits off their bills. As the Fuel Allowance is a cash supplementto welfare payments, it is included in the total for Social Assistance payments.
22. Comhairle (c14.4m), Gender mainstreaming (DJELR, $6.5m).
23. See Appendix 3.B. All figures are for tax year 1999/2000.
In effect, the Table encompasses practically the entire current expenditure of twogovernment departments (Social and Family Affairs, and Health and Children)14 ,and varying parts of the spending of five others (Education and Science; Justice,Equality and Law Reform; Finance; Community, Gaeltacht and Rural Affairs;Environment, Heritage and Local Government). The Table allows the relativeweights of the component elements of social protection to emerge clearly, andconveys the complexity of the challenge entailed in identifying priorities forallocating additional resources, as they become available, to improving socialprotection. The spread of government departments involved also prepares us forthe emphasis that will emerge in later chapters on the importance of joined-upgovernment if resources are to be used effectively and complexity, duplication andimbalances in meeting the needs of the same individuals, families andcommunities are to be reduced to the extent possible.
3.4 Income Support Arrangements
3.4.1 An Overview
Public spending on cash transfers (social assistance and social insurance payments,and child benefit) rose by 90 per cent in real terms between 1986 and 2002.Savings due to falling numbers claiming unemployment compensation, fewerdependants on average to each welfare recipient and fewer children in thepopulation were more than offset by rising payment rates on all schemes, agrowing number of pensioners, larger numbers of people in receipt of disabilityand one-parent family payments, and wholly new forms of coverage (principally,carers and in-work supports).
When the level of total spending on cash transfers is decomposed into six majorprogrammes15, what is driving growth in spending on income support appearsclearly (Chart 3.1). Spending on unemployment compensation peaked in 1993, afterwhich major savings were recorded under this heading until 2001 when a slightincrease took place. Spending on Illness, Disability and Caring has been movingsteadily upwards since 1994, largely because of the introduction and steadyimprovement in the Carer’s Allowance and a large increase in the number ofrecipients of the Disability Allowance. Spending on social welfare pensions beganto trend swiftly upwards after 1997, reflecting principally increases in paymentrates rather than any large increase (yet) in their numbers; the increase in rates hasbeen fuelled by the growing proportion of pensioners becoming entitled to the(slightly) higher contributory pension. The significant hike in Child Benefit in theBudgets of 2001 and 2002 also make an impact on the chart, rising by c800m inthose two years. Trends in spending on the other programmes are less dramaticbut, nevertheless, significant. Spending on lone parents has been the most
44
14. Social and Family Affairs as given in Statistical Information on Social Welfare Services, 2002; Health and Children as given in theDepartment’s itemised Programme Expenditure (the General Supports Programme reflecting some 4-5 per cent of Departmentalspending is excluded).
15. Over the long time period in question, the Department of Social and Family Affairs has reclassified some social welfare paymentsacross programmes, created new payments and added a new programme (Employment Supports). The six ‘programmes’ on whichthis Chart is based are simplified to allow for these changes. See Appendix 3.A.
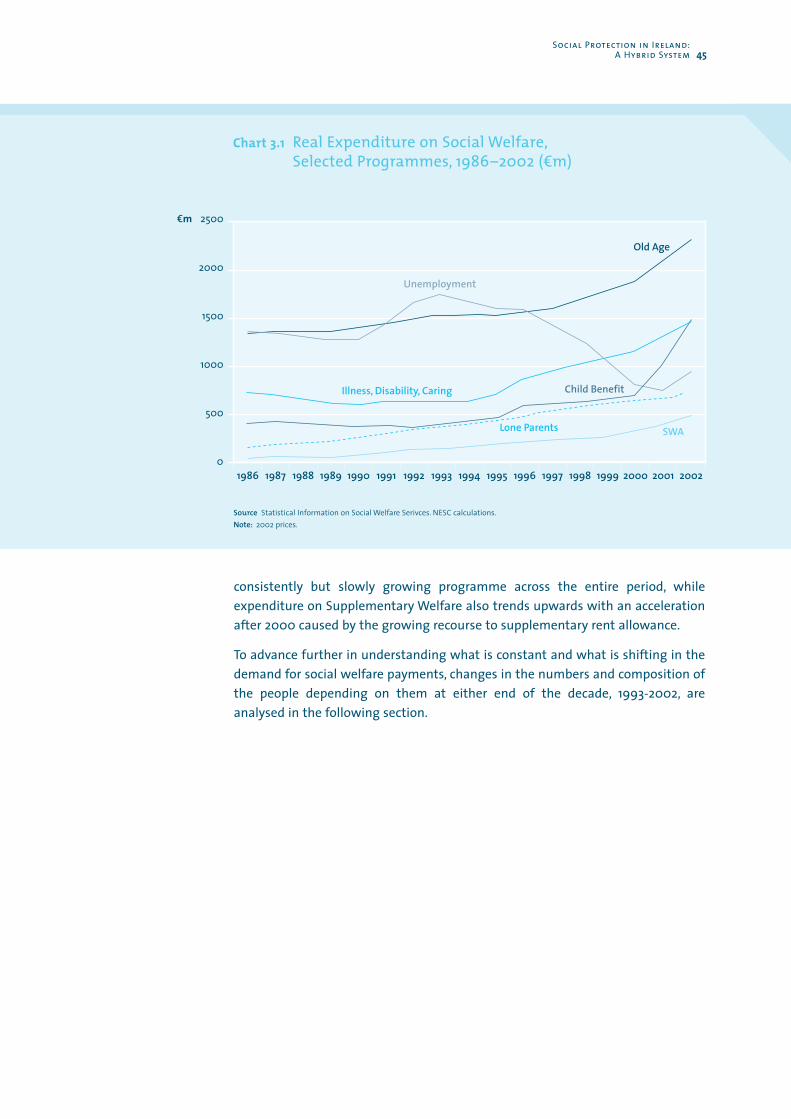
Social Protection in Ireland:A Hybrid System 45
consistently but slowly growing programme across the entire period, whileexpenditure on Supplementary Welfare also trends upwards with an accelerationafter 2000 caused by the growing recourse to supplementary rent allowance.
To advance further in understanding what is constant and what is shifting in thedemand for social welfare payments, changes in the numbers and composition ofthe people depending on them at either end of the decade, 1993-2002, areanalysed in the following section.
Chart 3.1 Real Expenditure on Social Welfare,Selected Programmes, 1986–2002 (dm)
19860
500
1000
1500
2000
2500
1987 1988 1989 1990 1991 1992 1993 1994 1995 1996 1997 1998 1999 2000 2001 2002
Illness, Disability, Caring
Unemployment
Child Benefit
SWALone Parents
Old Age
em
Source Statistical Information on Social Welfare Serivces. NESC calculations.Note: 2002 prices.
3.4.2 Social Assistance and Social Insurance Payments
Social Assistance
Over the ten-year period, 1993–2002, the total number of people dependent onmeans-tested social assistance (recipients along with their adult and childdependants) fell in absolute numbers by 11 per cent and, as a proportion of thetotal population, from 24.6 per cent to approximately 20 per cent (Table 3.2).The composition of the population dependent on means-testing changed moremarkedly. In 1993, it was dominated by the beneficiaries of UnemploymentAssistance (51 per cent), while a further 14 per cent were beneficiaries of the Non-Contributory Old Age Pension, 11 per cent of Lone Parent schemes,16 4.6 percent of the Family Income Supplement and 4.4 per cent of the Disabled Persons Maintenance Allowance (the precursor of Disability Allowance). By 2002,only 16 per cent of the means-tested population were the beneficiaries ofUnemployment Assistance.
The dominant programme had become the One-Parent Family Payment, whichaccounted for 27 per cent of the means-tested population; 13.5 per cent werereceiving the Family Income Supplement or benefiting from one of three otherprogrammes that had joined it under the generic title of ‘Employment Supports,17
while the Non-contributory Old Age Pension and Disability Allowance accountedfor a further 12 per cent and 11 per cent respectively.
Innovations in Social Assistance underlie some of these shifts in composition. In1993, an Employment Support Service was established inside the Department ofSocial Welfare to adopt a more proactive approach to providing additional supportmeasures for long-term welfare recipients to access employment. Since then, asignificant set of employment supports developed that increased the financialincentive to move from receipt of a means-tested welfare payment intoemployment18. These still account for only a small part of the total social welfarebudget (2.8 per cent in 2002), albeit a major increase on 1993 when only 0.45 percent was devoted to employment supports. The other significant extension of themeans-tested system occurred in 1990, viz., the introduction of the Carer’sAllowance. Its impact is recorded in the Table, rising from just under 1 per cent of themeans-tested population in 1993 to 5 per cent in 2002.
46
16. In 1993, these were the Lone Parent’s Allowance (unmarried parent, separated spouse, widowed, prisoners’ spouse), Deserted Wife’sAllowance and Prisoner’s Wife’s Allowance.
17. Principally the Back to Work Allowance with smaller numbers on the Back to Education Allowance and Back to Work EnterpriseAllowance.
18. The Family Income Supplement is an earnings subsidy to low-paid workers rearing children - it was introduced in 1984 and madesignificantly more generous in 1998 when the basis of calculation switched from gross to net earnings. The Back to Work AllowanceScheme, introduced in 1993, allows people to retain a proportion of their welfare payment, which declines over a three-year period,with their earnings from employment (there is a more generous version for people entering self-employment); in addition, at lowearnings they retain their secondary benefits (rent supplement, medical card, fuel allowance, Christmas bonus, etc.). The Back toEducation Allowance, introduced in 1996, enables people to pursue full- or part-time education courses at second, further or thirdlevel and to receive a non-means-tested allowance in lieu of their former welfare payment and to retain secondary benefits. Finally,when payments to lone parents were reorganised in 1997, a relatively generous earnings disregards was introduced (its generosity,however, has steadily eroded through not through not being adjusted).
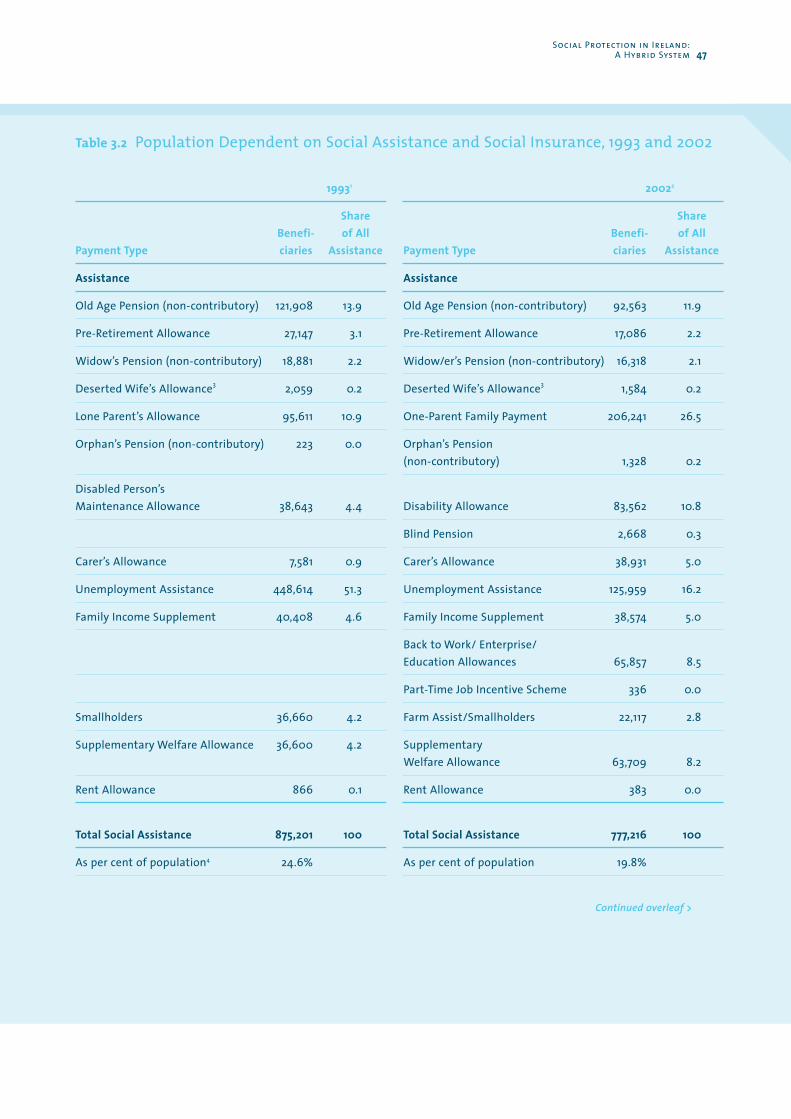
Table 3.2 Population Dependent on Social Assistance and Social Insurance, 1993 and 2002
19931 20022
Share ShareBenefi- of All Benefi- of All
Payment Type ciaries Assistance Payment Type ciaries Assistance
Assistance Assistance
Old Age Pension (non-contributory) 121,908 13.9 Old Age Pension (non-contributory) 92,563 11.9
Pre-Retirement Allowance 27,147 3.1 Pre-Retirement Allowance 17,086 2.2
Widow’s Pension (non-contributory) 18,881 2.2 Widow/er’s Pension (non-contributory) 16,318 2.1
Deserted Wife’s Allowance3 2,059 0.2 Deserted Wife’s Allowance3 1,584 0.2
Lone Parent’s Allowance 95,611 10.9 One-Parent Family Payment 206,241 26.5
Orphan’s Pension (non-contributory) 223 0.0 Orphan’s Pension (non-contributory) 1,328 0.2
Disabled Person’s Maintenance Allowance 38,643 4.4 Disability Allowance 83,562 10.8
Blind Pension 2,668 0.3
Carer’s Allowance 7,581 0.9 Carer’s Allowance 38,931 5.0
Unemployment Assistance 448,614 51.3 Unemployment Assistance 125,959 16.2
Family Income Supplement 40,408 4.6 Family Income Supplement 38,574 5.0
Back to Work/ Enterprise/ Education Allowances 65,857 8.5
Part-Time Job Incentive Scheme 336 0.0
Smallholders 36,660 4.2 Farm Assist/Smallholders 22,117 2.8
Supplementary Welfare Allowance 36,600 4.2 Supplementary Welfare Allowance 63,709 8.2
Rent Allowance 866 0.1 Rent Allowance 383 0.0
Total Social Assistance 875,201 100 Total Social Assistance 777,216 100
As per cent of population4 24.6% As per cent of population 19.8%
Continued overleaf >
Social Protection in Ireland:A Hybrid System 47
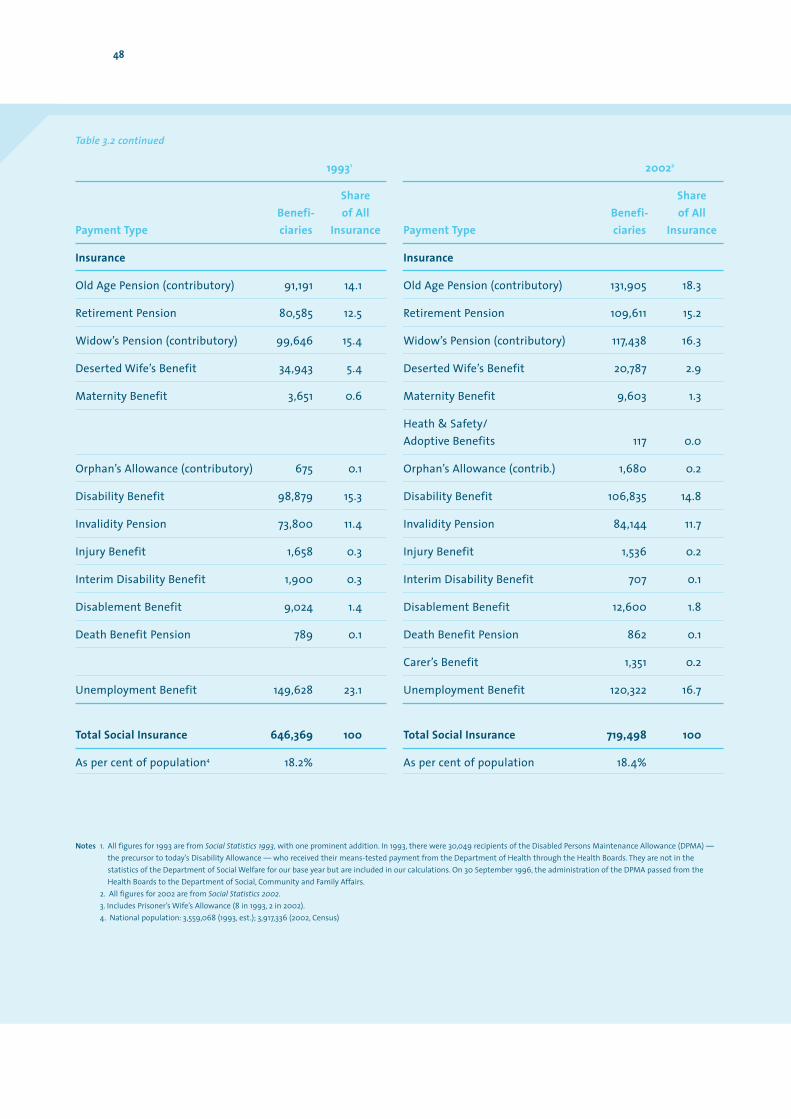
48
Table 3.2 continued
19931 20022
Share Share Benefi- of All Benefi- of All
Payment Type ciaries Insurance Payment Type ciaries Insurance
Insurance Insurance
Old Age Pension (contributory) 91,191 14.1 Old Age Pension (contributory) 131,905 18.3
Retirement Pension 80,585 12.5 Retirement Pension 109,611 15.2
Widow’s Pension (contributory) 99,646 15.4 Widow’s Pension (contributory) 117,438 16.3
Deserted Wife’s Benefit 34,943 5.4 Deserted Wife’s Benefit 20,787 2.9
Maternity Benefit 3,651 0.6 Maternity Benefit 9,603 1.3
Heath & Safety/ Adoptive Benefits 117 0.0
Orphan’s Allowance (contributory) 675 0.1 Orphan’s Allowance (contrib.) 1,680 0.2
Disability Benefit 98,879 15.3 Disability Benefit 106,835 14.8
Invalidity Pension 73,800 11.4 Invalidity Pension 84,144 11.7
Injury Benefit 1,658 0.3 Injury Benefit 1,536 0.2
Interim Disability Benefit 1,900 0.3 Interim Disability Benefit 707 0.1
Disablement Benefit 9,024 1.4 Disablement Benefit 12,600 1.8
Death Benefit Pension 789 0.1 Death Benefit Pension 862 0.1
Carer’s Benefit 1,351 0.2
Unemployment Benefit 149,628 23.1 Unemployment Benefit 120,322 16.7
Total Social Insurance 646,369 100 Total Social Insurance 719,498 100
As per cent of population4 18.2% As per cent of population 18.4%
Notes 1. All figures for 1993 are from Social Statistics 1993, with one prominent addition. In 1993, there were 30,049 recipients of the Disabled Persons Maintenance Allowance (DPMA) —the precursor to today’s Disability Allowance — who received their means-tested payment from the Department of Health through the Health Boards. They are not in thestatistics of the Department of Social Welfare for our base year but are included in our calculations. On 30 September 1996, the administration of the DPMA passed from theHealth Boards to the Department of Social, Community and Family Affairs.
2. All figures for 2002 are from Social Statistics 2002.3. Includes Prisoner’s Wife’s Allowance (8 in 1993, 2 in 2002).4. National population: 3,559,068 (1993, est.); 3,917,336 (2002, Census)
The purchasing power of these payments steadily improved over the decade, by asmuch as 21 per cent for a single person on long-term unemployment assistance.However, as a proportion of gross average industrial earnings, the lowest socialassistance payments have largely maintained the same relative position from asfar back as 1987 (approximately 24 per cent). As a proportion of net averageearnings, their relative position deteriorated as tax reductions on earnings wereparticularly significant over the period (NESC, 2003: Table 2.4). In 1999, a milestonewas reached when the lowest social assistance payments reached the threshold ofadequacy set by the 1986 Commission on Social Welfare. The Revised National Anti-Poverty Strategy (NAPS) of 2002 has set a new threshold for the lowest socialassistance adult rate, viz., the achievement of a weekly d150 in 2002 terms by 2007.
There have been few general reforms discussed, much less implemented, for thesystem of Social Assistance as a whole since the mid-1980s (changes specific tochildren, people of working age and retired people are discussed separately below).Despite the case being made for the indexation of payment rates, their generaladjustment continues to be part of the annual budgetary process. The case hasalso been made for individualising the welfare code so that it would better reflectnew labour market realities by which one-and-a-half or two earners rather thanone (‘male breadwinner’) are increasingly the support system of a household.However, while several measures give increased recognition to the autonomy ofthe ‘adult dependant’, the means-test continues to be administered on the basis ofa couple’s ‘household’ income.
Social Insurance
As the population dependent on social assistance fell in absolute terms and as aproportion of the national population, the numbers dependent on the receipt ofinsurance-based payments rose by 11 per cent over the ten year period. There weresome 501,000 direct recipients of these benefits in 2002 with 218,000 dependants— together constituting 18.4 per cent of the total population, little changed fromthe 18.2 per cent a decade earlier (1993). However, a larger share was made up ofthe beneficiaries of contributory pensions in 2002 than in 1993 (34 per cent asagainst 27 per cent); the share accounted for by the beneficiaries of unemploymentbenefit dropped from 23 per cent to 17 per cent. The most significant changes inrecent years have been, on the contribution side, the admission of the self-employed, part-time workers, civil and public servants (recruited from 1995onwards) and CE workers to the system.19 On the expenditure side, all paymentrates have increased significantly in real terms; entitlement to maternity benefithas been extended to the self-employed (not originally covered), increased induration from 16 to 18 weeks for everyone and is to be restored to 80 per cent ofreckonable earnings (it had been reduced to 70 per cent in 1984)20; a Carer’s Benefitwas introduced (2000) and interruptions to employment for caring and parentingare treated more sympathetically in computing individual’s contribution records
Social Protection in Ireland:A Hybrid System 49
19. Proof of a reasonable level of attachment to the workforce is required and considered met if part-time workers are earning in excessof c38 a week and self-employed in excess of c3,174 a year. Because these thresholds have not been raised in line with averageearnings, it has become progressively easier for people with very low earnings to gain admittance to the Fund.
20. 7th Progresss Report, Sustaining Progress, February 2005.
(via disregards and credits). The only significant tightening of eligibility has beenflagged for contributory pensions after 2012, when the threshold of paidcontributions establishing entitlement to some level of pension is to be doubled.
Ireland’s Social Insurance Fund can fairly be described as strong on solidarity butweak in its claim to be designated ‘insurance’. The income of the Fund does notcover the expected benefits to be paid on an actuarial basis, as pure insurance logicwould require. (Though, when the self-employed were first brought into thescheme in 1988, their lower contribution rate was based on their restricted accessto benefits.) After a threshold of individual contributions (minimum duration) anda low minimum earnings level are reached, there is little proportionate linkbetween the cumulative value of what a person has contributed to the Fund andthe payments to which he or she becomes entitled21; all pay-related features havebeen phased out. Solidarity, by contrast, among those who are economically active,is a strong feature of the Fund, arising from several aspects of the code governingit. In the first place, longer contribution records, after a certain threshold isreached, do not bring proportionately higher entitlements; this is an implicittransfer from workers with long careers to those with shorter ones. In secondplace, payments from the Fund are flat-rated although contributions are based onpercentages of income (up to a ceiling); this is an implicit transfer from high-earners to low-earners. In third place, payments out attract additions for qualifiedadult and child dependants, a transfer - this time - from single to married people.Yet other features reinforce the nature of the Fund as solidarity rather thaninsurance in a true sense; for example, contributions in certain circumstances canbe ‘credited’ rather than paid while, in other circumstances, periods outside theworkforce are disregarded when it comes to computing the yearly average ofcontributions over a person’s career.22
Notwithstanding — or because of — this major element of solidarity, there iswidespread support for the central role of the Social Insurance Fund in Ireland’soverall arrangements for protecting people’s incomes. Even without fundamentalquestioning of its contributory basis (e.g., the suggestion that employeecontributions to the Fund should be phased out altogether and replaced with acorresponding Exchequer subvention [McArdle and de Buitlear, 2003]), significantchallenges still attach to continuing the levels and types of support it provides. In thefirst instance, population ageing is set to have major implications for the paymentlevel of the contributory pension that will be sustainable in the future as the ratio ofpensioner beneficiaries to current contributors steadily rises. For example, if currentbenefits do no more than keep pace with prices, the percentage of benefit outgoaccounted for by pensions will rise to 51 per cent in 2031 and 61 per cent in 2056 from38 per cent in 2002 (Department of Social and Family Affairs, 2002). The debate herecentres on whether and how the funding of the contributory pension can be placedon a broader basis than PRSI, and on the moral case and financial mechanisms forbringing workers to ensure that they will have a supplementary pension or savingsto complement their contributory old-age pension.
50
21. For weekly earnings below a minimum threshold (c150 in 2004), the level of payment is reduced approximately in line with earnings.
22. A survey carried out in 1999 estimated that 12.5 per cent of those receiving a contributory pension would not have qualified save forcredits and that a ‘significant number’ were receiving a higher payment than they would otherwise have received (DSFA, 2000).
A second significant challenge to the social insurance system arises from evidencethat changes in the labour market are putting identifiable groups of workers at adistinct disadvantage in building up the contribution records that secure thementitlements to adequate insurance-based payments. The rapid acceleration inwomen’s employment rates have exposed the extent to which postponement oflabour market entry or interruptions in employment for caring purposes (of youngchildren, household members with disabilities or older persons) unduly weaken aworker’s contributions record under the current social insurance code. Whilewomen with caring responsibilities are — by far — the largest single groupaffected, the issues raised touch on other groups as well. Early school leavers,older workers, low skilled migrant workers and people with disabilities can alsoexperience difficulties in building up their contribution records. In their case, it canbe argued that engaging in further education or training has merit as aninterruption in employment during which contributions could either be credited orthe time disregarded when their contributions are averaged.
3.4.3 Child Income Support
One universal cash payment, Child Benefit, is paid on behalf of over one millionchildren (2002). It has acquired a more major profile since Budget 2001 when asignificant hike in its value was initiated. By 2002, expenditure on Child Benefitaccounted for some 15 per cent of total social welfare expenditure, as against6 per cent a decade earlier (1993). As early as 1994, however, a major shift began inthe structure of State income support to children. A larger than normal increase inuniversal monthly Child Benefit was partly funded by not extending the generalincrease in social welfare payments to the weekly Child Dependant Allowances(supplements to weekly social welfare payments in recognition of childdependants, or CDAs). This had first been done in 1986 but, in 1994, the CDAs werefrozen on an on-going basis (an intention to balance this with a targeted ChildBenefit Supplement was not proceeded with). By 2002, the monthly rates of ChildBenefit were 4.6 (lower rate) to 5.0 times (higher rate) higher in nominal termsthan in 1993, whereas the weekly rate of CDAs were relatively unchanged. As Table3.3 shows, the impact on the composition of State income support to children overa ten-year period has been remarkable. There has been a fundamental shift in thestructure of income support provided children in low-income households.
Social Protection in Ireland:A Hybrid System 51
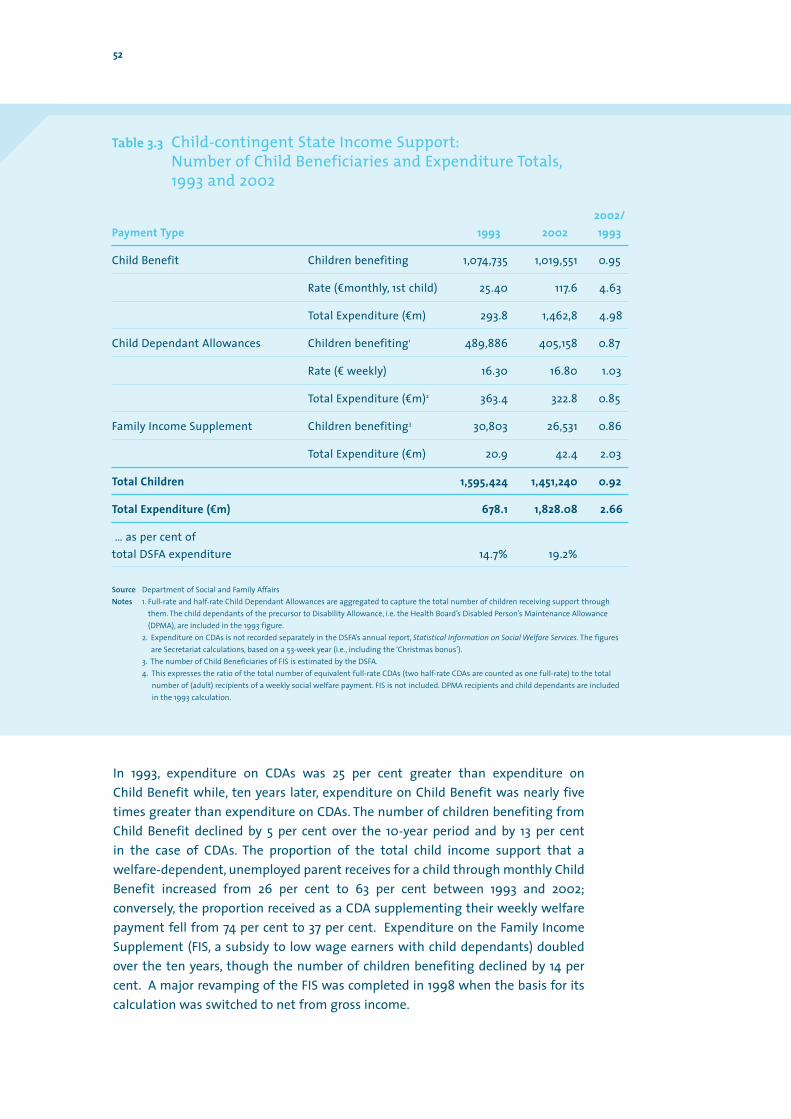
52
In 1993, expenditure on CDAs was 25 per cent greater than expenditure on Child Benefit while, ten years later, expenditure on Child Benefit was nearly fivetimes greater than expenditure on CDAs. The number of children benefiting from Child Benefit declined by 5 per cent over the 10-year period and by 13 per centin the case of CDAs. The proportion of the total child income support that awelfare-dependent, unemployed parent receives for a child through monthly ChildBenefit increased from 26 per cent to 63 per cent between 1993 and 2002;conversely, the proportion received as a CDA supplementing their weekly welfarepayment fell from 74 per cent to 37 per cent. Expenditure on the Family IncomeSupplement (FIS, a subsidy to low wage earners with child dependants) doubledover the ten years, though the number of children benefiting declined by 14 percent. A major revamping of the FIS was completed in 1998 when the basis for itscalculation was switched to net from gross income.
Table 3.3 Child-contingent State Income Support:Number of Child Beneficiaries and Expenditure Totals,1993 and 2002
2002/Payment Type 1993 2002 1993
Child Benefit Children benefiting 1,074,735 1,019,551 0.95
Rate (dmonthly, 1st child) 25.40 117.6 4.63
Total Expenditure (dm) 293.8 1,462,8 4.98
Child Dependant Allowances Children benefiting1 489,886 405,158 0.87
Rate (d weekly) 16.30 16.80 1.03
Total Expenditure (dm)2 363.4 322.8 0.85
Family Income Supplement Children benefiting3 30,803 26,531 0.86
Total Expenditure (dm) 20.9 42.4 2.03
Total Children 1,595,424 1,451,240 0.92
Total Expenditure (em) 678.1 1,828.08 2.66
… as per cent of total DSFA expenditure 14.7% 19.2%
Source Department of Social and Family AffairsNotes 1. Full-rate and half-rate Child Dependant Allowances are aggregated to capture the total number of children receiving support through
them. The child dependants of the precursor to Disability Allowance, i.e. the Health Board’s Disabled Person’s Maintenance Allowance(DPMA), are included in the 1993 figure.
2. Expenditure on CDAs is not recorded separately in the DSFA’s annual report, Statistical Information on Social Welfare Services. The figuresare Secretariat calculations, based on a 53-week year (i.e., including the ‘Christmas bonus’).
3. The number of Child Beneficiaries of FIS is estimated by the DSFA.4. This expresses the ratio of the total number of equivalent full-rate CDAs (two half-rate CDAs are counted as one full-rate) to the total
number of (adult) recipients of a weekly social welfare payment. FIS is not included. DPMA recipients and child dependants are included in the 1993 calculation.
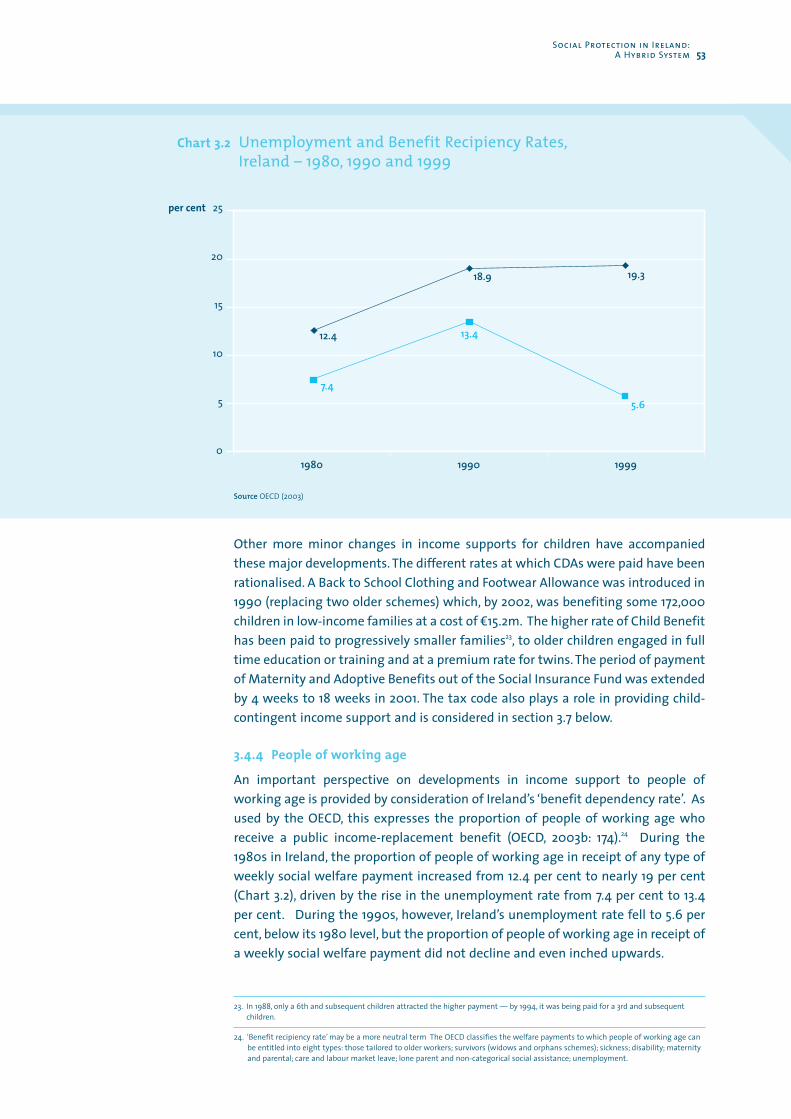
Other more minor changes in income supports for children have accompaniedthese major developments. The different rates at which CDAs were paid have beenrationalised. A Back to School Clothing and Footwear Allowance was introduced in1990 (replacing two older schemes) which, by 2002, was benefiting some 172,000children in low-income families at a cost of d15.2m. The higher rate of Child Benefithas been paid to progressively smaller families23, to older children engaged in fulltime education or training and at a premium rate for twins. The period of paymentof Maternity and Adoptive Benefits out of the Social Insurance Fund was extendedby 4 weeks to 18 weeks in 2001. The tax code also plays a role in providing child-contingent income support and is considered in section 3.7 below.
3.4.4 People of working age
An important perspective on developments in income support to people ofworking age is provided by consideration of Ireland’s ‘benefit dependency rate’. Asused by the OECD, this expresses the proportion of people of working age whoreceive a public income-replacement benefit (OECD, 2003b: 174).24 During the1980s in Ireland, the proportion of people of working age in receipt of any type ofweekly social welfare payment increased from 12.4 per cent to nearly 19 per cent(Chart 3.2), driven by the rise in the unemployment rate from 7.4 per cent to 13.4per cent. During the 1990s, however, Ireland’s unemployment rate fell to 5.6 percent, below its 1980 level, but the proportion of people of working age in receipt ofa weekly social welfare payment did not decline and even inched upwards.
Social Protection in Ireland:A Hybrid System 53
23. In 1988, only a 6th and subsequent children attracted the higher payment — by 1994, it was being paid for a 3rd and subsequentchildren.
24. ‘Benefit recipiency rate’ may be a more neutral term The OECD classifies the welfare payments to which people of working age canbe entitled into eight types: those tailored to older workers; survivors (widows and orphans schemes); sickness; disability; maternityand parental; care and labour market leave; lone parent and non-categorical social assistance; unemployment.
Chart 3.2 Unemployment and Benefit Recipiency Rates,Ireland – 1980, 1990 and 1999
19800
5
10
15
20
25per cent
1990 1999
12.4
18.9 19.3
7.4
13.4
5.6
Source OECD (2003)
Behind this apparent puzzle is the profound change in the composition of theworking age population who receive social welfare, to which Table 3.2 already drewattention. During the 1980s, the number and composition of people of working-age in receipt of social welfare (thus, excluding pensioners) was overwhelminglydriven by growth in the numbers of people receiving unemployment assistance orbenefit. By 1990, these were as numerous as all the working-age recipients ofother types of benefit put together (lone parents, disability, carers, pre-retirement,supplementary welfare). During the 1990s, however, a large reduction in thenumbers being compensated for their unemployment was more than offset by anincrease in the numbers receiving these other types of social welfare, in particular,the one parent family payment and disability allowance. By the year 2000, therecipients of these last two payments alone outnumbered those beingcompensated for unemployment. It is significant that growth in their numbers hasbeen a constant over the two decades. When a significant fall in unemploymenttook place, it was sufficient for the numbers in receipt of the one parent familypayment and disability allowance to continue growing at a slightly lesser pace fortheir combined influence to more than compensate for the fall in unemployment.
These two observations — of relative stability in the proportion of the populationof working age receiving social welfare during Ireland’s economic boom and ofprofound change in its composition — are evidence of important social trends andpresent a major challenge to Ireland’s current arrangements for administeringsocial welfare. Different interpretations of this challenge will be provided inChapter 6 below where these developments in Ireland are compared with those ofother countries.
There have also been some notable innovations in how the programmes aredelivered. An important milestone was the eradication from the social welfarecode of discrimination against married women. Tentative steps have also beentaken towards a degree of individualisation in the code (e.g., couples can split theirmain payment and adult allowance for certain payments, the benefit and privilegerule has been eased). The most sustained development, however, has been thespread of measures designed to increase the attractiveness of holdingemployment (see footnote 18 above). The referral process introduced in the contextof Ireland’s employment action plan is particularly significant here.25 Under this,individuals crossing a threshold of duration on the Live Register are referred by theDepartment of Social and Family Affairs to the Public Employment Service (FÁS) forinterview. Starting in 1998, individuals aged under 25 and crossing a 6-monththreshold on the Live Register were referred for interview; by 2000, the process hadextended to embrace all 20-54 year olds crossing a 9-month threshold. The maindeparture from this emphasis on encouraging employment was the introductionof the Carer’s Allowance in 1990 and its rapid consolidation over the ten years as amajor contingency-based payment.
The disincentive effect of benefit withdrawal continues to be a serious concern. Inthe worst case, heads of households who leave welfare for work find that theirmoney incomes net of tax, work-related expenses and newly acquired exposure todifferent charges (medical expenses, higher rent, bin charge, etc.) are lower than
54
25. For example, OECD Employment Outlook, 2003: 204.
they when they were reliant on social welfare and had a living standard protectedby secondary benefits as well as tax-exempt transfer incomes. Such ‘poverty traps’were extensively investigated in earlier years (e.g., Expert Working Group, 1996)and several measures taken to reduce them (e.g., the decision to freeze CDAs andrely on higher CB instead, placing the calculation of FIS on a net rather than grossincome basis, allowing the retention of secondary benefits on a tapering basis tocategories of former welfare recipient). However, significant disincentive effectshave crept back in. For example:
s As access to local authority housing became more strictly rationed and rents inthe private rental sector rose, more people on social welfare have had recourseto the supplementary rent supplement. However, entitlement to it is confinedto those in receipt of social welfare and lost on taking employment.
s The income threshold eligibility for the medical card has not kept pace with thegrowth in earnings. As a result, the medical card is held by fewer and fewerpeople on low earnings and increasingly associated with welfare dependency.The going rate for consulting a GP and the capped charges that govern accessto public health services have risen (more below), making the loss of themedical card a significant deterrent to leaving welfare for work.
s The different earnings disregards designed to provide people leaving welfarewith a financial cushion to cover back-to-work expenses have not been raisedto reflect the growth in either costs or general earnings levels. For example, onearnings up to d293 a week, lone parents can retain some of their formerwelfare payments.26 This level of disregards corresponded to 80 per cent ofGross Average Industrial Earnings (GAIE) when it was first introduced (1997) butto 55 per cent of GAIE by 2003; as general earnings rose, the level of theearnings disregard was not adjusted. If its level had been indexed to the rapidlyescalating costs of childcare over the period (a back-to-work expense to whichlone parents are particularly prone), the earnings disregard would have beenraised substantially.27
s The attempt to buttress the living standards of people on disability benefits byextending ‘Free Schemes’ originally designed for pensioners to them also hasunambiguously benefited persons with no employment potential or interest inrejoining the workforce. However, it has also created a disincentive for thoseamong them who would like to do so, even in a partial capacity, as theirentitlement to the ‘Free Schemes’ is conditional on their remaining outside theworkforce (DSFA, 2003). Similarly, seeking to target training or employmentprogrammes on people with long durations on social welfare, where theprogrammes in question are seen to be desirable, has created an incentive toremain longer on welfare in order to ‘qualify’.
These are aspects of Ireland’s social welfare code which suggest it is still not‘employment friendly’ for a significant number of people. The code itself may be
Social Protection in Ireland:A Hybrid System 55
26. The first c146.50 is completely disregarded; half of the next c146.50 is assessed as means and deducted from the welfare paymenton a euro for euro basis.
27. In similar fashion, the gross income level at which all entitlement to supplementary rent allowance — and all entitlement tosecondary benefits for a lone parent in employment — is lost was £250 a week in 1992, approximately equal to GAIE at the time.This has not been raised since, with the result that — by 2003 — this support extended only to those earning less than 60 per centof GAIE. People going back to work under the BTWA, however, retain a tapering portion of their rent allowance over a 3-year period.
contributing to the duration of welfare receipt, by fostering the scenario of ‘oncein, hard out’ (altogether different from the scenario of a ‘cushioned life’ on welfarefor which the evidence on the composition of the population in consistent povertyis to the contrary (CSO, 2005). They point to the need to strengthen and make moresystematic procedures which rigorously monitor and redress high benefitwithdrawal rates.
Re-emerging benefit withdrawal traps, however, are probably secondary inaccounting for long durations of welfare receipt by people of working age todeeper issues such as the very contingency basis to their payments. Theseencourage people to see an aspect of their current situation (being a lone parent,having an illness or disability, being aged over 55, being out of work a long time) asa disadvantage confirming their inability to be self-reliant and yet to adhere to itas their guarantee of a secure income (discussed further in 6.3 below). Most socialassistance payments are of an indefinite duration and the evidence is disturbingthat significant numbers of recipients are, effectively, ‘parked’ on them. Forexample, the average duration of receipt of the One Parent Family Payment was of6 to 8 years (2003); 48 per cent of the recipients of Disability Benefit in 2002 —intended as a short-term payment — were in receipt of the payment for more than1 year, over 16 per cent for 5 years and 8 per cent for more than 10 years (2002);significant numbers receiving Supplementary Welfare Allowance (the emergencypayment of last resort) because of sickness were claiming it for more than a yearand some for more than 5 years (2002).28
A second fundamental issue is the erosion of self-confidence and self-esteem thatcan result from struggling to live on a low income over a long period of time. Theevidence is that social welfare payments are critical to low income groups,frequently constituting almost the entire income of the poorest households (CSO,2005). This is not only a challenge to raise the level of social welfare payments(discussed in 4.4.2 below) but to improve the design of the system which deliversthem and to integrate it more with access to services. The evidence on the extentand severity of low incomes is also a reminder that many people on social welfareshould not be assumed to be in a strong position to compete for employment orsucceed in training and educational programmes. Many of them may bestruggling with debt, poor health and low self-esteem. A third fundamental issueis the operation of the household means-test which can make spouses/partnersunwilling to exploit new opportunities in the labour market and assume the roleof secondary earners, despite the fact that the diversity of employmentopportunities (by hours, type of contract, location, level of skills required, etc.) hassteadily widened.
In summary to this section, some insufficiently adverted to trends are a major partof the new context inviting a major re-appraisal of how social assistance paymentsserve people of working age in Ireland today. Welfare receipt on the part of peopleof working age did not decline despite the dramatic expansion in employment andfall in unemployment, but the composition of their welfare payments altered in amajor way and receipt is of extremely long duration for a significant number ofpeople. The directions that responses to these issues should take are discussedfurther in chapters 6 and 7 below
56
28. DSFA sources — One Parent durations for 2003, Disability Allowance durations for 2002 .
3.4.5 Pensions
At the opposite end of the life cycle to children, significant changes have alsooccurred in pensions over the period under consideration. The hybrid nature ofIreland’s welfare state is particularly evident in its core arrangements for providingpensions. The state takes direct responsibility for setting a floor to pensioners’incomes and alleviating poverty among them; it takes only indirect responsibilityfor shielding people from a drop in their accustomed living standards onretirement (income replacement). Ireland, in fact, is the only EU 15 Member Statewith no mandatory, income-related state pension scheme (Joint Report by theCommission and the Council on Adequate and Sustainable Pensions, 2003: 41). Itrelies, instead, on regulation and the provision of subsidies in the form of taxexpenditures to promote the voluntary provision and take-up of supplementaryprivate sector occupational and/or personal pensions.
The floor to pensioners’ incomes is provided by social welfare pensions, viz., the OldAge Non-Contributory Pension (OANCP) and the Retirement and Old AgeContributory Pensions.29 OANCP is potentially available to anyone in the state buton the basis of a means-test; this disregards the value of the pensioner’s ownhome and a first d12,700 (2004) in savings but income from other property andsavings above that threshold reduce the payment. Practically every person inemployment is obliged to contribute to the Social Insurance Fund so as to becomeeligible for a non-means tested Retirement or Old Age Contributory Pension, thepayments of which are not affected by other income. These payments, however,are flat rated, reflecting their ‘poverty prevention’ objective rather than an ‘incomereplacement’ one. As a result, only low-paid workers in Ireland have high levels oftheir earnings ‘replaced’ in retirement by social welfare pensions; by contrast, theirreplacement value has little significance for higher paid workers.30
Workers on low earnings or interrupted employment records also benefit from thesignificant degree of solidarity that is internal to the Social Insurance Fund. This isbecause they can establish their entitlement to the maximum pension paymenton the basis of contribution records and levels of payment that are significantlylower than others who, nevertheless, receive the same pension. This is inherent togeneral features of the Social Insurance code — pensions are flat-rated whilecontributions are proportional to income (up to a ceiling), contributions can becredited in certain instances rather than paid — and because of the operation ofthe two main qualifying conditions for the OACP itself, viz. the low minimum ofcontributions that governs entitlement to some pension in the first place and themanner of calculation of the average of annual contributions that governs itsamount.31 As an example, of two people retiring in 2002, if one had worked for 30years on low earnings and with short bouts of unemployment while the other hadworked continuously for 40 years and been a high earner for half of her career,each would receive the same pension.
Social Protection in Ireland:A Hybrid System 57
29. The Retirement Pension is payable at 65 on condition that full-time employment has ceased and the Old Age Contributory Pensionat 66 with no prohibition on continuing full-time employment.
30. To compare the replacement rates at different levels of earning achieved by social welfare pensions in different countries, see the UKreport, Pensions: Challenges and Choice. The First Report of the Pensions Commission (2004: 59-60).
31. Namely, to have at least 260 full-rate, paid contributions (rising to 520 in April 2012) in order to be entitled to a pension in the firstplace, with the calculation of the yearly average of one’s paid or credited contributions since 1953 determining whether themaximum pension is paid or a proportion of it.
The rates of payment of all social welfare pensions have increased by significantlymore than inflation since 1987. They have not kept pace with growth in after-taxearnings, however, a fact that has contributed to the proportion of retired peopleat-risk-of-poverty growing steadily. Their relative living standards, however, arehigher than relative income alone would suggest as retired households typicallyhave lower financial commitments than other households.32 The Government isnow committed to increase social welfare pensions to at least d200 by 2007(Department of the Taoiseach, 2005).33 Given the higher at-risk-of-poverty ratesamong women in old age than men, it is also significant that a commitment hasbeen made to raise the Qualified Adult Allowance for pensioner spouses to thesame rate as the OANCP. A further significant support to the standard of living ofpensioners has been the incremental growth and extension of the ‘Free Schemes‘,some of which are more accurately termed ‘Household Benefits’.34 These servicesare provided to older people in Ireland to support their independent living andalleviate pressure on their money incomes. A significant addition was the extensionof the medical card to all people aged 70 or over in 2001. All people aged 70 or overhave entitlement to the full set regardless of income or who lives with them, whileaccess for retired people under 70 to the subset which constitute HouseholdBenefits is generally conditional on their living alone and on a low income.
Trying to ensure that more people will be entitled to the OACP when they retire hasbeen a significant policy objective for the principal reason that, not being means-tested, it has no disincentive effect on having other income sources in old age butfunctions as a platform on which people can build supplementary sources ofincome (from private pensions, property, financial assets and earnings). When anOACP is paid rather than an OANCP, it also means that some contribution at leasthas been made to its cost and that administration costs are lower.35 Table 3.2testifies to the growing role of the OACP and decline in that of the OANCP insetting a floor in pensioners’ incomes in Ireland.
By contrast to lower paid workers, it is primarily private occupational and personalpensions which offer other workers some prospect of a high replacement incomeand continuity of living standards in retirement. Taking out these pensionsremains wholly voluntary in Ireland. By 2004, some 40 per cent of employees aged20-69 in employment had an occupational pension only, 6.3 per cent had apersonal pension only and a further 7.7 per cent had both. This means that 54.4 percent of employees in employment had some form of tax-subsidised, privatepension. Among the self-employed, the figure was 43 per cent (by definition, allpersonal pensions) (Quarterly National Housing Survey [QNHS], 2004).
58
32. A significant number of households headed by retired people incur no rent or mortgage repayment (at that stage in life, morepeople are homeowners), have no expenses associated with employment or the rearing of children, and benefit from the householdbenefits package and ‘free schemes’ of the Department of Social and Family Affairs.
33. The National Pensions Policy Initiative Report (1998) recommendation was that they reach 34% of average industrial earnings over a 5-10 year period.
34. The Electricity or Natural Gas Allowance, Telephone Allowance and Free Television License.
35. A motivating reason behind the extension of PRSI to the self-employed was concern that significant numbers of self-employedpeople — then 20 per cent of the workforce — were becoming reliant on the means-tested pension when they retired.Contributing PRSI, even at a low rate, meant they were making a direct contribution to the support that would eventually beprovided them, as well as be free of means-testing in their retirement.
Since the early 1990s, the proportion of occupational pension schemes thatguarantee a pension whose level is uncertain and dependent on the return securedby the pension fund (defined contribution schemes) has been rising and theproportion guaranteeing a particular pension payment (defined benefit schemes)falling (Hughes, 2003). Contributing to an occupational pension is made attractiveby favourable tax treatment in Ireland as in other countries: contributions byindividuals and employers attract tax relief at the marginal rate, the investmentincome of the pension funds are tax exempt as are the once-off lump sum benefitspaid to individuals at the time of retirement. Only the pension income itself issubject to tax (on age exemptions in the income tax code see 3.7 below). The costof tax expenditures in support of occupational pensions has risen markedly overthe last 10 years. By 2002, they were considerably greater than social welfarespending on the Contributory and Non-Contributory pensions combined (d2.5bnas against d2.3bn). This constitutes a profound shift in the structure of the publicfunding of pensions. Analysis of the beneficiaries of these tax expenditures in1994 confirms their strongly regressive character: the top 20 per cent of thepopulation ranked by income received 60 per cent of the tax expenditures onemployee pension contributions; the value of tax relief alone to the top 10 per centof employees contributing to occupational pensions was, on average, significantlygreater than the value of most other people’s pension contributions and tax relief(Hughes, 2003).36
A personal pension is sometimes described as the third tier of pension cover,coming on top of a state welfare pension and an occupational pension. Theintroduction of Personal Retirement Savings Accounts (PRSAs) in 2002 is anattempt to meet the target set by the National Pensions Policy Initiative in 1998that 70 per cent of the workforce aged 30 or over should have some form of privatepension cover supplementary to their OACP. In 2004, an estimated 59 per cent ofthis group had such cover. Employers are legally obliged to facilitate theiremployees in having access and making their personal contributions to PRSAs, butare not obliged to contribute themselves. Accordingly as PRSAs are successful, taxexpenditures on pensions can be expected to rise further.
While Ireland’s welfare state is not currently under the same pressure as elsewherein the EU from population ageing and a rising bill for pensions, the pressure willinexorably come. The elderly dependency ratio (those aged 65 and over as apercentage of the population of working age) is set to rise from 20 per cent in 2002to 25 per cent by 2016 and to 50 per cent by 2050. This can be expected to putpressure on the level at which state welfare pensions are paid, the length of thecontributions record required for entitlement to a contributory pension, the rate ofPRSI levied to fund them, the age at which the pensions can first be drawn, and thevery concept of a mandatory retirement age. It should also lead to an in depthexamination of the cost and equity of tax expenditures on private pensions.It is commendable that a major element of pre-funding was introduced in 2000(see below).
Social Protection in Ireland:A Hybrid System 59
36. The top decile of employees with occupational pensions were putting aside an average of £35 a week for their future pensions in1994 (inclusive of tax relief); pensioners with no other means were then receiving £61 a week (the personal rate of the OANCP).[Hughes, 2003]
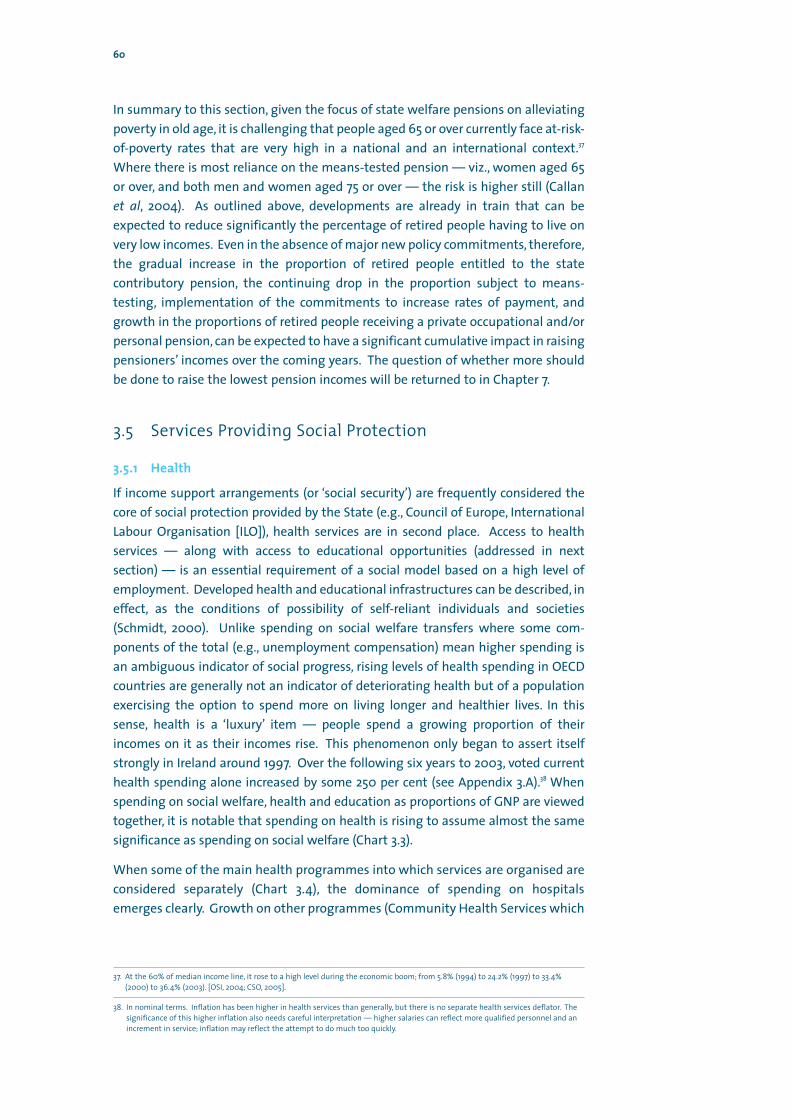
In summary to this section, given the focus of state welfare pensions on alleviatingpoverty in old age, it is challenging that people aged 65 or over currently face at-risk-of-poverty rates that are very high in a national and an international context.37
Where there is most reliance on the means-tested pension — viz., women aged 65or over, and both men and women aged 75 or over — the risk is higher still (Callanet al, 2004). As outlined above, developments are already in train that can beexpected to reduce significantly the percentage of retired people having to live onvery low incomes. Even in the absence of major new policy commitments, therefore,the gradual increase in the proportion of retired people entitled to the statecontributory pension, the continuing drop in the proportion subject to means-testing, implementation of the commitments to increase rates of payment, andgrowth in the proportions of retired people receiving a private occupational and/orpersonal pension, can be expected to have a significant cumulative impact in raisingpensioners’ incomes over the coming years. The question of whether more shouldbe done to raise the lowest pension incomes will be returned to in Chapter 7.
3.5 Services Providing Social Protection
3.5.1 Health
If income support arrangements (or ‘social security’) are frequently considered thecore of social protection provided by the State (e.g., Council of Europe, InternationalLabour Organisation [ILO]), health services are in second place. Access to healthservices — along with access to educational opportunities (addressed in nextsection) — is an essential requirement of a social model based on a high level ofemployment. Developed health and educational infrastructures can be described, ineffect, as the conditions of possibility of self-reliant individuals and societies(Schmidt, 2000). Unlike spending on social welfare transfers where some com-ponents of the total (e.g., unemployment compensation) mean higher spending isan ambiguous indicator of social progress, rising levels of health spending in OECDcountries are generally not an indicator of deteriorating health but of a populationexercising the option to spend more on living longer and healthier lives. In thissense, health is a ‘luxury’ item — people spend a growing proportion of theirincomes on it as their incomes rise. This phenomenon only began to assert itselfstrongly in Ireland around 1997. Over the following six years to 2003, voted currenthealth spending alone increased by some 250 per cent (see Appendix 3.A).38 Whenspending on social welfare, health and education as proportions of GNP are viewedtogether, it is notable that spending on health is rising to assume almost the samesignificance as spending on social welfare (Chart 3.3).
When some of the main health programmes into which services are organised areconsidered separately (Chart 3.4), the dominance of spending on hospitalsemerges clearly. Growth on other programmes (Community Health Services which
60
37. At the 60% of median income line, it rose to a high level during the economic boom; from 5.8% (1994) to 24.2% (1997) to 33.4%(2000) to 36.4% (2003). [OSI, 2004; CSO, 2005].
38. In nominal terms. Inflation has been higher in health services than generally, but there is no separate health services deflator. Thesignificance of this higher inflation also needs careful interpretation — higher salaries can reflect more qualified personnel and anincrement in service; inflation may reflect the attempt to do much too quickly.
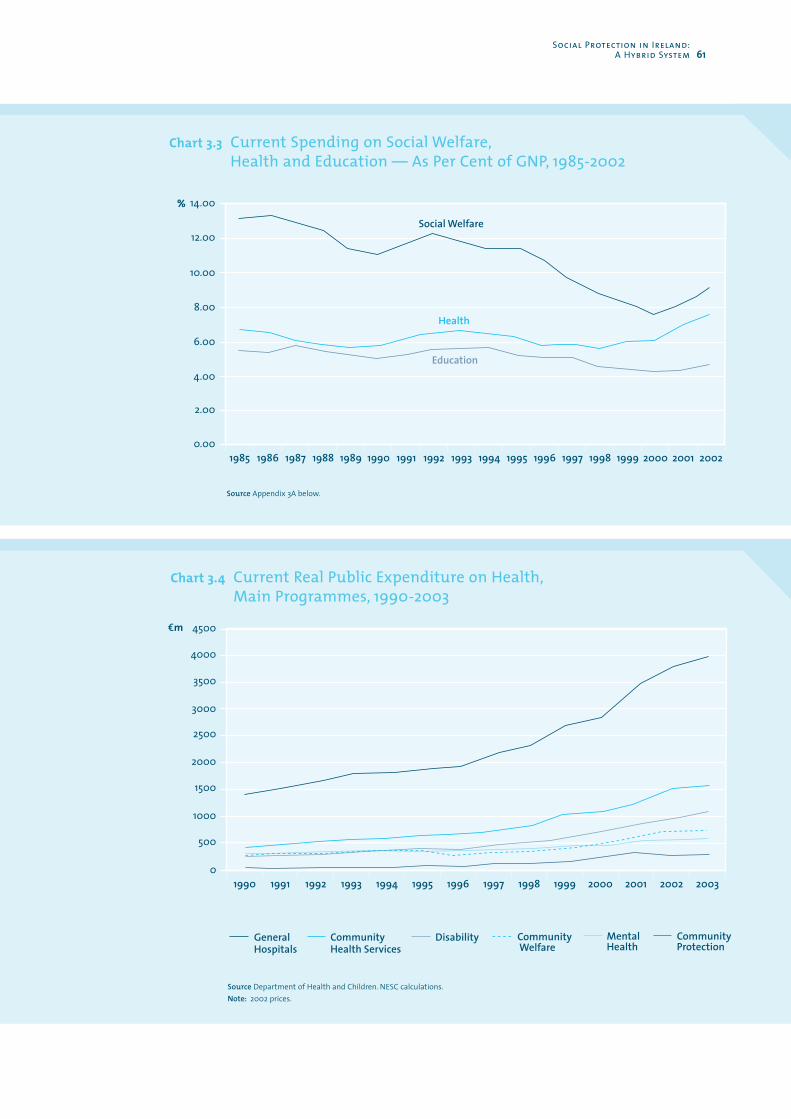
Social Protection in Ireland:A Hybrid System 61
Chart 3.3 Current Spending on Social Welfare,Health and Education — As Per Cent of GNP, 1985-2002
19860.00
1987 1988 1989 1990 1991 1992 1993 1994 1995 1996 1997 1998 1999 2000 2001 20021985
2.00
4.00
6.00
8.00
10.00
Social Welfare
%
12.00
14.00
Health
Education
Source Appendix 3A below.
Chart 3.4 Current Real Public Expenditure on Health,Main Programmes, 1990-2003
01990 1991 1992 1993 1994 1995 1996 1997 1998 1999 2000 2001 2002 2003
GeneralHospitals
CommunityHealth Services
Disability
em
500
1000
1500
2000
2500
3000
3500
4000
4500
Community Welfare
MentalHealth
CommunityProtection
Source Department of Health and Children. NESC calculations.Note: 2002 prices.
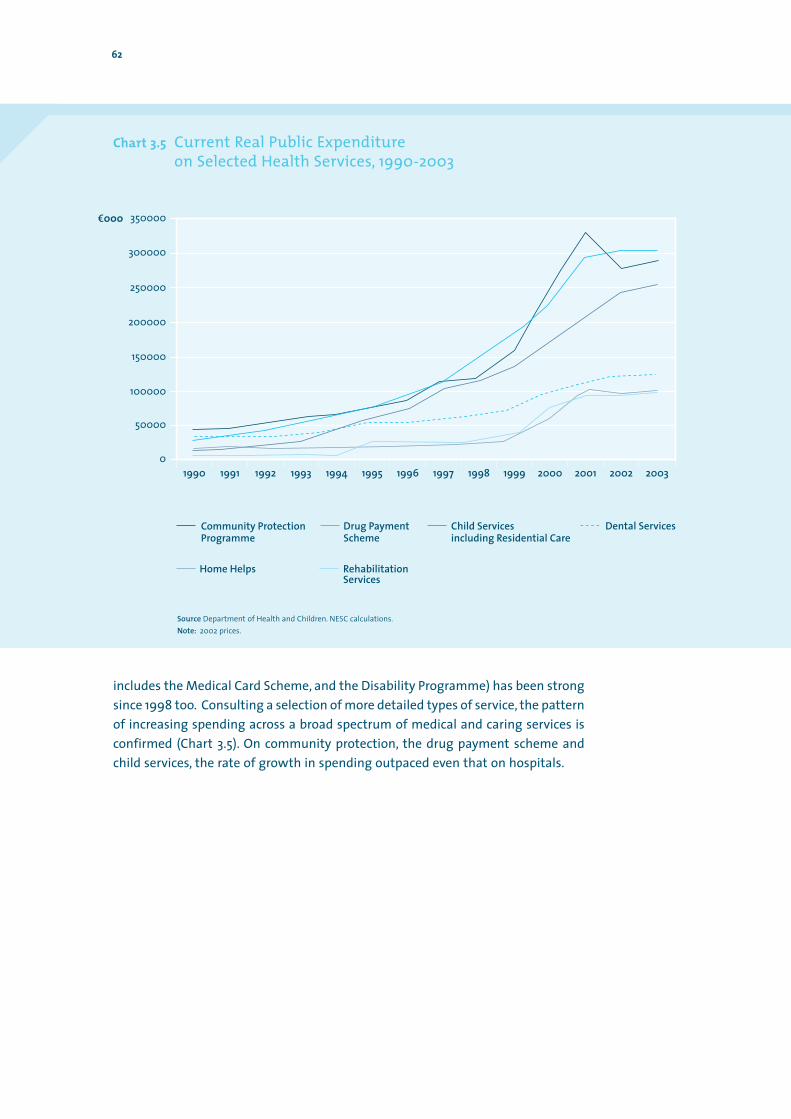
includes the Medical Card Scheme, and the Disability Programme) has been strongsince 1998 too. Consulting a selection of more detailed types of service, the patternof increasing spending across a broad spectrum of medical and caring services isconfirmed (Chart 3.5). On community protection, the drug payment scheme andchild services, the rate of growth in spending outpaced even that on hospitals.
62
Chart 3.5 Current Real Public Expenditure on Selected Health Services, 1990-2003
0
50000
100000
150000
200000
250000
e000
300000
350000
1990 1991 1992 1993 1994 1995 1996 1997 1998 1999 2000 2001 2002 2003
Community ProtectionProgramme
Drug PaymentScheme
Child Servicesincluding Residential Care
Dental Services
Home Helps RehabilitationServices
Source Department of Health and Children. NESC calculations.Note: 2002 prices.
Hospital Care
Hospitals provide the most visible universal health service in Ireland.39 Everyone‘ordinarily resident in the state’ can avail of medical care in the public wards ofhospitals, regardless of their income and independently of whether they haveprivate insurance or a medical card40. This cover was extended to the entirepopulation by the Health (Amendment Act), 1991 which also instituted a cap on themaximum that people with neither medical cards nor private insurance pay fortheir maintenance.41 Medical treatment in the Accident and Emergency Units ofhospitals is also free though a fee is charged for attendance without a doctor’sreferral note.42
The universal medical protection provided through public hospitals had thevolume of resources applied to it more than doubled over the seven-year period,1996-2003 (Chart 3.4). It, therefore, provides something of a test case as towhether and how additional resources can guarantee improved outcomes. Since1980, Irish hospitals have become increasingly busy. The same number ofinpatients is being served by a bed stock which has been reduced by one-third,while there has been a 37 per cent increase in outpatient activity and the volumeof hospital-based care provided on a day basis has increased nearly forty-fold.43
Attendance at A&E departments alone increased by 22 per cent between 1988 and2000, though the national population increased by only 7 per cent (DHC, 2002).Evidence that equity of access and the quality of patient care were deterioratingfor public patients in the face of this surge in demand was part of what promptedthe huge increase in public investment.
A number of studies have diagnosed a key fault in how the system is currentlyoperated, viz., the excessive reliance on junior doctors insufficiently supported byconsultants. Yet medical staffing arrangements did not change substantially asthe extra resources were deployed. To paraphrase one report:
Junior doctors continued to deliver most medical care, and their numberscontinued to rise without a clear plan for future workforce requirements.Services had to cope as best they could, relying on stopgap measures at locallevel. Patients continued to have limited access to consultants, and speedyaccess to senior clinical decision-making became increasingly difficult. Manyjunior doctors were not in recognised training programmes and their workwas dominated by service requirements with little regard to longer-termcareer development (Hanly, 2003: 41).
The necessary deep correction remained elusive and the larger volume of resourceswas put through a hospital system insufficiently altered. Though several studieshad called for a step improvement in the ratio of consultants to junior doctors, thelarge increase in public spending after 1996 saw a further deterioration in the ratio
Social Protection in Ireland:A Hybrid System 63
39. The most universal health services of all have a large element of invisibility to the ordinary person because they are public healthmeasures preventing the emergence or spread of infectious diseases, maintaining food hygiene and providing other preventativeservices, including immunisation of the total child population in the State. These are provided under the Community ProtectionProgramme of the Department of Health and Children and account for some 3 per cent of total public health spending.
40. An estimated 26 per cent of the population aged 18 and over had neither private health insurance or a medical card (QNHS, 2001).
41. Raised to c55 per hospital bed night for a maximum of 10 days in a year (Budget 2005).
42. Also raised to c55 in 2005. If the same complaint requires multiple visits, the charge is levied for the first attendance only).
43. Day cases refer to patients admitted to hospital for care and/or treatment but do require the use of a hospital bed overnight.
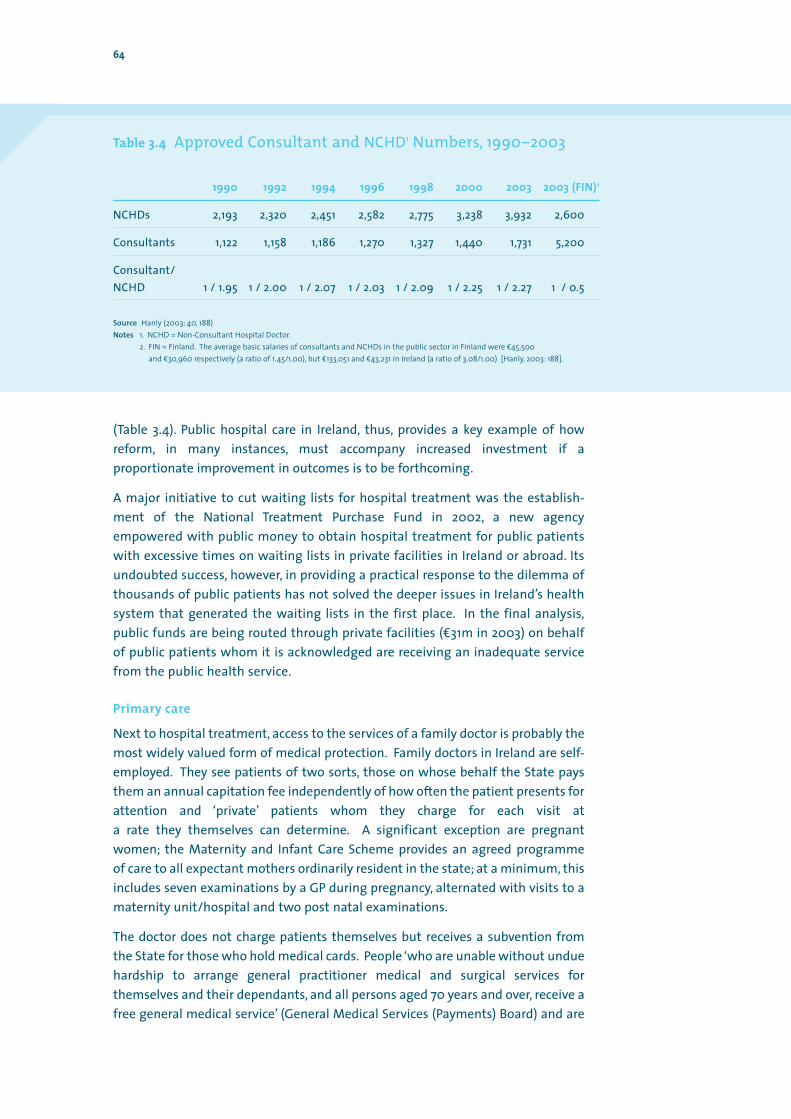
(Table 3.4). Public hospital care in Ireland, thus, provides a key example of howreform, in many instances, must accompany increased investment if aproportionate improvement in outcomes is to be forthcoming.
A major initiative to cut waiting lists for hospital treatment was the establish-ment of the National Treatment Purchase Fund in 2002, a new agencyempowered with public money to obtain hospital treatment for public patientswith excessive times on waiting lists in private facilities in Ireland or abroad. Itsundoubted success, however, in providing a practical response to the dilemma ofthousands of public patients has not solved the deeper issues in Ireland’s healthsystem that generated the waiting lists in the first place. In the final analysis,public funds are being routed through private facilities (d31m in 2003) on behalfof public patients whom it is acknowledged are receiving an inadequate servicefrom the public health service.
Primary care
Next to hospital treatment, access to the services of a family doctor is probably themost widely valued form of medical protection. Family doctors in Ireland are self-employed. They see patients of two sorts, those on whose behalf the State paysthem an annual capitation fee independently of how often the patient presents forattention and ‘private’ patients whom they charge for each visit ata rate they themselves can determine. A significant exception are pregnantwomen; the Maternity and Infant Care Scheme provides an agreed programme of care to all expectant mothers ordinarily resident in the state; at a minimum, thisincludes seven examinations by a GP during pregnancy, alternated with visits to amaternity unit/hospital and two post natal examinations.
The doctor does not charge patients themselves but receives a subvention fromthe State for those who hold medical cards. People ‘who are unable without unduehardship to arrange general practitioner medical and surgical services forthemselves and their dependants, and all persons aged 70 years and over, receive afree general medical service’ (General Medical Services (Payments) Board) and are
64
Table 3.4 Approved Consultant and NCHD1 Numbers, 1990–2003
1990 1992 1994 1996 1998 2000 2003 2003 (FIN)2
NCHDs 2,193 2,320 2,451 2,582 2,775 3,238 3,932 2,600
Consultants 1,122 1,158 1,186 1,270 1,327 1,440 1,731 5,200
Consultant/NCHD 1 / 1.95 1 / 2.00 1 / 2.07 1 / 2.03 1 / 2.09 1 / 2.25 1 / 2.27 1 / 0.5
Source Hanly (2003: 40, 188)Notes 1. NCHD = Non-Consultant Hospital Doctor.
2. FIN = Finland. The average basic salaries of consultants and NCHDs in the public sector in Finland were c45,500 and c30,960 respectively (a ratio of 1.45/1.00), but c133,051 and c43,231 in Ireland (a ratio of 3.08/1.00) [Hanly, 2003: 188].
issued medical cards. The inclusion of persons aged 70 or over began in 2001, butdoes not include their dependants. Otherwise, the identification of personseligible for the medical card is based on social welfare receipt or on falling belowan income guideline set by the government.44 They are then entitled to visit theirfamily doctor and pharmacist and receive prescribed drugs free of charge. Inaddition, they do not have to contribute to their maintenance in public wards ofhospitals, and receive free specialist out-patient services at public clinics, anddental, ophthalmic and aural services.
The medical card scheme was first introduced in 1972 and the proportion of thepopulation covered by it peaked soon after, at 39 per cent in 1997. By 2002, 29.4 percent of the total population had medical card cover and the cost of administeringthe scheme per eligible person was d679.45 The erosion of the percentage of thepopulation covered is mainly because the income guidelines have been adjustedover time with an eye to inflation but not to the rise in earnings (Health Statistics,2002). The extension of the medical card to older people regardless of incomepushed the proportion of the population up slightly (to 31.2 per cent), but the trenddecline reasserted itself thereafter. By employment status, the vast bulk of thepopulation now covered by the medical card are outside the labour force orunemployed members of it: 55 per cent of all people aged 18 or over who were noteconomically active had medical card cover in 2001 and 48 per cent of all peoplewho were unemployed, as against only 11 per cent of those in employment (QNHS,Third Quarter, 2001).
The differential rewards to family doctors of seeing patients — receiving an annualcapitation grant for someone who may not come to them at all during the year (amedical card holder) versus charging a fee per visit to someone else — hasproblematic aspects. At one extreme, the medical card-holder has no incentive toconsult the doctor only when necessary and is likely to consume a higher volumeof services than their health status justifies. At the other extreme, a low paidworker with children, may be deterred by the significant cost involved fromconsulting a doctor even where it is necessary. On the other side, the family doctorhas a large incentive to practice in areas where the number of medical card-holders is low and the likely pool of private patients high.46
The costs of medicines can impact on people much more than the cost ofconsulting a doctor. The Drugs Payment Scheme introduced in 1999 set a cap to themaximum that any individual or family must pay in a month for approved drugs,medicines or appliances for themselves or their families.47 The Long Term Illness
Social Protection in Ireland:A Hybrid System 65
44. By 2005, the income guidelines were a gross weekly income [net of PRSI and the Health Contribution] of c153.50 for a single personaged under 66 living alone and of c220 for a married couple. Further allowances for children, adult dependants without an income,some house expenses and travel to work expenses introduce a considerable element of discretion at the local (formerly HealthBoard) level where eligibility is determined.
45. General Medical Services (Payments) Board, report for year ended 31st December 2002. Excluding those aged over 70 newlyadmitted to the Scheme, just under 28 per cent of the population qualified for medical card cover in 2002.
46. Wren observes that, in 2002, the going rate for a visiting family doctor was between c40-c45, almost equivalent to the entireannual capitation grant the doctor received for an adult male medical card holder (c45.44) (Wren, 2002: 208).
47. Raised to c85 a month in 2005. To benefit from this scheme, a person must register themselves and their dependants with thehealth authorities; in 2002, 1,319,395 persons were registered and the net cost of the scheme per person was c148.50 and perclaimant c935.73.
66
Scheme means that persons suffering from one or more of a schedule of illnessesare entitled to obtain, free of charge and irrespective of their income, the drugs,medicines and appliances that they need.48
Caring services
Several forms of caring, some involving significant medical services and others not,constitute part of Ireland’s health budget. The public health authorities have, to asignificant extent, had to respond to the major diminution of families’ capacitiesto carry out unpaid caring for housebound and incapacitated members as thenumber of women remaining in the home has fallen sharply. The expansion ofpublicly funded caring has also been in response to a greater insistence by societyon the rights of children and of persons with disabilities and a concern that publicprovision for them should embody higher standards. The growing number ofelderly people living alone, many with the health and capacity to enjoy a widerange of activities if minimal supports are forthcoming, is also creating a strongdemand for new forms of domiciliary care and supports to facilitate ‘active ageing’.All these services have the significant added dimension that they enable people ofworking age more easily to reconcile employment with responsibility for ageingparents or other kin.
Overall, the two major influences on health spending are ageing and the expecta-tion of and demand for higher standards. For example, it is clear that older peopleuse hospitals more than younger people. In 2000, they had admission rates tohospital (per 1000 in their age group) much higher than younger people andaverage lengths of stay four times longer than people of active age (16-54) (DHC,2002). Estimates, in fact, suggest that the growing number of older people inIreland’s population alone will require a 14 per cent increase in the number of acutehospital beds over the period 2000 to 2011, while the generally rising demand forhealth care will add a further 11 per cent to the increase necessary. The factorsbehind a generally rising demand for health services can be summarised as:49
s Previously unmet need. Medical conditions that lower social groups, inparticularly their older members, and other people discouraged by lengthywaiting times and the expense of treatment ‘put up with’ is translated intodemand for heath services accordingly as the services improve;
s The availability of new services (technological advances in diagnosis andtreatment; the development of new services [e.g., magnetic resonanceimaging, non-invasive surgery, etc.]; the availability of new drugs andmedicines);
s Increasingly accessible health information through public bodies, the mediaand the internet;
s The increasing demand for the active treatment of chronic conditions;
48. In 2002, 92,754 persons were eligible under his scheme. The cost per eligible person was c677.73 and per claimaint c1,961.55.
49. See the multiple references in DHC (2002).
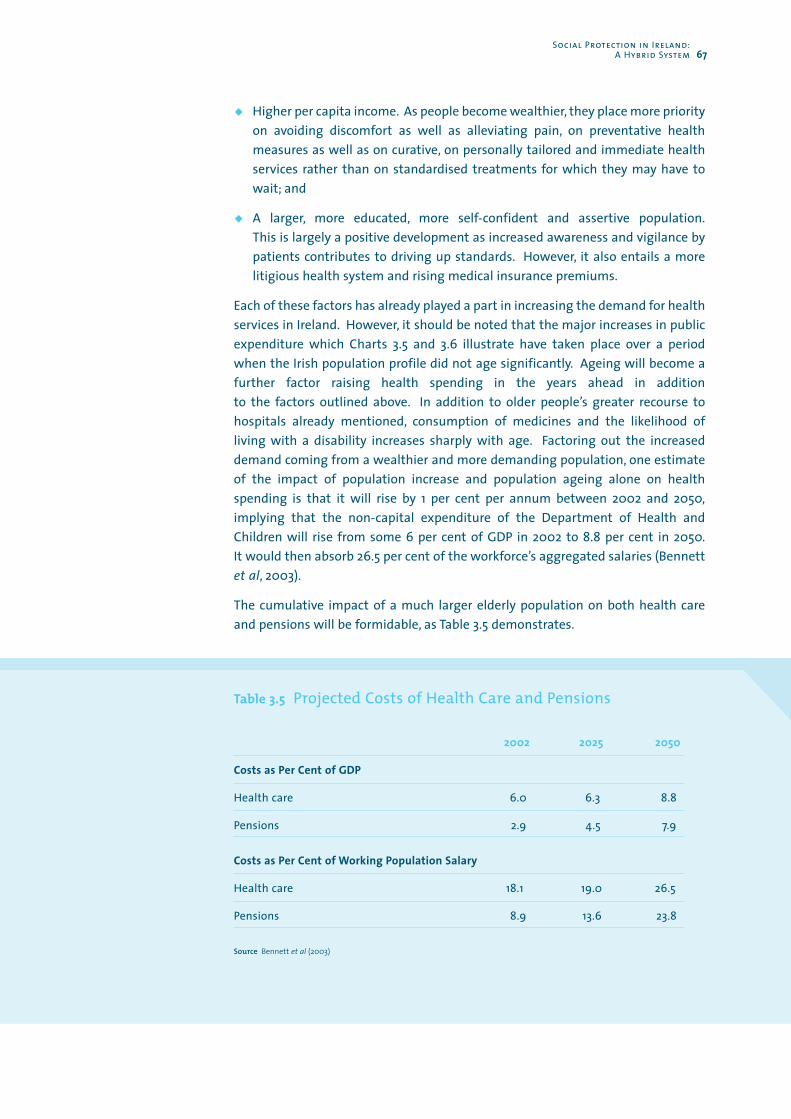
s Higher per capita income. As people become wealthier, they place more priorityon avoiding discomfort as well as alleviating pain, on preventative healthmeasures as well as on curative, on personally tailored and immediate healthservices rather than on standardised treatments for which they may have towait; and
s A larger, more educated, more self-confident and assertive population.This is largely a positive development as increased awareness and vigilance bypatients contributes to driving up standards. However, it also entails a morelitigious health system and rising medical insurance premiums.
Each of these factors has already played a part in increasing the demand for healthservices in Ireland. However, it should be noted that the major increases in publicexpenditure which Charts 3.5 and 3.6 illustrate have taken place over a periodwhen the Irish population profile did not age significantly. Ageing will become afurther factor raising health spending in the years ahead in addition to the factors outlined above. In addition to older people’s greater recourse tohospitals already mentioned, consumption of medicines and the likelihood ofliving with a disability increases sharply with age. Factoring out the increaseddemand coming from a wealthier and more demanding population, one estimateof the impact of population increase and population ageing alone on healthspending is that it will rise by 1 per cent per annum between 2002 and 2050,implying that the non-capital expenditure of the Department of Health andChildren will rise from some 6 per cent of GDP in 2002 to 8.8 per cent in 2050.It would then absorb 26.5 per cent of the workforce’s aggregated salaries (Bennettet al, 2003).
The cumulative impact of a much larger elderly population on both health careand pensions will be formidable, as Table 3.5 demonstrates.
Social Protection in Ireland:A Hybrid System 67
Table 3.5 Projected Costs of Health Care and Pensions
2002 2025 2050
Costs as Per Cent of GDP
Health care 6.0 6.3 8.8
Pensions 2.9 4.5 7.9
Costs as Per Cent of Working Population Salary
Health care 18.1 19.0 26.5
Pensions 8.9 13.6 23.8
Source Bennett et al (2003)
These projections are based on several assumptions which only the future can testfor accuracy. For example, it is becoming apparent that the degree of usage ofhealth services by people aged, for example, 66-74 today may prove to be a poorguide to the level of usage by people aged 66-74 in the future (Seshamani, 2004).As people live longer, they are also living healthier. A large part of older persons’usage of health services is concentrated in their final years and, if this patternholds into the future, then the age to which they live will be less significant forhealth spending than the range and sophistication of the health services thatattend them in their final years.5o It is also the case that if a growing proportion ofpeople aged over 65 in the future remain in employment because their healthallows them to and they want to (pension policy could be redesigned to providethem with a higher pension in return for postponing their entitlement), then thecurrent estimates of future pensions costs as a percentage of GDP will prove tohave been on the high side.
As illustrated above, current public spending on health has soared since 1997.There has been extensive dismay that user’s experience of public health services(e.g., public patients’ waiting times for elective surgery and other treatments,conditions in A&E casualty departments, conditions within hospitals, the level ofcharges, instances of medical malpractice, etc.) has not only not improved in linewith the rise in spending but, in key instances, deteriorated. In 2005, what isdescribed as the ‘biggest change process ever undertaken in the state’ (HealthServices Executive, HSE, 2004) got underway in the health services which are to bemanaged, for the first time, as a single national system. An evaluation of theextent to which reform and additional resources have proceeded sufficiently intandem must wait for some years. It is clear that the effective and efficientdevelopment of a major part of Ireland’s welfare state is at stake and, with it, to asignificant degree, public confidence in public services generally.
3.5.2 Education
As a share of GNP, current public expenditure on education over the period, 1985-2002, has trended downwards from a high of 5.8 per cent in 1987 to 4.6 per cent in2002 (Chart 3.3 above). When the absolute level of spending is distinguished bythe level of the educational system where it is incurred, it has more than doubledat primary and secondary levels and tripled at third level (Chart 3.6). There havebeen markedly different developments in the number of students at each level;it has fallen significantly at primary level, increased marginally at second level andrisen rapidly at third level. The net result is that spending per student has increasedby a multiple of 2.8 at primary level, 2 at secondary level and 1.3 at third levelbetween 1985 and 2002 (Table 3.6 and Chart 3.7).
68
50. It is even possible that, as the very old (in excess of 85 or 90 years) have less capacity to put up a long fight against new illnessesthat interrupt their otherwise good health, the coming older generation may consume less health costs in their final months thanthe current older generation. The new Population Directorate in the Health Services Executive is to acquire the expertise andcompetence to improve Ireland’s ability to anticipate these types of development.
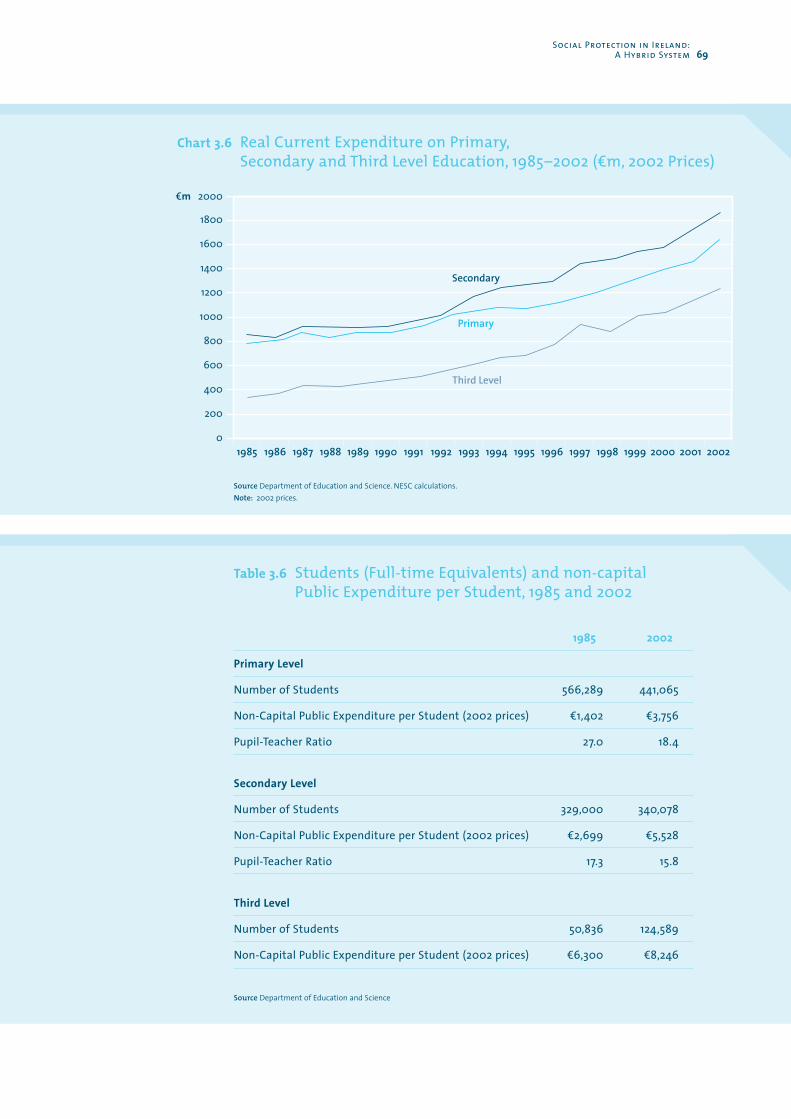
Social Protection in Ireland:A Hybrid System 69
Chart 3.6 Real Current Expenditure on Primary,Secondary and Third Level Education, 1985–2002 (dm, 2002 Prices)
19860
1987 1988 1989 1990 1991 1992 1993 1994 1995 1996 1997 1998 1999 2000 2001 20021985
Secondary
Primary
Third Level
200
400
600
800
1000
1200
1400
1600
1800
2000em
Table 3.6 Students (Full-time Equivalents) and non-capital Public Expenditure per Student, 1985 and 2002
1985 2002
Primary Level
Number of Students 566,289 441,065
Non-Capital Public Expenditure per Student (2002 prices) d1,402 d3,756
Pupil-Teacher Ratio 27.0 18.4
Secondary Level
Number of Students 329,000 340,078
Non-Capital Public Expenditure per Student (2002 prices) d2,699 d5,528
Pupil-Teacher Ratio 17.3 15.8
Third Level
Number of Students 50,836 124,589
Non-Capital Public Expenditure per Student (2002 prices) d6,300 d8,246
Source Department of Education and Science
Source Department of Education and Science. NESC calculations.Note: 2002 prices.
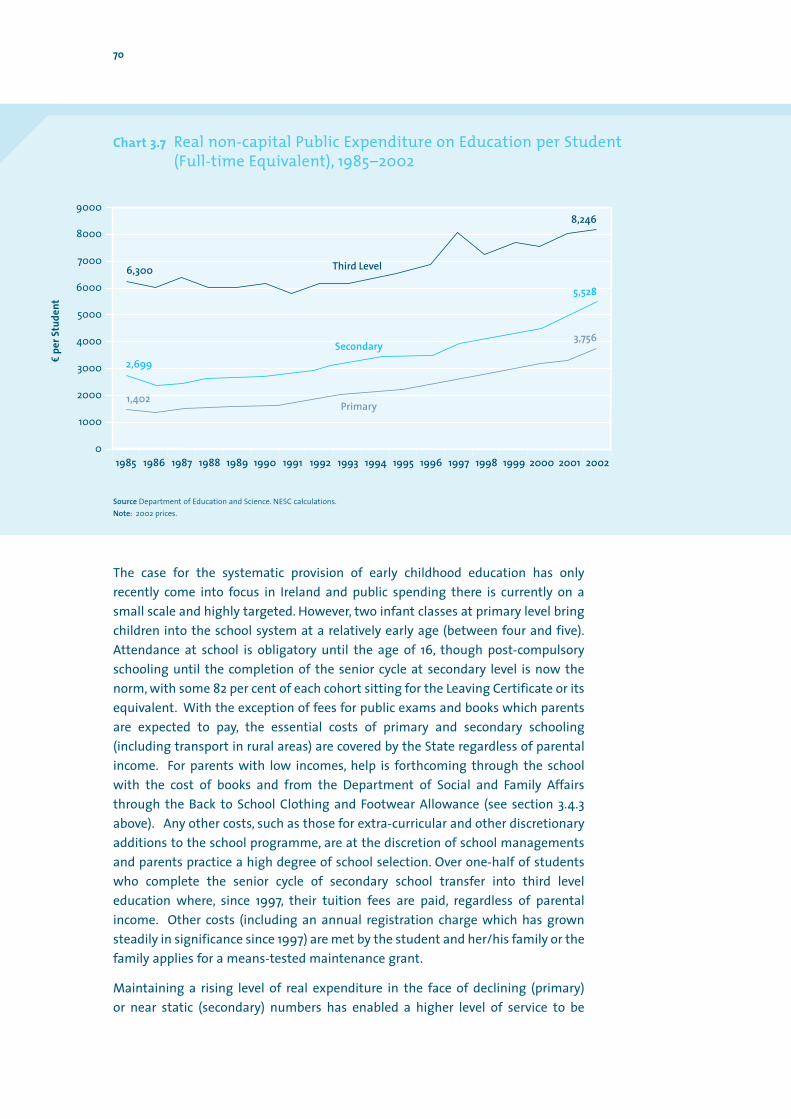
The case for the systematic provision of early childhood education has onlyrecently come into focus in Ireland and public spending there is currently on asmall scale and highly targeted. However, two infant classes at primary level bringchildren into the school system at a relatively early age (between four and five).Attendance at school is obligatory until the age of 16, though post-compulsoryschooling until the completion of the senior cycle at secondary level is now thenorm, with some 82 per cent of each cohort sitting for the Leaving Certificate or itsequivalent. With the exception of fees for public exams and books which parentsare expected to pay, the essential costs of primary and secondary schooling(including transport in rural areas) are covered by the State regardless of parentalincome. For parents with low incomes, help is forthcoming through the schoolwith the cost of books and from the Department of Social and Family Affairsthrough the Back to School Clothing and Footwear Allowance (see section 3.4.3above). Any other costs, such as those for extra-curricular and other discretionaryadditions to the school programme, are at the discretion of school managementsand parents practice a high degree of school selection. Over one-half of studentswho complete the senior cycle of secondary school transfer into third leveleducation where, since 1997, their tuition fees are paid, regardless of parentalincome. Other costs (including an annual registration charge which has grownsteadily in significance since 1997) are met by the student and her/his family or thefamily applies for a means-tested maintenance grant.
Maintaining a rising level of real expenditure in the face of declining (primary) or near static (secondary) numbers has enabled a higher level of service to be
70
Chart 3.7 Real non-capital Public Expenditure on Education per Student(Full-time Equivalent), 1985–2002
19860
1987 1988 1989 1990 1991 1992 1993 1994 1995 1996 1997 1998 1999 2000 2001 20021985
Third Level
Secondary
Primary
e pe
r Stu
dent
1000
2000
3000
4000
5000
6000
7000
8000
90008,246
5,528
3,756
6,300
2,699
1,402
Source Department of Education and Science. NESC calculations.Note: 2002 prices.
provided in primary and secondary schools (for example, the pupil-teacher ratiohas been cut by 32 and 9 per cent respectively between 1985 and 2002, Table 3.6).Special measures have multiplied to combat educational under-performance andreduce school absences and early school leaving. New cadres of support teachersand assistants are present throughout the school system to help children/youthwith particular learning difficulties (see the educational items chosen for inclusionin Table 3.1). However, there is clear evidence that some schools at both primaryand secondary level struggle with particularly disadvantaged social intakes andare not succeeding in stemming, let alone closing, the gap between their students’achievements and those of more socially advantaged ones (Eiveas, Shiel andShortt, 2004; ERC, 2004; Morgan, 2000.)
There is even less evidence of a substantial improvement in the quality of thirdlevel where the growth in student numbers has been large. There is widespreadagreement that funding to third level institutes has not kept pace with their needsbut disagreement as to how the extra funding that will have to be forthcomingshould be split between seeking contributions from the direct beneficiaries ofthird level tuition (students themselves) and third level research (the privatesector), on the one hand, and the Exchequer, on the other. A core objective withmajor implications for the State’s educational budget remains opaque, viz., theproportion of the cohort completing secondary school who should transfer to thirdlevel. It is clear that equity of access is a desirable objective (and Table 3.1 includedcosts in pursuit of this as a part of social protection) but not clear that choosingnot to progress after completing secondary level should be viewed as failure (asnot completing the senior cycle of secondary schooling effectively is). The validityof alternative paths to adult self-reliance and labour market integration at thatstage in the life cycle are not lessened by the advent of the knowledge economyand learning society.
There is also an awareness that two major new educational challenges arechallenging educational institutions to look to hitherto neglected constituencies.The provision of early childhood education and of adult education (both secondchance education and continuing education) are far behind what the country willrequire if it is to deliver on core social and economic objectives. Each type does notyet have strong institutions to make its case but should, nevertheless, enter theequation as a factor likely to significantly influence the level of public spending oneducation in the future. It has been argued, for example, that any likely savings onyoung people’s ordinary schooling as youth numbers fall will be offset as publicpolicy interests in raising the educational participation rates of people fromsocially disadvantaged backgrounds and of older age groups are implemented(Barrett, 2003).
3.5. 3 Housing
Current public spending on housing services is a relatively small figure (estimatedat d125m in 2002, between subsidised local authority accommodation, rentalsubsidies for voluntary housing and measures for the homeless and travellers,Table 3.1). Twice as much was spent on a cash transfer, the Supplementary WelfareRent Allowance, which operates as a type of housing benefit for those who are inthe private rented sector (d252m in 2002 on behalf of 54,213 persons).
Social Protection in Ireland:A Hybrid System 71
72
Approximately 104,700 households were being provided with local authorityhousing in 2002 by satisfying a means-test and other criteria establishing theirneed and inability to procure housing through the market.51 With an average of 3.3persons per household (ERSI, 2003), this implies that almost 9 per cent of thepopulation were being housed in this way. This housing is not free. A differentialrent system sets rents at 15 per cent of households’ eligible income with variationin what is deemed eligible income taking place across local authorities subject toDepartmental guidelines. Estimates of the average rent paid in 2002 vary widely(d42.46 Census; d26.33 Housing Statistics Bulletin) but, compared to existing rentsin the private sector (d125.68 unfurnished), it is clear that local authority tenantsenjoy a huge subsidy to their housing. Leaving aside the cost of capital, localauthorities in 2001 were charging rents that covered some 70 per cent of the costof maintaining and managing their housing stock.52
The rapid escalation in the market price of houses and market rents since the mid-1990s has increased the need for more State intervention in ensuring access tosatisfactory accommodation. This has largely been exercised through the publiccapital programme (see below) and by providing income supports to assist peoplewith rents or mortgages, rather than by an expansion of local authorities’ role aslandlords (which is where a public housing service exists in its purest form).
3.5.4 Active Labour Market Policies
Services whose objectives include helping disadvantaged job-seekers improvetheir labour market skills and/or gain fairer or preferential access to employmentare an important part of social protection. Spurred by the high unemployment ofthe 1980s, Ireland developed a wide array of active labour market programmes(ALMPs) which provided, variously, general training, specific skills training, directemployment of a tailored sort, employment subsidies and assistance with jobsearch (Indecon, 2002). The principal public bodies involved have been FÁS and itsparent department, Enterprise, Trade and Employment, but significant roles alsodeveloped for the Department of Social and Family Affairs, the Department ofEducation and Science and a minor role for the Revenue Commissioners (JobAssist). In addition, the Community and Voluntary sector became an importantactor, activating many services and working closely with FÁS. In conventionalmeasures of what constitutes public spending on ALMPs, Ireland has tended toemerge as a high spender in international comparisons ( OECD, 2004).
Several ALMPs sought to generate the ‘double dividend’ of creating meaningfulwork experience and training for unemployed people with the provision of neededservices at the local level. The largest of those programmes continues to be theCommunity Employment Scheme, which a wide variety of organisations — publicor voluntary and community — have activated since its establishment. By thebeginning of the 1990s, a network of area-based partnerships to tackle unemploy-ment through a community development as much as a labour market approachhad developed, and the Public Employment Service (FAS) now works in partnershipwith them aided by a Local Employment Service structured at the local level.
51. Housing Statistics Bulletin, September 2002.
52. Housing Statistics Bulletin, March 2003.
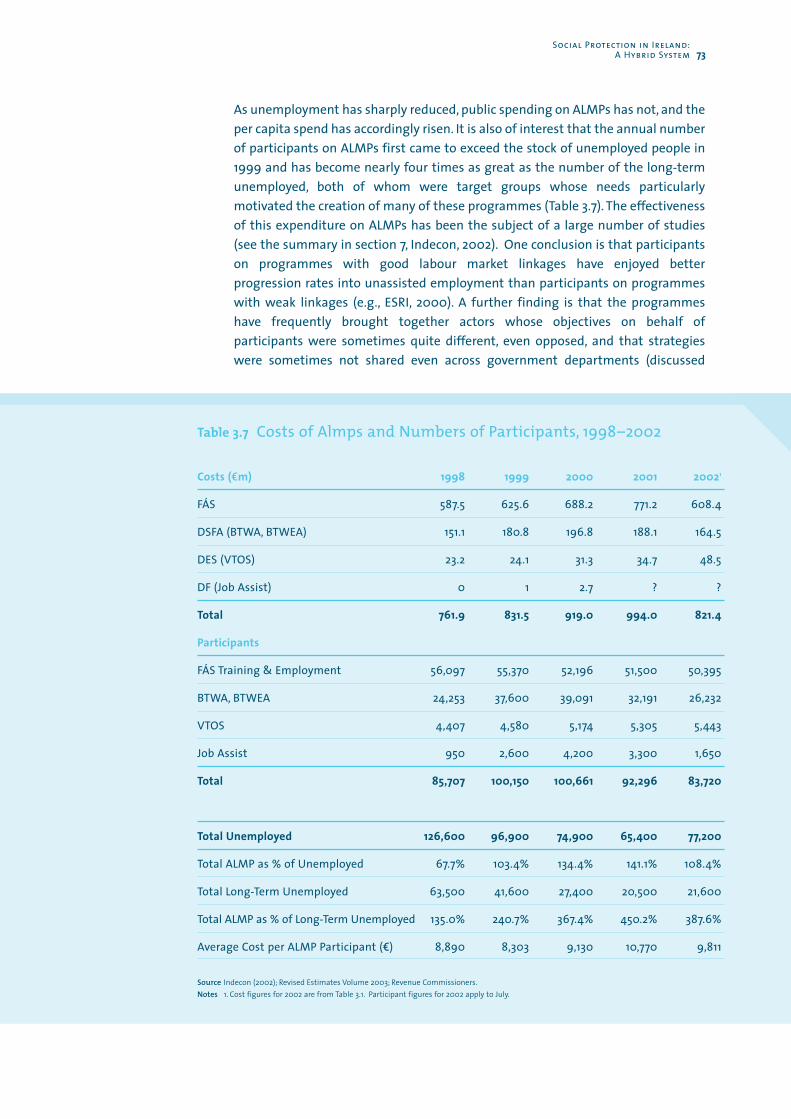
As unemployment has sharply reduced, public spending on ALMPs has not, and theper capita spend has accordingly risen. It is also of interest that the annual numberof participants on ALMPs first came to exceed the stock of unemployed people in1999 and has become nearly four times as great as the number of the long-termunemployed, both of whom were target groups whose needs particularlymotivated the creation of many of these programmes (Table 3.7). The effectivenessof this expenditure on ALMPs has been the subject of a large number of studies(see the summary in section 7, Indecon, 2002). One conclusion is that participantson programmes with good labour market linkages have enjoyed betterprogression rates into unassisted employment than participants on programmeswith weak linkages (e.g., ESRI, 2000). A further finding is that the programmeshave frequently brought together actors whose objectives on behalf ofparticipants were sometimes quite different, even opposed, and that strategieswere sometimes not shared even across government departments (discussed
Social Protection in Ireland:A Hybrid System 73
Table 3.7 Costs of Almps and Numbers of Participants, 1998–2002
Costs (em) 1998 1999 2000 2001 20021
FÁS 587.5 625.6 688.2 771.2 608.4
DSFA (BTWA, BTWEA) 151.1 180.8 196.8 188.1 164.5
DES (VTOS) 23.2 24.1 31.3 34.7 48.5
DF (Job Assist) 0 1 2.7 ? ?
Total 761.9 831.5 919.0 994.0 821.4
Participants
FÁS Training & Employment 56,097 55,370 52,196 51,500 50,395
BTWA, BTWEA 24,253 37,600 39,091 32,191 26,232
VTOS 4,407 4,580 5,174 5,305 5,443
Job Assist 950 2,600 4,200 3,300 1,650
Total 85,707 100,150 100,661 92,296 83,720
Total Unemployed 126,600 96,900 74,900 65,400 77,200
Total ALMP as % of Unemployed 67.7% 103.4% 134.4% 141.1% 108.4%
Total Long-Term Unemployed 63,500 41,600 27,400 20,500 21,600
Total ALMP as % of Long-Term Unemployed 135.0% 240.7% 367.4% 450.2% 387.6%
Average Cost per ALMP Participant (e) 8,890 8,303 9,130 10,770 9,811
Source Indecon (2002); Revised Estimates Volume 2003; Revenue Commissioners.Notes 1. Cost figures for 2002 are from Table 3.1. Participant figures for 2002 apply to July.
more in Chapter 6). There is also concern that using age or duration of welfarereceipt to determine eligibility in a bid to target programmes more effectively has produced perverse incentives. If a programme is considered attractive,the individual has an incentive to ‘wait’ until attaining the age or duration ofwelfare receipt that determines eligibility even though work habits and skillsthereby deteriorate further. (In the case of educational programmes with only anannual September enrolment, the ‘wait’ to attain a 6-months threshold could be of16 months.)
Major points of discussion currently surround aspects of their future development.It is proving particularly difficult, for example, to find agreement on how the scaleand nature of the Community Employment Programme should be adjusted to thenew circumstances of a near full-employment economy. There is also concern thatthe multiplicity and overlap of the programmes has made their evaluation difficultif not impossible. The working relationships and allocation of responsibilitiesbetween the local offices of centralised public agencies and autonomous localorganisations is frequently unsatisfactory. It is not always clear where respon-sibility lies if injections of public resources into a local area over a sustained periodare not seen to be having a significant impact in reducing the need for which theywere made available in the first place.
Looking to the future demand these programmes might make on public funds, it isclear that rather than an inexorable growth (as with pensions or health care)savings could be anticipated. The strategic policy issue may be the extent to whichthe client groups for these services should continue to be widened to includesteadily more of the people of working age in receipt of welfare and the relatedissue as to whether the opportunity of low unemployment should be seized tooccasion a step improvement in the quality of ALMPs.
3.5.5 Social Inclusion
A wide range of services have been developed in Ireland which share the objectiveof procuring the social inclusion of, variously, individuals, families, social groupsand local communities who run particular risks of social exclusion. A significantnumber of publicly assisted bodies have been created since 1986 engaging inadvocacy and/or providing services that are exclusive to identified client groups orpotentially available to anyone in the population (see Appendix 3.C, The GrowingComplexity of Ireland’s Social Policy Institutional Framework). A major proceduralinnovation involving many of these bodies is the National Anti-Poverty Strategy,adopted in 1997 for a ten-year period and revised in 2002; it has entailed thedevelopment of new structures within and across government departments —principally a Cabinet Sub-Committee, an Inter-Departmental Working Group and,in 2002, the National Office of Social Inclusion — to give coherence and impetus tothe Strategy.
The onset of a drugs problem also stimulated a programme structured aroundservices provided within, and by, local communities (the Local Drugs Task Forces),while the Department of Social and Family Affairs has developed a strongcommunity programme through which family supports, money and budgetingadvice, and other services are provided. The Department of Education and Science
74
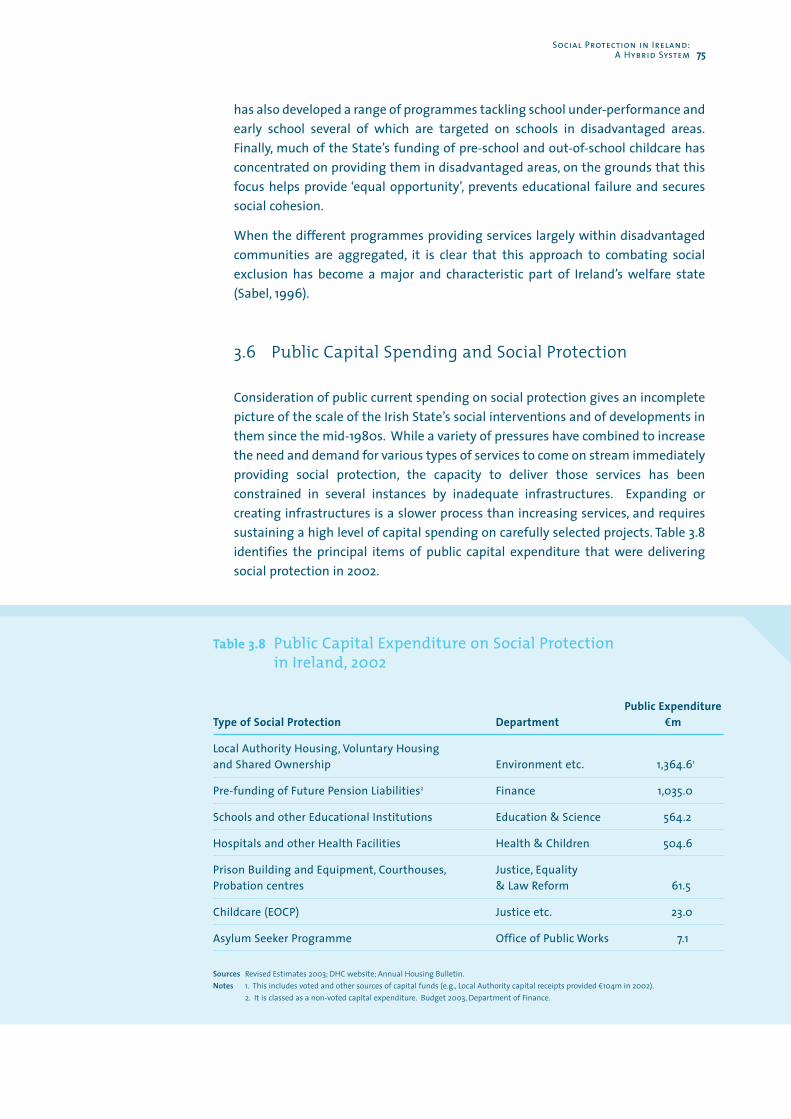
has also developed a range of programmes tackling school under-performance andearly school several of which are targeted on schools in disadvantaged areas.Finally, much of the State’s funding of pre-school and out-of-school childcare hasconcentrated on providing them in disadvantaged areas, on the grounds that thisfocus helps provide ‘equal opportunity’, prevents educational failure and securessocial cohesion.
When the different programmes providing services largely within disadvantagedcommunities are aggregated, it is clear that this approach to combating socialexclusion has become a major and characteristic part of Ireland’s welfare state(Sabel, 1996).
3.6 Public Capital Spending and Social Protection
Consideration of public current spending on social protection gives an incompletepicture of the scale of the Irish State’s social interventions and of developments inthem since the mid-1980s. While a variety of pressures have combined to increasethe need and demand for various types of services to come on stream immediatelyproviding social protection, the capacity to deliver those services has beenconstrained in several instances by inadequate infrastructures. Expanding orcreating infrastructures is a slower process than increasing services, and requiressustaining a high level of capital spending on carefully selected projects. Table 3.8identifies the principal items of public capital expenditure that were deliveringsocial protection in 2002.
Social Protection in Ireland:A Hybrid System 75
Table 3.8 Public Capital Expenditure on Social Protection in Ireland, 2002
Public Expenditure Type of Social Protection Department em
Local Authority Housing, Voluntary Housing and Shared Ownership Environment etc. 1,364.61
Pre-funding of Future Pension Liabilities2 Finance 1,035.0
Schools and other Educational Institutions Education & Science 564.2
Hospitals and other Health Facilities Health & Children 504.6
Prison Building and Equipment, Courthouses, Justice, EqualityProbation centres & Law Reform 61.5
Childcare (EOCP) Justice etc. 23.0
Asylum Seeker Programme Office of Public Works 7.1
Sources Revised Estimates 2003; DHC website; Annual Housing Bulletin.Notes 1. This includes voted and other sources of capital funds (e.g., Local Authority capital receipts provided c104m in 2002).
2. It is classed as a non-voted capital expenditure. Budget 2003, Department of Finance.
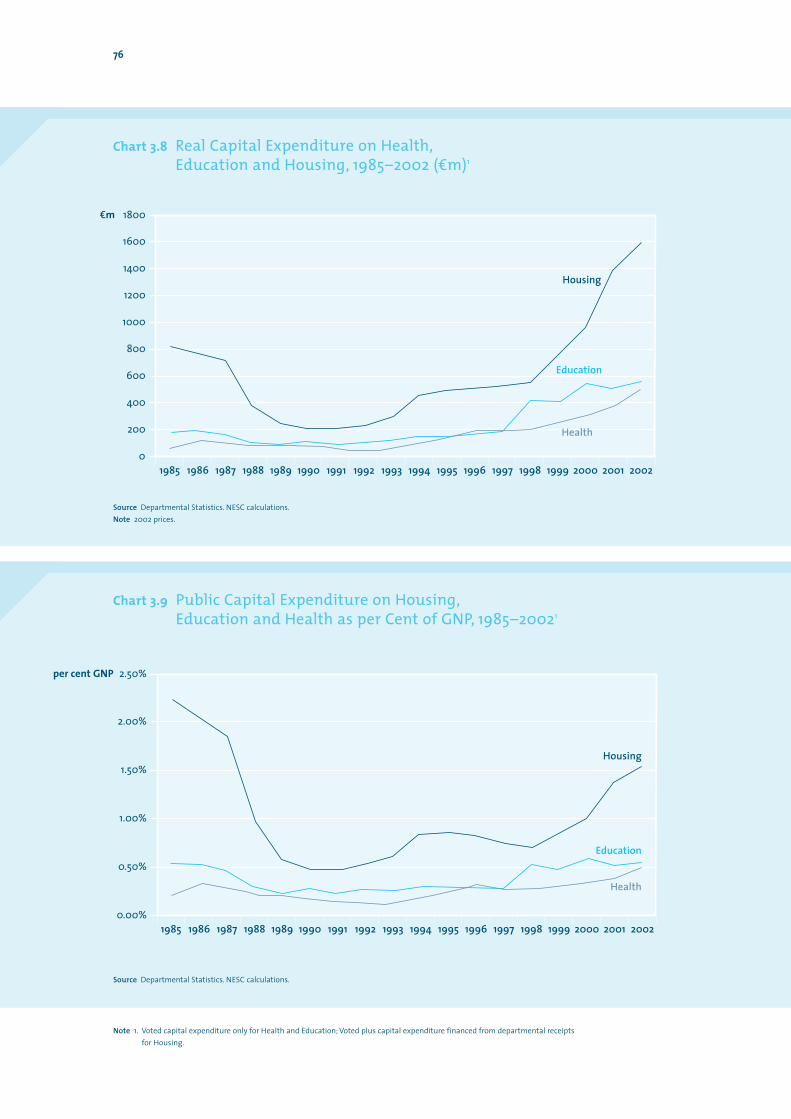
76
Chart 3.8 Real Capital Expenditure on Health,Education and Housing, 1985–2002 (dm)1
19860
1987 1988 1989 1990 1991 1992 1993 1994 1995 1996 1997 1998 1999 2000 2001 20021985
Housing
Education
Health200
400
600
800
1000
1200
1400
1600
1800em
Chart 3.9 Public Capital Expenditure on Housing,Education and Health as per Cent of GNP, 1985–20021
19860.00%
1987 1988 1989 1990 1991 1992 1993 1994 1995 1996 1997 1998 1999 2000 2001 20021985
Housing
Education
Health
per cent GNP
0.50%
1.00%
1.50%
2.00%
2.50%
Note 1. Voted capital expenditure only for Health and Education; Voted plus capital expenditure financed from departmental receipts for Housing.
Source Departmental Statistics. NESC calculations.
Source Departmental Statistics. NESC calculations.Note 2002 prices.
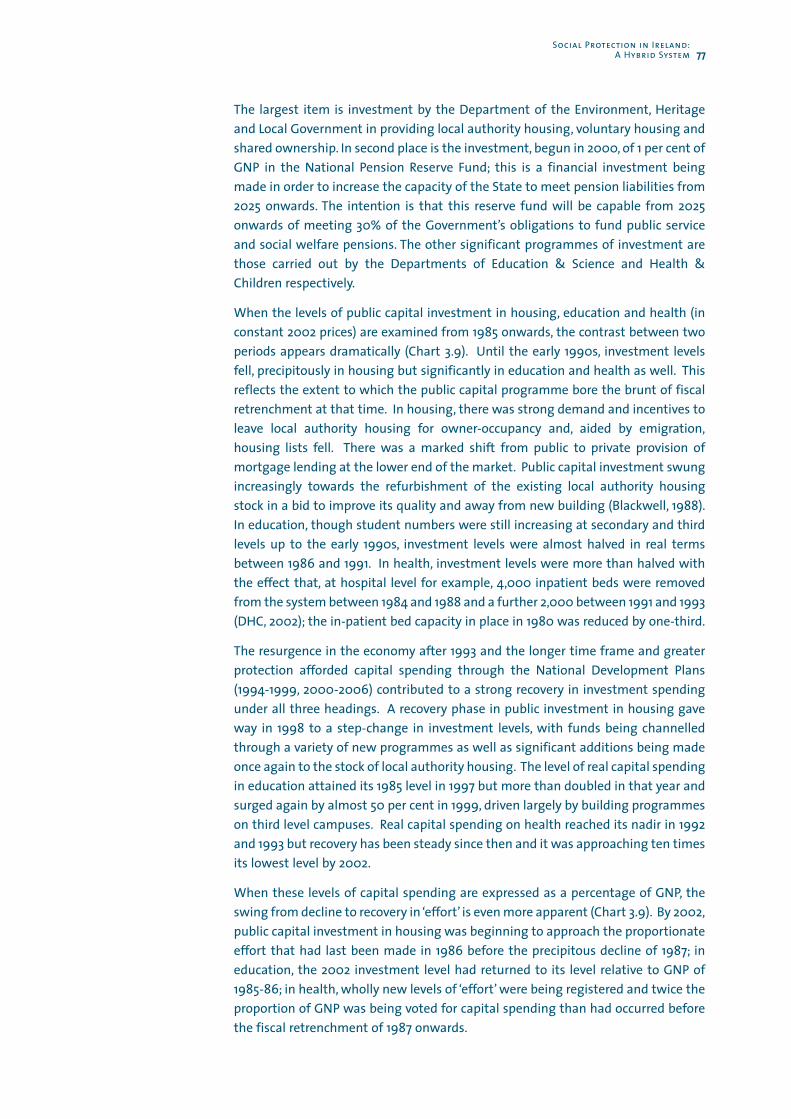
The largest item is investment by the Department of the Environment, Heritageand Local Government in providing local authority housing, voluntary housing andshared ownership. In second place is the investment, begun in 2000, of 1 per cent ofGNP in the National Pension Reserve Fund; this is a financial investment beingmade in order to increase the capacity of the State to meet pension liabilities from2025 onwards. The intention is that this reserve fund will be capable from 2025onwards of meeting 30% of the Government’s obligations to fund public serviceand social welfare pensions. The other significant programmes of investment arethose carried out by the Departments of Education & Science and Health &Children respectively.
When the levels of public capital investment in housing, education and health (inconstant 2002 prices) are examined from 1985 onwards, the contrast between twoperiods appears dramatically (Chart 3.9). Until the early 1990s, investment levelsfell, precipitously in housing but significantly in education and health as well. Thisreflects the extent to which the public capital programme bore the brunt of fiscalretrenchment at that time. In housing, there was strong demand and incentives toleave local authority housing for owner-occupancy and, aided by emigration,housing lists fell. There was a marked shift from public to private provision ofmortgage lending at the lower end of the market. Public capital investment swungincreasingly towards the refurbishment of the existing local authority housingstock in a bid to improve its quality and away from new building (Blackwell, 1988).In education, though student numbers were still increasing at secondary and thirdlevels up to the early 1990s, investment levels were almost halved in real termsbetween 1986 and 1991. In health, investment levels were more than halved withthe effect that, at hospital level for example, 4,000 inpatient beds were removedfrom the system between 1984 and 1988 and a further 2,000 between 1991 and 1993(DHC, 2002); the in-patient bed capacity in place in 1980 was reduced by one-third.
The resurgence in the economy after 1993 and the longer time frame and greaterprotection afforded capital spending through the National Development Plans(1994-1999, 2000-2006) contributed to a strong recovery in investment spendingunder all three headings. A recovery phase in public investment in housing gaveway in 1998 to a step-change in investment levels, with funds being channelledthrough a variety of new programmes as well as significant additions being madeonce again to the stock of local authority housing. The level of real capital spendingin education attained its 1985 level in 1997 but more than doubled in that year andsurged again by almost 50 per cent in 1999, driven largely by building programmeson third level campuses. Real capital spending on health reached its nadir in 1992and 1993 but recovery has been steady since then and it was approaching ten timesits lowest level by 2002.
When these levels of capital spending are expressed as a percentage of GNP, theswing from decline to recovery in ‘effort’ is even more apparent (Chart 3.9). By 2002,public capital investment in housing was beginning to approach the proportionateeffort that had last been made in 1986 before the precipitous decline of 1987; ineducation, the 2002 investment level had returned to its level relative to GNP of1985-86; in health, wholly new levels of ‘effort’ were being registered and twice theproportion of GNP was being voted for capital spending than had occurred beforethe fiscal retrenchment of 1987 onwards.
Social Protection in Ireland:A Hybrid System 77
3.7 Tax And Social Protection
Fundamental changes to Ireland’s taxation system have accompanied its strongeconomic performance since the early 1990s. As a proportion of GNP, the total taxtake declined from 40 per cent in 1986 to 33.7 per cent in 2002.53 Ireland’s lowcorporation tax attracts significant international attention and has made asignificant contribution to its successful economic performance.54 Another contri-bution of the tax system to the Celtic Tiger experience was its role in enabling theeconomic growth that occurred to become steadily more employment-intensive.Tax reforms helped achieve this by hugely reducing the tax-take out of earnings,and out of low earnings in particular. By 2005, the objective of removing thoseearning the minimum wage from the tax net altogether was achieved. This wasregarded as an integral part of ensuring that employment growth contributed toreducing poverty and reliance on social welfare and, for this reason, changes in thetax treatment of low earnings are now summarised.
3.7.1 Tax and low earnings
Personal income tax plus employee and employer social security contributionscapture the difference between what an employer must pay to employ someoneand the disposable income the person receives. They constitute a ‘wedge’ drivenby the tax code between employer labour costs and employee take-home pay. TheIrish tax code has one of the smallest tax wedges in the OECD world and not onlyin the EU (Taxing Wages 2003-2004, OECD, 2005). The tax wedge on low earnings(two-thirds of average) fell from 26.5 per cent to 16.7 per cent between 1996 and2002; over the same period, the same ratio for the EU-15 as a whole marginallydeclined from 40.6 per cent to 37.8 per cent (Eurostat/New Census). The tax wedgeon average earnings was also the lowest in the EU and fell by more than in anyother member state (European Commission, 2002). In addition, significant piecesof employment legislation have reinforced the reduction in taxation to makeearning on the lowest rungs of the labour ladder more attractive. Social insurancewas extended to cover part-time workers in 1991 and an employee PRSI Allowancewas introduced in 1994. A national minimum wage was introduced in 2000 and,by 2004, Ireland was one of the few countries where the minimum adult rate wasabove 50 per cent of median earnings (next to Australia, France and NewZealand55). Despite the introduction of some new legislative measures, Ireland’slabour market still counts as one of the least regulated in the OECD: itsemployment protection legislation was the fifth least strict of 28 countriesexamined by the OECD in 2003 (OECD, 2004b).
78
53. Total tax take means exchequer tax revenue plus PRSI contributions and the proceeds of the Health and Training Fund Levies.Department of Finance (2004), Budgetary and Economic Statistics.
54. The report of the Enterprise Strategy Review Group (2004) identified Ireland’s low corporation tax, but also its transparency (in mostother countries, the posted rates and the effective marginal tax rates on business differ widely), the double taxation treaty networkand the major reductions in income tax, as all contributing to the economy’s strong performance.
55. UK Low Pay Commission Report (2005), National Minimum Wage. Table A4.2. See also Eurostat (2004) Minimum Wages: EU MemberStates, Candidate Countries and the US, 2004. Statistics in Focus, 10/2004.
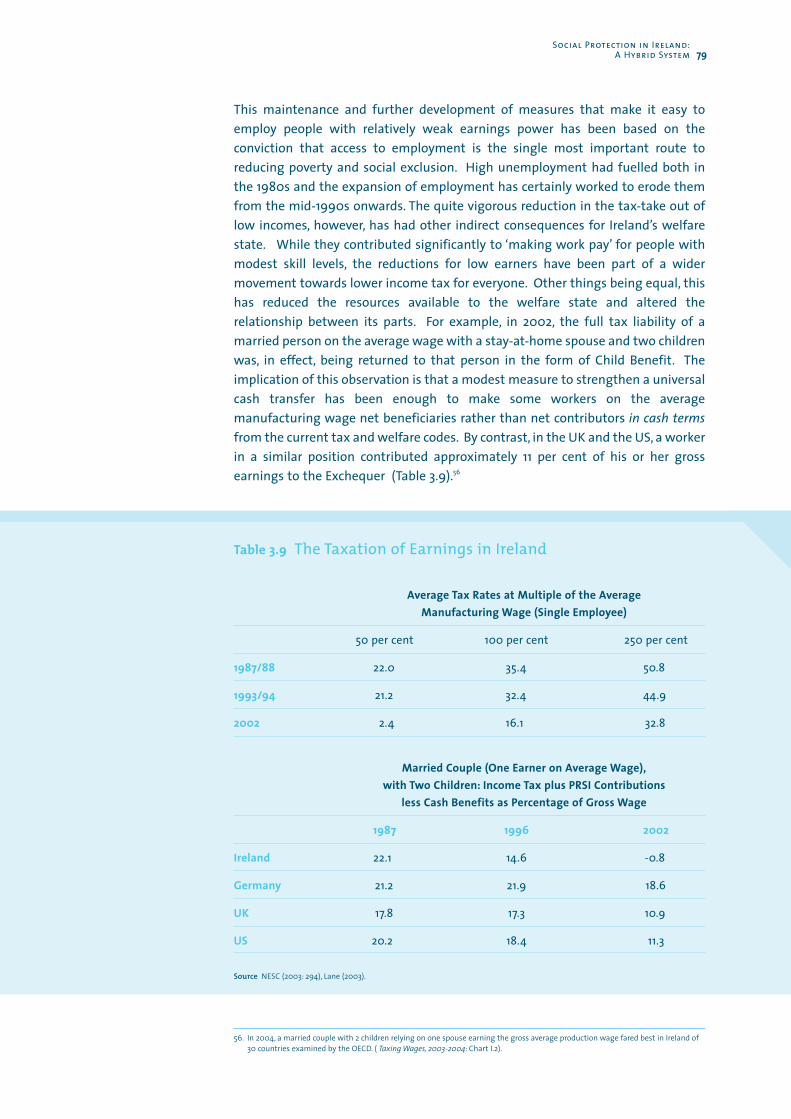
This maintenance and further development of measures that make it easy toemploy people with relatively weak earnings power has been based on theconviction that access to employment is the single most important route toreducing poverty and social exclusion. High unemployment had fuelled both inthe 1980s and the expansion of employment has certainly worked to erode themfrom the mid-1990s onwards. The quite vigorous reduction in the tax-take out oflow incomes, however, has had other indirect consequences for Ireland’s welfarestate. While they contributed significantly to ‘making work pay’ for people withmodest skill levels, the reductions for low earners have been part of a widermovement towards lower income tax for everyone. Other things being equal, thishas reduced the resources available to the welfare state and altered therelationship between its parts. For example, in 2002, the full tax liability of amarried person on the average wage with a stay-at-home spouse and two childrenwas, in effect, being returned to that person in the form of Child Benefit. Theimplication of this observation is that a modest measure to strengthen a universalcash transfer has been enough to make some workers on the averagemanufacturing wage net beneficiaries rather than net contributors in cash termsfrom the current tax and welfare codes. By contrast, in the UK and the US, a workerin a similar position contributed approximately 11 per cent of his or her grossearnings to the Exchequer (Table 3.9).56
Social Protection in Ireland:A Hybrid System 79
56. In 2004, a married couple with 2 children relying on one spouse earning the gross average production wage fared best in Ireland of30 countries examined by the OECD. ( Taxing Wages, 2003-2004: Chart I.2).
Table 3.9 The Taxation of Earnings in Ireland
Average Tax Rates at Multiple of the Average Manufacturing Wage (Single Employee)
50 per cent 100 per cent 250 per cent
1987/88 22.0 35.4 50.8
1993/94 21.2 32.4 44.9
2002 2.4 16.1 32.8
Married Couple (One Earner on Average Wage),with Two Children: Income Tax plus PRSI Contributions
less Cash Benefits as Percentage of Gross Wage
1987 1996 2002
Ireland 22.1 14.6 -0.8
Germany 21.2 21.9 18.6
UK 17.8 17.3 10.9
US 20.2 18.4 11.3
Source NESC (2003: 294), Lane (2003).
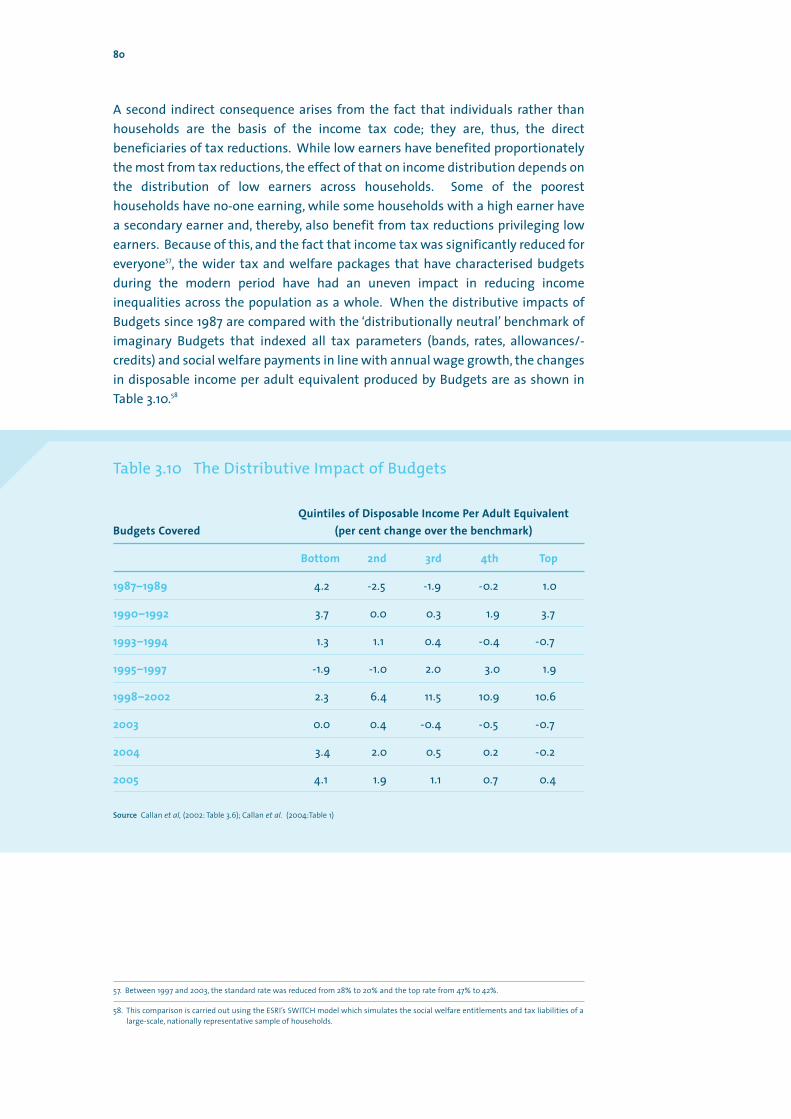
80
A second indirect consequence arises from the fact that individuals rather thanhouseholds are the basis of the income tax code; they are, thus, the directbeneficiaries of tax reductions. While low earners have benefited proportionatelythe most from tax reductions, the effect of that on income distribution depends onthe distribution of low earners across households. Some of the pooresthouseholds have no-one earning, while some households with a high earner havea secondary earner and, thereby, also benefit from tax reductions privileging lowearners. Because of this, and the fact that income tax was significantly reduced foreveryone57, the wider tax and welfare packages that have characterised budgetsduring the modern period have had an uneven impact in reducing incomeinequalities across the population as a whole. When the distributive impacts ofBudgets since 1987 are compared with the ‘distributionally neutral’ benchmark ofimaginary Budgets that indexed all tax parameters (bands, rates, allowances/-credits) and social welfare payments in line with annual wage growth, the changesin disposable income per adult equivalent produced by Budgets are as shown inTable 3.10.58
Table 3.10 The Distributive Impact of Budgets
Quintiles of Disposable Income Per Adult EquivalentBudgets Covered (per cent change over the benchmark)
Bottom 2nd 3rd 4th Top
1987–1989 4.2 -2.5 -1.9 -0.2 1.0
1990–1992 3.7 0.0 0.3 1.9 3.7
1993–1994 1.3 1.1 0.4 -0.4 -0.7
1995–1997 -1.9 -1.0 2.0 3.0 1.9
1998–2002 2.3 6.4 11.5 10.9 10.6
2003 0.0 0.4 -0.4 -0.5 -0.7
2004 3.4 2.0 0.5 0.2 -0.2
2005 4.1 1.9 1.1 0.7 0.4
Source Callan et al, (2002: Table 3.6); Callan et al. (2004:Table 1)
57. Between 1997 and 2003, the standard rate was reduced from 28% to 20% and the top rate from 47% to 42%.
58. This comparison is carried out using the ESRI’s SWITCH model which simulates the social welfare entitlements and tax liabilities of alarge-scale, nationally representative sample of households.
In the late 1980s, Budgets were generally harsh but protected the incomes of thelowest quintile: they reduced incomes everywhere except for the lowest quintilewhere they raised incomes significantly. During the first decade of the 1990s (to1994), Budgets were more benign in their overall impact but preserved a mildredistributive thrust with marginally higher increases in disposable income for thelowest quintile than for other groups. From 1995 to 2002, a regressive pattern wasdominant with Budgets improving the disposable income of the top threequintiles by significantly more than for the bottom two quintiles. Finally, after aBudget that almost marked time in 2003, a redistributive thrust has re-emergedwith higher increases been occasioned for the lowest quintile than for othergroups in the Budgets of 2004 and 2005.
3.7.2 Tax reliefs and allowances
A second important way in which the tax code affects social protection in Irelandis through reliefs and allowances granted for social purposes. Ireland has atradition that began in the late 1950s of using its tax code to stimulate industrialand economic development. Tax reliefs and allowances, however, have also beenused to support people in recognised situations of social need and to stimulateprivate spending on social protection. These have not been extensively studiedand, indeed, there is no commonly accepted definition of what constitutes a taxrelief or allowance for a social purpose. It is possible to identify 22 operatingagainst income tax and corporation tax during the 1990s.59 They were,respectively, supporting parents in caring for their children, helping to provideretirement pensions, subsidising health expenditures, supporting access to or theprovision of accommodation, helping workers who became unemployed, andencouraging philanthropic organisations.
Over the seven year period, 1993-2000, the total value of tax reliefs and allowancesfor social purposes rose from 3.2 per cent to 4.3 per cent of GNP (Table 3.11). By theyear 2000, their value was equivalent to 51 per cent of the total expenditure of theDepartment of Social and Family Affairs, up from 27 per cent in 1993. As apercentage of the value of tax reliefs and allowances granted against income andcorporation tax for all purposes (industrial and economic as well as social), thosefor social purposes increased from 20 per cent to 29 per cent. Driving this increasewas the cost of reliefs and allowances supporting pensions and the incomes ofpeople in their older years. These rose from 1.7 per cent of GNP in 1993 to 3.4 percent in 2000, and from some 11 per cent of the estimated cost of total tax reliefsand allowances for all purposes to 23 per cent. By the year 2000, they wereequivalent to 41 per cent of the total expenditure on social welfare by theDepartment of Family and Social Affairs, as against 14.4 per cent in 1993. Bycontrast, the more modest tax supports for housing dwindled in their absolutevalue and relative to GNP and direct social welfare expenditure. The tax supportsfor parenting and children, and for health, increased in absolute terms but notsignificantly in relation to GNP or overall welfare spending.60 When tax
Social Protection in Ireland:A Hybrid System 81
59. Against income and corporation tax only. The ‘cost’ of zero-rating children’s clothing and shoes for VAT, and the exemption of salesof people’s homes from Capital Gains Tax, are not included.
60. An estimated 1.9 million persons, or approximately 49 per cent of the population, were covered by private medical insurance in2002. Those who take out private cover tend disproportionately to be in employment, married and aged between 35 and 54 (QNHS,2001). The largest private insurer (VHI) had over 1.5 million members, collected c647m in premiums and paid out c494m on claimsfor medical expenses (mainly for hospital treatment) that same year.
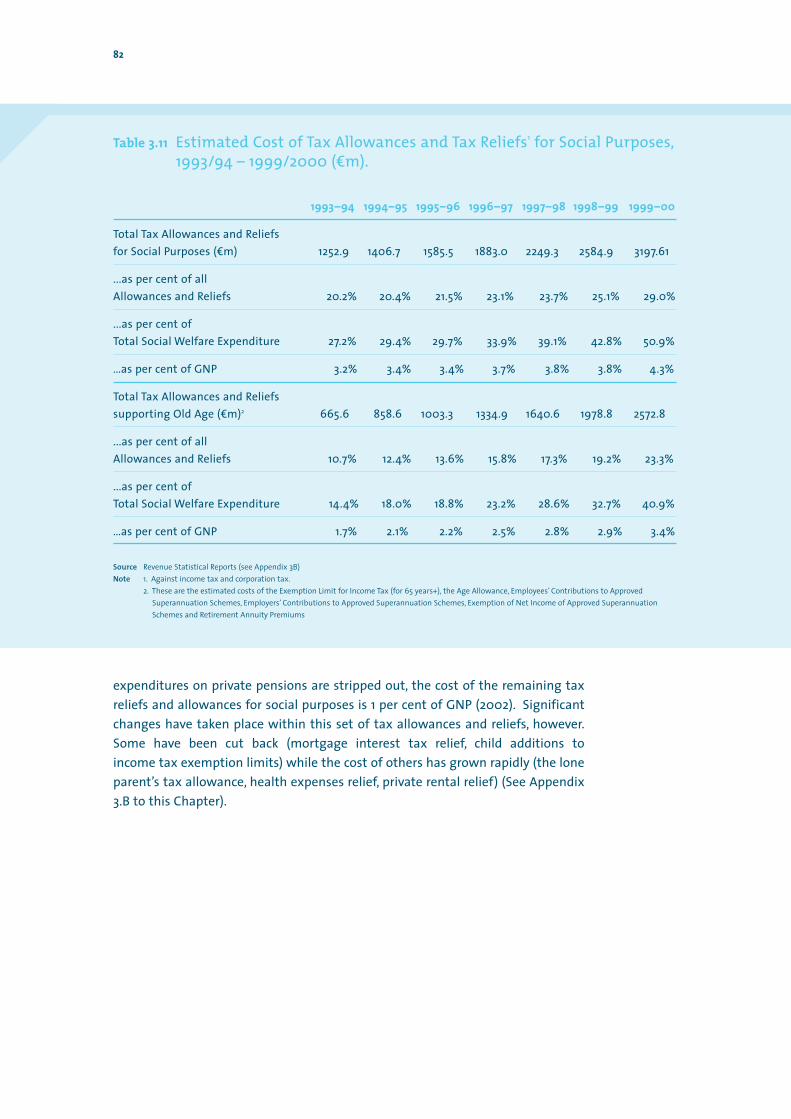
expenditures on private pensions are stripped out, the cost of the remaining taxreliefs and allowances for social purposes is 1 per cent of GNP (2002). Significantchanges have taken place within this set of tax allowances and reliefs, however.Some have been cut back (mortgage interest tax relief, child additions to income tax exemption limits) while the cost of others has grown rapidly (the loneparent’s tax allowance, health expenses relief, private rental relief) (See Appendix3.B to this Chapter).
82
Table 3.11 Estimated Cost of Tax Allowances and Tax Reliefs1 for Social Purposes,1993/94 – 1999/2000 (dm).
1993–94 1994–95 1995–96 1996–97 1997–98 1998–99 1999–00
Total Tax Allowances and Reliefs for Social Purposes (dm) 1252.9 1406.7 1585.5 1883.0 2249.3 2584.9 3197.61
...as per cent of all Allowances and Reliefs 20.2% 20.4% 21.5% 23.1% 23.7% 25.1% 29.0%
...as per cent of Total Social Welfare Expenditure 27.2% 29.4% 29.7% 33.9% 39.1% 42.8% 50.9%
…as per cent of GNP 3.2% 3.4% 3.4% 3.7% 3.8% 3.8% 4.3%
Total Tax Allowances and Reliefs supporting Old Age (dm)2 665.6 858.6 1003.3 1334.9 1640.6 1978.8 2572.8
...as per cent of all Allowances and Reliefs 10.7% 12.4% 13.6% 15.8% 17.3% 19.2% 23.3%
...as per cent of Total Social Welfare Expenditure 14.4% 18.0% 18.8% 23.2% 28.6% 32.7% 40.9%
…as per cent of GNP 1.7% 2.1% 2.2% 2.5% 2.8% 2.9% 3.4%
Source Revenue Statistical Reports (see Appendix 3B)Note 1. Against income tax and corporation tax.
2. These are the estimated costs of the Exemption Limit for Income Tax (for 65 years+), the Age Allowance, Employees’ Contributions to ApprovedSuperannuation Schemes, Employers’ Contributions to Approved Superannuation Schemes, Exemption of Net Income of Approved Superannuation Schemes and Retirement Annuity Premiums
3.8 A Provisional Balance Sheet
This chapter has sketched the arrangements in place in Ireland to provide socialprotection. The expedient adopted was to track the current scale and nature ofpublic spending, both on direct public service provision and what is channelled tofamilies, voluntary organisations and to subsidise commercial provision. Many ofthe policy changes since the mid-1980s suggest that Ireland’s hybrid system ofsocial protection is performing well. For example:
s Ireland combined rapid and employment-intensive economic growth withincreases in the level and coverage of income support provided to thosewithout jobs. Unlike the USA or Britain, no fall in the real wage or cutbacks in income support accompanied it’s extremely rapid employment creation.61
Absolute and per capita levels of social welfare spending, in real terms,increased significantly;
s A significant number of measures were introduced to support the family in itscaring role as rising female employment rates wholly changed the basis onwhich it had traditionally done so (the Carer’s Allowance, Carer’s Benefit,Respite Care Grant, Employment of Carer Tax Allowance, etc.; for children, theextension of maternity benefit, increase in Child Benefit, etc);
s Through the above and in other ways significant progress was made inattaining gender neutrality;
s The need for people with disabilities to have greater access to mainstreamservices, their right to enjoy the autonomy of which they are capable, andhigher standards for people in every form of institutional care, are beingpromoted and advanced;
s The income tax and social insurance codes interfere minimally with employer’sdecisions to recruit low-skilled workers. The tax wedge (income tax and PRSIcontributions) on average and low earnings is the lowest in the EU 15;
s A set of in-work benefits or employment supports have been developed thatincrease the incentive for groups of working-age welfare recipients to takeemployment and/or better their skills;
s The hardship associated with the lowest money incomes has been significantlyreduced through the combination of a higher floor to real incomes andimproved benefits-in-kind (e.g., the ‘Free schemes’). The high-profile measureof ‘consistent poverty’ records a steady decline from 17.7 per cent in 1987 to 4.7per cent in 2001 in the percentage of persons living on below 60 per cent ofmean income and in a household experiencing enforced deprivation;
s The rise in educational participation by young people and the standards theyare attaining are good by international standards. Public expenditure perstudent at primary and secondary levels has begun to rise appreciably;
Social Protection in Ireland:A Hybrid System 83
61. For example, it is cited as an example of a country which successfully forged an alternative path to the labour market deregulationand social welfare stringency advocated by the OECD Jobs Study of the mid-1990s, Schneider (2003).
s The social insurance code has been extended to embrace more groups ofworkers (part-time, self-employed and new public service workers) and toprovide cover for new types of risk (caring, adopting a child);
s A strong legislative and institutional framework to promote equality hasdeveloped, and a national minimum wage has been introduced;
s Social partnership arrangements at national and local level have allowed moreactors to access the social policy formation process;
s Innovative arrangements at local level have helped to mobilise local communi-ties and alter the manner in which some key social and employment servicesare delivered in their areas;
s Action has been taken to position Ireland’s welfare state to meet the risingpension bill of the future (the National Pension Reserve Fund). In addition,premature retirement on a large scale has not developed in Ireland; the countrycurrently has the highest average exit age from the workforce in the EU 15(Amitis et al, 2003);
s Significant progress has been made in recovering ground lost during a period ofsevere fiscal retrenchment and the quality of the infrastructures through whichservices are provided is being significantly improved.
If Ireland’s current welfare state were not showing this resilience and adaptability,in all likelihood a greater sense of crisis would now characterise social policy and itwould be easier for the social partners to explore and accept radical changes. Themature welfare states of other countries are experiencing significantly greaterpressures for reform, leading some authors to speak of a ‘new era of austerity’ forWestern populations (Pierson, 2001). By comparison, Ireland is fortunate. Its lowerinvestment in social protection over the decades and late qualification as anadvanced economy have kept it from building a heavy welfare edifice, while itspublic finances, low unemployment and expansion of private servicesemployment, including at the lower productivity end, are good by EU standards.But Ireland’s welfare state is being challenged — to revise systems that model lowexpectations and achieve low outcomes for a minority, to support its populationmore adequately in changed times, and to institutionalise wholly new standardsof participation and care for its most dependent and vulnerable members.Ireland’s social partners and political system need to bring greater focus to welfarereform in Ireland both by appreciating how much has been achieved and by facingthe seriousness of current needs. In and through the national system of socialprotection that has been sketched above, three sets of social deficits and emergingchallenges are proving particularly difficult to address.
84
One set is the experience of a minority characterised by low educationalattainment and long durations on means-tested social assistance.
s Children enrolling in primary schools designated as disadvantaged showsignificant lags in their school preparedness (their reading literacy scorecompared to national average) and the gap is still there five years later. Schoolswith larger numbers of students from poor backgrounds have higher levels ofabsenteeism and, when of an age to do so, such students are more likely toengage in levels of part-time work that impact negatively on their schoolperformance.
s At a time when some 55 per cent of young people are entering third leveleducation, another 18 per cent are not completing secondary school. 38 per centof male students are not taking the Leaving Certificate in Dublin, with theproportion as high as 60 to 65 per cent in disadvantaged areas. More of theemployment needs of new ICT and financial services companies are having tobe met by skilled immigrants.
s Socio-economic inequalities in health are deeply rooted, beginning at birth.The proportion of low birthweights rose during the 1990s (from 4.2 per cent ofall births to 5 per cent), with socially disadvantaged mothers most involved.Death rates in later life are significantly higher for people in the lowest socio-economic group than for those in the highest (e.g., twice as high when maledeaths from circulatory disease are compared).
s Though unemployment has been massively reduced, dependence on means-tested social welfare by people of working-age has actually increased. Morethat a quarter of a million people of working-age are being means-tested at atime when the economy is pulling in a substantial number of workers fromoverseas. In some instances, a person may become entitled to social welfarewhile still in their teens and remain on it until they are reclassified as earlyretired. Significant disincentives to taking employment arising from benefitwithdrawal have re-emerged (e.g., rent supplement, medical card).
s The combination of low educational attainment and early exposure to life onmeans-tested social assistance risks causing the inter-generationaltransmission of disadvantage when young people reduce their expectationsand goals in life to protect themselves from further failure. Sociallydisadvantaged young people are disproportionately exposed to a growingspectrum of risks, from depression to crime. Despite more than a decade ofattention to and support for area-based strategies, there are still high localconcentrations of multiple disadvantage compounding the danger of itsintergenerational transmission.
s The proportion of the population living on money incomes significantly belowthe levels characterising Irish society in general has grown steadily. Some 22.7per cent of the population were below the 60 per cent of median income linein 2003, a rise from 19.8 per cent in 1998 and 15.6 per cent in 1994.
Social Protection in Ireland:A Hybrid System 85
86
A second set is experienced by people in employment but without sufficientlylarge earnings to be in a position to purchase the additional social protection theyneed over and above what they can currently access through public services.
s The speed with which women’s employment rates rose in Ireland has fewinternational precedents. It has been a major factor behind the country’simpressive economic performance, and its development of the services sectorin particular. Many of these women also bear and rear young children, yetchildbirth-related leave is not particularly generous by European standards,while childcare facilities remain patchily available and cost Irish workers morethan almost anywhere else in Europe. Employment rates among women dropparticularly sharply in Ireland compared to other countries after the birth of afirst and second child.
s In other instances, workers combine their job commitment with responsibilityfor an elderly parent or housebound relative living alone, a phenomenon set togrow markedly as the number of people aged 80 or over rises from 90,000 in1996 to an estimated 200,000 by 2031, and as persons with severe disabilitieslive longer. Supports to workers in their dual role as carers have made a rapidappearance in Ireland but the scale of what will be needed in the years to comeconstitutes a major challenge.
s The ease and cost of access to public health services for employees on modestearnings have deteriorated in recent years. Eligibility for the medical card hasbeen restricted and the charges they face have risen.
s A growing number of people have only been able to afford satisfactory housingat a considerable distance from their place of work and poorly served by publictransport networks. Reliance on the car and commuting times have risen.
s Ireland’s success in educating its young population is a justly celebrated featureof its economic resurgence. The workforce, however, includes a significantnumber of people who did not complete their secondary education. Many areconcentrated in employments vulnerable to the economy’s restructuring(traditional manufacturing, low-skilled jobs in semi-State bodies, etc.). Withouttailored supports, innovative pedagogies and effective co-ordination betweenemployers and education and training bodies, the ‘innovative, knowledge-based economy’ risks being harsh to them and kind principally to youngercohorts.
The third set faces the entire community as the rights of neglected minorities andsub-groups in the population become articulated and society addresses, often forthe first time, its collective responsibility for persons with special needs. Thus:
s There is a greater, including State-assisted, vigilance for human rights andrecognition of the social evils of discrimination and racism. It is accepted thatthe role of the State is not just to see that people’s individual rights are notinterfered with but goes further to ensure that each person has access to thesocial and economic resources that underpin the individual’s development andparticipation in society. Prominent examples are in the area of disability andspecial needs education for children.
s There has been a shift from a medical interpretation of disability as an ‘evident’impairment arising from an individual’s physical or intellectual traits to a socialinterpretation, which sees the impairment arising largely from prevailingattitudes and practices in society. The responsibility on the State to providetailored educational services to people with special needs has come sharplyinto focus. It is no longer considered acceptable that the family shouldshoulder alone the care of vulnerable members. In a similar fashion, theopportunity for more autonomy and independent living is sought for andneeded by people with chronic health conditions and the elderly.
s A higher professionalism, more holistic approach and much improvedamenities are sought for and needed in every type of institution whereindividuals are the responsibility of the State (children’s homes, welfare homesfor older people, psychiatric institutions, asylum seekers accommodation,centres for young offenders, prisons, etc.).
As important as these needs are, there is the realisation that additional resourcesin many instances do not guarantee the outcomes sought. New ways of working,new policy instruments and institutional innovations are required if additionalresources are to be effective in significantly improving on social outcomes.
The weaknesses rather than the strengths of the incremental, diverse and ad hocway in which public spending on social protection has evolved in Ireland camemore to the fore when new fiscal pressures materialised for a period from mid-2001 onwards. Arguably, it was easier to overlook the lack of an overarchingrationale to social policy when additional resources could be provided across theentire system than when resources were everywhere being pared back. It can beargued that the cumulative impact of many priorities that have been acted uponin recent years — extending the medical card to all aged 70 or over rather than tochildren, increasing tax expenditures on private pensions rather than increasingthe State’s contributory pension, purchasing hospital treatment for public patientsfrom private hospitals when public hospitals need further investment, providingmajor increases in Child Benefit while a significant number of children remainbelow the poverty line — shows a ‘system’ for social protection that is much lesssystematic than it has the potential for becoming.
Social Protection in Ireland:A Hybrid System 87
It is opportune to seek an overview now of what it is intended to achieve and howacross the spectrum of current and emerging social needs for several reasons:
s the complexity of Ireland’s hybrid and mixed welfare state;
s the multiple groups and interests that are involved in providing services and inseeking them;
s the degree of consultation and participation to which there is already a formalcommitment;
s the extent of disagreement and fatigue that has dogged much of the search formore effective social policies on several fronts;
s the unevenness of the progress that has been made on different fronts;
s the inability of substantial increases in resources at times to producecommensurate improvements in outcomes;
s the need to balance capital with current spending and to adopt multi-annualbudgets for developing services as well as for rolling out capital infrastructures;and
s the necessity of close interdepartmental and cross-agency working if expendi-ture programmes in several instances are to be evaluated by outcomes.
88
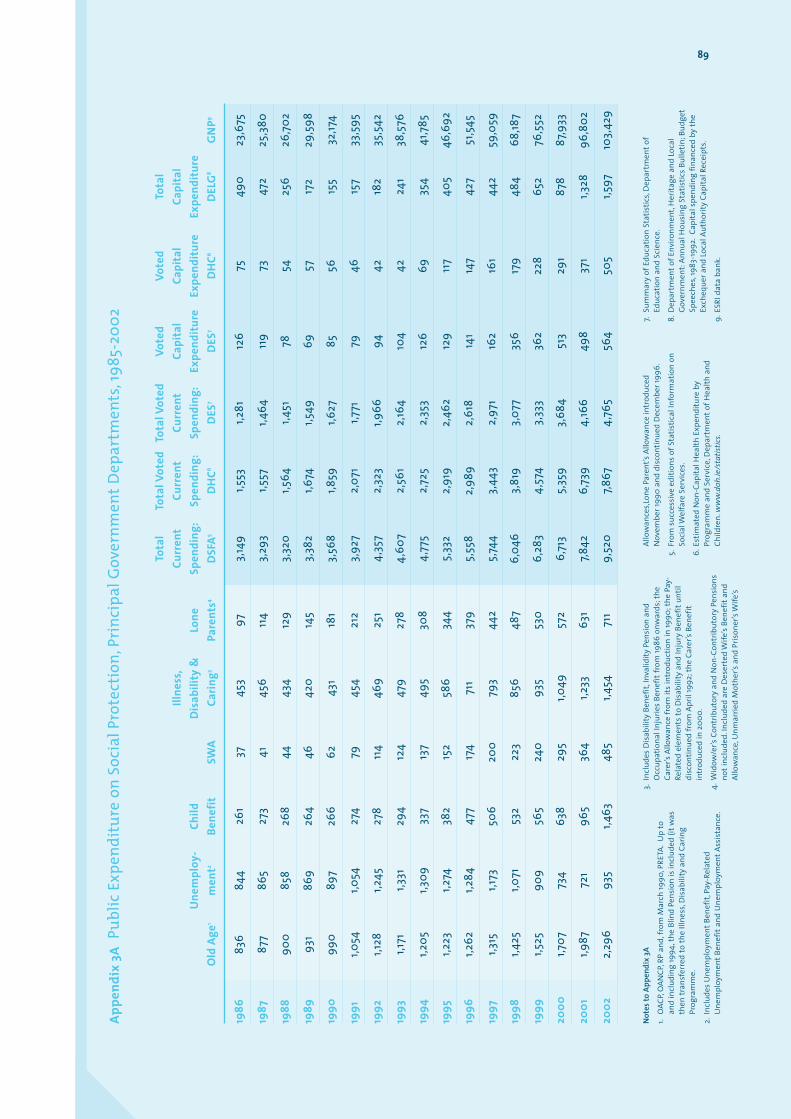
Appe
ndix
3A
Publ
ic E
xpen
ditu
re o
n So
cial
Pro
tect
ion,
Prin
cipa
l Gov
ernm
entD
epar
tmen
ts,1
985-
2002
Tota
lTo
tal V
oted
Tota
l Vot
edVo
ted
Vote
d To
tal
Illne
ss,
Curr
ent
Curr
ent
Curr
ent
Capi
tal
Capi
tal
Capi
tal
Une
mpl
oy-
Child
Dis
abili
ty &
Lone
Spen
ding
:Sp
endi
ng:
Spen
ding
:Ex
pend
iture
Expe
nditu
reEx
pend
iture
Old
Age
1m
ent2
Bene
fitSW
ACa
ring3
Pare
nts4
DSF
A5D
HC6
DES
7D
ES7
DH
C6D
ELG
8G
NP9
1986
836
844
261
3745
397
3,14
91,5
531,2
8112
675
490
23,6
75
1987
877
865
273
4145
611
43,
293
1,557
1,464
119
7347
225
,380
1988
900
858
268
4443
412
93,
320
1,564
1,451
7854
256
26,7
02
1989
931
869
264
4642
014
53,
382
1,674
1,549
6957
172
29,5
98
1990
990
897
266
6243
118
13,
568
1,859
1,627
8556
155
32,17
4
1991
1,054
1,054
274
7945
421
23,
927
2,07
11,7
7179
4615
733
,595
1992
1,128
1,245
278
114
469
251
4,35
72,
323
1,966
9442
182
35,5
42
1993
1,171
1,331
294
124
479
278
4,60
72,
561
2,16
410
442
241
38,5
76
1994
1,205
1,309
337
137
495
308
4,77
52,
725
2,35
312
669
354
41,7
85
1995
1,223
1,274
382
152
586
344
5,33
22,
919
2,46
212
911
740
546
,692
1996
1,262
1,284
477
174
711
379
5,55
82,
989
2,61
814
114
742
751
,545
1997
1,315
1,173
506
200
793
442
5,74
43,
443
2,97
116
216
144
259
,059
1998
1,425
1,071
532
223
856
487
6,04
63,
819
3,07
735
617
948
468
,187
1999
1,525
909
565
240
935
530
6,28
34,
574
3,33
336
222
865
276
,552
2000
1,707
734
638
295
1,049
572
6,71
35,
359
3,68
451
329
187
887
,933
2001
1,987
721
965
364
1,233
631
7,842
6,73
94,
166
498
371
1,328
96,8
02
2002
2,29
693
51,4
6348
51,4
5471
19,
520
7,867
4,76
556
450
51,5
9710
3,42
9
Not
es to
App
endi
x 3A
1.O
ACP,
OAN
CP,R
P an
d,fr
om M
arch
1990
,PRE
TA.
Up
toan
d in
clud
ing
1994
,the
Blin
d Pe
nsio
n is
incl
uded
(itw
asth
en tr
ansf
erre
d to
the
Illne
ss,D
isab
ility
and
Car
ing
Prog
ram
me.
2.In
clud
es U
nem
ploy
men
tBen
efit,
Pay-
Rela
ted
Une
mpl
oym
entB
enef
itan
d U
nem
ploy
men
tAss
ista
nce.
3.In
clud
es D
isab
ility
Ben
efit,
Inva
lidity
Pen
sion
and
Occ
upat
iona
l Inj
urie
s Be
nefit
from
1986
onw
ards
;the
Care
r’s A
llow
ance
from
its
intr
oduc
tion
in 19
90;t
he P
ay-
Rela
ted
elem
ents
to D
isab
ility
and
Inju
ry B
enef
itun
tildi
scon
tinue
d fr
om A
pril
1992
;the
Car
er’s
Bene
fitin
trod
uced
in 2
000.
4.W
idow
/er’s
Con
trib
utor
y an
d N
on-C
ontr
ibut
ory
Pens
ions
noti
nclu
ded.
Incl
uded
are
Des
erte
d W
ife’s
Bene
fitan
dAl
low
ance
,Unm
arrie
d M
othe
r’s a
nd P
rison
er’s
Wife
’s
Allo
wan
ces,L
one
Pare
nt’s
Allo
wan
ce in
trod
uced
Nov
embe
r 199
0 an
d di
scon
tinue
d D
ecem
ber 1
996.
5.Fr
om s
ucce
ssiv
e ed
ition
s of
Sta
tistic
al In
form
atio
n on
Soci
al W
elfa
re S
ervi
ces.
6.Es
timat
ed N
on-C
apita
l Hea
lth E
xpen
ditu
re b
yPr
ogra
mm
e an
d Se
rvic
e,D
epar
tmen
tof H
ealth
and
Child
ren.
ww
w.d
oh.ie
/sta
tistic
s.
7.Su
mm
ary
of E
duca
tion
Stat
istic
s,D
epar
tmen
tof
Educ
atio
n an
d Sc
ienc
e.
8.D
epar
tmen
tof E
nviro
nmen
t,H
erita
ge a
nd L
ocal
Gov
ernm
ent:
Annu
al H
ousi
ng S
tatis
tics
Bulle
tin;B
udge
tSp
eech
es,1
983-
1992
.Ca
pita
l spe
ndin
g fin
ance
d by
the
Exch
eque
r and
Loc
al A
utho
rity
Capi
tal R
ecei
pts.
9.ES
RI d
ata
bank
.
89
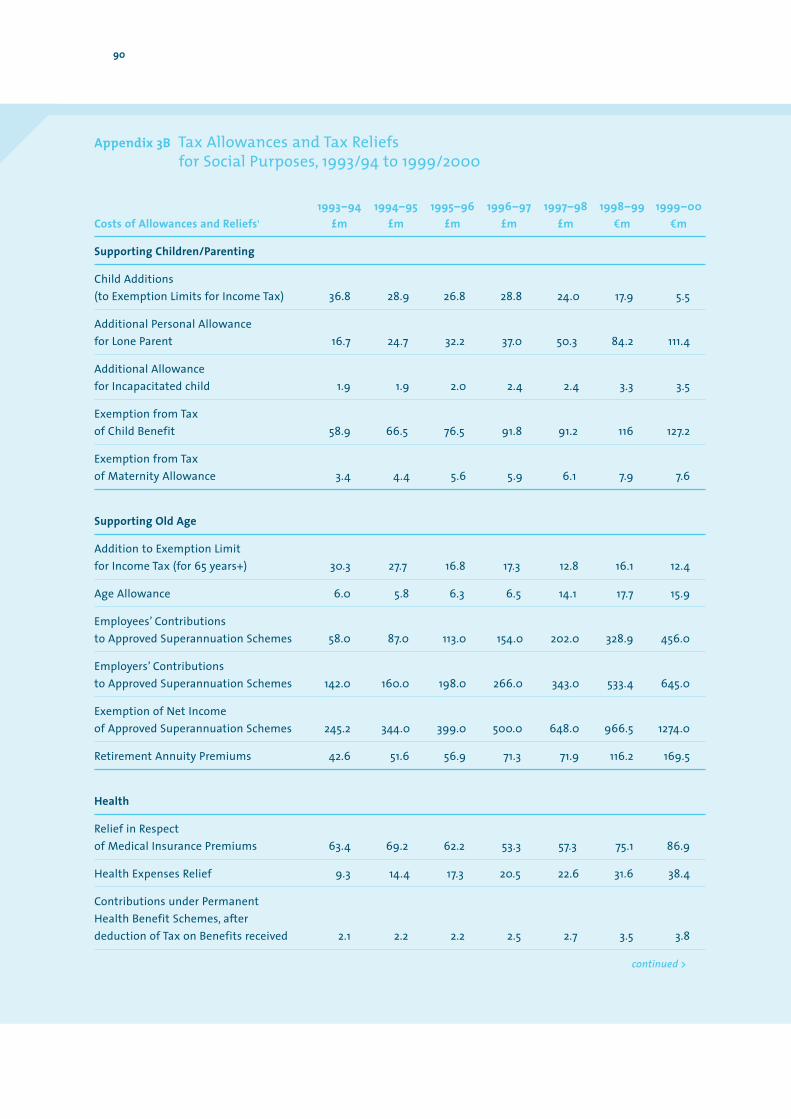
90
Appendix 3B Tax Allowances and Tax Reliefs for Social Purposes, 1993/94 to 1999/2000
1993–94 1994–95 1995–96 1996–97 1997–98 1998–99 1999–00Costs of Allowances and Reliefs1 £m £m £m £m £m em em
Supporting Children/Parenting
Child Additions (to Exemption Limits for Income Tax) 36.8 28.9 26.8 28.8 24.0 17.9 5.5
Additional Personal Allowance for Lone Parent 16.7 24.7 32.2 37.0 50.3 84.2 111.4
Additional Allowance for Incapacitated child 1.9 1.9 2.0 2.4 2.4 3.3 3.5
Exemption from Tax of Child Benefit 58.9 66.5 76.5 91.8 91.2 116 127.2
Exemption from Tax of Maternity Allowance 3.4 4.4 5.6 5.9 6.1 7.9 7.6
Supporting Old Age
Addition to Exemption Limitfor Income Tax (for 65 years+) 30.3 27.7 16.8 17.3 12.8 16.1 12.4
Age Allowance 6.0 5.8 6.3 6.5 14.1 17.7 15.9
Employees’ Contributions to Approved Superannuation Schemes 58.0 87.0 113.0 154.0 202.0 328.9 456.0
Employers’ Contributions to Approved Superannuation Schemes 142.0 160.0 198.0 266.0 343.0 533.4 645.0
Exemption of Net Income of Approved Superannuation Schemes 245.2 344.0 399.0 500.0 648.0 966.5 1274.0
Retirement Annuity Premiums 42.6 51.6 56.9 71.3 71.9 116.2 169.5
Health
Relief in Respectof Medical Insurance Premiums 63.4 69.2 62.2 53.3 57.3 75.1 86.9
Health Expenses Relief 9.3 14.4 17.3 20.5 22.6 31.6 38.4
Contributions under PermanentHealth Benefit Schemes, after deduction of Tax on Benefits received 2.1 2.2 2.2 2.5 2.7 3.5 3.8
continued >
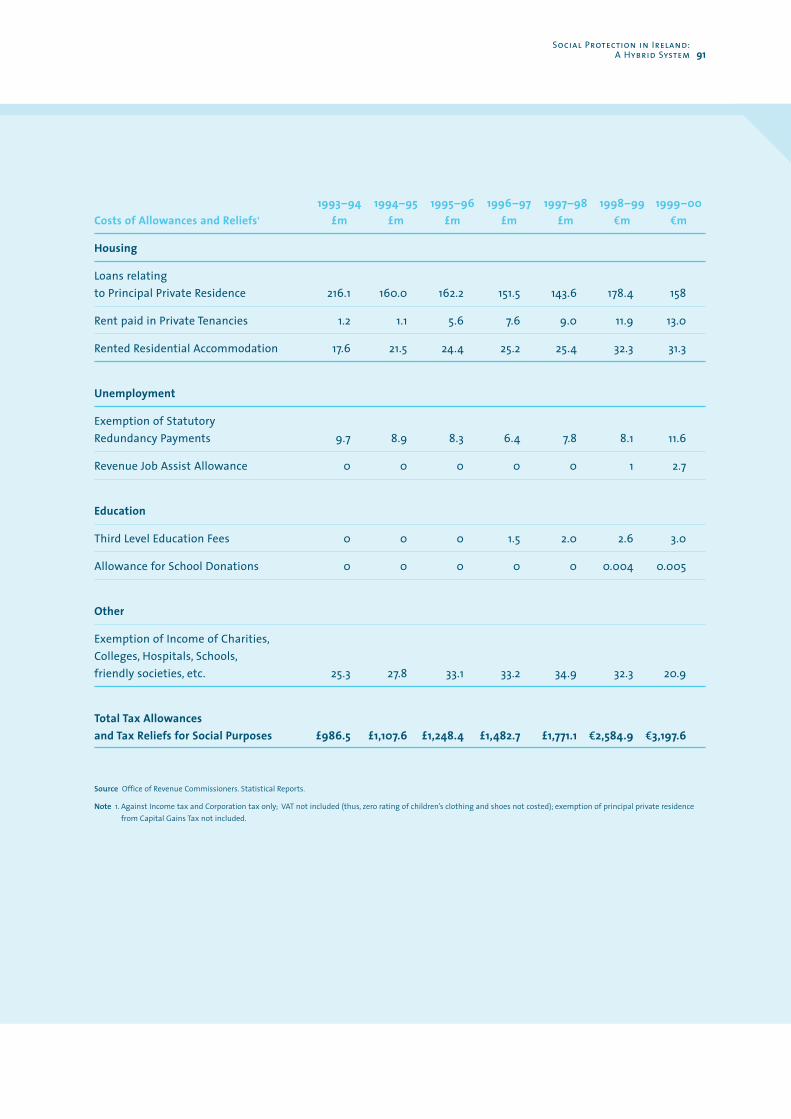
Social Protection in Ireland:A Hybrid System 91
1993–94 1994–95 1995–96 1996–97 1997–98 1998–99 1999–00Costs of Allowances and Reliefs1 £m £m £m £m £m em em
Housing
Loans relating to Principal Private Residence 216.1 160.0 162.2 151.5 143.6 178.4 158
Rent paid in Private Tenancies 1.2 1.1 5.6 7.6 9.0 11.9 13.0
Rented Residential Accommodation 17.6 21.5 24.4 25.2 25.4 32.3 31.3
Unemployment
Exemption of Statutory Redundancy Payments 9.7 8.9 8.3 6.4 7.8 8.1 11.6
Revenue Job Assist Allowance 0 0 0 0 0 1 2.7
Education
Third Level Education Fees 0 0 0 1.5 2.0 2.6 3.0
Allowance for School Donations 0 0 0 0 0 0.004 0.005
Other
Exemption of Income of Charities,Colleges, Hospitals, Schools,friendly societies, etc. 25.3 27.8 33.1 33.2 34.9 32.3 20.9
Total Tax Allowances and Tax Reliefs for Social Purposes £986.5 £1,107.6 £1,248.4 £1,482.7 £1,771.1 e2,584.9 e3,197.6
Source Office of Revenue Commissioners. Statistical Reports.
Note 1. Against Income tax and Corporation tax only; VAT not included (thus, zero rating of children’s clothing and shoes not costed); exemption of principal private residencefrom Capital Gains Tax not included.
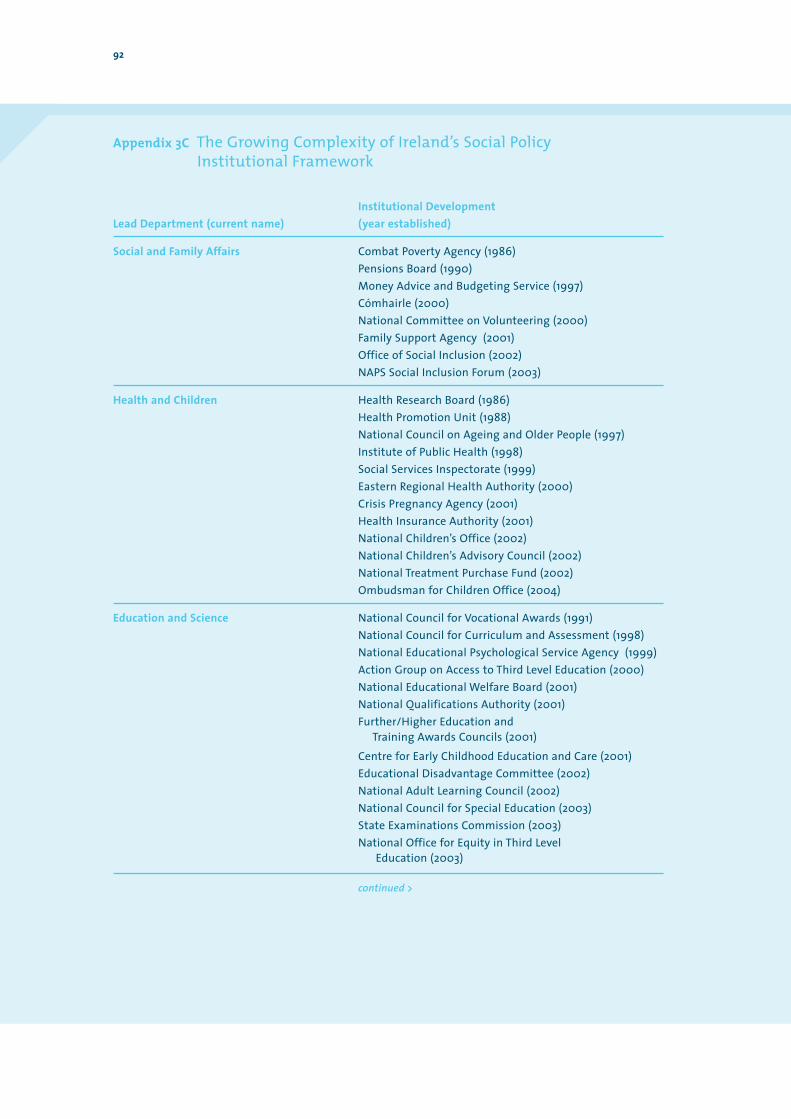
Appendix 3C The Growing Complexity of Ireland’s Social Policy Institutional Framework
Institutional DevelopmentLead Department (current name) (year established)
Social and Family Affairs Combat Poverty Agency (1986)Pensions Board (1990)Money Advice and Budgeting Service (1997)Cómhairle (2000)National Committee on Volunteering (2000)Family Support Agency (2001)Office of Social Inclusion (2002)NAPS Social Inclusion Forum (2003)
Health and Children Health Research Board (1986)Health Promotion Unit (1988)National Council on Ageing and Older People (1997)Institute of Public Health (1998)Social Services Inspectorate (1999)Eastern Regional Health Authority (2000)Crisis Pregnancy Agency (2001)Health Insurance Authority (2001)National Children’s Office (2002)National Children’s Advisory Council (2002)National Treatment Purchase Fund (2002)Ombudsman for Children Office (2004)
Education and Science National Council for Vocational Awards (1991)National Council for Curriculum and Assessment (1998)National Educational Psychological Service Agency (1999)Action Group on Access to Third Level Education (2000)National Educational Welfare Board (2001)National Qualifications Authority (2001)Further/Higher Education and
Training Awards Councils (2001)Centre for Early Childhood Education and Care (2001)Educational Disadvantage Committee (2002)National Adult Learning Council (2002)National Council for Special Education (2003)State Examinations Commission (2003)National Office for Equity in Third Level
Education (2003)
continued >
92
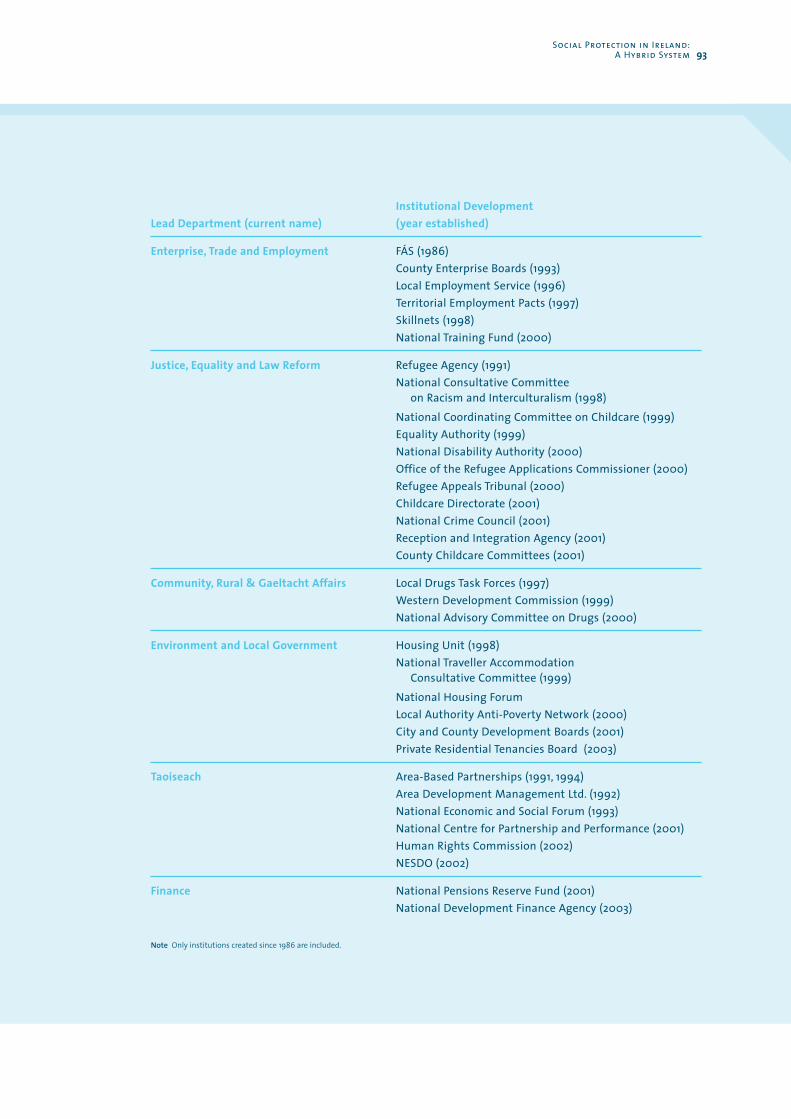
Social Protection in Ireland:A Hybrid System 93
Institutional DevelopmentLead Department (current name) (year established)
Enterprise, Trade and Employment FÁS (1986)County Enterprise Boards (1993)Local Employment Service (1996)Territorial Employment Pacts (1997)Skillnets (1998)National Training Fund (2000)
Justice, Equality and Law Reform Refugee Agency (1991)National Consultative Committee
on Racism and Interculturalism (1998)National Coordinating Committee on Childcare (1999)Equality Authority (1999)National Disability Authority (2000)Office of the Refugee Applications Commissioner (2000)Refugee Appeals Tribunal (2000)Childcare Directorate (2001)National Crime Council (2001)Reception and Integration Agency (2001)County Childcare Committees (2001)
Community, Rural & Gaeltacht Affairs Local Drugs Task Forces (1997)Western Development Commission (1999)National Advisory Committee on Drugs (2000)
Environment and Local Government Housing Unit (1998)National Traveller Accommodation
Consultative Committee (1999)National Housing ForumLocal Authority Anti-Poverty Network (2000)City and County Development Boards (2001)Private Residential Tenancies Board (2003)
Taoiseach Area-Based Partnerships (1991, 1994)Area Development Management Ltd. (1992)National Economic and Social Forum (1993)National Centre for Partnership and Performance (2001)Human Rights Commission (2002)NESDO (2002)
Finance National Pensions Reserve Fund (2001)National Development Finance Agency (2003)
Note Only institutions created since 1986 are included.

Ireland’s Social Protection in a Comparative Context
4
4.1 Introduction
This chapter uses the principal international data sets on countries’ socialspending to highlight characteristics of Ireland’s welfare state (4.2). Several factorsin addition to the specific social policies a country adopts can impact strongly onthe level of social spending — principally the age structure of a population and thelevel of unemployment — and these are explored in section 4.3. Finally, the linksbetween given levels of social spending — particularly the public part of it — andthe attainment of satisfactory social outcomes are explored in section 4.4. A fifthsection concludes.
4.2 Welfare State Differences in Practice
4.2.1 Differences in expenditure patterns
The balance between cash transfers and services
The member states of the European Union are usefully regarded as constitutingfour welfare state clusters or ‘families’, a Nordic group, a Continental Europeangroup, an Anglo-Saxon group and a Southern European group. 1
There have been frequent attempts to distinguish between these families by thedegree of their respective emphases on providing cash transfers and services.For example, it is frequently assumed that the Nordic welfare model is strong onservices and the Continental European one strong on cash transfers. Generally, theempirical evidence has supported these characterisations. However, it has beenless clear as to which patterns are assumed to prevail in the Anglo-Saxon andSouthern European welfare families, or indeed whether the dichotomy betweentransfers and services is of major importance to capturing what most characterisesthem in the first place.
In what follows, use is made of Eurostat’s system for gathering and classifyingsocial protection expenditures. We take advantage of the distinction madebetween benefits in kind and cash benefits, and — within each category —
95
1. Ferrera and Hemerijck, 2003; Ferrera et al, 2000; Esping-Andersen, 1990. Where no other ranking is suggested by specific subjectmatter, tables for members states of the European Union in this report are grouped by these welfare state clusters.
between expenditure that is means-tested and that which is not.2 When this wasdone for data covering the period 1990-1997, three clusters of countries wereidentified within the European Union in terms of their redistribution strategies(Kautto, 2002). The analysis below uses newer data for the period, 1993-2001, in anattempt to capture what some of what currently characterises Ireland’s welfarestate in the European context.3
Service effort and transfer effort
When social expenditures on benefits in kind and cash benefits respectively areexpressed as a proportion of a country’s GDP, the resultant ratios are convention-ally termed indicators of the ‘service effort’ and ‘transfer effort’ being madethrough that country’s welfare state. When expenditure on benefits in kind isexpressed as a proportion of a country’s spending on both benefits in kind andcash transfers, the resultant ratio can be regarded as an indicator of the ‘serviceemphasis’ in its welfare state. On the basis of these three indicators and with datafor 1990 and 1997, Kautto identified three groups of countries as follows (op. cit., p.62):
s A ‘service approach’ group characterised by high service effort, and average or high transfer effort (Sweden, Denmark, Norway, Finland and — by 1997 —Germany and the UK);
s A ‘transfer approach’ group characterised by high transfer effort, average or low service effort and low service emphasis (Belgium, the Netherlands. Austriaand Italy);
s A third group characterised by low service effort and low transfer effort (Ireland,Greece, Portugal and Spain).
This characterisation of Ireland solely on the basis of GDP ratios and withoutreference to service emphasis or degree of reliance on means-testing can beimproved on. Table 4.1 uses data for 1993 and 2001 and presents the indicators of‘service effort’ and ‘transfer effort’ for fourteen EU member states.4
Several points are worth noting in Table 4.1.
i. No country — in either year — devoted a greater proportion of its GDP toproviding services than to providing cash benefits.
ii. In 1993, the three Nordic countries had the highest levels of ‘service effort’,followed by France and the United Kingdom. By 2001, the picture had becomemore diverse. France, the United Kingdom and Greece had overtaken Finland,while Sweden and Denmark retained the top two rankings.
96
2. Benefits in kind are benefits granted in the form of goods or services. They may be provided directly or by way of reimbursement.Direct provision refers to a good or service granted to meet a social need or help avoid a social risk and for which the full cost is notcharged (public health services, access to housing, access to public transport, etc.). A reimbursement is a benefit that compensateswholly or in part for certified expenditures made on specified goods or services (e.g. the Drugs Payment Scheme in Ireland). Cashbenefits include all income supports — periodic payments and lump sums, contributory, means-tested and universal — which aresupporting individuals or households experiencing need or at risk of doing so. For the full definitions see Esspros Manual (1996).
3. The analysis here also incorporates the data on means-testing, not used in Kautto, op. cit.
4. The social protection expenditures are analysed net of administration costs and other miscellaneous items.
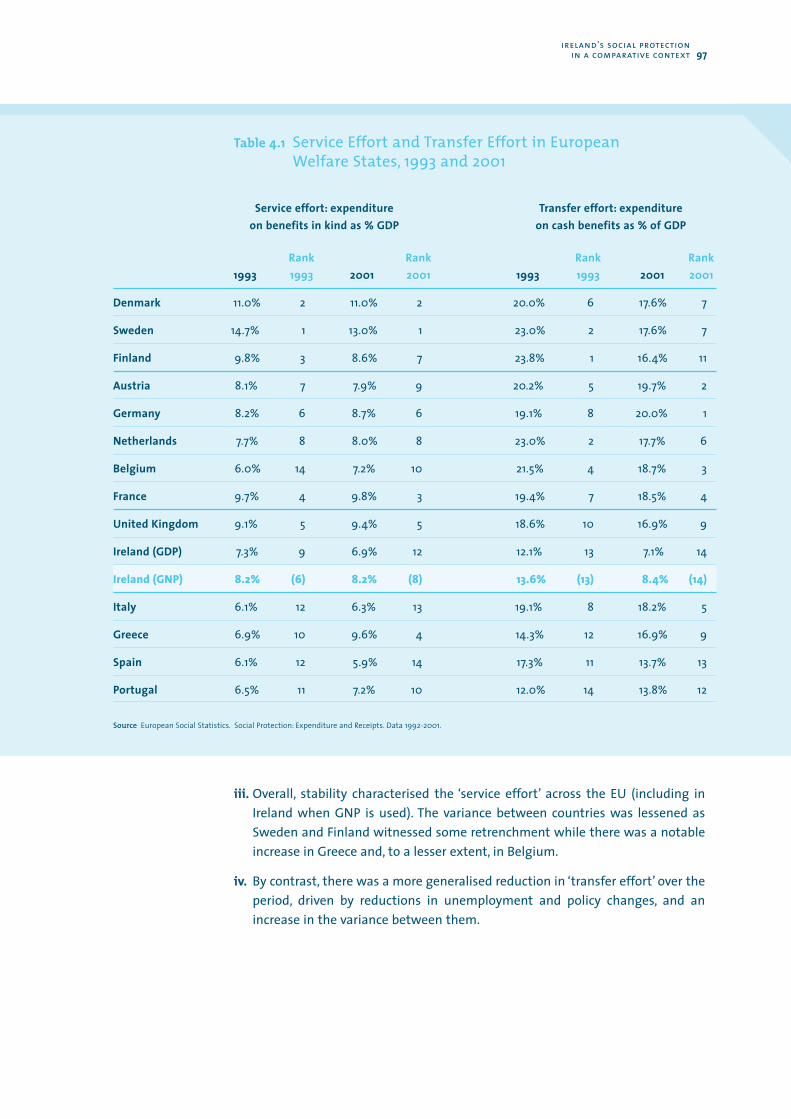
iii. Overall, stability characterised the ‘service effort’ across the EU (including inIreland when GNP is used). The variance between countries was lessened asSweden and Finland witnessed some retrenchment while there was a notableincrease in Greece and, to a lesser extent, in Belgium.
iv. By contrast, there was a more generalised reduction in ‘transfer effort’ over theperiod, driven by reductions in unemployment and policy changes, and anincrease in the variance between them.
ireland’s social protection in a comparative context 97
Table 4.1 Service Effort and Transfer Effort in European Welfare States, 1993 and 2001
Service effort: expenditure Transfer effort: expenditure on benefits in kind as % GDP on cash benefits as % of GDP
Rank Rank Rank Rank1993 1993 2001 2001 1993 1993 2001 2001
Denmark 11.0% 2 11.0% 2 20.0% 6 17.6% 7
Sweden 14.7% 1 13.0% 1 23.0% 2 17.6% 7
Finland 9.8% 3 8.6% 7 23.8% 1 16.4% 11
Austria 8.1% 7 7.9% 9 20.2% 5 19.7% 2
Germany 8.2% 6 8.7% 6 19.1% 8 20.0% 1
Netherlands 7.7% 8 8.0% 8 23.0% 2 17.7% 6
Belgium 6.0% 14 7.2% 10 21.5% 4 18.7% 3
France 9.7% 4 9.8% 3 19.4% 7 18.5% 4
United Kingdom 9.1% 5 9.4% 5 18.6% 10 16.9% 9
Ireland (GDP) 7.3% 9 6.9% 12 12.1% 13 7.1% 14
Ireland (GNP) 8.2% (6) 8.2% (8) 13.6% (13) 8.4% (14)
Italy 6.1% 12 6.3% 13 19.1% 8 18.2% 5
Greece 6.9% 10 9.6% 4 14.3% 12 16.9% 9
Spain 6.1% 12 5.9% 14 17.3% 11 13.7% 13
Portugal 6.5% 11 7.2% 10 12.0% 14 13.8% 12
Source European Social Statistics. Social Protection: Expenditure and Receipts. Data 1992-2001.
v. In 1993, the two highest levels of ‘transfer effort’ were also in Scandinavia, viz.,Finland and Sweden, with the Netherlands in third place. By 2001, differentialreductions in unemployment and policy changes combined to alter therankings quite considerably – countries in the Continental European groupoccupied the top positions and the top three in 1993 had middle rankings.
vi. Only Greece significantly increased its ‘transfer effort’ over the period; in themajority of countries (excepting Portugal, Germany and Austria), there was asignificant reduction with Ireland posting a particularly large decrease.In fact, by 2001, Ireland was the only country where its respective levels ofspending (as a proportion of GNP) on cash benefits and benefits in kind were ofa similar magnitude.
Service emphasis and means-testing
The indicator of ‘service emphasis’ (expenditure on benefits in kind as a percentageof total social protection expenditure) and a measure of the degree of reliance on means-testing (expenditure on means-tested cash benefits andbenefits in kind as a percentage of total social protection expenditure) arepresented in Table 4.2. The top three countries on ‘service emphasis’ are the samein 1993 and 2001, viz., Sweden and Denmark and, somewhat surprisingly, Ireland.Over the eight years, there was either little change in ‘service emphasis’(4 countries) or clear growth, with Ireland leading the way (an increase of 11percentage points); expressed the other way around, no country registered anincrease in ‘transfer emphasis’.
At both the beginning and the end of the period, Ireland is exceptional for the highproportion of its social protection expenditure which is means-tested. The degreeof reliance — 24.5 per cent of all social protection expenditure was means-testedin 2001 — was more than nine times greater than in the country which leastresorted to it (Belgium) and ahead of the United Kingdom, the second heaviestuser of means-testing, by a full nine percentage points. It did not notably decreasein Ireland over the eight years to 2001. Countries with very low degrees of relianceon means-testing (below 5 per cent) are found in each of the ‘welfare families’other than the Anglo-Saxon one, viz., Denmark and Sweden, Belgium, and Italy.
4.2.2 Differences in taxation structures
The levying of tax has important functions other than funding the welfare state,many of which (running the civil service, defence, building physical infrastructuresin the national interest, education, etc.) predate by far its advent in the late 19thcentury. However, especially since the 1960s, the welfare state has assumed sucha major role in public consumption that its requirements have exercised a majorinfluence on the level and manner in which states raise tax revenue. Increases inthe tax-to-GDP ratio in many European countries up to the early 1990s can beexplained primarily by the need to finance social welfare commitments (inpensions, health care, etc.). While this study is not concerned with a detailed studyof taxation, some stylised facts about the structure of national taxation systems asthey appear to accompany different types of welfare state are briefly presented.Some of them can fairly be argued as integral to the level and nature of socialprotection that countries choose to provide.
98
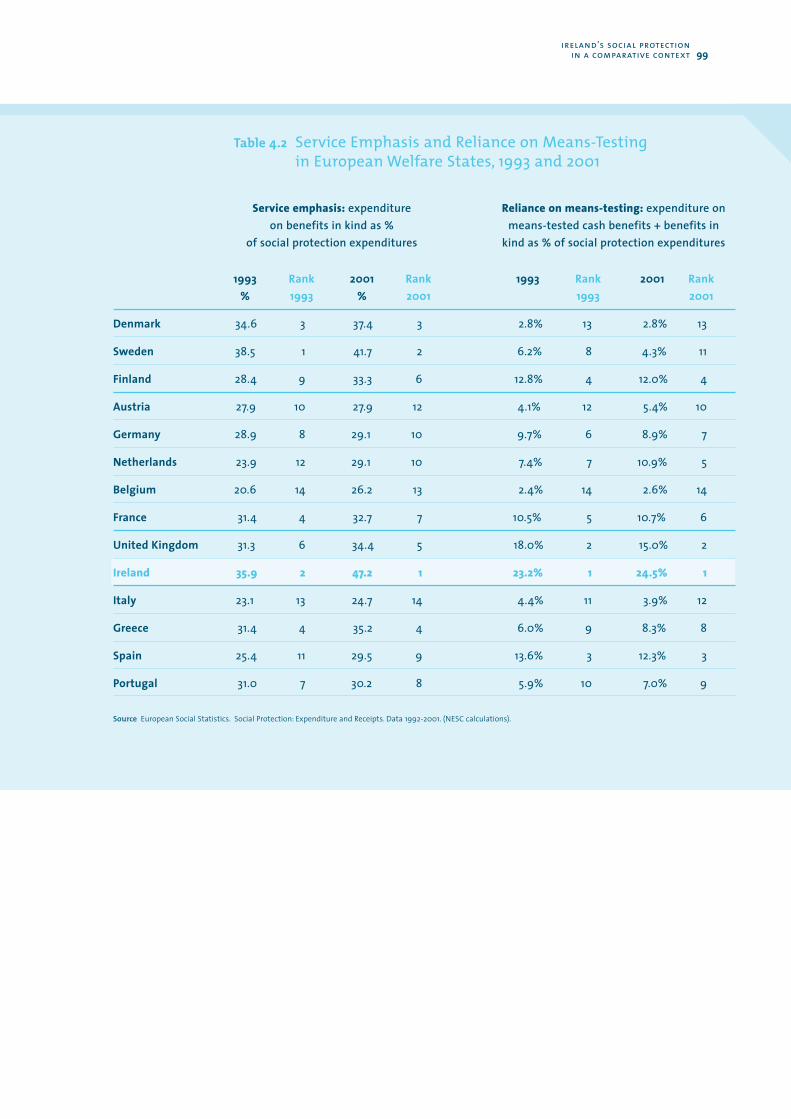
ireland’s social protection in a comparative context 99
Table 4.2 Service Emphasis and Reliance on Means-Testing in European Welfare States, 1993 and 2001
Service emphasis: expenditure Reliance on means-testing: expenditure onon benefits in kind as % means-tested cash benefits + benefits in
of social protection expenditures kind as % of social protection expenditures
1993 Rank 2001 Rank 1993 Rank 2001 Rank% 1993 % 2001 1993 2001
Denmark 34.6 3 37.4 3 2.8% 13 2.8% 13
Sweden 38.5 1 41.7 2 6.2% 8 4.3% 11
Finland 28.4 9 33.3 6 12.8% 4 12.0% 4
Austria 27.9 10 27.9 12 4.1% 12 5.4% 10
Germany 28.9 8 29.1 10 9.7% 6 8.9% 7
Netherlands 23.9 12 29.1 10 7.4% 7 10.9% 5
Belgium 20.6 14 26.2 13 2.4% 14 2.6% 14
France 31.4 4 32.7 7 10.5% 5 10.7% 6
United Kingdom 31.3 6 34.4 5 18.0% 2 15.0% 2
Ireland 35.9 2 47.2 1 23.2% 1 24.5% 1
Italy 23.1 13 24.7 14 4.4% 11 3.9% 12
Greece 31.4 4 35.2 4 6.0% 9 8.3% 8
Spain 25.4 11 29.5 9 13.6% 3 12.3% 3
Portugal 31.0 7 30.2 8 5.9% 10 7.0% 9
Source European Social Statistics. Social Protection: Expenditure and Receipts. Data 1992-2001. (NESC calculations).
The brief evocation of the differences in the structures of taxation systems, whichaccompany different welfare states, presented below uses the estimates of implicittax rates in EU member states calculated by the European Commission (EuropeanCommission, 2004). These rates provide approximate answers to the question asto what shares, in effect, of the spending of consumers, of the income of labourand of the income of capital are taken in tax revenue. The methodology employeduses solely macro-economic data. The numerators aggregate all tax revenueswhich can reasonably be attributed to, respectively, the activity of spending, theexercise of labour and the employment of capital; the denominators use nationalaccounts data to form an estimate of the total potential base the economy inquestion provided for each set of taxes. This approach, as all alternatives, is farfrom fool proof and requires reasoned assumptions at several stages. The implicittax rates calculated for corporation income, for example, may bear littleresemblance to countries’ statutory corporate tax rates, but it is well known thatstatutory tax rates are a poor guide to effective tax rates as corporation tax codestypically contain depreciation allowances, credits of different sorts, rules foroffsetting losses, etc. It is possible, for example, for reductions in high profile taxrates to be accompanied by an increase in implicit tax rates if the former areaccompanied by reductions in tax allowances and reliefs, which mean that thelower rates are applied to wider tax bases.
Table 4.3 presents the implicit tax rates on consumption and labour for fourteenEU member states. It is immediately clear that the Nordic group is to the fore intaxing consumption. The already high rates in Denmark and Sweden in 1995 hadincreased further by 2002 and remained stable in Finland. Ireland has consistentlybeen in fourth position; stability rather than growth characterised its implicit taxrate on consumption over the eight years in question.
Two members of the Nordic family (Sweden and Finland) and two of theContinental European one (Belgium and France) lead the way in taxing the incomeof labour. The remaining Nordic state, Denmark, is in fifth position because its lowsocial contributions offset to some degree its high income taxes. The ‘Anglo-Saxon’duo stand out for having particularly low implicit tax rates on labour and a full fourpercentage points (in 2002) separated second placed Ireland from Spain, thecountry with the third lowest implicit tax on labour. Some convergence isapparent across the welfare families in this instance with the implicit tax rate onlabour rising in Southern Europe, showing little change in Continental Europe andfalling in Scandinavia over the period, 1995-2002. Quite exceptionally, althoughIreland already had the third lowest rate in 1995, this dropped by four percentagepoints by 2002, a significantly greater fall than recorded elsewhere in the EU 15.
Implicit tax rates on capital are particularly difficult to estimate in a standardisedway across countries; they are complex aggregate indicators and the interpreta-tion of trends in them is far from straightforward. They attempt to divideaggregate tax revenues on capital by a measure of potentially taxable capital andbusiness income in the economy (whether received by corporations, households,
100
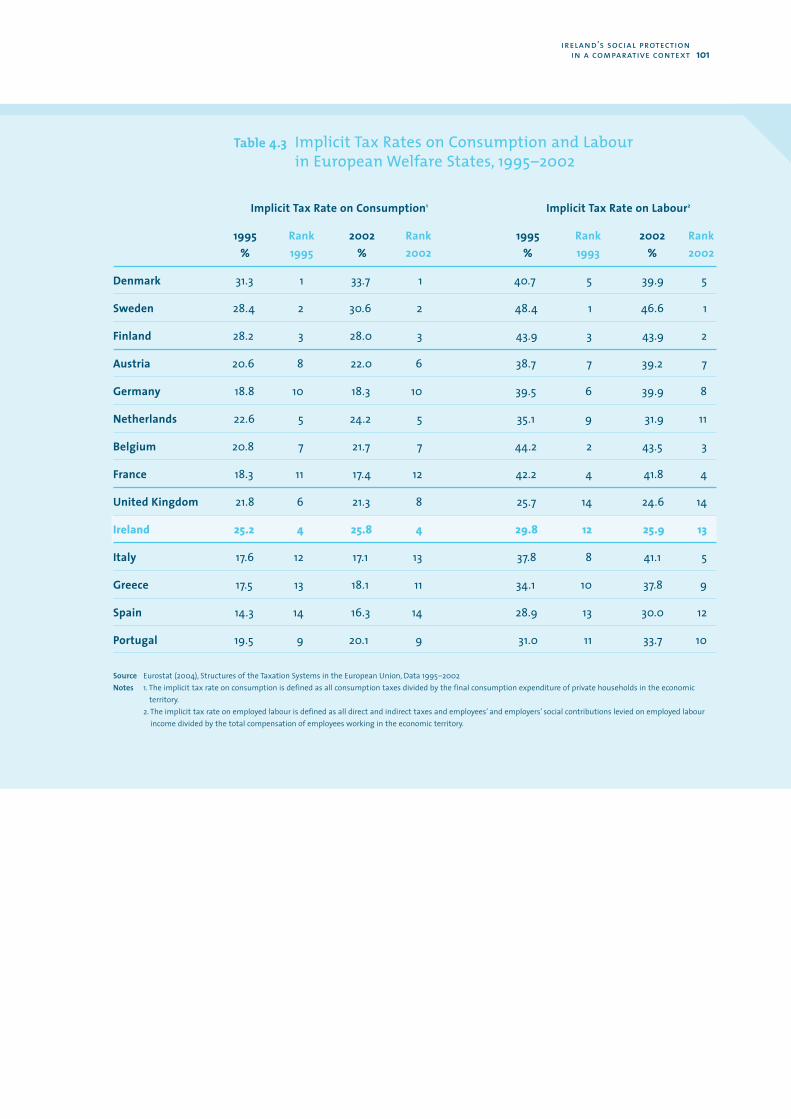
ireland’s social protection in a comparative context 101
Table 4.3 Implicit Tax Rates on Consumption and Labour in European Welfare States, 1995–2002
Implicit Tax Rate on Consumption1 Implicit Tax Rate on Labour2
1995 Rank 2002 Rank 1995 Rank 2002 Rank% 1995 % 2002 % 1993 % 2002
Denmark 31.3 1 33.7 1 40.7 5 39.9 5
Sweden 28.4 2 30.6 2 48.4 1 46.6 1
Finland 28.2 3 28.0 3 43.9 3 43.9 2
Austria 20.6 8 22.0 6 38.7 7 39.2 7
Germany 18.8 10 18.3 10 39.5 6 39.9 8
Netherlands 22.6 5 24.2 5 35.1 9 31.9 11
Belgium 20.8 7 21.7 7 44.2 2 43.5 3
France 18.3 11 17.4 12 42.2 4 41.8 4
United Kingdom 21.8 6 21.3 8 25.7 14 24.6 14
Ireland 25.2 4 25.8 4 29.8 12 25.9 13
Italy 17.6 12 17.1 13 37.8 8 41.1 5
Greece 17.5 13 18.1 11 34.1 10 37.8 9
Spain 14.3 14 16.3 14 28.9 13 30.0 12
Portugal 19.5 9 20.1 9 31.0 11 33.7 10
Source Eurostat (2004), Structures of the Taxation Systems in the European Union, Data 1995–2002Notes 1. The implicit tax rate on consumption is defined as all consumption taxes divided by the final consumption expenditure of private households in the economic
territory.2. The implicit tax rate on employed labour is defined as all direct and indirect taxes and employees’ and employers’ social contributions levied on employed labour
income divided by the total compensation of employees working in the economic territory.
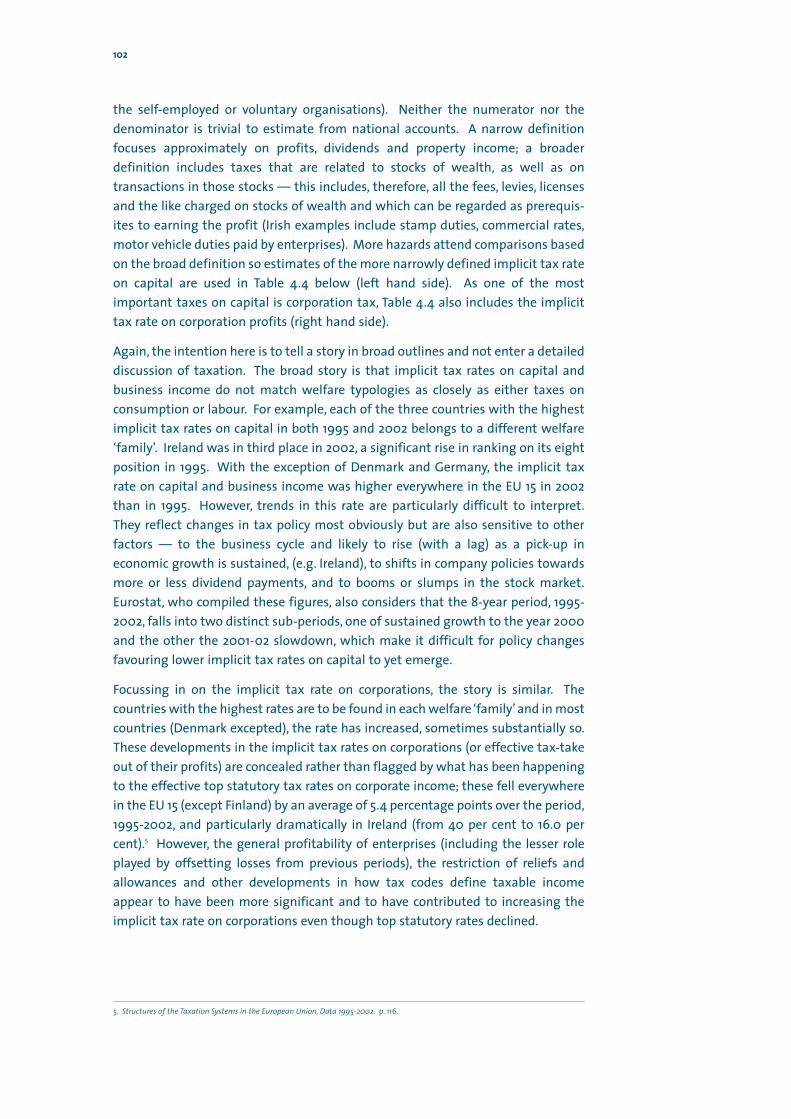
the self-employed or voluntary organisations). Neither the numerator nor thedenominator is trivial to estimate from national accounts. A narrow definitionfocuses approximately on profits, dividends and property income; a broaderdefinition includes taxes that are related to stocks of wealth, as well as ontransactions in those stocks — this includes, therefore, all the fees, levies, licensesand the like charged on stocks of wealth and which can be regarded as prerequis-ites to earning the profit (Irish examples include stamp duties, commercial rates,motor vehicle duties paid by enterprises). More hazards attend comparisons basedon the broad definition so estimates of the more narrowly defined implicit tax rateon capital are used in Table 4.4 below (left hand side). As one of the mostimportant taxes on capital is corporation tax, Table 4.4 also includes the implicittax rate on corporation profits (right hand side).
Again, the intention here is to tell a story in broad outlines and not enter a detaileddiscussion of taxation. The broad story is that implicit tax rates on capital andbusiness income do not match welfare typologies as closely as either taxes onconsumption or labour. For example, each of the three countries with the highestimplicit tax rates on capital in both 1995 and 2002 belongs to a different welfare‘family’. Ireland was in third place in 2002, a significant rise in ranking on its eightposition in 1995. With the exception of Denmark and Germany, the implicit taxrate on capital and business income was higher everywhere in the EU 15 in 2002than in 1995. However, trends in this rate are particularly difficult to interpret.They reflect changes in tax policy most obviously but are also sensitive to otherfactors — to the business cycle and likely to rise (with a lag) as a pick-up ineconomic growth is sustained, (e.g. Ireland), to shifts in company policies towardsmore or less dividend payments, and to booms or slumps in the stock market.Eurostat, who compiled these figures, also considers that the 8-year period, 1995-2002, falls into two distinct sub-periods, one of sustained growth to the year 2000and the other the 2001-02 slowdown, which make it difficult for policy changesfavouring lower implicit tax rates on capital to yet emerge.
Focussing in on the implicit tax rate on corporations, the story is similar. Thecountries with the highest rates are to be found in each welfare ‘family’ and in mostcountries (Denmark excepted), the rate has increased, sometimes substantially so.These developments in the implicit tax rates on corporations (or effective tax-takeout of their profits) are concealed rather than flagged by what has been happeningto the effective top statutory tax rates on corporate income; these fell everywherein the EU 15 (except Finland) by an average of 5.4 percentage points over the period,1995-2002, and particularly dramatically in Ireland (from 40 per cent to 16.0 percent).5 However, the general profitability of enterprises (including the lesser roleplayed by offsetting losses from previous periods), the restriction of reliefs andallowances and other developments in how tax codes define taxable incomeappear to have been more significant and to have contributed to increasing theimplicit tax rate on corporations even though top statutory rates declined.
102
5. Structures of the Taxation Systems in the European Union, Data 1995-2002. p. 116.
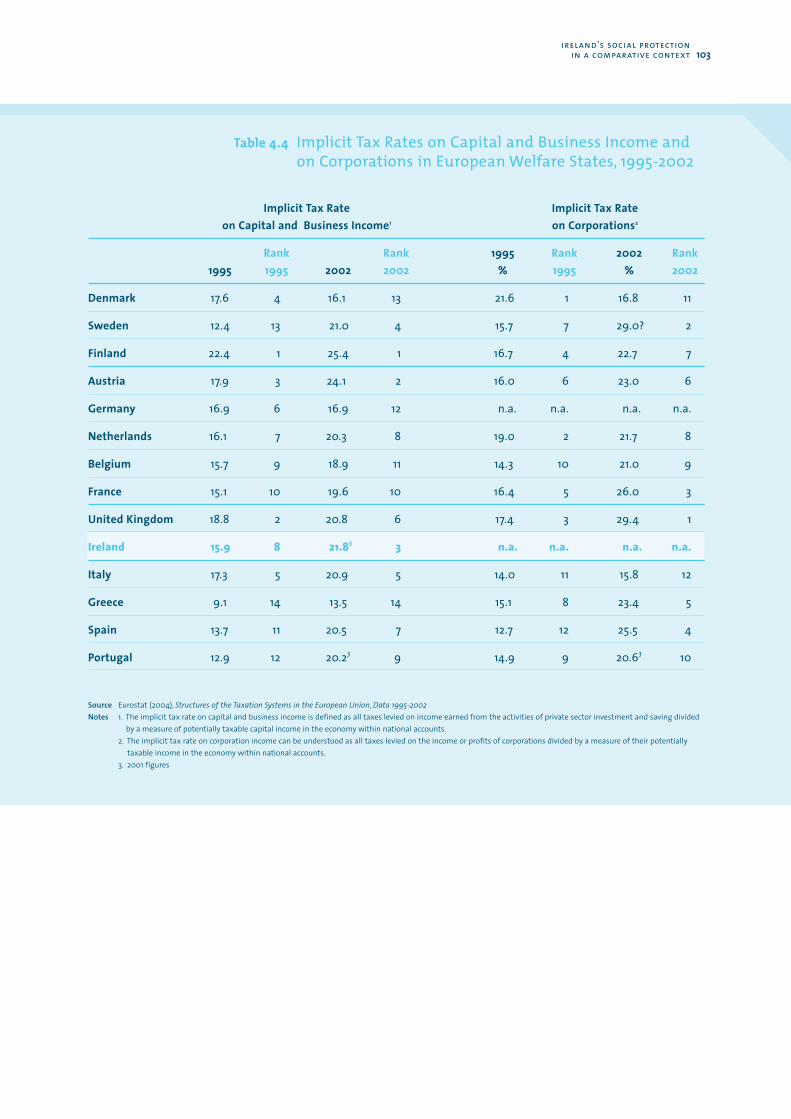
ireland’s social protection in a comparative context 103
Table 4.4 Implicit Tax Rates on Capital and Business Income andon Corporations in European Welfare States, 1995-2002
Implicit Tax Rate Implicit Tax Rate on Capital and Business Income1 on Corporations2
Rank Rank 1995 Rank 2002 Rank1995 1995 2002 2002 % 1995 % 2002
Denmark 17.6 4 16.1 13 21.6 1 16.8 11
Sweden 12.4 13 21.0 4 15.7 7 29.0? 2
Finland 22.4 1 25.4 1 16.7 4 22.7 7
Austria 17.9 3 24.1 2 16.0 6 23.0 6
Germany 16.9 6 16.9 12 n.a. n.a. n.a. n.a.
Netherlands 16.1 7 20.3 8 19.0 2 21.7 8
Belgium 15.7 9 18.9 11 14.3 10 21.0 9
France 15.1 10 19.6 10 16.4 5 26.0 3
United Kingdom 18.8 2 20.8 6 17.4 3 29.4 1
Ireland 15.9 8 21.83 3 n.a. n.a. n.a. n.a.
Italy 17.3 5 20.9 5 14.0 11 15.8 12
Greece 9.1 14 13.5 14 15.1 8 23.4 5
Spain 13.7 11 20.5 7 12.7 12 25.5 4
Portugal 12.9 12 20.23 9 14.9 9 20.63 10
Source Eurostat (2004), Structures of the Taxation Systems in the European Union, Data 1995-2002Notes 1. The implicit tax rate on capital and business income is defined as all taxes levied on income earned from the activities of private sector investment and saving divided
by a measure of potentially taxable capital income in the economy within national accounts.2. The implicit tax rate on corporation income can be understood as all taxes levied on the income or profits of corporations divided by a measure of their potentially
taxable income in the economy within national accounts.3. 2001 figures
4.2.3 Ireland’s differences summarised
In summary, Ireland’s welfare state — by EU 15 standards — is characterised by amoderate to low ‘effort’ in providing services (the ranking here is sensitive tochoice of GDP or GNP) and a very low ‘effort’ in providing transfers (this ranking is insensitive). The reasons why Ireland has low ratios of social spending toGDP/GNP relative to other EU countries are explored in the next section. Whatmay be less widely appreciated is that Ireland, consistently during the 1990s, hashad a relatively strong emphasis on services within its social spending (thoughTable 3.1 was, in fact, already evidence of this). This reflects two principal factors,the country’s low level of spending on pensions and the dominance of spending onhealth. In 1993, and by a much wider margin in 2001, spending in Ireland on thesickness/health care function as a proportion all social protection expenditure washigher than anywhere else in the EU 156. The most unusual characteristic ofIreland’s welfare state in a comparative context, however, is its high degree ofreliance on means-testing (whether of cash transfers or services). Ireland’s welfarestate is also associated with a taxation structure that is light on labour by EU 15standards and rests significantly on consumption. For example, taxes on labouraccounted for 38 per cent of total tax receipts in Ireland over the period, 1995-2002,as against an EU average of 51 per cent; taxes on consumption contributed 38.5 percent of total tax receipts as against an EU norm of 28 per cent (EuropeanCommission, 2004: 276). Ireland also has a tax-take out of capital and businessincome that has grown significantly during its economic boom and is relativelyhigh by the standards of the EU 15. In fact, Ireland relies on corporate income taxesfor its tax receipts more than most other EU member states; they contributed 10.8per cent of total tax receipts over the 1995-2002 period on average, as against 7.0per cent in the EU 15 as a whole (op. cit. 284).
4.3 The Adequacy of Public Social Spending in Ireland
There is a lively interest in the question as to whether social spending in Ireland iscurrently at — or below — the level appropriate to the country’s means and thepopulation’s needs (e.g. O’Reardon, 2004; Timonen, 2004, 2003; Lawlor &McCarthy, 2003; de Buitleir & McArdle, 2003; Healy and Reynolds, eds., 2002 and1998). There is a lack of agreement, variously, over what the evidence is, how itshould be interpreted, and whether and under what conditions higher public socialspending would be effective in procuring a sufficiently commensurateimprovement in outcomes. This section explores these issues. Ireland’s socialspending is examined in three contexts — the country’s own recent historicalcontext (since the start of the current partnership period, 1986), the EU 15 contextas presented by Eurostat, and the OECD context as elucidated by a frameworkdesigned by that Organisation to capture the diverse forms that social spendingtakes in advanced industrial countries.
104
6. In 1993, expenditure on the function Sickness/Health Care was 34.8 per cent of all social protection expenditure in Ireland as againstan EU 15 average of 28 per cent; by 2001, it was 43.4 per cent in Ireland as against an EU 15 average of 28 per cent. (European SocialStatistics. Social Protection: Expenditure and Receipts. Data 1992-2001).
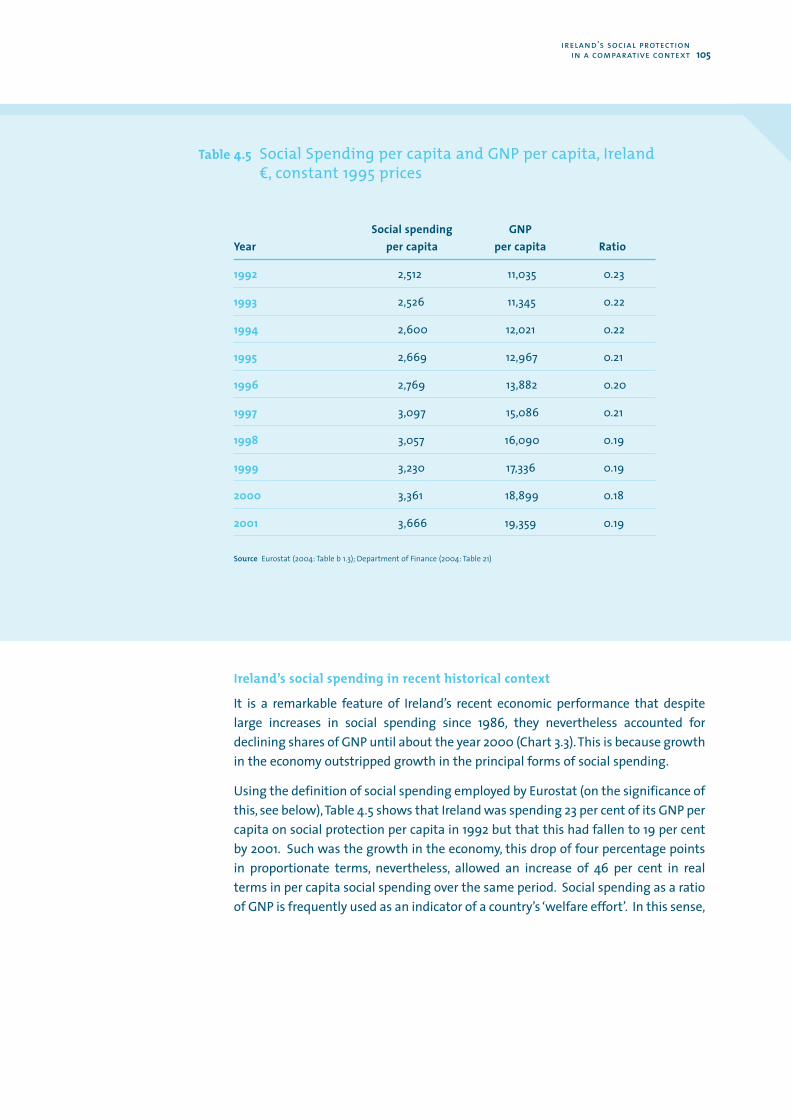
Ireland’s social spending in recent historical context
It is a remarkable feature of Ireland’s recent economic performance that despitelarge increases in social spending since 1986, they nevertheless accounted fordeclining shares of GNP until about the year 2000 (Chart 3.3).This is because growthin the economy outstripped growth in the principal forms of social spending.
Using the definition of social spending employed by Eurostat (on the significance ofthis, see below),Table 4.5 shows that Ireland was spending 23 per cent of its GNP percapita on social protection per capita in 1992 but that this had fallen to 19 per centby 2001. Such was the growth in the economy, this drop of four percentage pointsin proportionate terms, nevertheless, allowed an increase of 46 per cent in realterms in per capita social spending over the same period. Social spending as a ratioof GNP is frequently used as an indicator of a country’s ‘welfare effort’. In this sense,
ireland’s social protection in a comparative context 105
Social spending GNPYear per capita per capita Ratio
1992 2,512 11,035 0.23
1993 2,526 11,345 0.22
1994 2,600 12,021 0.22
1995 2,669 12,967 0.21
1996 2,769 13,882 0.20
1997 3,097 15,086 0.21
1998 3,057 16,090 0.19
1999 3,230 17,336 0.19
2000 3,361 18,899 0.18
2001 3,666 19,359 0.19
Source Eurostat (2004: Table b 1.3); Department of Finance (2004: Table 21)
Table 4.5 Social Spending per capita and GNP per capita, Irelandd, constant 1995 prices
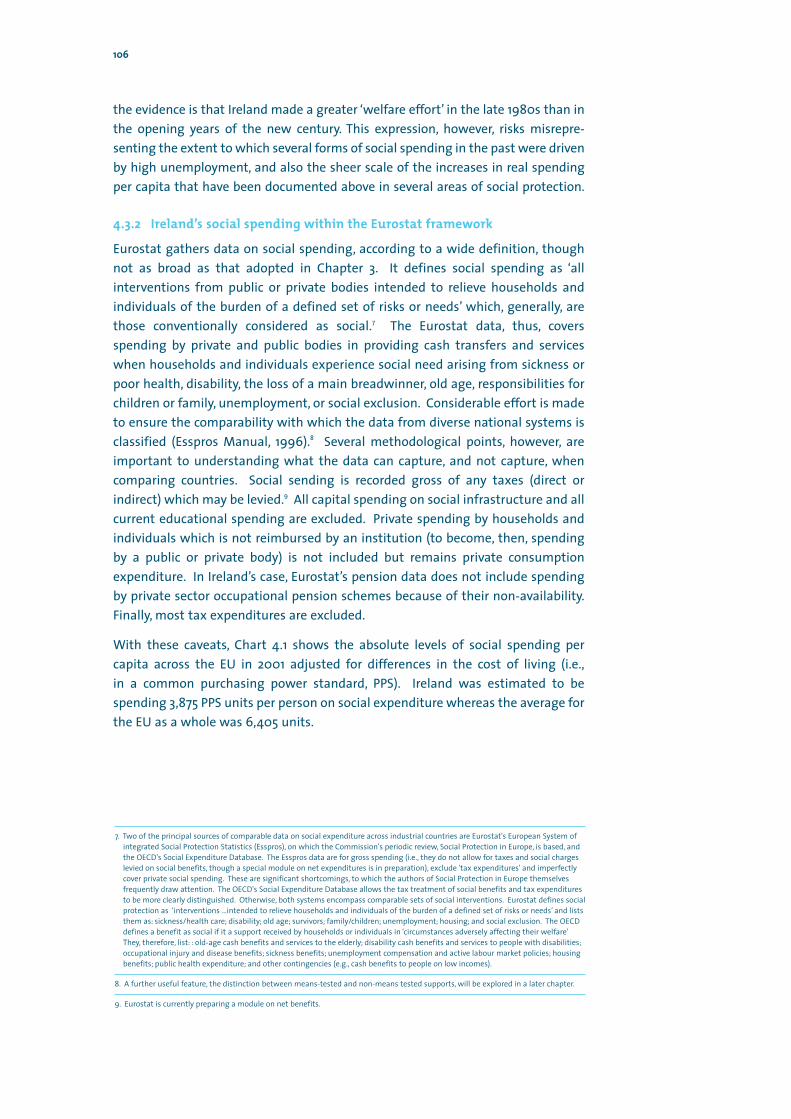
the evidence is that Ireland made a greater ‘welfare effort’ in the late 1980s than inthe opening years of the new century. This expression, however, risks misrepre-senting the extent to which several forms of social spending in the past were drivenby high unemployment, and also the sheer scale of the increases in real spendingper capita that have been documented above in several areas of social protection.
4.3.2 Ireland’s social spending within the Eurostat framework
Eurostat gathers data on social spending, according to a wide definition, thoughnot as broad as that adopted in Chapter 3. It defines social spending as ‘allinterventions from public or private bodies intended to relieve households andindividuals of the burden of a defined set of risks or needs’ which, generally, arethose conventionally considered as social.7 The Eurostat data, thus, coversspending by private and public bodies in providing cash transfers and serviceswhen households and individuals experience social need arising from sickness orpoor health, disability, the loss of a main breadwinner, old age, responsibilities forchildren or family, unemployment, or social exclusion. Considerable effort is madeto ensure the comparability with which the data from diverse national systems isclassified (Esspros Manual, 1996).8 Several methodological points, however, areimportant to understanding what the data can capture, and not capture, whencomparing countries. Social sending is recorded gross of any taxes (direct orindirect) which may be levied.9 All capital spending on social infrastructure and allcurrent educational spending are excluded. Private spending by households andindividuals which is not reimbursed by an institution (to become, then, spendingby a public or private body) is not included but remains private consumptionexpenditure. In Ireland’s case, Eurostat’s pension data does not include spendingby private sector occupational pension schemes because of their non-availability.Finally, most tax expenditures are excluded.
With these caveats, Chart 4.1 shows the absolute levels of social spending percapita across the EU in 2001 adjusted for differences in the cost of living (i.e.,in a common purchasing power standard, PPS). Ireland was estimated to bespending 3,875 PPS units per person on social expenditure whereas the average forthe EU as a whole was 6,405 units.
106
7. Two of the principal sources of comparable data on social expenditure across industrial countries are Eurostat's European System ofintegrated Social Protection Statistics (Esspros), on which the Commission's periodic review, Social Protection in Europe, is based, andthe OECD's Social Expenditure Database. The Esspros data are for gross spending (i.e., they do not allow for taxes and social chargeslevied on social benefits, though a special module on net expenditures is in preparation), exclude 'tax expenditures' and imperfectlycover private social spending. These are significant shortcomings, to which the authors of Social Protection in Europe themselvesfrequently draw attention. The OECD's Social Expenditure Database allows the tax treatment of social benefits and tax expendituresto be more clearly distinguished. Otherwise, both systems encompass comparable sets of social interventions. Eurostat defines socialprotection as ‘interventions …intended to relieve households and individuals of the burden of a defined set of risks or needs’ and liststhem as: sickness/health care; disability; old age; survivors; family/children; unemployment; housing; and social exclusion. The OECDdefines a benefit as social if it a support received by households or individuals in ‘circumstances adversely affecting their welfare’They, therefore, list: : old-age cash benefits and services to the elderly; disability cash benefits and services to people with disabilities;occupational injury and disease benefits; sickness benefits; unemployment compensation and active labour market policies; housingbenefits; public health expenditure; and other contingencies (e.g., cash benefits to people on low incomes).
8. A further useful feature, the distinction between means-tested and non-means tested supports, will be explored in a later chapter.
9. Eurostat is currently preparing a module on net benefits.
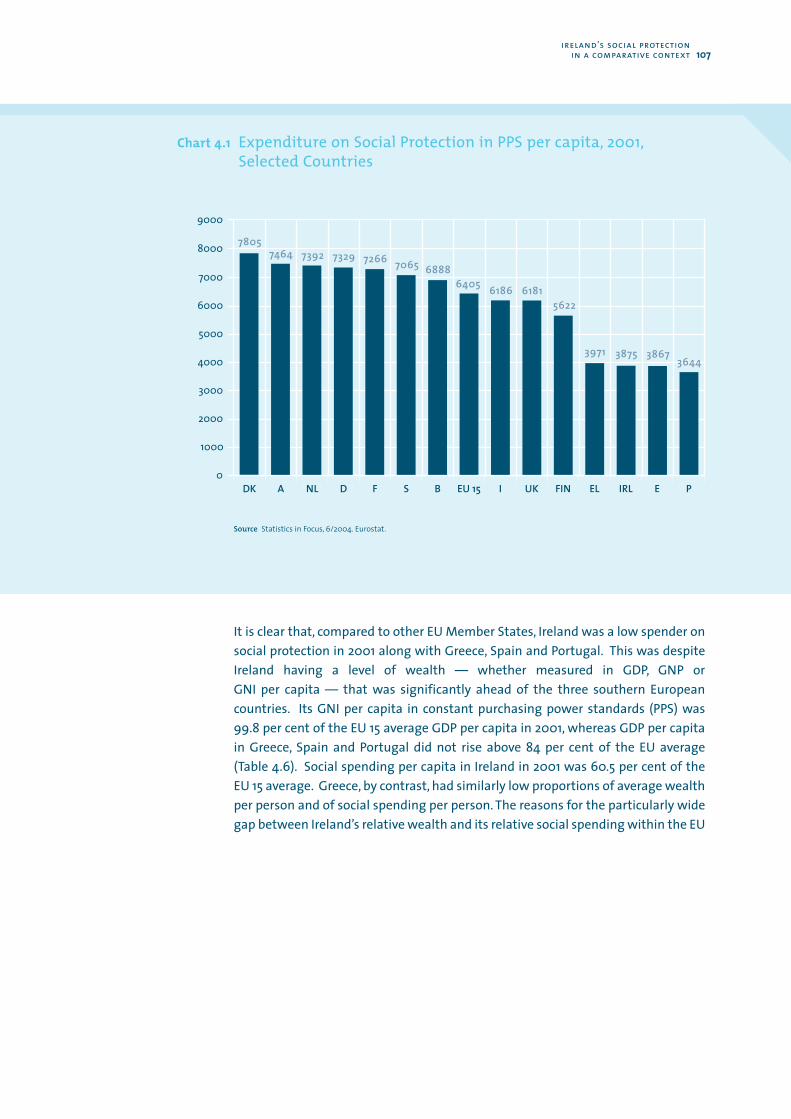
It is clear that, compared to other EU Member States, Ireland was a low spender onsocial protection in 2001 along with Greece, Spain and Portugal. This was despiteIreland having a level of wealth — whether measured in GDP, GNP or GNI per capita — that was significantly ahead of the three southern Europeancountries. Its GNI per capita in constant purchasing power standards (PPS) was99.8 per cent of the EU 15 average GDP per capita in 2001, whereas GDP per capitain Greece, Spain and Portugal did not rise above 84 per cent of the EU average(Table 4.6). Social spending per capita in Ireland in 2001 was 60.5 per cent of theEU 15 average. Greece, by contrast, had similarly low proportions of average wealthper person and of social spending per person. The reasons for the particularly widegap between Ireland’s relative wealth and its relative social spending within the EU
ireland’s social protection in a comparative context 107
Chart 4.1 Expenditure on Social Protection in PPS per capita, 2001,Selected Countries
7000
6000
5000
4000
3000
2000
1000
0
8000
9000
Source Statistics in Focus, 6/2004. Eurostat.
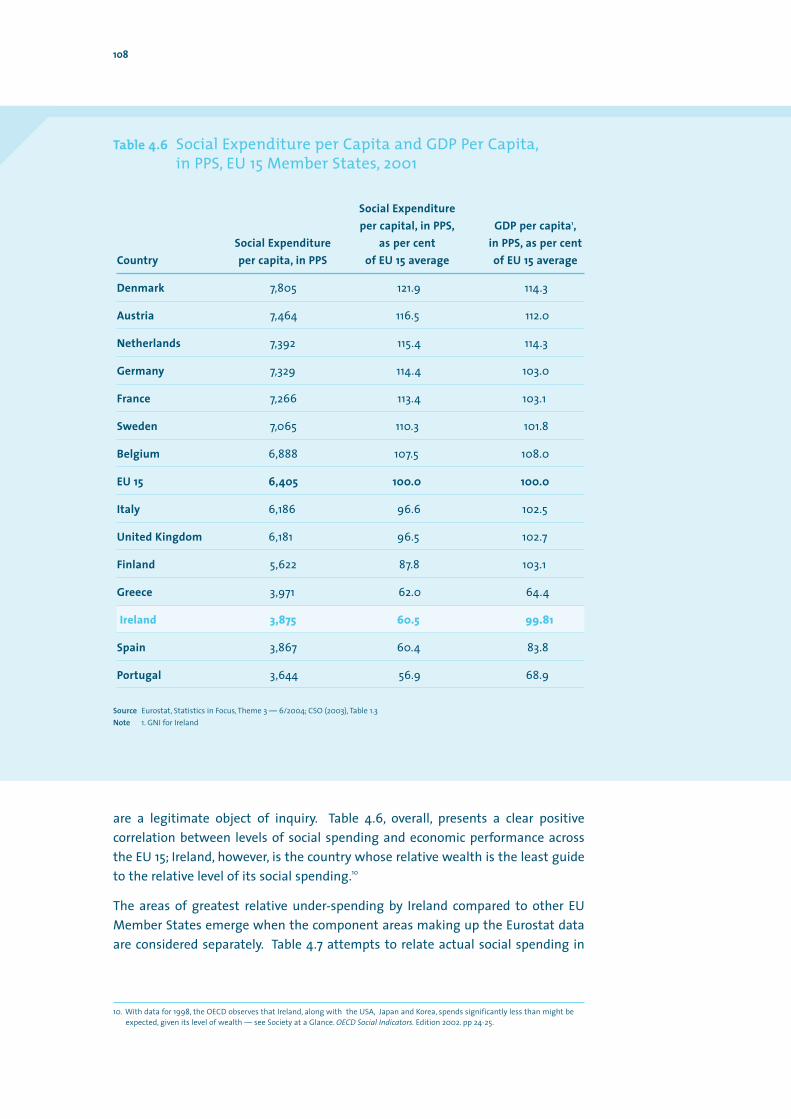
108
are a legitimate object of inquiry. Table 4.6, overall, presents a clear positivecorrelation between levels of social spending and economic performance acrossthe EU 15; Ireland, however, is the country whose relative wealth is the least guideto the relative level of its social spending.10
The areas of greatest relative under-spending by Ireland compared to other EUMember States emerge when the component areas making up the Eurostat dataare considered separately. Table 4.7 attempts to relate actual social spending in
10. With data for 1998, the OECD observes that Ireland, along with the USA, Japan and Korea, spends significantly less than might beexpected, given its level of wealth — see Society at a Glance. OECD Social Indicators. Edition 2002. pp 24-25.
Table 4.6 Social Expenditure per Capita and GDP Per Capita,in PPS, EU 15 Member States, 2001
Social Expenditure per capital, in PPS, GDP per capita1,
Social Expenditure as per cent in PPS, as per centCountry per capita, in PPS of EU 15 average of EU 15 average
Denmark 7,805 121.9 114.3
Austria 7,464 116.5 112.0
Netherlands 7,392 115.4 114.3
Germany 7,329 114.4 103.0
France 7,266 113.4 103.1
Sweden 7,065 110.3 101.8
Belgium 6,888 107.5 108.0
EU 15 6,405 100.0 100.0
Italy 6,186 96.6 102.5
United Kingdom 6,181 96.5 102.7
Finland 5,622 87.8 103.1
Greece 3,971 62.0 64.4
Ireland 3,875 60.5 99.81
Spain 3,867 60.4 83.8
Portugal 3,644 56.9 68.9
Source Eurostat, Statistics in Focus, Theme 3 — 6/2004; CSO (2003), Table 1.3Note 1. GNI for Ireland
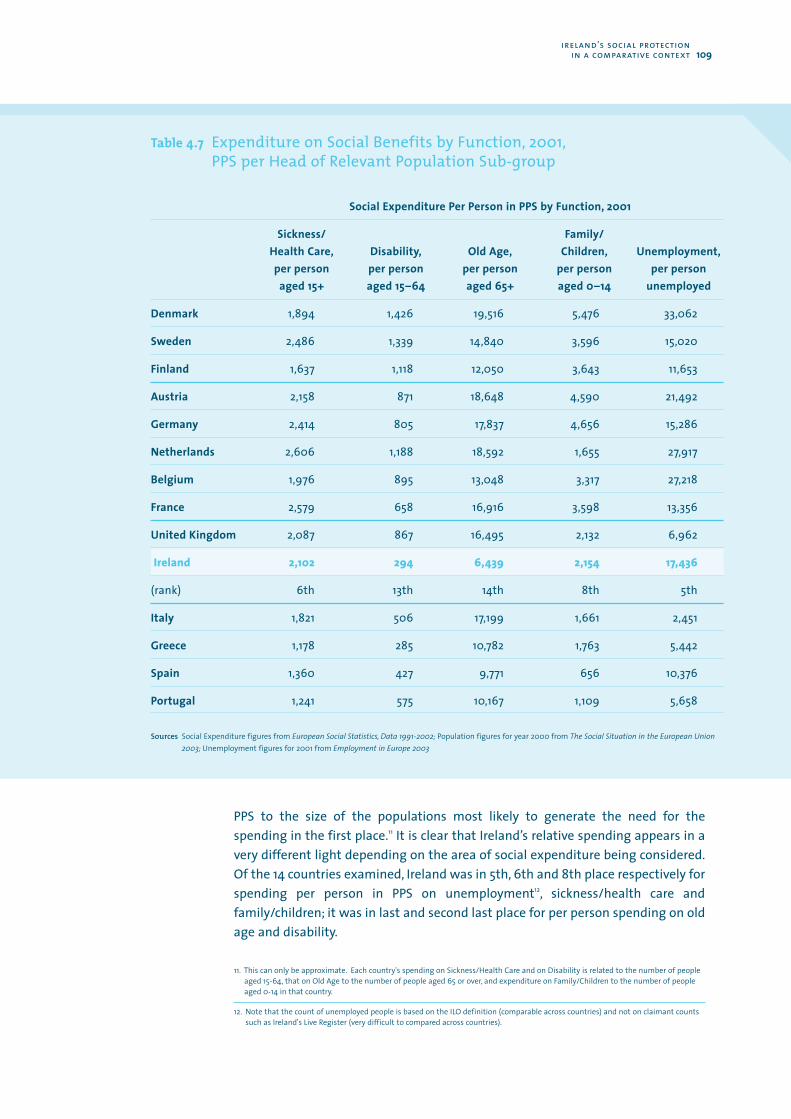
PPS to the size of the populations most likely to generate the need for thespending in the first place.11 It is clear that Ireland’s relative spending appears in avery different light depending on the area of social expenditure being considered.Of the 14 countries examined, Ireland was in 5th, 6th and 8th place respectively forspending per person in PPS on unemployment12, sickness/health care andfamily/children; it was in last and second last place for per person spending on oldage and disability.
ireland’s social protection in a comparative context 109
11. This can only be approximate. Each country's spending on Sickness/Health Care and on Disability is related to the number of peopleaged 15-64, that on Old Age to the number of people aged 65 or over, and expenditure on Family/Children to the number of peopleaged 0-14 in that country.
12. Note that the count of unemployed people is based on the ILO definition (comparable across countries) and not on claimant countssuch as Ireland's Live Register (very difficult to compared across countries).
Table 4.7 Expenditure on Social Benefits by Function, 2001,PPS per Head of Relevant Population Sub-group
Social Expenditure Per Person in PPS by Function, 2001
Sickness/ Family/Health Care, Disability, Old Age, Children, Unemployment,per person per person per person per person per person
aged 15+ aged 15–64 aged 65+ aged 0–14 unemployed
Denmark 1,894 1,426 19,516 5,476 33,062
Sweden 2,486 1,339 14,840 3,596 15,020
Finland 1,637 1,118 12,050 3,643 11,653
Austria 2,158 871 18,648 4,590 21,492
Germany 2,414 805 17,837 4,656 15,286
Netherlands 2,606 1,188 18,592 1,655 27,917
Belgium 1,976 895 13,048 3,317 27,218
France 2,579 658 16,916 3,598 13,356
United Kingdom 2,087 867 16,495 2,132 6,962
Ireland 2,102 294 6,439 2,154 17,436
(rank) 6th 13th 14th 8th 5th
Italy 1,821 506 17,199 1,661 2,451
Greece 1,178 285 10,782 1,763 5,442
Spain 1,360 427 9,771 656 10,376
Portugal 1,241 575 10,167 1,109 5,658
Sources Social Expenditure figures from European Social Statistics, Data 1991-2002; Population figures for year 2000 from The Social Situation in the European Union2003; Unemployment figures for 2001 from Employment in Europe 2003
While the Eurostat data establishes a relatively low level of per capita socialspending by Ireland in 2001, it also records the rapid growth in spending which hastaken place over the preceding decade. Per capita social expenditure in Ireland inPPS increased by over 51 per cent over the period, 1992-2001, a rate surpassed onlyin Portugal and Greece.13 When spending on unemployment compensation in eachcountry is excluded (in recognition of the particularly rapid fall in unemploymentin Ireland), the annual percentage rise in total social expenditure (real terms) onbenefits, excluding unemployment, was higher in Ireland than elsewhere in the EUover the ten years to 2001. Spending on health care, disability and sickness grewparticularly strongly in Ireland compared to the rest of the EU during the 1990s.
4.3.3 Ireland’s social spending in an OECD context
Adema (1999, 2001) pays particular attention to the question of the extent towhich data on public social expenditure is a reliable indicator of the resourcesactually devoted within a country to social purposes.14 His framework forcomparing social spending across countries has several advantages over thatemployed by Eurostat. It distinguishes between social spending gross and net oftaxes, it includes tax expenditures (termed ‘tax breaks with a social purpose’) andit presents data for private and public social spending separately. It furtherdistinguishes between private spending that is mandatory and required by law(e.g., compulsory private health insurance in some countries), and that which isvoluntary. The OECD data also extent to a wider group of countries than the EUmember states alone. However, the data are not broken down by function as in thecase of Eurostat, nor are they available on as regular a basis.
Table 4.8 presents a selection of findings from Adema’s work (2001) in which thedata apply to 1997. It focuses on two sets of countries that may be considered to beof particular interest in understanding Ireland’s current situation and futureoptions, viz., the smaller northern EU member states and Anglo-Saxon countrieswith liberal welfare states. Some of the characteristic features of national systemsfor social protection emerge quite clearly.
The Table illustrates the importance of distinguishing between gross and netsocial spending, and the different mixes of public and private social spending thatare occasioned by countries’ respective welfare regimes. The differences in whatcountries devote to gross public social expenditure are wide but differences in nettotal social expenditure are much narrower. For example, gross public socialexpenditure in Denmark accounted for 36 per cent of GDP (factor cost) in 1997,more than double the 16 per cent recorded in the US. The gap between the twocountries in net total social expenditure, however, was only 4 percentage points.Two factors serve to close the gap substantially. Firstly, one quarter of public socialexpenditure in Denmark returns to the Exchequer through direct and indirect
110
13. Statistics in Focus — Theme 3, 6/2004, Eurostat.
14. The most recently published data here are for 1997. Newer data, when they appear, are unlikely to change the patterns revealed inthis section or the analytical points made, as they pertain to the relatively stable structures of countries’ taxation systems.
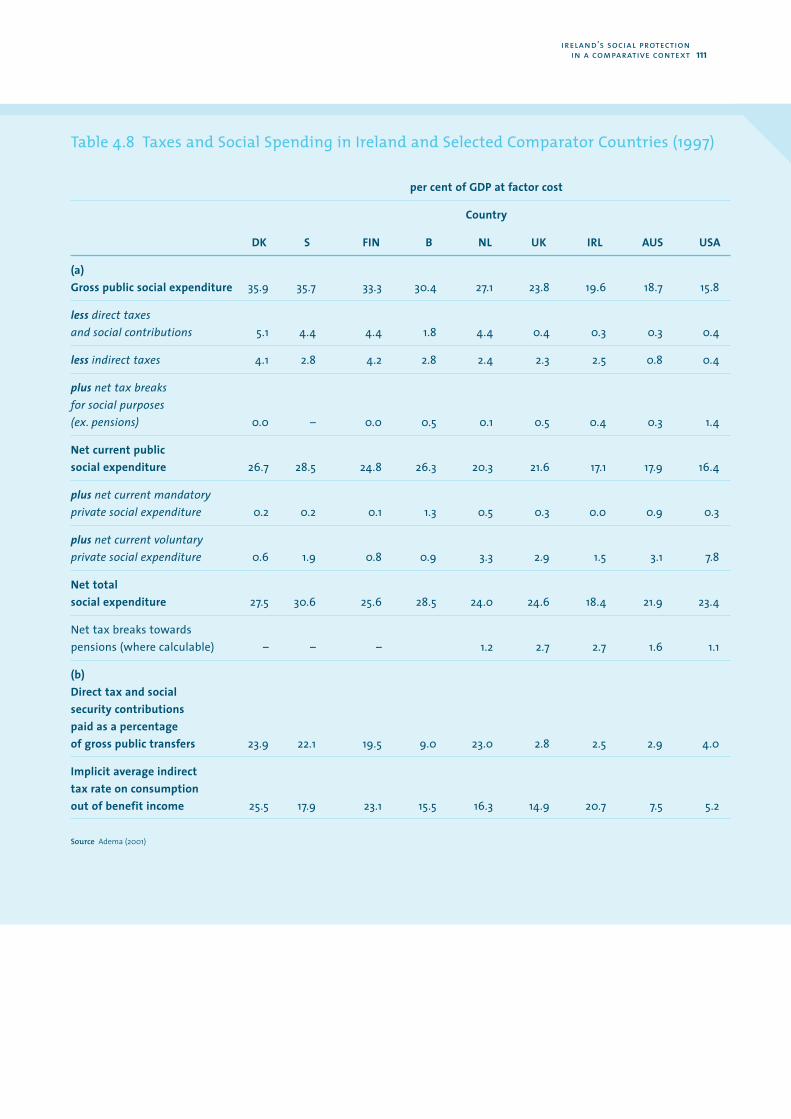
ireland’s social protection in a comparative context 111
Table 4.8 Taxes and Social Spending in Ireland and Selected Comparator Countries (1997)
per cent of GDP at factor cost
Country
DK S FIN B NL UK IRL AUS USA
(a)Gross public social expenditure 35.9 35.7 33.3 30.4 27.1 23.8 19.6 18.7 15.8
less direct taxes and social contributions 5.1 4.4 4.4 1.8 4.4 0.4 0.3 0.3 0.4
less indirect taxes 4.1 2.8 4.2 2.8 2.4 2.3 2.5 0.8 0.4
plus net tax breaks for social purposes (ex. pensions) 0.0 – 0.0 0.5 0.1 0.5 0.4 0.3 1.4
Net current public social expenditure 26.7 28.5 24.8 26.3 20.3 21.6 17.1 17.9 16.4
plus net current mandatory private social expenditure 0.2 0.2 0.1 1.3 0.5 0.3 0.0 0.9 0.3
plus net current voluntary private social expenditure 0.6 1.9 0.8 0.9 3.3 2.9 1.5 3.1 7.8
Net total social expenditure 27.5 30.6 25.6 28.5 24.0 24.6 18.4 21.9 23.4
Net tax breaks towards pensions (where calculable) – – – 1.2 2.7 2.7 1.6 1.1
(b)Direct tax and social security contributions paid as a percentage of gross public transfers 23.9 22.1 19.5 9.0 23.0 2.8 2.5 2.9 4.0
Implicit average indirecttax rate on consumption out of benefit income 25.5 17.9 23.1 15.5 16.3 14.9 20.7 7.5 5.2
Source Adema (2001)
taxes (only 5 per cent in the US); private social expenditure in the US adds one-halfagain to the country’s public social spending (it is relatively insignificant inDenmark). It is noteworthy, however, that Ireland’s low ranking on gross publicsocial spending falls even lower when total net social expenditure is estimated.Among the Anglo-Saxon cluster of welfare states, Ireland was estimated to havethe lowest level of private social spending. This relative position is not changedwhen tax breaks for pensions (particularly generous in Ireland) are included.
Secondly, in some countries, governments levy significant direct tax (income taxand social security contributions) on social welfare payments. For example, directtaxation ‘claws back’ for the Exchequer some 19 to 24 per cent of gross expenditureon cash transfers in the Scandinavian countries and the Netherlands. By contrast,Ireland and other Anglo-Saxon countries tax cash transfers lightly or exempt themaltogether (as when they are means-tested). It was estimated that only 2.5 per centof gross public expenditure on transfer spending returns directly to the Exchequerin Ireland (principally from taxation on sickness benefits and private pensionbenefits). However, indirect taxation also impacts on welfare incomes (VAT andexcise duties). In general, the same countries that levy significant direct tax onwelfare incomes also have the highest incidence of indirect tax on the sameincomes. On this front, however, the liberal welfare states of the English-speakingworld divide between those where indirect taxes impact very lightly onconsumption out of welfare incomes (USA and Australia) and the UK and Irelandwhere their impact is significant (despite the zero rating of many basic foodstuffs,children’s shoes and clothes in the latter).
The reasons for the very different tax treatment of welfare incomes deserve someexploration. Direct taxation of welfare payments is significant in some countriesbecause their rates of payment vary widely enough to allow the progressivity ofthe income tax code effect a second round redistribution among welfare recipientsthemselves. Welfare payments, in turn, vary significantly largely because anearnings-related element to benefit payments has been retained. This isconsidered worthwhile as it attaches high-earning groups more strongly to thepublic insurance system and minimises their incentive to secede from it. It is alsolikely that countries where transfer payments attract significant taxation makethose payments at a higher level to compensate recipients for the tax and chargesthey must meet. This, however, can be considered worthwhile and not inefficientbecause it lowers the withdrawal rate that benefit recipients would otherwise faceon moving into employment. It also serves to maintain their attachment to thesocial insurance fund for other contingencies and their status as income taxpayers.
On indirect taxation, it is the case that, in so far as expenditure on social protectionis funded by it rather than through higher PRSI, a wider tax base is being used, andin a way that occasions less damaging consequences for employment. However,it remains true that indirect taxes, generally, are regressive, i.e., take a larger sliceout of low incomes than out of high incomes. The regressive nature of indirecttaxes is to some extent addressed when and as welfare payments are indexed tothe Consumer Price Index, but it can happen that rises in the CPI underestimateincreases in the cost of living for those on the lowest incomes.
112
The most important reflection to make on the patterns revealed in Table 4.8,however, may relate to the varying mix of public and private social spending acrosscountries. Very different distributional consequences can attach to resources beingdevoted to private social spending rather than to public social spending. The socialcompositions of the groups benefiting from public and private social spendingrespectively tend to be very different.15 For example, the US was estimated to bedevoting as much of its GDP to social services and benefits as the EU-15 on averagein 1997 but almost one half of the US spend was private social expenditure. As aresult, a much larger percentage of those who are poor in the US remain withoutsocial protection than in Europe where almost all social spending is done by thepublic sector.16 The main question the OECD accounting framework sets out toanswer, viz., what part of a country’s resources are devoted to social protection,may not, in the final analysis, be as important as the distributional question, viz.,what are the minimum standards of social protection that members of a societyare guaranteed even if they have little or no independent income? Several formsof higher private social spending can completely bypass people in the weakestmarket positions (e.g., rises in tax expenditures for social purposes) while forms ofhigher public spending (e.g., rises in means-tested benefits) can be whollyconfined to them.
In summary, on the basis of 1997 data, the OECD framework points to Ireland as a particularly low spender on social protection by EU and OECD standards, eventhough the framework seeks to contextualise the public part of social spending.Low levels of public social spending by international standards were not offset toa significant extent by higher private social spending in 1997. In fact, one had to gooutside the EU to find a country that devoted a similarly small share of its nationalresources, public and private, to social protection at that time. Only Korea, Japanand New Zealand spent a smaller proportion of their GDP on net total socialexpenditure than Ireland in 1997 out of the 18 OECD countries examined by Adema(op. cit, 2001).
ireland’s social protection in a comparative context 113
15. Social insurance schemes in some countries are complex and tailored to specific groups of sometimes relatively privileged groups ofworkers. This tempers the assumption that public social expenditure is inherently more distributional than all its privatecounterparts (e.g., the funding of early retirement in Austria).
16. This point is also made in the background report prepared for the Greek Presidency of the EU in May, 2003 (Amitsis et al, 2003)
4.3.4 Why Ireland’s social spending appears low in international rankings
The most important reason why social expenditure levels in Ireland are lowcompared to many other advanced industrial countries is that Ireland has a muchsmaller proportion of older people in its population than many of them. Only 15per cent of Ireland’s population were aged 60 or over in 2002, a proportion whichhardly changed on 1980 (Table 4.9). The contrast is particularly stark with other EUMember States, particularly those in southern Europe. For example, almost ten percent more of the Italian population were aged 60 or over in 2002 than in Ireland, aproportion which had grown by 50 per cent since 1980.
Large elderly populations significantly increase the need for spending on pensionsbut also on health, disability and other social services. It is estimated that overone-half of total public social expenditure in the EU is accounted for by the needsof the elderly.17 Ireland’s relatively low pensions bill is further helped by the factthat the principle State pension scheme is flat-rated rather than income-related asin most other EU countries, and lower as a percentage of average earnings thanelsewhere in the EU.18 These factors combine to make pension spending in Ireland— however expressed, as a proportion of GDP/GNP or per person aged 65 or overin the population (Table 4.7) — by far the lowest within the EU. Pensionexpenditure, however, is currently increasing steadily in absolute terms (Chart 3.1)and the ageing of Ireland’s population (the pensioner support ratio is projected tofall from 5.9 in 2002 to 2.0 by 205019) will inexorably increase it as a proportion ofGDP/GNP also. The estimates vary with the assumptions made but the scale ofincrease is substantial: Bennett et al (2003) calculate that paying the ContributoryOld Age Pension alone at the rate of 34 per cent of average industrial earnings (theNational Pension Policy target) would need 5 percentage points more of GDP by2050 – they project costs as rising from 2.9 per cent of GDP in 2002, 4.5 per cent by2025 and 7.9 per cent by 2050. Barrett (2003) estimates that funding total publicspending on pensions will need 4.4 more percentage points of GNP, rising from 4.6per cent of GNP in 2000 to 9.0 per cent by 2050. It will rise elsewhere in the EUtoo, of course, but growth in Ireland is projected to be above the EU average (a riseof 4.4 percentage points as against an average rise of 3.2 points), narrowing butnot closing the gap between Ireland other EU member states (this is for publicpension spending only).
Adjusting comparisons of social spending between countries to account for theage structure of their populations is more intricate than simply factoring outpensions. As people get older they are much more likely to use community healthservices, purchase medicines, consult specialists and spend periods in hospital;they are also much more likely to acquire a disability as a result of longer exposureto the risks and vicissitudes that are inherent to human living. Bennett et al (2003)estimate how much more is currently spent by the public health services in Irelandon disability care, medicines, community health services, and acute hospital carefor each person aged 65 or over compared to each person aged under 65; they
114
17. Social Protection in Europe 2001.
18. National Pensions Policy Initiative (1998: Appendix H).
19. Number of people aged 15 to 64 per person aged 65 or over, Bennett el al (2003).
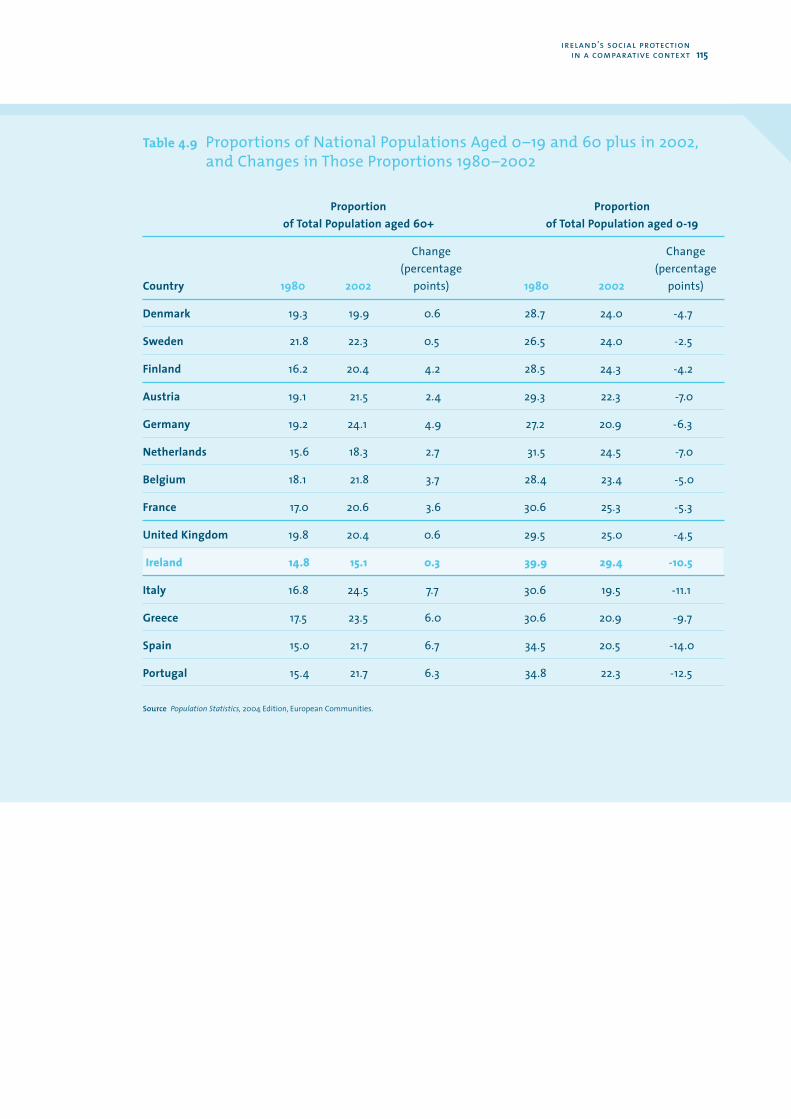
ireland’s social protection in a comparative context 115
Table 4.9 Proportions of National Populations Aged 0–19 and 60 plus in 2002,and Changes in Those Proportions 1980–2002
Proportion Proportion of Total Population aged 60+ of Total Population aged 0-19
Change Change (percentage (percentage
Country 1980 2002 points) 1980 2002 points)
Denmark 19.3 19.9 0.6 28.7 24.0 -4.7
Sweden 21.8 22.3 0.5 26.5 24.0 -2.5
Finland 16.2 20.4 4.2 28.5 24.3 -4.2
Austria 19.1 21.5 2.4 29.3 22.3 -7.0
Germany 19.2 24.1 4.9 27.2 20.9 -6.3
Netherlands 15.6 18.3 2.7 31.5 24.5 -7.0
Belgium 18.1 21.8 3.7 28.4 23.4 -5.0
France 17.0 20.6 3.6 30.6 25.3 -5.3
United Kingdom 19.8 20.4 0.6 29.5 25.0 -4.5
Ireland 14.8 15.1 0.3 39.9 29.4 -10.5
Italy 16.8 24.5 7.7 30.6 19.5 -11.1
Greece 17.5 23.5 6.0 30.6 20.9 -9.7
Spain 15.0 21.7 6.7 34.5 20.5 -14.0
Portugal 15.4 21.7 6.3 34.8 22.3 -12.5
Source Population Statistics, 2004 Edition, European Communities.
conclude it costs 6.8 times more. This is an order of magnitude, not a precise figure— several uncertainties surround projecting current spending differences into thefuture; on the one hand, the health of older people can be expected to improve but,on the other, the population aged 80 and over is to grow and so may the cost ofmany treatments. However, any exercise that seeks to adjust health spending inEU member states for the proportions of elderly people in their populations willsee Ireland’s ranking for ‘health effort’ (health spending as a proportion of GDP orGNP) improve notably. Bennett et al (2003: 24), for example, estimate that publichealth spending in Ireland as a per cent of GDP, when it was 18 per cent below theaverage for the EU 15 in 2001, could be recalculated as 7 per cent below the EU 15 average when adjusted for the age structure of each country’s population.In similar fashion, when a Canadian study adjusted Ireland’s relative spending onhealth in 2001 to reflect its relatively young population, Ireland moved from beingranked the 6th lowest spender among 27 OECD countries to a middle ranking(14th) (Esmail and Walker, 2004).
What accounts for differences in per capita social spending across countries ismore complex still than allowing for different proportions of elderly people innational populations. Differences in levels of wealth, unemployment rates, therole of the family and the specifics of policy also contribute significantly tovariations in spending levels. The latter two factors, in particular, can interact inimportant ways. Eurostat cites the example of unemployment spending in Finlandand Italy in 2001; when each had the same unemployment rate (of 9 per cent),Finland spent 4.4 times as much per unemployed person (in PPS) as Italy (Statisticsin Focus, 6/2004).
The reasons, therefore, why Ireland’s relative per capita wealth in 2001 was a poorguide to its relative position on per capita social spending within the EU needcareful attention. For example, while Ireland’s economic performance has beenexceptional, the extent of reliance on the family for caring is still more similar tothe southern European countries than the higher spending northern EU memberstates. Also, Ireland’s economy has only recently generated per capita incomelevels at or above the EU 15 average and a lagged response in social spending maybe inevitable as the expansion or creation of the necessary social infrastructurestakes place; Ireland’s public capital programme is currently running at 5 per cent ofGNP, more than twice the EU average. Furthermore, the trend in several areas ofsocial spending is decisively upwards, being pulled by demographic factors, theerosion of family caring and policy decisions. These are benign considerations.More controversial explanations are also available. Some argue that Ireland’sstandards of social protection have lagged growth in the country’s economicstrength, that Irish standards are lower than those of many of its EU neighboursand that this is what the comparative data show (for example, in spending onpensions and services for the disabled). Others argue that Ireland’s economic andsocial model has had to take different paths to those taken by its Europeanneighbours (if a small open economy with little indigenous industry was tocombat high unemployment) and that the comparison of social spending withlonger established welfare states is unfair.
116
4.4 Public Social Spending and Outcomes
Differences across countries in social spending — as a proportion of GNP but alsoeven in per capita spending by social function — are not reliable indicators ofsimilar differences in outputs (what is produced, e.g., teaching hours) or inoutcomes (what is attained, e.g., students’ reading achievements). In the firstplace, as discussed above, expenditure data may not capture actual differences in the levels of inputs being used (as when spending is not computed net of tax).In second place, the relative costs of service professionals and other inputs and theefficiency with which they are managed may differ across countries, such that ittakes more of one nation’s resources to run — for example — a school or a hospital than of another’s.20 In third place, and most important of all, manyinstitutional and cultural features that are specific to a society and its welfaresystem intervene in the process by which inputs are transformed into outputs, andexplain why similar levels of outputs are associated with quite different levels offinal outcomes (such as longevity). The efficiency and effectiveness oforganisations in using funds may be different. The roles of the family and volun-tary organisations in undertaking unpaid caring may be different. Rises in socialexpenditure may be driven in one country by increasing economic and social risks(e.g., rising unemployment, higher consumption of alcohol and drugs) and inanother by genuine improvements in social standards (e.g., the extension ofsupport to hitherto unprotected groups).
Assessing the relative efficiency and effectiveness with which public socialspending in Ireland supports the attainment of desired social outcomes, andestablishing the level of improvement in outcomes that additional spending mightachieve, is particularly difficult where spending on services is involved. The issuesarising can be briefly illustrated for health and education, but it is beyond thescope of this report definitively to settle them.
ireland’s social protection in a comparative context 117
20. As examples, Table 3.4 above drew attention to the different relative costs of medical consultants in Ireland and Finland; OECDEducation at a Glance shows the very different percentages of countries' GDPs per capita, which salaries to teachers of 15 years ofexperience constitute (e.g., 2004: Table D3.1).
4.4.1 Health and educational outcomes in Ireland relative to spending
Health
As already adverted to in Chapter 3, the rise in public health spending in Irelandsince 1997 has been dramatic, yet there is a generalised concern that the publichealth services have not only not improved but deteriorated. Partly as a result, amajor reform programme began in 2005 whose impact will need some yearsbefore it can be assessed. By 2002, as Table 4.10 illustrates, public spending onhealth as a proportion of GDP/GNP put Ireland in the top third of EU 15 memberstates, while its per capita spending in constant purchasing power terms was the6th highest of the 14 countries shown (cols. 1 & 2). Ireland’s health care expenditurewas similar to those of Finland, France and Italy in the balance it struck betweenpublic and private spending; it was more public than in five other countries andless public than in four (col.3). People’s estimated out of pocket paymentsamounted, on average, to 13 per cent of the total per capita expenditure, lowerthan in 5 of the 9 countries for which data were available (col. 4).
The actual health status of Ireland’s population that results from this level andcomposition of spending on health is influenced by multiple aspects of what itactually buys, viz.., the quality and quantity of what constitute the outputs of thehealth system (medical consultations, drug prescriptions, hospital discharges,average in-patient stays, domiciliary visits, etc.). These outputs of the healthsystem are, in turn, inputs which individuals, families, communities and Irishsociety are using to ‘co-produce’ the health outcomes that are their ultimateobjective. Individual traits, lifestyle choices, social and community networks, andwider socio-economic and cultural factors all mediate the individual’s need forhealth services (DHC, 2001) and, thus, the levels of health service usage thatsupport any given health outcome. Major changes in socio-economic conditionsand lifestyle over the past two decades have accompanied the large increase inpublic health spending that has occurred. Falling unemployment, lower levels ofdeprivation, rising educational attainment, more self-direction in the workplaceand less smoking, for example, can be expected to have made major contributionsto improving people’s health status. On the other hand, the very ability to keeppeople with severe disabilities alive longer, the growing number of advancedelderly people, the rise in alcohol consumption21, rising obesity levels, higherimmigration from developing countries, growing relationship instability and thehigher incidence of people living alone — are some factors which can be expectedto be making even a population more intensive in its use of health services even tomaintain its health status.
118
21. Alcohol consumption in litres per capita (population aged 15+) rose by 29 per cent between 1993 and 2001, raising Ireland from amiddle EU ranking to second place after Luxembourg. The increase levelled off in 2002.
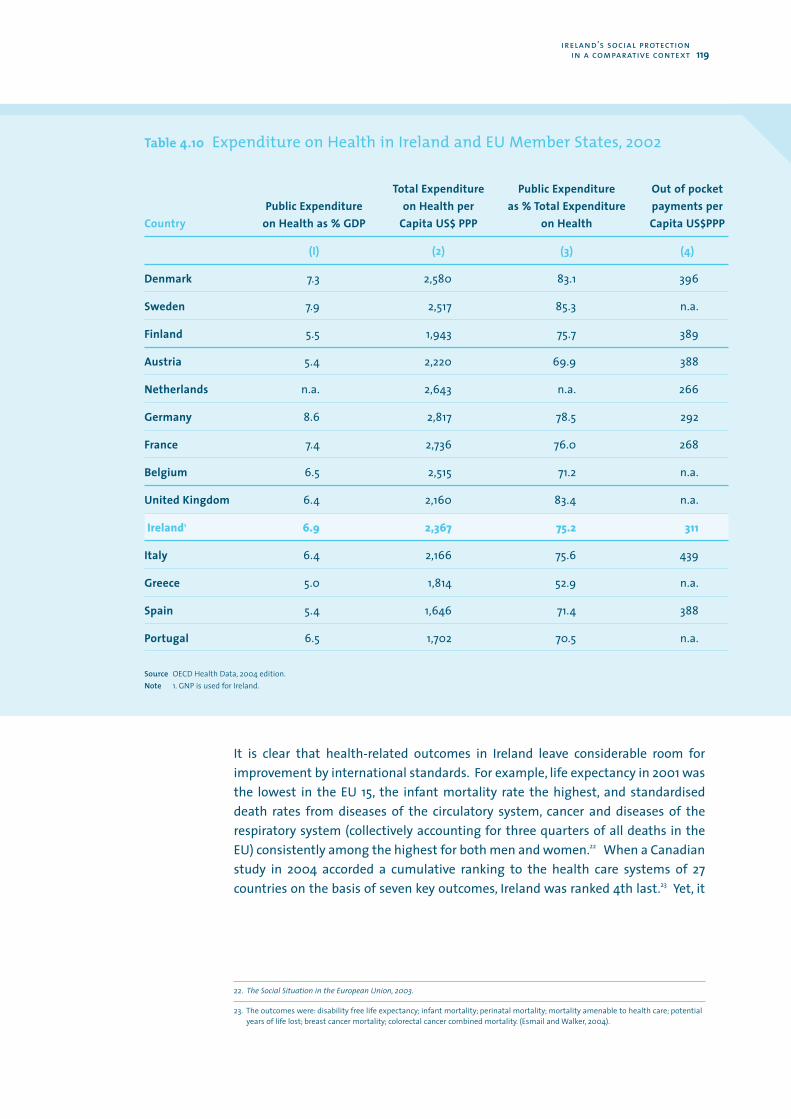
It is clear that health-related outcomes in Ireland leave considerable room forimprovement by international standards. For example, life expectancy in 2001 wasthe lowest in the EU 15, the infant mortality rate the highest, and standardiseddeath rates from diseases of the circulatory system, cancer and diseases of therespiratory system (collectively accounting for three quarters of all deaths in theEU) consistently among the highest for both men and women.22 When a Canadianstudy in 2004 accorded a cumulative ranking to the health care systems of 27countries on the basis of seven key outcomes, Ireland was ranked 4th last.23 Yet, it
ireland’s social protection in a comparative context 119
Table 4.10 Expenditure on Health in Ireland and EU Member States, 2002
22. The Social Situation in the European Union, 2003.
23. The outcomes were: disability free life expectancy; infant mortality; perinatal mortality; mortality amenable to health care; potentialyears of life lost; breast cancer mortality; colorectal cancer combined mortality. (Esmail and Walker, 2004).
Total Expenditure Public Expenditure Out of pocketPublic Expenditure on Health per as % Total Expenditure payments per
Country on Health as % GDP Capita US$ PPP on Health Capita US$PPP
(I) (2) (3) (4)
Denmark 7.3 2,580 83.1 396
Sweden 7.9 2,517 85.3 n.a.
Finland 5.5 1,943 75.7 389
Austria 5.4 2,220 69.9 388
Netherlands n.a. 2,643 n.a. 266
Germany 8.6 2,817 78.5 292
France 7.4 2,736 76.0 268
Belgium 6.5 2,515 71.2 n.a.
United Kingdom 6.4 2,160 83.4 n.a.
Ireland1 6.9 2,367 75.2 311
Italy 6.4 2,166 75.6 439
Greece 5.0 1,814 52.9 n.a.
Spain 5.4 1,646 71.4 388
Portugal 6.5 1,702 70.5 n.a.
Source OECD Health Data, 2004 edition.Note 1. GNP is used for Ireland.
should also be clear — from Table 4.10 and the earlier Charts 3.4. and 3.5 — thatIreland is not lagging behind the health standards of other countries because it isdevoting a particularly low proportion of its resources to health or because it hasnot been increasing health spending at a rapid rate. The contrast between thesepoor relative health outcomes and relatively good ‘health effort’ suggests thatIreland could make better use of its existing resources being devoted to health.This is not just a challenge to the management of health organisations and theethos of health professionals but as much one to embrace co-responsibility forhealth right across Irish society (in use of alcohol, diet, etc.).
Education
Chapter 3 established that public spending per student at primary, secondary andthird level of the educational system rose substantially in real terms between 1985and 2002 (Chart 3.7), but that falling numbers in the primary school system andthe huge growth in the economy allowed this to be achieved with a marginallylower proportion of GNP (Chart 3.3).24 Total public expenditure on education wasequivalent to some 4.9 per cent of GNP in the year 2001, lower than that achievedby 7 other countries in the EU 15 (Table 4.11). When public spending on educationalinstitutions is expressed per pupil/student in common purchasing powerstandards, internationally comparable data for 2001 show that Ireland wasspending relatively large sums for each student in third level and particularly smallsums per student at the primary and secondary levels (Table 4.11). The 15 per centof GNP per capita being spent per pupil at primary level in 2001 and 21 per cent perpupil at secondary level were the lowest proportionate investments in the EU 15.By contrast, the 32 per cent of GNP per capita being spent on each third levelstudent (excluding spending on R&D) was the highest; accordingly, the ratio ofspending per student at third level to primary level was significantly the highest inthe EU 15. However, as seen in Chapter 3, a substantial shift began in 1997 that isreducing this gap. Current public spending per student in real terms increased byapproximately 30 per cent at primary and secondary level over the 5-year period,1998-2002, but by only 8 per cent at third level (Chart 8, Chapter 1).
In the light of this evidence, it is worthwhile reflecting on the fact that educationaloutcomes for young people in Ireland currently rank from average to good ininternational terms. For example, the OECD’s Programme for InternationalStudent Assessment (PISA) placed the attainments of Ireland’s 15-year olds in theyear 2000 in 5th place of 26 countries for reading literacy, 9th place for scientificliteracy and 15th place for mathematical literacy.25 In addition, anecdotal evidenceattests to a high level of recognition being accorded the Leaving Certificate by thirdlevel institutes in other countries. It can be argued, then, that Ireland is attainingparticularly good outcomes for its level of public investment.26 It is, indeed, thecase that important qualitative aspects of a national educational system are not
120
24. In similar fashion, the OECD comments: ‘the strong growth of GDP in Ireland hides significant increases in spending on educationalinstitutions when spending on education is expressed as a proportion of GDP.’ This is borne out by a comparison of Finland andIreland: between 1995 and 2001, public spending on education as a proportion of GDP declined by similar amounts (0.5 and 0.6 of apercentage point respectively). However, in constant money terms, public expenditure on educational institutions was 48 per centhigher in Ireland in 2001 than in 1995, and 17 per cent higher in Finland. Education at a Glance. OECD Indicators 2004 (224, 229, 232.)
25. The same 26 countries are used for these rankings.
26. ‘Strong educational outcomes have been produced with limited resources’ observes the National Competitiveness Council. (TheCompetitiveness Challenge 2003, p. 12).
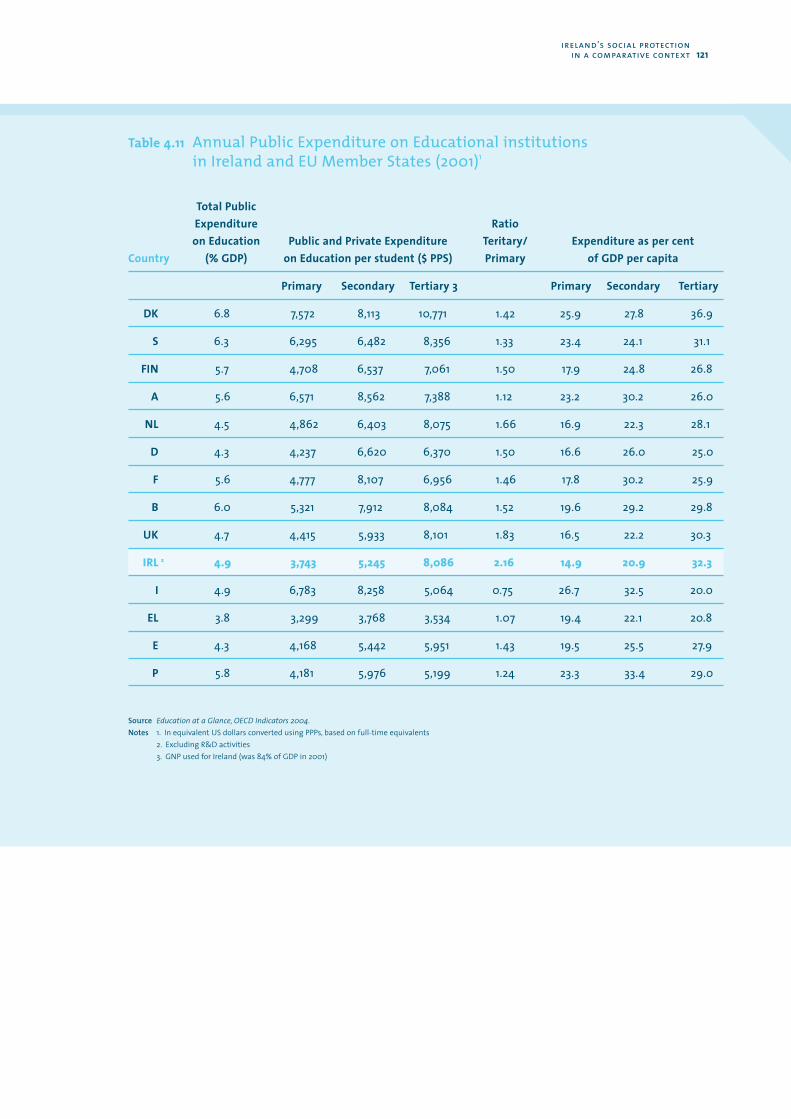
ireland’s social protection in a comparative context 121
Table 4.11 Annual Public Expenditure on Educational institutions in Ireland and EU Member States (2001)1
Total Public Expenditure Ratioon Education Public and Private Expenditure Teritary/ Expenditure as per cent
Country (% GDP) on Education per student ($ PPS) Primary of GDP per capita
Primary Secondary Tertiary 3 Primary Secondary Tertiary
DK 6.8 7,572 8,113 10,771 1.42 25.9 27.8 36.9
S 6.3 6,295 6,482 8,356 1.33 23.4 24.1 31.1
FIN 5.7 4,708 6,537 7,061 1.50 17.9 24.8 26.8
A 5.6 6,571 8,562 7,388 1.12 23.2 30.2 26.0
NL 4.5 4,862 6,403 8,075 1.66 16.9 22.3 28.1
D 4.3 4,237 6,620 6,370 1.50 16.6 26.0 25.0
F 5.6 4,777 8,107 6,956 1.46 17.8 30.2 25.9
B 6.0 5,321 7,912 8,084 1.52 19.6 29.2 29.8
UK 4.7 4,415 5,933 8,101 1.83 16.5 22.2 30.3
IRL 2 4.9 3,743 5,245 8,086 2.16 14.9 20.9 32.3
I 4.9 6,783 8,258 5,064 0.75 26.7 32.5 20.0
EL 3.8 3,299 3,768 3,534 1.07 19.4 22.1 20.8
E 4.3 4,168 5,442 5,951 1.43 19.5 25.5 27.9
P 5.8 4,181 5,976 5,199 1.24 23.3 33.4 29.0
Source Education at a Glance, OECD Indicators 2004.Notes 1. In equivalent US dollars converted using PPPs, based on full-time equivalents
2. Excluding R&D activities3. GNP used for Ireland (was 84% of GDP in 2001)
easily captured in how inputs are measured and that they can significantlyinfluence the conversion factor that translates educational inputs into improvedoutcomes. These aspects include the professionalism and dedication of teachingstaff, the leadership exercised within schools, the calibre of people being attractedinto teaching as a career, the status of teachers in society, the support parentsprovide to their children’s schooling, and the quality of the links between parentsand their children’s schools. The large contribution of the churches and religiousorders to Irish schools and the high status attached to teachers suggest thatIreland may continue to have some particularly advantageous features in securingeducational outcomes higher than spending levels alone would indicate.
However, there are other aspects of Ireland’s educational system where therelatively efficient use of inputs to support outcomes is little apparent. Along withmost other EU and OECD countries, Ireland faces a strong challenge of educationaldisadvantage among its school-going population. Despite significant attention andrising expenditure, little progress is being been recorded in addressing it. Schoolsare designated as disadvantaged on the basis of the socio-economic characteristicsof their student intakes (e.g., parents’ possession of a medical card) and allocatedadditional resources accordingly. It is not yet possible, however, to identify schoolsas underperforming on the basis of how effectively they use whatever resourcesthey get to achieve advancement for their respective student intakes. Yet the schoolpractices needed to produce the same advancement for pupils from adisadvantaged as from a middle class area may be quite different.27
More significantly still, Ireland’s educational system is being challenged — by needand international comparisons — to look to some quite new sections of itspopulation, viz., pre-school children and adults. It is particularly the case that theeducational system has not considered pre-school children as a client group and,accordingly, public spending on education and care there is low by internationalstandards (OECD Thematic Review of Early Childhood Education and Care Policy inIreland, 2004). When this tradition of leaving pre-school children’s needs largely totheir families, informal childminders or the community and voluntary sector iscombined with the relatively low public spending per child in infant classes, publicspending per child aged 0-6 in Ireland constitutes a small part of GDP compared toother countries.28 It was estimated to be d2,075 (PPP) per child aged 0-6 in 2002 orsome 3.8 per cent of Ireland’s GDP per capita as against, for example, $4,050 (PPP)per child in Austria or the equivalent of 6.9 per cent of its GDP per capita (OECD, 2003: Table 5.2).
122
27. Teachers in schools serving a middle class intake may relate more easily to parents than teachers in schools serving disadvantagedareas. The use of suspension as a pupil discipline device may achieve the intended effect in a middle class school but the opposite ina disadvantaged area.
28. The OECD Thematic Review of Early Childhood Education and Care Policy in Ireland (July, 2004) believe Ireland ‘is approaching adecisive moment where funding is concerned’ (p.34) with the level of private costs being borne by parents ‘unsustainable even in themedium term’, and the nature and scale of the current EOCP yet to be decided upon in the context of a new NDP post 2006.
In serving age groups beyond the typical age (18) for completing secondary school,the Irish educational system also appears as underdeveloped in an internationalcomparative context.29 Enrolment rates in Ireland (understood as the numbers offull- and part-time students in public or private institutions as a percentage of theage group in question) in 2002 were average by OECD standards for 15-19 year olds(13th place of the same 26 countries for which the PISA scores were comparedabove) and very low for older cohorts (21st place for 20-29 year olds, etc.). Ireland’sadult population (aged 25-64), in fact, is one of the most polarised in the OECDworld by educational attainment. While the proportion that have a third leveleducation attainment is above the OECD mean (by 9 per cent in 2002), theproportion that did not complete secondary education is above the mean too (by21 per cent). For example, similar proportions of Irish and Swiss 25-64 year olds hada third level attainment in 2002 but the proportion of Irish 25-64 year olds withless than a completed secondary education was 2.66 times greater in Ireland thanin Switzerland (40 per cent versus 15 per cent).
In summary, this brief review of spending on education in a comparative contextprovides some grounds for satisfaction that spending is efficient in attainingoutcomes, but only when outcomes for a traditional clientele (young people andmiddle class young people at that) are consulted. Educational disadvantageamong working class young people has, so far, not been reduced by higherspending, while only low levels of spending by international standards are beingincurred on behalf of pre-school children and older age groups. It can fairly be saidthat there is no evidence of a higher ‘educational effort’ in Ireland beingundertaken in response to, for example, the country’s young age profile, itsrelatively low spending on pensions or the height of ambitions for its economy.30
4.4.2 Ireland’s social welfare transfers in a comparative context
A major and, arguably, the core function of any and every national system of socialprotection is the provision of money income when the need arises. Systems differsignificantly in the degree of responsibility they take for — respectively —replacing income (a characteristic concern of Bismarkian, insurance-basedsystems), restricting inequality in the distribution of income (characteristic of the citizen-oriented, Nordic systems), and raising the lowest incomes by setting a floor to income (the principal concern of Anglo-Saxon systems).
ireland’s social protection in a comparative context 123
29. The following data are from OECD (2004), Education at a Glance.
30. ‘While the focus must remain on educational outputs rather than inputs, it is not clear that the existing level of spending by Irelandon education will be sufficient to meet the needs of the knowledge economy’ (National Competitiveness Council, op. cit.).
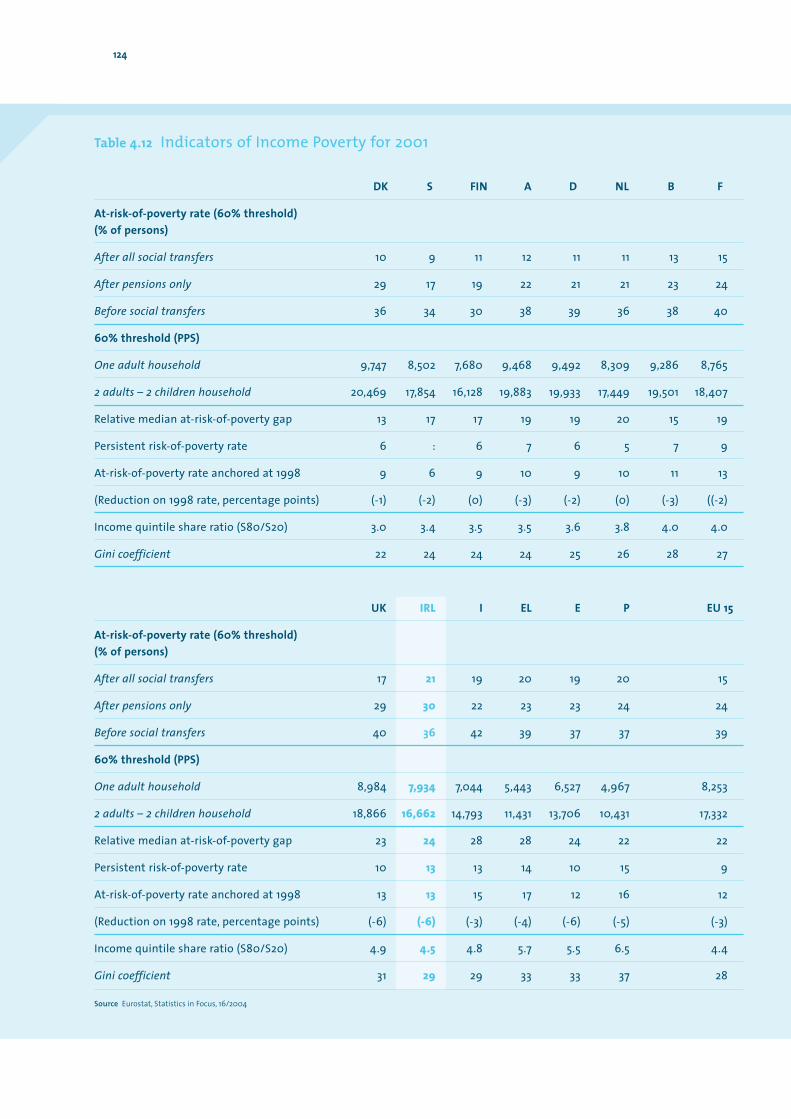
124
Table 4.12 Indicators of Income Poverty for 2001
DK S FIN A D NL B F
At-risk-of-poverty rate (60% threshold)(% of persons)
After all social transfers 10 9 11 12 11 11 13 15
After pensions only 29 17 19 22 21 21 23 24
Before social transfers 36 34 30 38 39 36 38 40
60% threshold (PPS)
One adult household 9,747 8,502 7,680 9,468 9,492 8,309 9,286 8,765
2 adults – 2 children household 20,469 17,854 16,128 19,883 19,933 17,449 19,501 18,407
Relative median at-risk-of-poverty gap 13 17 17 19 19 20 15 19
Persistent risk-of-poverty rate 6 : 6 7 6 5 7 9
At-risk-of-poverty rate anchored at 1998 9 6 9 10 9 10 11 13
(Reduction on 1998 rate, percentage points) (-1) (-2) (0) (-3) (-2) (0) (-3) ((-2)
Income quintile share ratio (S80/S20) 3.0 3.4 3.5 3.5 3.6 3.8 4.0 4.0
Gini coefficient 22 24 24 24 25 26 28 27
UK IRL I EL E P EU 15
At-risk-of-poverty rate (60% threshold)(% of persons)
After all social transfers 17 21 19 20 19 20 15
After pensions only 29 30 22 23 23 24 24
Before social transfers 40 36 42 39 37 37 39
60% threshold (PPS)
One adult household 8,984 7,934 7,044 5,443 6,527 4,967 8,253
2 adults – 2 children household 18,866 16,662 14,793 11,431 13,706 10,431 17,332
Relative median at-risk-of-poverty gap 23 24 28 28 24 22 22
Persistent risk-of-poverty rate 10 13 13 14 10 15 9
At-risk-of-poverty rate anchored at 1998 13 13 15 17 12 16 12
(Reduction on 1998 rate, percentage points) (-6) (-6) (-3) (-4) (-6) (-5) (-3)
Income quintile share ratio (S80/S20) 4.9 4.5 4.8 5.7 5.5 6.5 4.4
Gini coefficient 31 29 29 33 33 37 28
Source Eurostat, Statistics in Focus, 16/2004
Notwithstanding the different objectives public authorities set for their tax andtransfer activities, the EU Member States have adopted common indicators ofwhat constitutes income-based evidence of being at-risk-of-poverty.31 Nine of the18 indicators32 adopted to monitor progress by Member States in combatingpoverty and social exclusion relate to income, viz., the prevalence, severity,persistence and other characteristics of low money incomes. Table 4.12 presentsthe income situations in the Member States of the EU 15 in the year 2001. Thethreshold adopted to define being at risk of poverty is 60 per cent of medianequivalised household disposable income. Not too much should be made of theprecise rankings in a given year but the overall distinctions between groups ofcountries are relatively robust from year to year.33 The data clearly place thecountries of the EU 15 into two broad camps. The Scandinavian and ContinentalEuropean countries (top half of Table 4.12) have lower at-risk-of-poverty rates,smaller poverty gaps and greater equality in income distribution than the fourcountries in Southern Europe, the UK and Ireland (bottom half of Table 4.12).
Ireland had the highest at-risk-of-poverty rate in the EU 15 in the year 2001, closelyfollowed by Greece and Portugal. The actual income threshold constituting thepoverty line in Ireland, however, at d7,934 PPS (euro of a constant purchasingpower), was significantly higher than in Southern Europe (higher too than inFinland). In fact, despite having the highest at-risk-of-poverty rate in 2001, Irelandrecorded one of the fastest improvements in raising the purchasing power of itslowest incomes of the EU 15. When the at-risk-of-poverty threshold is anchored in1998 and up-rated solely for inflation, 6 per cent of the populations of the Ireland,the UK and Spain had moved above it by the year 2001. The significance of this isthat general economic growth in these countries was pulling up median incomesfaster than elsewhere. (When the income threshold is anchored earlier, in 1996, thestrength of this factor is illustrated even more strikingly for Ireland.)
The contrast in Ireland between trends in absolute poverty (steadily declining) andtrends in the at-risk-of poverty measure based on relative income (steadily rising)is a striking aspect of the economic and social changes that have taken place sincethe mid-1980s, and it is not clear how these contrasting trends should bereconciled. The detail provided in Table 4.13 helps to outline what is involved.
ireland’s social protection in a comparative context 125
31. Because having an income below 60 per cent of median income is neither a necessary nor a sufficient condition of being in a state ofpoverty, the EU's Social Protection Committee consistently refers to it as a measure of poverty risk.
32. Collectively known as the Laeken indicators. See Report on Indicators in the Field of Poverty and Social Exclusion, October 2001. SocialProtection Committee.
33. Particularly in comparing relative income poverty rates, attention should be paid to the specifics of how the data have been collectedand treated (such as the equivalence scale used, the definition of income, the poverty line sets, etc.). It should be noted here thatresearchers in several countries (notably, Finland, Belgium and Sweden) find significant discrepancies between the data in theirnational registers and the European Community Household Panel (ECHP) on which Eurostat relies. The ECHP, furthermore, is a paneldata set and attrition rates have been higher in some countries (e.g., Ireland) than in others; it is likely that subsequent attempts tore-weight the samples will have had differential effects.
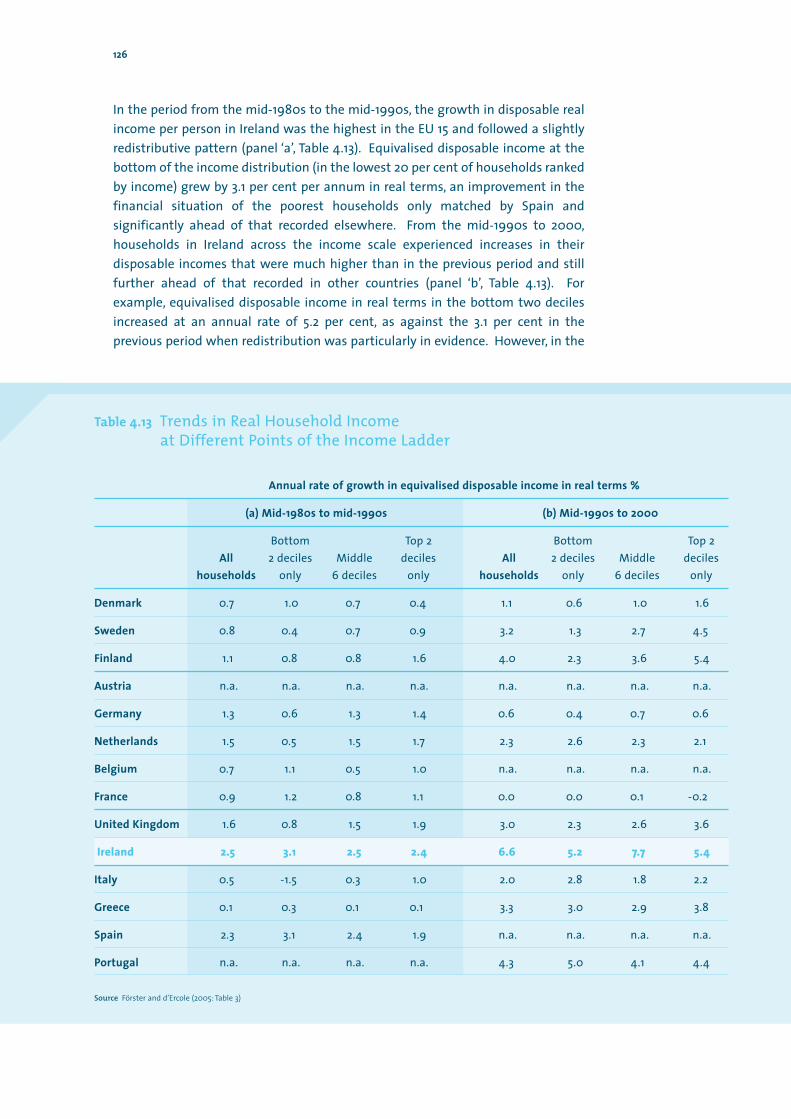
In the period from the mid-1980s to the mid-1990s, the growth in disposable realincome per person in Ireland was the highest in the EU 15 and followed a slightlyredistributive pattern (panel ‘a’, Table 4.13). Equivalised disposable income at thebottom of the income distribution (in the lowest 20 per cent of households rankedby income) grew by 3.1 per cent per annum in real terms, an improvement in thefinancial situation of the poorest households only matched by Spain andsignificantly ahead of that recorded elsewhere. From the mid-1990s to 2000,households in Ireland across the income scale experienced increases in theirdisposable incomes that were much higher than in the previous period and stillfurther ahead of that recorded in other countries (panel ‘b’, Table 4.13). Forexample, equivalised disposable income in real terms in the bottom two decilesincreased at an annual rate of 5.2 per cent, as against the 3.1 per cent in theprevious period when redistribution was particularly in evidence. However, in the
126
Table 4.13 Trends in Real Household Income at Different Points of the Income Ladder
Annual rate of growth in equivalised disposable income in real terms %
(a) Mid-1980s to mid-1990s (b) Mid-1990s to 2000
Bottom Top 2 Bottom Top 2All 2 deciles Middle deciles All 2 deciles Middle deciles
households only 6 deciles only households only 6 deciles only
Denmark 0.7 1.0 0.7 0.4 1.1 0.6 1.0 1.6
Sweden 0.8 0.4 0.7 0.9 3.2 1.3 2.7 4.5
Finland 1.1 0.8 0.8 1.6 4.0 2.3 3.6 5.4
Austria n.a. n.a. n.a. n.a. n.a. n.a. n.a. n.a.
Germany 1.3 0.6 1.3 1.4 0.6 0.4 0.7 0.6
Netherlands 1.5 0.5 1.5 1.7 2.3 2.6 2.3 2.1
Belgium 0.7 1.1 0.5 1.0 n.a. n.a. n.a. n.a.
France 0.9 1.2 0.8 1.1 0.0 0.0 0.1 -0.2
United Kingdom 1.6 0.8 1.5 1.9 3.0 2.3 2.6 3.6
Ireland 2.5 3.1 2.5 2.4 6.6 5.2 7.7 5.4
Italy 0.5 -1.5 0.3 1.0 2.0 2.8 1.8 2.2
Greece 0.1 0.3 0.1 0.1 3.3 3.0 2.9 3.8
Spain 2.3 3.1 2.4 1.9 n.a. n.a. n.a. n.a.
Portugal n.a. n.a. n.a. n.a. 4.3 5.0 4.1 4.4
Source Förster and d’Ercole (2005: Table 3)
mid-1990s to 2000 period, the growth in incomes was not as redistributive as inthe earlier period: the 60 per cent of households in the middle of the incomedistribution experienced the most rapid increase while the two tails (bottom and top two deciles respectively) had smaller increases of a similar magnitude.Ireland’s pattern of income distribution in the second half of the 1990s, therefore,favoured neither of its two tails but the large middle. Table 4.13, in fact, shows nocountry maintaining a clear redistributive pattern throughout the two periods, anda clear deterioration becoming particularly marked in the Nordic countries duringthe second half of the 1990s.
The evaluation of Ireland’s social welfare transfers on the basis of such figures isnot a straightforward exercise. This is because the prevalence, intensity andpersistence of low incomes at any point in time is the net outcome of marketincomes (principally labour market earnings) and of the tax and transfer activitiesof the State. Lower at-risk-of-poverty rates in one country than in another do notnecessarily imply more generous social welfare transfers in the former. Forexample, Ireland’s social transfers of ‘last resort’ (i.e., assuming no means from anyother sources) to a lone parent with 2 children are at a higher level relative tomedian disposable household income than in Sweden (OECD, 2004: 83) yetSwedish lone parents face much lower at-risk-of-poverty rates. The reason is thatmany more Swedish lone parents have employment. In fact, across the different‘families’ of welfare states, the net incomes provided by social assistance of lastresort in the absence of any employment or other market incomes are generallyinsufficient to ensure incomes above the 60 per cent ‘poverty line’ (OECD, 2004: 81-86). Low at-risk-of-poverty rates tend to result from a combination of factors: theextent to which transfer income is combined with market income, the distributionof employment across households, the net wage to be had in low productivity jobs,the rates of social welfare payments and short rather than long durations inreceipt of social welfare.
It is possible to identify how well Ireland’s system of social welfare paymentscontributes to improving on the primary (or ‘market’) distribution of incomecompared to the welfare states of other countries. This can be done because theECHP data34 and Laeken indicators allow household income to be distinguishedbefore and after social transfers. Chart 4.2 shows the position for the EU 15Member States35 ranked by order of their post-transfer at-risk-of-poverty rates.
For illustrative purposes, it shows the final position being arrived at in two steps —the reduction in the percentage of the population below the 60 per cent thresholdachieved by pensions (e.g., from 34% to 17% in Sweden) and then by other socialwelfare transfers (e.g., from 17% to 9% in Sweden). While Ireland’s ‘openingposition’, meaning the at-risk-of-poverty rate when market income alone isconsidered prior to any social transfers, is reasonably good by EU standards (onlyFinland and Sweden start with lower rates), it is — along with Denmark — thecountry in which pensions make the least impact on the at-risk-of-poverty rate.
ireland’s social protection in a comparative context 127
34. And the data provided by the successor to the ECHP, viz., EU SILC.
35. Luxembourg excepted.
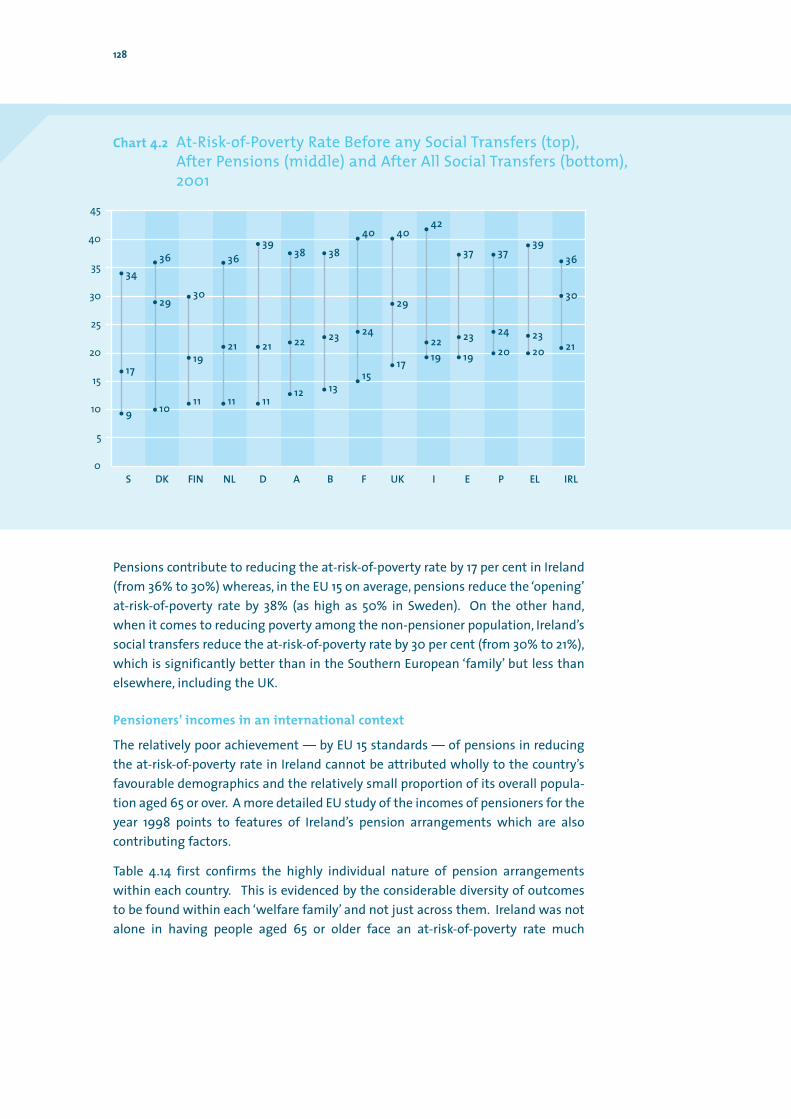
128
Pensions contribute to reducing the at-risk-of-poverty rate by 17 per cent in Ireland(from 36% to 30%) whereas, in the EU 15 on average, pensions reduce the ‘opening’at-risk-of-poverty rate by 38% (as high as 50% in Sweden). On the other hand,when it comes to reducing poverty among the non-pensioner population, Ireland’ssocial transfers reduce the at-risk-of-poverty rate by 30 per cent (from 30% to 21%),which is significantly better than in the Southern European ‘family’ but less thanelsewhere, including the UK.
Pensioners’ incomes in an international context
The relatively poor achievement — by EU 15 standards — of pensions in reducingthe at-risk-of-poverty rate in Ireland cannot be attributed wholly to the country’sfavourable demographics and the relatively small proportion of its overall popula-tion aged 65 or over. A more detailed EU study of the incomes of pensioners for theyear 1998 points to features of Ireland’s pension arrangements which are alsocontributing factors.
Table 4.14 first confirms the highly individual nature of pension arrangementswithin each country. This is evidenced by the considerable diversity of outcomesto be found within each ‘welfare family’ and not just across them. Ireland was notalone in having people aged 65 or older face an at-risk-of-poverty rate much
Chart 4.2 At-Risk-of-Poverty Rate Before any Social Transfers (top),After Pensions (middle) and After All Social Transfers (bottom),2001
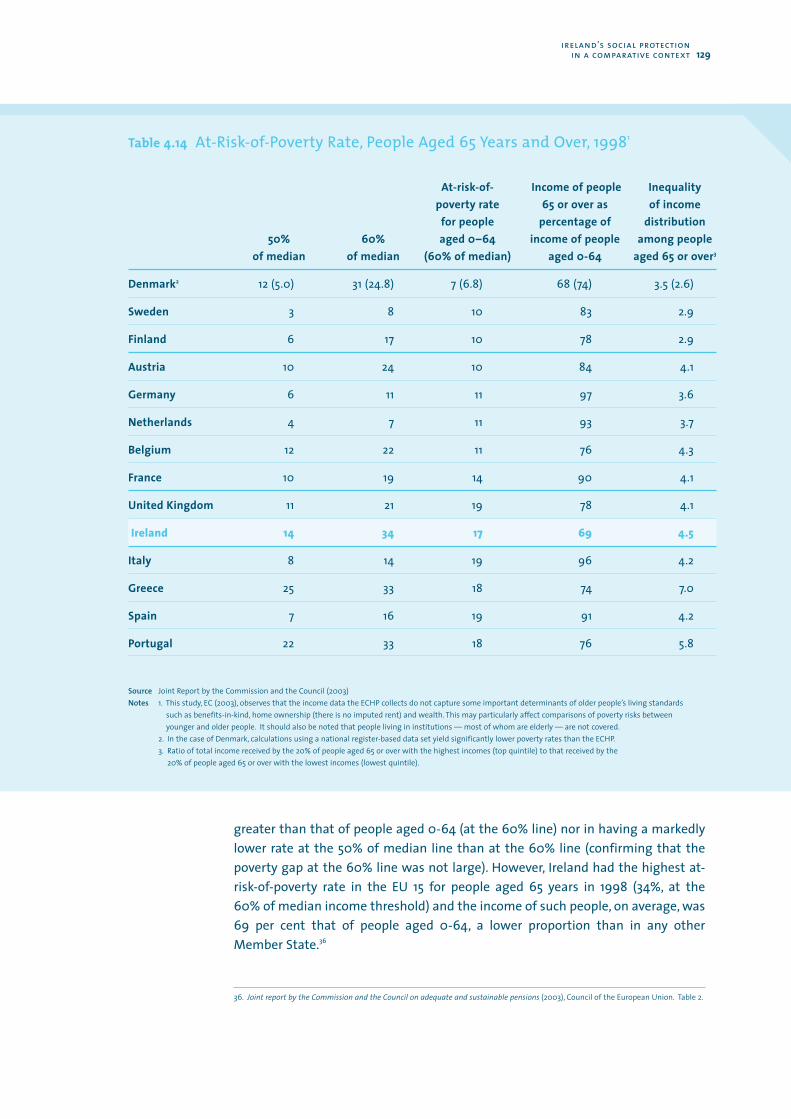
greater than that of people aged 0-64 (at the 60% line) nor in having a markedlylower rate at the 50% of median line than at the 60% line (confirming that thepoverty gap at the 60% line was not large). However, Ireland had the highest at-risk-of-poverty rate in the EU 15 for people aged 65 years in 1998 (34%, at the 60% of median income threshold) and the income of such people, on average, was69 per cent that of people aged 0-64, a lower proportion than in any otherMember State.36
ireland’s social protection in a comparative context 129
36. Joint report by the Commission and the Council on adequate and sustainable pensions (2003), Council of the European Union. Table 2.
Table 4.14 At-Risk-of-Poverty Rate, People Aged 65 Years and Over, 19981
At-risk-of- Income of people Inequalitypoverty rate 65 or over as of income
for people percentage of distribution50% 60% aged 0–64 income of people among people
of median of median (60% of median) aged 0-64 aged 65 or over3
Denmark2 12 (5.0) 31 (24.8) 7 (6.8) 68 (74) 3.5 (2.6)
Sweden 3 8 10 83 2.9
Finland 6 17 10 78 2.9
Austria 10 24 10 84 4.1
Germany 6 11 11 97 3.6
Netherlands 4 7 11 93 3.7
Belgium 12 22 11 76 4.3
France 10 19 14 90 4.1
United Kingdom 11 21 19 78 4.1
Ireland 14 34 17 69 4.5
Italy 8 14 19 96 4.2
Greece 25 33 18 74 7.0
Spain 7 16 19 91 4.2
Portugal 22 33 18 76 5.8
Source Joint Report by the Commission and the Council (2003)Notes 1. This study, EC (2003), observes that the income data the ECHP collects do not capture some important determinants of older people’s living standards
such as benefits-in-kind, home ownership (there is no imputed rent) and wealth. This may particularly affect comparisons of poverty risks between younger and older people. It should also be noted that people living in institutions — most of whom are elderly — are not covered.
2. In the case of Denmark, calculations using a national register-based data set yield significantly lower poverty rates than the ECHP.3. Ratio of total income received by the 20% of people aged 65 or over with the highest incomes (top quintile) to that received by the
20% of people aged 65 or over with the lowest incomes (lowest quintile).
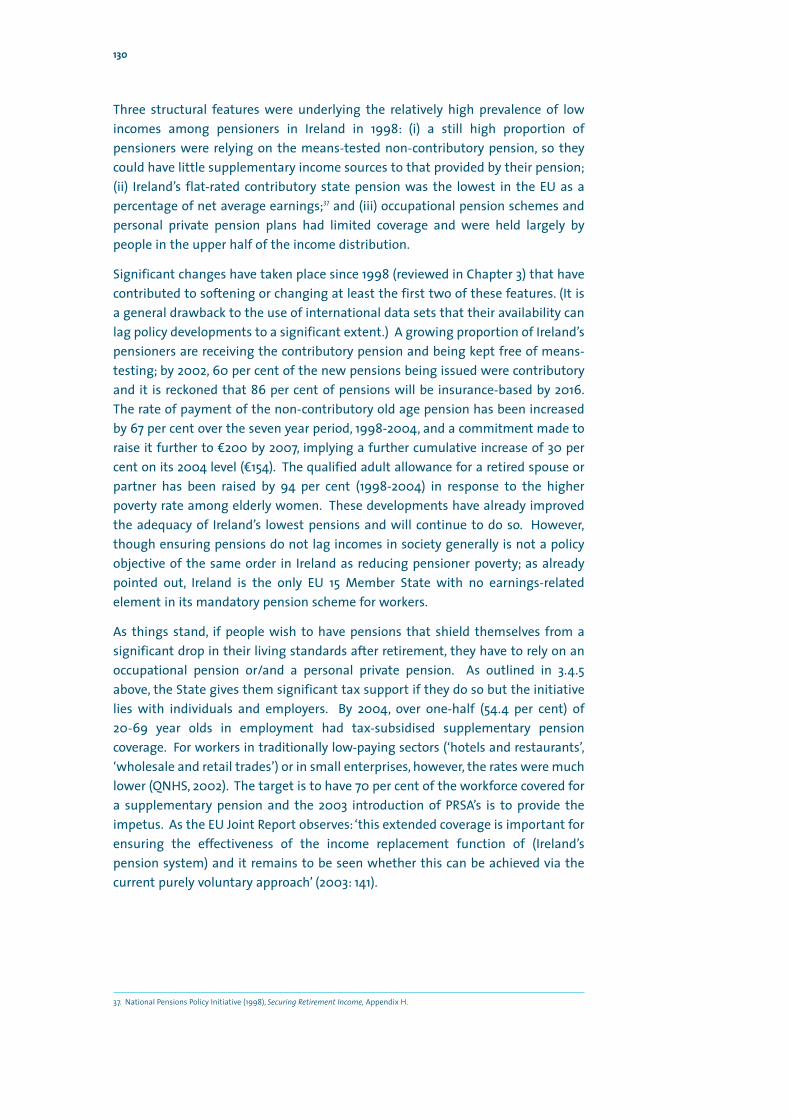
Three structural features were underlying the relatively high prevalence of lowincomes among pensioners in Ireland in 1998: (i) a still high proportion ofpensioners were relying on the means-tested non-contributory pension, so theycould have little supplementary income sources to that provided by their pension;(ii) Ireland’s flat-rated contributory state pension was the lowest in the EU as apercentage of net average earnings;37 and (iii) occupational pension schemes andpersonal private pension plans had limited coverage and were held largely bypeople in the upper half of the income distribution.
Significant changes have taken place since 1998 (reviewed in Chapter 3) that havecontributed to softening or changing at least the first two of these features. (It isa general drawback to the use of international data sets that their availability canlag policy developments to a significant extent.) A growing proportion of Ireland’spensioners are receiving the contributory pension and being kept free of means-testing; by 2002, 60 per cent of the new pensions being issued were contributoryand it is reckoned that 86 per cent of pensions will be insurance-based by 2016.The rate of payment of the non-contributory old age pension has been increasedby 67 per cent over the seven year period, 1998-2004, and a commitment made toraise it further to d200 by 2007, implying a further cumulative increase of 30 percent on its 2004 level (d154). The qualified adult allowance for a retired spouse orpartner has been raised by 94 per cent (1998-2004) in response to the higherpoverty rate among elderly women. These developments have already improvedthe adequacy of Ireland’s lowest pensions and will continue to do so. However,though ensuring pensions do not lag incomes in society generally is not a policyobjective of the same order in Ireland as reducing pensioner poverty; as alreadypointed out, Ireland is the only EU 15 Member State with no earnings-relatedelement in its mandatory pension scheme for workers.
As things stand, if people wish to have pensions that shield themselves from asignificant drop in their living standards after retirement, they have to rely on anoccupational pension or/and a personal private pension. As outlined in 3.4.5above, the State gives them significant tax support if they do so but the initiativelies with individuals and employers. By 2004, over one-half (54.4 per cent) of 20-69 year olds in employment had tax-subsidised supplementary pensioncoverage. For workers in traditionally low-paying sectors (‘hotels and restaurants’,‘wholesale and retail trades’) or in small enterprises, however, the rates were muchlower (QNHS, 2002). The target is to have 70 per cent of the workforce covered fora supplementary pension and the 2003 introduction of PRSA’s is to provide theimpetus. As the EU Joint Report observes: ‘this extended coverage is important forensuring the effectiveness of the income replacement function of (Ireland’spension system) and it remains to be seen whether this can be achieved via thecurrent purely voluntary approach’ (2003: 141).
130
37. National Pensions Policy Initiative (1998), Securing Retirement Income, Appendix H.
Child income supports in an international context
Data are available, though in a less detailed manner, on how children are affectedby the distribution of income in the EU Member States. As Chart 4.3 illustrates,Ireland’s relative standing within the EU 15 is poor: 26 per cent of children in Irelandin the year 2000 were estimated to be in households where the equivaliseddisposable income was below 60 per cent of the median (only Portugal had ahigher rate). A similar proportion of children had been at risk in Ireland in 1994.Several countries had improved on their 1994 position, notably the UK, Germanyand Belgium, while in some the situation facing children had deteriorated(principally the Netherlands).
ireland’s social protection in a comparative context 131
Chart 4.3 At-Risk-of-Poverty Rates, 0–15 Year Olds, 1994 and 2000
0
5
10
15
20
25
30
1994 2000Source Joint Report on Social Inclusion (2004)
It cannot be unambiguously concluded from Ireland’s internationally high childpoverty rates that low levels of child income support are the problem. In fact, asregards child poverty in Ireland and several other members of the Anglo- Saxon‘welfare family’, the problem, at heart, may not be a low level of child incomesupports but the number of parents/ guardians with no market earnings, the lowlevel of welfare support to these adults and the fact that a large proportion of it ismeans-tested. Some studies point in this direction. Callan et al (2004) haveexpressed the value of child income supports in 1998 in Ireland, the Netherlandsand Denmark as a percentage of average industrial earnings in each country. Theyfound that Ireland was making a proportionate effort in child income support thatcompared favourably with the other two countries and, in certain instances,comfortably surpassed them (op. cit., Table 6.3). However, in that same year, 23 percent of Ireland’s children (under 16 year olds) were estimated to be at-risk-of-poverty (at the 60 per cent of median threshold) as against 17 per cent in theNetherlands and 3 per cent in Denmark (The Social Situation in the EuropeanUnion 2003).
Bradbury and Jäntti, (2001) found that, while Ireland had a much higher povertyrate than the Netherlands, public cash transfers per child were at approximatelythe same level in both countries; the lower Dutch child poverty rate was becausemarket income per child was three and a half times greater in the Netherlandsthan in Ireland. The authors concluded:‘In the English-speaking countries, with theprominent exception of the US, social transfers to the families of the poorest one-fifth of children are quite substantial. Instead, the reason for their high levels ofchild poverty lies in the low levels of market incomes received by the mostdisadvantaged families’ (op. cit., 28).38 This observation, in fact, it will be arguedbelow, reaches beyond child income support to constitute something of a leit-motif for how to improve Ireland’s social welfare arrangements for people ofworking age.
Research, carried out by the University of York for the Department of Work andPensions (UK), allows Ireland’s child income supports in 2001 to be viewed incomparison with those of 22 other industrialised countries.39 It is important tobear in mind that this is a study of inputs rather than of outcomes – it identifiesthe level and composition of public support to households with children acrosscountries, a task of considerable complexity. The subsequent step of relating thedifferences in these child benefit packages across countries to such differences inchild poverty or to other indicators of child well-being was not part of its remit.Nevertheless, given Ireland’s poor ranking on child income poverty, it is surprisingthat Ireland’s cash transfers on behalf of children are found to be at a high level
132
38. Förster (2000) had also found that, in the mid-1990s, an exceptionally large number of households with children in Ireland weregenerating little market income; the proportion of total market income generated by the bottom 30 per cent of households was thelowest in Ireland of all the countries he studied.
39. Bradshaw and Finch (2002), A Comparison of Child Benefit Packages in 22 Countries. A study carried out on behalf of the DWP,University of York. The countries are the EU 15 Member States, the Anglophone four (USA, Canada, Australia and New Zealand),Norway, Israel and Japan - the comparable data obtained applied to the situation as of July, 2001
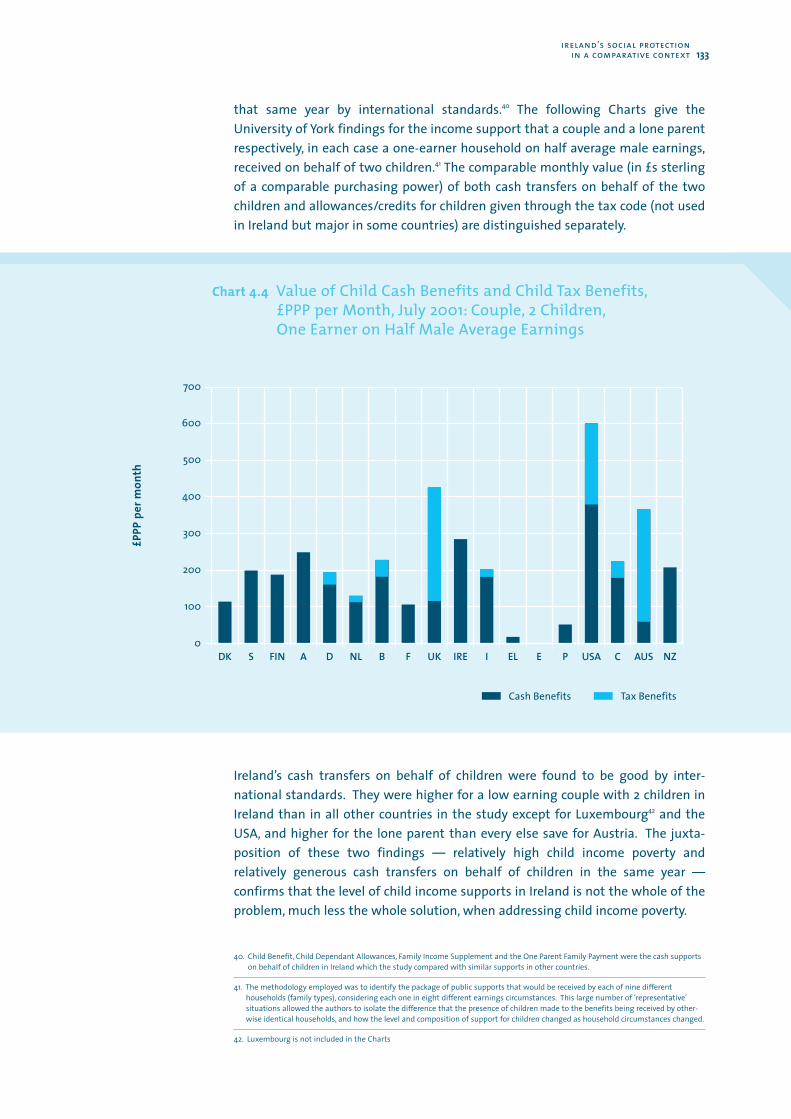
that same year by international standards.40 The following Charts give theUniversity of York findings for the income support that a couple and a lone parentrespectively, in each case a one-earner household on half average male earnings,received on behalf of two children.41 The comparable monthly value (in £s sterlingof a comparable purchasing power) of both cash transfers on behalf of the twochildren and allowances/credits for children given through the tax code (not usedin Ireland but major in some countries) are distinguished separately.
Ireland’s cash transfers on behalf of children were found to be good by inter-national standards. They were higher for a low earning couple with 2 children inIreland than in all other countries in the study except for Luxembourg42 and theUSA, and higher for the lone parent than every else save for Austria. The juxta-position of these two findings — relatively high child income poverty andrelatively generous cash transfers on behalf of children in the same year —confirms that the level of child income supports in Ireland is not the whole of theproblem, much less the whole solution, when addressing child income poverty.
ireland’s social protection in a comparative context 133
40. Child Benefit, Child Dependant Allowances, Family Income Supplement and the One Parent Family Payment were the cash supportson behalf of children in Ireland which the study compared with similar supports in other countries.
41. The methodology employed was to identify the package of public supports that would be received by each of nine differenthouseholds (family types), considering each one in eight different earnings circumstances. This large number of 'representative'situations allowed the authors to isolate the difference that the presence of children made to the benefits being received by other-wise identical households, and how the level and composition of support for children changed as household circumstances changed.
42. Luxembourg is not included in the Charts
Chart 4.4 Value of Child Cash Benefits and Child Tax Benefits,£PPP per Month, July 2001: Couple, 2 Children,One Earner on Half Male Average Earnings
0
Cash Benefits Tax Benefits
100
200
300
400
500
600
700
£PPP
per
mon
th
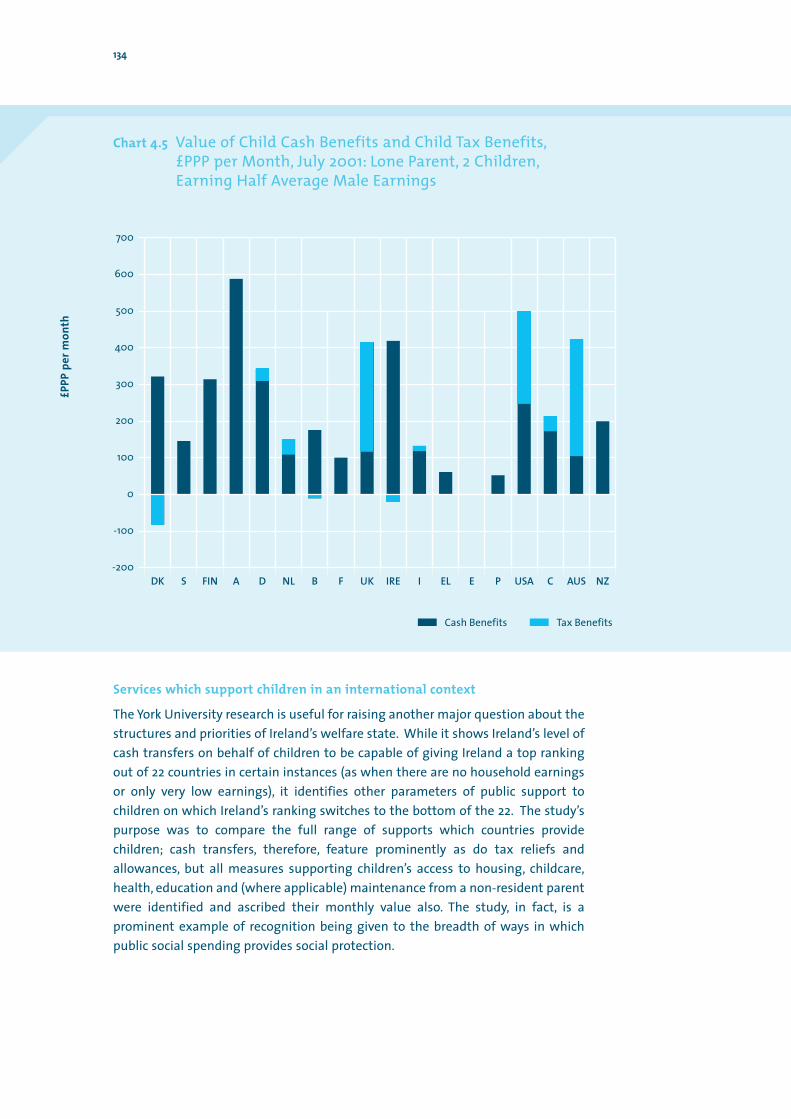
Services which support children in an international context
The York University research is useful for raising another major question about thestructures and priorities of Ireland’s welfare state. While it shows Ireland’s level ofcash transfers on behalf of children to be capable of giving Ireland a top rankingout of 22 countries in certain instances (as when there are no household earningsor only very low earnings), it identifies other parameters of public support tochildren on which Ireland’s ranking switches to the bottom of the 22. The study’spurpose was to compare the full range of supports which countries providechildren; cash transfers, therefore, feature prominently as do tax reliefs andallowances, but all measures supporting children’s access to housing, childcare,health, education and (where applicable) maintenance from a non-resident parentwere identified and ascribed their monthly value also. The study, in fact, is aprominent example of recognition being given to the breadth of ways in whichpublic social spending provides social protection.
134
Chart 4.5 Value of Child Cash Benefits and Child Tax Benefits,£PPP per Month, July 2001: Lone Parent, 2 Children,Earning Half Average Male Earnings
0
100
200
300
400
500
600
700
-100
-200
Cash Benefits Tax Benefits
£PPP
per
mon
th
Where Ireland’s overall support for children compares least favourably with othercountries is that key services on which children depend — principally childcarebut also, to a lesser degree, education and health — are both expensive andattract no state subvention (be it in the shape of a tax allowance, voucher orpriority access to a public service). While households where no parent isemployed are relatively the most shielded, when parents earn at even modestlevels they are exposed to — by international standards — high net costs. Theexposure of lone parents in particular to high net costs of childcare accounts fora quite dramatic difference in ranking of the overall level of support extended tothem, depending on whether they remain in home duties or are earning. WhileIreland’s package of supports for a lone parent with one child on social assistancewas the best of the 22 countries studied (op. cit., p. 131), it swung to last positionwhen the lone parent was earning average female earnings and paying forchildcare. In fact, help with childcare in Ireland was at the lowest level in the 22countries studied — its very high cost (second highest after the UK) was notoffset by any tax allowance or other subsidy (139).
An OECD review team have independently assessed Ireland’s publicly fundedsupports for young children (DES, 2004). Their report makes clear the extent towhich current Irish practice lags developments in other countries: the shortduration of paid maternity leave by international standards, the extreme paucityof childcare places for children aged 0-3 years, the informal and uneven quality ofmuch childminding, the slow adaptation of Ireland’s infant classes to reflect newinsights and best practice in how young children learn, the unrealised potential ofschools as local centres in which out-of-hours services for 3-6 year olds are povided,the inadequate weighting given early childhood in national educational spending,and the room for significantly improved coordination across government depart-ments and with the community and voluntary and private sectors in developingand providing services to young children.
Giving an overall cross-country ranking to child benefit packages, which compriseincome supports and services and vary differently by earnings levels, family typesand age of children, may have limited value; for example, it is difficult to weightone country’s more generous supports for lone parents against another countriesmore generous subsidies to low earning parents generally. For such as it is worth,Ireland’s total package of publicly funded supports for children is accorded amedian ranking in the University of York Study. As already mentioned, the rankingimproves markedly when cash supports for children are considered in isolation,and tops the table where parents who are not employed or earning at very lowlevels are the only cases compared. However, as the picture is widened to embracesupports to parents with other than very low incomes, the withdrawal rates inIreland are shown to be high by international standards, while the inclusion ofservices reveals the low level of subsidies to the costs of childcare, schooling andhealth in Ireland. The relative generosity of Ireland’s child benefits package,therefore, slips.43 The study remains, however, as a strong example of the need toview any social welfare payment levels in conjunction with eligibility conditions,conditionality, and compensatory or supplementary access to services.
ireland’s social protection in a comparative context 135
43. The report’s authors acknowledge that the ‘representative’ earnings circumstances they focussed on were biased towardshouseholds on low incomes — the ‘richest’ household considered had two earners, one on the country’s average male earnings andthe other on average female earnings. This means that countries which engaged in more targeting of child supports were likely toemerge with a better ranking than countries where child supports more usually assumed a universal nature.
4.5 Conclusions
Ireland’s welfare state — by EU 15 standards — uses a moderate to low proportionof national resources in providing services and a low proportion in providing cashtransfers. Its welfare state is associated with a taxation structure that is light onlabour by EU 15 standards and rests significantly on consumption. Key features ofthe contemporary Irish context make the question of the adequacy of Ireland’scurrent levels of social spending a complex one and international comparisons, inparticular, should be approached cautiously.
The finding that Ireland is by international standards a ‘low spender’ does notapply to health spending which, for a ‘young’ country, is broadly comparable toother countries in the share of national resources being devoted to it. It does apply,however, with more force to education. Educational spending accounts for a comparatively small share of Ireland’s GNP considering, in particular, theunderdeveloped state of provision for early childhood and adult education. Cashtransfers are also low compared to other countries principally because of the lowerbill for pensions but also because of the Irish welfare state’s high degree of relianceon means-testing.
It can be argued that several forms of social spending require higher priority ifIreland is to advance its economy and society in the directions it wishes to. Forexample, it is difficult to see how employment rates will rise significantly further,particularly among women, unless spending is increased on key services whichsupport people in employment (childcare, eldercare, etc.). It is difficult to see skilllevels rising among people in work without much greater recourse to second-chance and further education and training. It is difficult to see the significantminority of children and young people who are underperforming in the schoolsystem being saved for the knowledge economy and information society withoutgreater and more effective investment in tackling child poverty and educationaldisadvantage. It is difficult to see metropolitan centres developing in Irelandwhich are attractive to internationally-mobile knowledge workers without theinvestments that reduce social exclusion and make urban areas safe and attractive.
At the same time, there are considerable built-in factors (principally populationageing) that are likely to increase public social spending as a proportion of GNPanyway, without new spending commitments being undertaken. This makes it allthe more important to improve the efficiency of social spending, particularly inhealth but also in tackling educational disadvantage, and to make more trans-parent the routes which connect public spending to outcomes.
Appendix 4.A Ireland’s ‘means’
An issue frequently raised is the choice of measure which should be used as an indicator of Ireland’s economic ‘means’. The principal candidates are GDP, GNP and GNI.
136
GDP or GNP?
Gross Domestic Product (GDP) includes the value of the economic activityundertaken by multinational companies in the Irish economy, which Gross NationalProduct (GNP) does not. The gap between these two measures is, by far, the widestin the European Union with GDP exceeding GNP in 2002 by some 20 per cent.44
Furthermore, the already substantial margin of 12 percentage points by which GDPexceeded GNP in 1993 approximately doubled over the ensuing decade reflectingthe major contribution inward investment made to Ireland’s economic boom. It isargued that using GDP exaggerates Ireland’s true wealth position and that ratiosincorporating it impart a downward bias to Ireland’s ‘welfare effort’. This is becauseextensive payments of royalties and license fees take place out of the productionvalue of multinationals while the remaining profits contribute only once to the taxbase (through the 12.5 per cent corporation tax) before being repatriated; they arenot subject to further rounds of taxation as would happen if they took the form ofdividend payments to Irish residents that funded higher domestic consumption.
While these observations are valid, concluding that GNP is the better measure of thetax base available to fund social protection overlooks the significance of the taxrevenue which multinationals are contributing. The Enterprise Strategy Groupestimated that foreign-owned companies in Ireland assisted by the developmentagencies accounted for approximately d2.4bn (47%) of all corporation tax revenue in2003 (ESG, 2004: 10), enough to fund, for example, Child Benefit and the One ParentFamily Payment in that year, and more than enough to run the country’s primary andsecondary schools. Using GNP rather than GDP therefore typically reduces the extentof Ireland’s relative underspending in comparison with other EU countries.Converting to GNP, however, is ‘kind’ to Ireland as it underestimates the income baseavailable to support social spending, though not by as much as GDP exaggerates it.
GNP or GNI?45
Gross National Income adds to GNP the value of net receipts from the EU. Thesepeaked at 7.0 per cent of GNP in 1991 but declined steadily as a proportion of GNPafter that to 1.3 per cent in 2003. This decline was in net terms and due to rising out-payments to the EU Budget; the absolute level of incoming-payments was much thesame in nominal terms in 2003 as in the peak year of 1991. While the vast bulk ofthese receipts are not spent on social protection — receipts from the EuropeanSocial Fund (ESF) are of most significance to social protection but are a small part oftotal receipts from EU sources (averaging 6 per cent of the total in recent years —they clearly contribute to easing pressure on the public finances. Using GNP ratherthan GNI as a measure of the resource-base available to fund social protectionmildly understates the position in the opening years of the current decade. Theunderstatement becomes more significant as one moves further back into the1990s when net receipts from the EU were at their height; in 1991, GNI was greaterthan GNP by 7 percentage points in 1991 and the part of total EU receipts accountedfor by ESF receipts was also greater.
ireland’s social protection in a comparative context 137
44. Indicators of the scale of multinational activity within the Irish economy are that the stock of foreign direct investment per capita in Ireland was the highest in the world next to Hong Kong and that foreign companies employed more people in Ireland in 2003 inmanufacturing and internationally-traded services than Irish companies. See the Enterprise Strategy Group (2004), Ahead of theCurve: Ireland's Place in the Global Economy.
45. The data used here are in the Department of Finance (2004), Budgetary and Economic Statistics. Tables 10 and 11.

The Structure of Ireland’s currentWelfare State and the PrincipalStrategies advanced for its Reform
5
5.1 Introduction
The previous chapter viewed Ireland’s welfare state in an international context; thedata suggest Ireland is a member of an Anglo-Saxon welfare cluster or family. Inreflecting on international differences, scholars have gone further and developedtypologies of welfare states that reflect the most salient manner in whichindustrialised countries built their respective systems for providing social protec-tion.1 These clarify how some countries concentrate on providing universal benefitsfunded with significant tax revenue, others on insurance based benefits paid for byemployment contributions, and others on targeted benefits funded with modesttax revenue. The most usual conclusion is that Ireland has taken the third routeand is a variant, therefore, of the liberal or Anglo-Saxon model. In support of this,such factors can be cited as:
s The concentration on providing basic levels of services and weak commitmentto reducing inequalities;
s The high degree of reliance on means-testing (of income transfers and accessto services);
s The low proportion of resources devoted to social spending;
s The emphasis within social insurance on solidarity and very limited practice ofincome replacement;
s The fact that middle and higher income groups are encouraged to supplementbasic provision by using their own resources and drawing on tax expenditures;
s The limited services facilitating the participation of women in employment;
s The lightly regulated labour market.
139
1. The seminal study was Gosta Esping-Andersen’s The Three Worlds of Welfare Capitalism (1990).
However, the Council is aware that Ireland’s welfare state — like most others whenthey too are examined closely — resists easy classification. A classification shouldbe adopted cautiously, if at all, when features thrown into the background are assignificant as features the classification highlights. For example, Ireland’s welfarearrangements also show features of a ‘solidaristic’ approach and provide signifi-cant points of similarity with the Nordic and Continental European models.For example:
s The purchasing power of social welfare payments has consistently beenincreased;
s National partnership arrangements have adopted consensual approaches towage-setting, paid particular attention to increasing the lowest wages andfacilitated consultation on a widening set of government policies;
s Rapid employment creation was not accompanied by a widening dispersion of earnings;
s A significant set of active labour market programmes have been developed.Ireland’s public spending on them (as a per cent of GDP) is closer to Nordic andContinental European levels than to those in other Anglo-Saxon countries;
s Policies and programmes to tackle social inclusion and local concentrations ofsocial disadvantage have been innovative and widely participated in.
This chapter does not set out to clarify the ‘type’ of welfare state to which Ireland’sarrangements for social protection currently belong or should belong. Its perspec-tive is that welfare states differ more in the combinations they effect of threeroutes to providing social protection — i.e., protection to people as citizens fundedfrom general taxation, protection to people as workers funded through employ-ment contributions, protection restricted to people in need funded out of generaltaxation — than in the exclusivity with which they adopt one route.2 The moremature welfare states of other European countries have more defined ideologicalcontours than the Irish welfare state for historical reasons. They are all hybrid tosome degree, however, and, like Ireland, are engaged in on-going attempts toachieve greater efficiency and effectiveness in responding to endogenous andexogenous economic and social changes through rebalancing their respectivedegrees of reliance on the three routes.
The next section briefly conceptualises the current core structure of Ireland’swelfare state. The following three sections examine arguments for and againstIreland’s welfare state becoming decidedly more committed to developinguniversal benefits, or more reliant on social insurance, or more engaged intargeting as an overarching strategy. A final sixth section briefly reflects on the EUcontext to welfare state reform and on the need for a new architecture to Ireland’swelfare state to benefit from, and contribute to, the manner in which the EUsupports and encourages member states to ensure that high levels of socialprotection are attained and maintained in the 21st century.
140
2. For example, the generous universal benefits funded from high general taxation in Nordic countries receive more attention than theconditionality, means-testing and less generous benefits that attach to people with no employment record also typical of thosecountries.
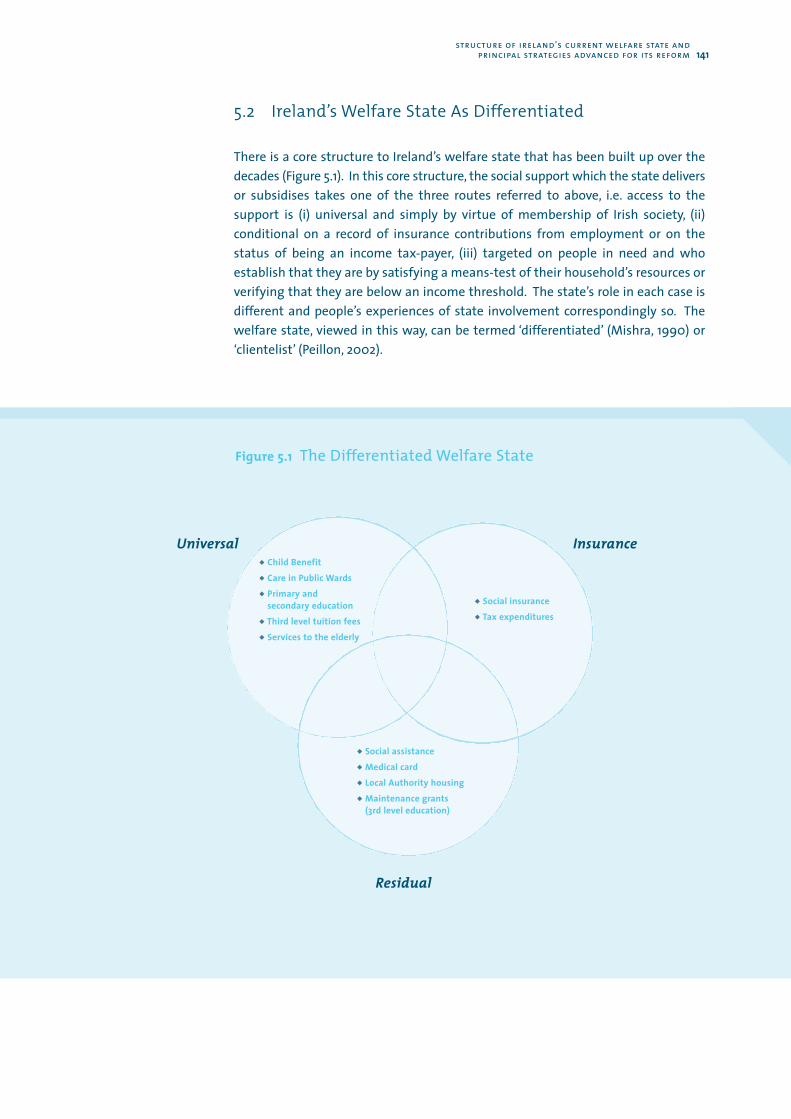
5.2 Ireland’s Welfare State As Differentiated
There is a core structure to Ireland’s welfare state that has been built up over thedecades (Figure 5.1). In this core structure, the social support which the state deliversor subsidises takes one of the three routes referred to above, i.e. access to thesupport is (i) universal and simply by virtue of membership of Irish society, (ii)conditional on a record of insurance contributions from employment or on thestatus of being an income tax-payer, (iii) targeted on people in need and whoestablish that they are by satisfying a means-test of their household’s resources orverifying that they are below an income threshold. The state’s role in each case isdifferent and people’s experiences of state involvement correspondingly so. Thewelfare state, viewed in this way, can be termed ‘differentiated’ (Mishra, 1990) or‘clientelist’ (Peillon, 2002).
structure of ireland’s current welfare state andprincipal strategies advanced for its reform 141
Figure 5.1 The Differentiated Welfare State
s Social assistance
s Medical card
s Local Authority housing
s Maintenance grants(3rd level education)
s Social insurance
s Tax expenditures
s Child Benefit
s Care in Public Wards
s Primary and secondary education
s Third level tuition fees
s Services to the elderly
Universal Insurance
Residual
Understandably, this structure to the current activities of the Irish welfare statetends to lead to the choice of strategic options for its further development beingframed as (a) strengthening its universalism (borrowing from the Scandinavian,social democratic model), or (b) strengthening its insurance-based supports(borrowing from Continental Europe’s Christian democratic model), or (c) becomingmore decidedly a residualist welfare state (borrowing further from the Anglo-Saxon, liberal model).
For example:
s Some of those who focus on combating inequality and poverty favour uncondi-tional access to a wider set of quality public services and a guaranteed basicminimum income;
s Those who focus on supporting people in employment underscore themutuality and majority appeal of social protection based on insurance and seekto widen the risks that are insurable;
s Those who focus on a dynamic economy generating jobs and tax revenue as thefoundation of sustainable social programmes argue that improved standardsfor those not attached to the labour force are best provided by targeting publicsocial expenditure on those with clearly established needs.
However, changed circumstances are undermining the validity of overly relying onany one of them as a dominant response to improving social protection goingforward.
s The trouble with universalism is that, unless it is properly resourced, it spreadsresources too thinly either to alleviate the needs of the poor on its own or tomeet the standards which the non-poor want. The latter then treat what theyreceive as subsidies to private arrangements and lose interest in, or even seekto secede from, public systems. Adequately resourced universalism, on the otherhand, requires taxation at high levels and a strong willingness to pay on thepart of the population;
s The trouble with social insurance is that building the necessary contributionsrecord through employment remains beyond the reach of a significant minorityof the population, while the payroll taxes and sense of entitlement to whichthey give rise are out of step with contemporary labour market developmentsand risk creating immobility rather than fostering flexibility;
s The trouble with means-testing is that it perpetuates a fundamental dividewithin society where, on the one side, a minority remain dependent on systemswhich effectively constitute a parallel world (‘closed circuits’) out of whichthere is limited mobility while, on the other, suspicion of a ‘non-deserving’ poorand sense that resources are being abused lead, periodically, to unilateralchanges being imposed on people’s lives.
The following sections explore in more detail the case for adopting, respectively,universalism, insurance or residualism as a template for developing Ireland’swelfare state.
142
5.3 The Case For More Universalism
This section examines the contention that welfare reform should set out to provideimproved income support and better public services for everyone in Irish society, ona basis of need, out of general taxation
This model has always had a strong appeal. It needs a population that is bothhighly employed and willing to pay taxes at the level necessary to resource anefficient public system. It needs a private sector that remains competitive even ina high tax environment. Finally, it needs a public system to deliver services andincome transfers in ways that both support high employment rates and protectthe living standards of those not in employment.3 For quite some time, theScandinavian countries were regarded as providing tangible evidence that themodel was feasible, even for countries with different cultural characteristics.However, as elsewhere, the internationalisation of the Scandinavian economieshas given direction to social welfare reform that is softening their strong egalitari-anism, the monopoly role of their public sectors as service providers, and thegenerosity of their income transfers (Geve, 2004). These reforms are being under-taken to protect and retain the essentials of their system, not to change it for adifferent one. In fact, the Scandinavian countries continue to demonstrate thathigh levels of public social expenditure, when efficient and effective in deliveringservices and transfers, retain the support of taxpayers and employers, and do notimpede economic performance. Nevertheless, the direction of their reforms pointsto reasons why Ireland would be immensely challenged if it were to adopt furtheruniversalism as a template for its welfare state.
s The private sectors in Scandinavia are increasingly concerned that taxation is ata level which undermines their international cost competitiveness.
s Tax-payers are increasingly critical of the quality and level of public serviceswhich they are obtaining in return for paying high taxes.
s The expansion of private services employment is being constrained by a tradi-tion of strong wage egalitarianism. This is particularly a constraint on thegrowth of small and medium-sized enterprises.
s The ageing of their populations is prompting new methods for determining thelevel of contributory pension to which people are entitled (linking it more to theindividual’s own contributions).4
s Higher unemployment is introducing elements of targeting that ensure themore effective allocation of services.
s A strong work ethic has consistently been reflected in an effective condition-ality being attached to the administration of long-term unemploymentassistance at the municipal or local level.
structure of ireland’s current welfare state andprincipal strategies advanced for its reform 143
3. It is a remarkable fact that the Scandinavian countries have among the highest employment rates in the OECD world in the late1990s and that most of the remaining one-quarter of their populations of working age are in receipt of social welfare (Madsen, 2002;Nordic Council of Ministers, 2000).
4. For example, the Swedish pension reform means that there are no longer any promises about the level of future benefits, not even asa ratio of earlier income. The level of the pension benefit is contingent on the growth of real wages and changes in life expectancyafter retirement.
s There is an acknowledged need to address high levels of recourse to sicknessand early retirement benefits.
s Immigration is increasing the diversity of their populations and creating a newchallenge to the ‘citizenship contract’ on which their welfare states are based.Non-nationals in the Nordic countries have much higher non-employmentrates than nationals.
These challenges to the Scandinavian welfare model are a reminder that it, too, isengaged in implementing significant reforms to meet the changed economic andsocial conditions facing EU member states in the 21st century. However, their lowat-risk-of-poverty rates, high female employment rates and containment ofincome inequality remain remarkable features. They are also in the vanguard ofcountries showing success in developing a knowledge economy and learningsociety. The normative appeal of the Nordic model for Ireland, however, has to betempered by the taxation levels on consumption and labour income whichaccompany them as well as by Ireland’s greater economic dynamism of recentyears, which has produced a remarkable closing of the gap with levels of economicactivity in Scandinavia. Only a decade ago, the Irish policy-system accepted thatScandinavian and Alpine countries provided Ireland with a learning opportunitybecause of the evident superiority of their economic performance (NESC, 1993).This economic superiority is no longer so evident today (Table 5.1).
This economic backdrop can be used to support two arguments. Ireland’s strongeconomic performance means that we can now ambition emulating what are, still,superior Scandinavian welfare outcomes on many fronts (lower child poverty,lower poverty among women, greater female participation, etc.). However, it alsoincreases Ireland’s confidence that the social deficits it faces can be addressed inways that explicitly align with its successful economic model and that Ireland’sroutes to improved welfare outcomes need to be created rather than replicatedfrom other countries. The previous chapter (Table 4.11), for example, summarisedevidence that trends (as distinct from levels) in the distribution of income inIreland since the mid-1980s have been decidedly more egalitarian than in theNordic countries.
144
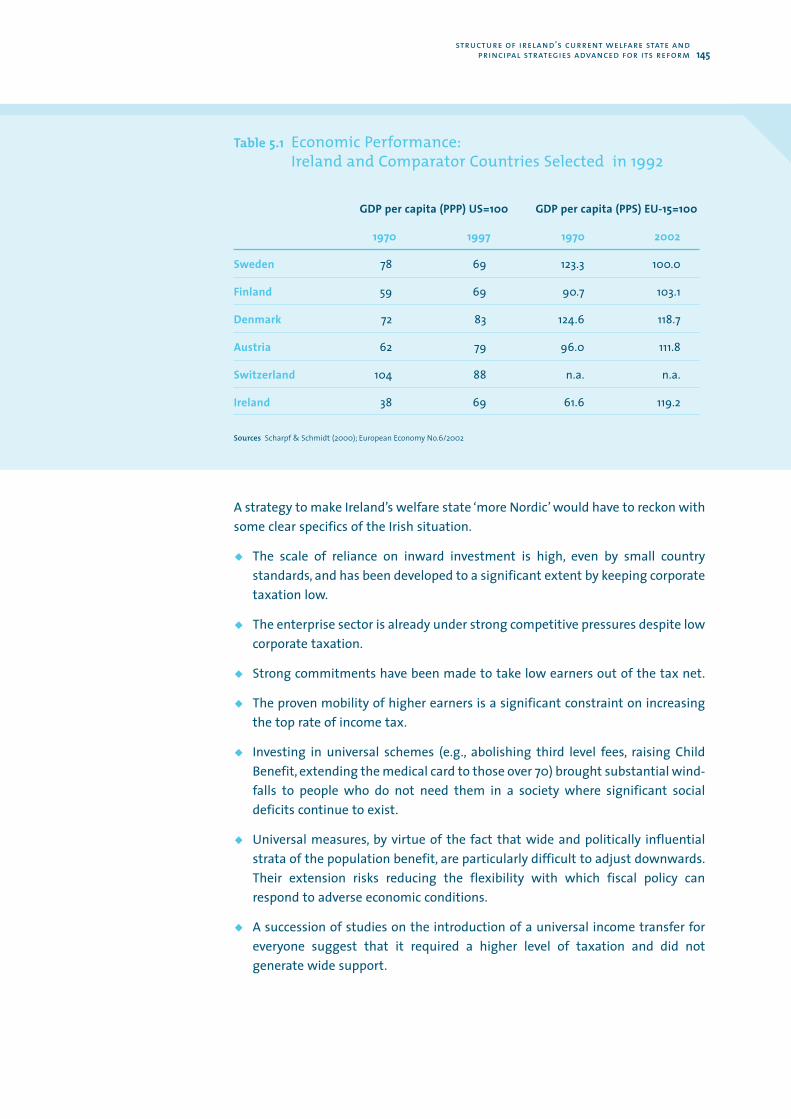
structure of ireland’s current welfare state andprincipal strategies advanced for its reform 145
A strategy to make Ireland’s welfare state ‘more Nordic’ would have to reckon withsome clear specifics of the Irish situation.
s The scale of reliance on inward investment is high, even by small countrystandards, and has been developed to a significant extent by keeping corporatetaxation low.
s The enterprise sector is already under strong competitive pressures despite lowcorporate taxation.
s Strong commitments have been made to take low earners out of the tax net.
s The proven mobility of higher earners is a significant constraint on increasingthe top rate of income tax.
s Investing in universal schemes (e.g., abolishing third level fees, raising ChildBenefit, extending the medical card to those over 70) brought substantial wind-falls to people who do not need them in a society where significant socialdeficits continue to exist.
s Universal measures, by virtue of the fact that wide and politically influentialstrata of the population benefit, are particularly difficult to adjust downwards.Their extension risks reducing the flexibility with which fiscal policy canrespond to adverse economic conditions.
s A succession of studies on the introduction of a universal income transfer foreveryone suggest that it required a higher level of taxation and did notgenerate wide support.
Table 5.1 Economic Performance:Ireland and Comparator Countries Selected in 1992
GDP per capita (PPP) US=100 GDP per capita (PPS) EU-15=100
1970 1997 1970 2002
Sweden 78 69 123.3 100.0
Finland 59 69 90.7 103.1
Denmark 72 83 124.6 118.7
Austria 62 79 96.0 111.8
Switzerland 104 88 n.a. n.a.
Ireland 38 69 61.6 119.2
Sources Scharpf & Schmidt (2000); European Economy No.6/2002

s The universal services which are currently provided (e.g., medical attention inpublic wards of hospitals, school education at primary and secondary level,public transport) are widely acknowledged to need substantial further invest-ment, which makes the introduction of wholly new public service infra-structures (e.g., childcare) more questionable.
In short, the specifics of Ireland’s situation and the thrust of reforms to theScandinavian welfare model caution against adopting the high levels of taxation,public social spending and public service provision, which characterised the goldenyears of the Nordic model, as a template to guide the next phase of developmentin Ireland’s welfare state. This is not to rule out any further development ofuniversal measures. Overcoming the deep dualism in health services by signifi-cantly improving the public health services to which residency in Ireland givesentitlement, for example, may be insufficiently appreciated for the role it wouldplay in strengthening labour market mobility and societal cohesion. If currentpolicies prove unable to bring sufficient affordable childcare places on stream sothat female employment rates begin to stagnate or slip, the costs and benefits ofdifferent ways of instituting a public system may have to be considered. Theexperience of several countries in making their main public pensions universal bybasing their eligibility on residence rather than work contributions may deservethorough comparison with Ireland’s combination of a low level contributorypension, the escalating cost and regressive nature of subsidies to supplement it,and high pensioner poverty.
5.4 The Case For A Stronger Insurance System
This section examines the contention that welfare reform in Ireland should centrearound strengthening the social insurance system so as to embrace groups andrisks not currently covered.
The social insurance model is based on the fact that defined populations sharecommon risks. The logic of pooling contributions to provide protection for therandomly generated victims of these risks is, then, quite compelling. Individualsmake their contributions governed by neutral, actuarial formulae and, should anyone of them fall foul of a covered risk, she or he receives a replacement income asan entitlement and not as charity. For over one hundred years, valued attributesof this mechanism have included that individuals receive social protection ‘as aright’ and free of means-testing, that employers are enlisted and co-ordinated todischarge some of their social obligations to their workers, and that its logic isrelatively free of political ideology and, thus, from manipulation by the govern-ment of the day. In contrast to charity or means-tested social assistance, socialinsurance has always retained the strong connotation that people, on the basis oftheir equal status as workers, are doing something for each other.
The insurance system, to some extent, is at its best when the population engagingin mutual insurance is composed of relatively high-productivity individuals. Inthese ideal circumstances, the levels of risk are low and the income generated bymodest contribution rates are substantial, with the result that generous cover can
146
be provided to the subscribing members who fall victims of a risk. The level ofpayment can even be linked to previous earnings and seek to protect the victim’sestablished status and standard of living.
Two types of national insurance systems can be distinguished. In ContinentalEurope, countries with a strong ‘Bismarkian’ tradition developed high levels ofsocial protection for insured workers (and their families) but tended to keep theless productive groups in their populations from membership of the workforce(e.g., by prolonging education, emphasising domestic duties for women, givingdisability a labour market meaning, encouraging early retirement, etc.). Thehistorical development of their national social insurance systems is partly the storyof how a variety of occupationally-based insurance funds came to be aligned ormerged with each other (e.g., Palier, 2002, for France). This was frequently conflic-tual. Relatively privileged groups of workers resisted occupational groups withlower productivity and higher risks than themselves being admitted to theirinsurance funds. Groups with precisely those characteristics struggled to beaccepted as workers with sufficient productivity and prospects for steady employ-ment as to be capable of becoming net contributors to insurance funds, ratherthan ‘free riders’ threatening their solvency.
Countries with a ‘Beveridgian’ tradition have emphasised broad national, ratherthan specific occupational, solidarity as the basis of the insurance contract andsought to keep the levels of cover and contribution rates consistent with schememembership on the part of workers with relatively modest productivity and weakmarket positions. Their funds, by contrast with those in ‘Bismarkian’ countries, arewholly managed by public authorities without participation by workers oremployers, pay flat-rate benefits for relatively short periods, and — thus — featurea large element of redistribution as low paid workers receive proportionately morethan higher paid workers.
Several developments have softened the strong reliance on social insurance inContinental European welfare states.
s Social insurance contributions have been reduced or exempted on low wages ina bid to raise employment rates among low productivity groups. ‘Special’employments have been created where social contributions are not required.
s The entitlements to which insurance gives rise have been pared back — and/orthe contributions record giving access to them increased — as a rising pensionsbill squeezes the funds available to cover other contingencies.
s New, means-tested schemes have been introduced to address the needs of agrowing number of people unable to access insurance-based systems or whoseentitlement has been exhausted by long unemployment durations.
s There is also evidence that the internationalisation of national economies hasbeen particularly difficult for heavily insurance-based systems to deal with.High ‘tax wedges’, to which contribution rates contribute, have impacted nega-tively on the competitive position of exporting enterprises.
structure of ireland’s current welfare state andprincipal strategies advanced for its reform 147
s The counter-cyclical effect of paying high insurance-based unemploymentcompensation during a recession has largely been lost in leakage to imports.
s The high level of benefits and the degree of involvement of workers’ repre-sentatives in managing insurance funds increased the incentive and power ofworkers to resist change.
Ireland’s social insurance fund is in the Beveridgian tradition. It is managed prima-rily by the Department of Social and Family Affairs5, has a small variation acrossvery broad occupational groupings in the contribution rates paid (there are sevenmain contribution classes) and a similarly small variation in the range of riskscovered for each occupational grouping. The benefits paid are the same foreveryone independently of the level of their previous earnings (a pay-relatedelement in unemployment benefit was discontinued in 1994; maternity andadoptive benefit replaces 70 per cent of previous earnings but up to a low ceiling).Changes to these features are the prerogative of government. Contributors haveno guarantee of the level of payment to which their contributions entitle them.Indeed, the contractual obligations, on both sides, are vague. Currently, the levelsof payments are not significantly higher than their means-tested social assistancecounterparts. Nevertheless, the fact that insurance benefits are free of means-testing and paid in recognition of a contribution record makes the extension ofinsurance-based cover attractive to groups with weak earnings power.
Significant changes have been made to Ireland’s social insurance system over thelast 20 years, which have made it more inclusive, more comprehensive and lesslikely to impact negatively on relatively low paying jobs. Since 1988, the self-employed, part-time workers, newly recruited civil servants and CommunityEmployment workers have become required to contribute to the Fund and eligiblefor its benefits; greater use has been made of credited contributions and creditdisregards (periods of time omitted when calculating a person’s annual contribu-tions average) to minimise the reductions in the levels of benefit to which peoplewho interrupt work records for valid reasons (e.g., caring) become entitled; newbenefits have been added for contributors (dental and optical benefits for spouses,Widower’s Contributory Pension, Carer’s Benefit) and existing benefits improved(e.g., extension of maternity benefit); an exemption from employee contributionswas introduced for those with very low earnings and, later, on a small first trancheof everyone’s earnings, while a lower employer rate was introduced for the low paid.
These changes testify to the dynamism of the Social Insurance Fund in Ireland andthe high level of interest surrounding it. The growing significance of immigrationto Ireland’s economy adds a further dimension to its attractiveness. Where entitle-ment and access to benefits are acquired largely on the basis of employmentcontributions, high levels of social protection exercise less of a ‘pull factor’ thanwhen provided through generous universal or means-tested benefits and there ismore of a guarantee that immigration will contribute to social revenues in propor-tion to, or even more than, it adds to social spending.
148
5. Any surplus of contributions over payments is transfered to an investment account, managed by the Department of Finance (throughthe National Treasury Management Agency).
However, further improvements to insurance-based social protection in Ireland areunlikely to be on a scale or have a reach as to impact, on their own, in a decisive wayon the population’s evolving social needs. This is for several reasons.
s The pensioner population is set to grow and their income needs will absorb anincreasing share of expenditure from the Insurance Fund.
s The most productive workers are already in the insurance system and includingfurther groups (e.g., carers in the home, farm women, the spouses of self-employed workers, people seeking only part-time work, etc.) will increasedemands on the Fund more than its resources. In fact, some of the currentdiscussions in Ireland today echo the arguments which have taken place in Bismarkian countries for and against extending social insurance to groups of workers with relatively weak labour market positions (Murphy, 2003b:NWCI, 2002).
s While setting, and even strengthening, contribution thresholds before a persongains access to cover is essential to the solvency of Insurance Funds, somegroups of workers will continue to have difficulty attaining these thresholds(low-skilled new entrants, casual workers, young mothers, illegal workers, etc.).
s Workers already in the system would ideally like the cover they receiveextended and improved, e.g., a further extension of paid maternity leave, theintroduction of a period of paid parental leave, a part-time unemploymentbenefit for parents with young children, some recognition for higher earners ofthe level of payments they make into the fund, etc.
s Raising PRSI contribution rates (for employers and/or employees) or removingthe ceiling to employee contributions would have implications for the competi-tiveness of enterprises and worker’s take-home pay which those involved inwage-bargaining and social partnership would have to agree to address. This isthe mild Irish variant of a feature of social insurance reforms in many countries,viz., that they proceed at a pace and in a direction which favour those fundingthe current system (Kapstein and Milanovic, 2003).
The main drawback, however, to the social insurance model being accepted as thetemplate to guide further welfare reform in Ireland remains the very foundation ofthe system. It ‘basically insures those who make their living from the labourmarket against the risk of losing that income’ (DSCFA, 1996) and is not designed toprotect those who cannot access paid work.
If further developments of social insurance are not the main answer to meetingthe old and new social deficits requiring urgent redress, nevertheless, greater useof the Fund can be integral to social progress over the coming years.6 For example,once the support services that free more women to take employment are in place,further significant increases in female employment can be expected to strengthenthe Fund and reduce the high at-risk-of-poverty rates among women in retirement.The Fund may also be expected to play an enhanced role in improving the family-friendliness of an Irish labour market where maternity and parental leaveentitlements lag considerably behind the standards set by the more advanced
structure of ireland’s current welfare state andprincipal strategies advanced for its reform 149
6. FISIM, 2004
knowledge economies and learning societies in the European Union. Finally, andperhaps most importantly, the contributory pension — even when no longer paidfor wholly by the Fund (the National Pension Reserve Fund will begin to part-fundit after 2025) — may be expected to grow in significance in the coming years.Central arguments in support of seeing this happen, and winning agreement forwhatever measures are chosen to enable it, include: the rapidly escalating cost oftax expenditures for occupational and private pensions and their highly regressiveincidence; the lack of interest in and support for the contributory pension amonghigh earners because of the major imbalance between the amount of theircontributions and the level of their entitlement; the alleviation of pressure onthose company pension schemes where benefits are defined as supplementary tothe contributory pension; the direct impact of a higher contributory pension inreducing pensioner poverty; the beneficial impact on workers of knowing that,through their employment, a major and not minor part of their standard of livingin retirement is being secured.
5.5 The Case For More Targeting
This section examines the contention that welfare reform in Ireland shouldprimarily be about increased targeting and travelling further down the road of aresidual welfare state.
There are several reasons why, despite Ireland’s strong economic performance ofthe 1990s, maintaining a strongly residualist welfare state appears a reasonabletemplate to guide future reforms.
s Substantial additional resources for social protection cannot be presumed on.The sensitivity of Ireland’s economic model to higher taxes, the trend withinthe EU (especially after the most recent enlargement) towards lower corporatetax and the significant deficits in physical infrastructure which the economicboom of the 1990s exposed, other things being equal, increase the attractive-ness of an approach which reserves additional resources for social protection tothose with the greatest need.
s The more recent innovations which eschewed a targeted for a universalapproach to addressing social disadvantage have each been seen to entail sig-nificant deadweight effects (abolishing fees at third level, raising Child Benefit,extending the medical card to all aged 70 or over). While each innovation wasworth more to people on low incomes (had a larger proportionate impact ontheir circumstances and provided public support in a manner easy to access andfree of stigma), significant proportions of the resources used went to people onhigh incomes.
s Even where universal and/or insurance-based social protection measures areextensively developed, the need remains for tailored, high-supportprogrammes to target people experiencing multiple disadvantage.
150
s Services motivated by the needs of people in exceptionally difficult circum-stances need constantly to be innovated, evaluated and revised. This is moresuccessful with the participation of beneficiaries and the involvement of volun-tary and community groups. This is good for democracy. It is also a notablefeature of Ireland’s current practices which merits being further strengthened.
s Ireland has developed public institutions with extensive experience indelivering means-tested income transfers and services (principally the Depart-ment of Social and Family Affairs). By and large, they achieve reductions inpoverty and social disadvantage with commendable efficiency in their use oftaxpayer resources.
Other considerations, however, suggest that Ireland’s welfare state has reached —or surpassed — the limit for relying on means-tested supports.
s Throughout the 1990s, the proportion of social spending (cash transfers andexpenditure on services) in Ireland that was means-tested was three times theaverage for the EU-15 (European Commission, 2002).
s Means-tested benefits can entail high marginal tax-plus-benefit-withdrawalrates with significant disincentive effects for their recipients; this extends totheir spouses/partners as means-testing is based on household means.
s As the mainstream of the population becomes more heavily focussed onemployment, there may be a decline in voters’ willingness to fund incometransfers to people of working age.7 This would make it easier for the politicalsystem to allow the relative living standards of this group decline.
s The discretionary and unpredictable way in which payment levels and otherparameters (earnings disregards, etc.) of social assistance payments are adjust-ed can increase frustration with, rather than appreciation of, the system. Means-tested social supports can be easy targets when fiscal economies are urgentlyneeded as their adjustment downwards occasions less formidable politicalresistance than alterations to programmes from which wide strata in the popu-lation benefit.
s There is evidence that dependency survives, if not thrives, in Ireland’s residualwelfare arrangements. A security is attached to benefit receipt which, thoughproviding a lower income, does not attach to the potential market earnings oflow skilled people. Several categorical payments to people of working-age are,effectively, of indefinite duration.
s Targeted schemes (combating educational disadvantage, area disadvantage,focussed on specific groups, etc.) have multiplied leading to growing difficultiesin ensuring their effective co-ordination, proper evaluation and value formoney. New schemes are introduced more easily than low-achieving ones areidentified and discontinued, or mainstream programmes altered in the light oflearning from high-achieving ones.
structure of ireland’s current welfare state andprincipal strategies advanced for its reform 151
7. While there is no comparable data for Ireland, British Social Attitudes: the 20th Report (2003) suggests that voters in a heavilyemployed society become more willing to pay higher taxes for improved public services but less willing to fund cash benefits to pooror unemployed people of working-age.
If targeting cash benefits and services were, indeed, the best answer to deprivationin Ireland, it would be reasonable to expect much less poverty than is currently thecase. Whether in providing cash transfers or services, however, targeting can beseen as part of the problem. For example, efficiency in ensuring that taxpayers’money is received only where categorical conditions are fully complied with andassessable household income is below a certain threshold requires active monitor-ing and supervision of recipients’ circumstances. Perversely, this continues todistance the households in question from the rest of the community. Their reduc-tion in status is not ameliorated by rises in the real value of the cash transfers theyreceive. Public bodies find it particularly difficult to discharge their statutoryresponsibilities to people on low incomes and/or to those residing in areas demar-cated as disadvantaged; a dynamic can set in that results in ‘poor services for poorpeople’ unless imaginative and highly resourced efforts are undertaken to arrest it.It is notable how access to public services, at specified standards of services, hasemerged as a strong objective in both Ireland’s Anti-Poverty Strategy and NationalDisability Strategy. When the administration and delivery of services for lowincome groups are carried out by area-based or specialist organisations in thevoluntary and community sector, stigma may be reduced and service qualityimproved but other challenges can arise. People may become ‘locked in’ to theirdeprived neighbourhoods; the outcomes being sought for individuals may bevague; the transparency and accountability with which resources are used may bebelow the standards of the public and private sectors.
It is a sobering observation that, despite the huge economic and social changeswhich Ireland has experienced in recent decades, there has been little improve-ment in relative social mobility. While the need undoubtedly remains to continuewith an extensive set of targeted programmes, their contribution to empoweringpeople and restoring equality of opportunity will need to be stronger. The issue ofresources will always be important but is seldom as paramount as the challenge ofunderstanding the complex family, peer, neighbourhood, ethnic group and inter-generational dynamics which contribute to shaping people’s aspirations, expecta-tions, values and beliefs. Ireland’s targeted programmes for tackling disadvantageneed to be informed by deeper contextual and qualitative research into the causesand transmission processes giving deprivation its tenacity and resilience.
5.6 The European Context
The European Union provides a hugely important institutional and policy contextfor the restructuring of countries’ welfare states, even though the main planks ofsocial policy remain firmly the competence of the nation state. The recent enlarge-ment of the Union, with its inclusion of member states whose living standards onentry were far below those of most of the existing members, has sharpened theneed to examine the bases on which access to social benefits is granted and themanner in which they are funded (Sinn, 2004). Furthermore, the very success ofthe European Union in a world where many regions have become more insecure
152
and impoverished poses acute challenges in balancing protection for citizens ofthe Union with global solidarity. Through the OMC process being applied to socialinclusion and pensions in particular, but also through the search for labour marketreforms that redress unemployment, the development of common policies onimmigration and asylum seekers, the jurisprudence of the European Court ofJustice, and in other ways, social policy formation in Ireland is influenced by and, inturn, influences developments throughout the Union.
The Council believes that the diversity and complexity of changes to welfare stateswithin the EU are poorly captured by suggesting there is a fundamental choice tobe made between a US model and a ‘European’ one (‘Boston or Berlin’). Neithershould analyses of the degree of convergence to which reforms in EU welfarestates are contributing be limited to a choice between ‘levelling up’ or ‘levellingdown.’ To maintain and improve the social protection extended to its population,each European welfare state is having to ensure that employment is protected andfostered, that meeting the pension and other needs of an ageing population isplaced on a sustainable footing, and that solidarity is exercised more effectivelywith much poorer populations within and beyond the Union.
The conclusion to this chapter is that European welfare states are increasinglyprizing a higher degree of hybridity because of the agility it provides. The futuredevelopment of Ireland’s welfare state, therefore, needs to be guided by theappreciation that significant learning is possible from each of the more sharplydefined welfare families in Europe while maintaining the hybrid character ofIreland’s system that now, more than before, is a potential strength. This is not agreen light for ‘muddling through’ or accepting an interest-group determined lineof uneven advance. The social deficits which exist, the lack of an overarchingstrategy for social protection and failures in implementing even what has beenagreed — motivating factors behind this Council study — are too serious to permitan acquiescence with a process of social development where a pattern,if any, can only be discerned in retrospect. The challenge in formulating anoverarching strategy for Ireland’s welfare state can be expressed, in part, asidentifying where and how further universalism, extending social insurance, andredesigning targeting are now required by Ireland’s society and economy, withparamount respect being accorded to improved outcomes rather than greaterideological clarity. If such creative integration is not to be reduced to clientelistic-driven development under a new name, it needs an appropriate conceptualisation ofwhat is being attempted and how — the subject matter of Chapter 6. It is alsoimperative to pay close attention to maximising the positive interactions betweenthe country’s core economic strategy and social policies, as was discussed in Chapter 2.
structure of ireland’s current welfare state andprincipal strategies advanced for its reform 153
8. For example, Sinn, H-W. (2004), EU Enlargement, Migration and the New Constitution. CESifo Working Paper No. 1367. December.

Re-conceptualising Ireland’s Welfare State
6
6.1 The Developmental Welfare State in Outline
The recognition that changes to Ireland’s welfare state cannot be guided by large-scale borrowing from the more defined regimes of other countries is, implicitly,acceptance that ‘historical contingency, internal heterogeneity and innovativehybridisation’ (Zeitlin and Trubeck, 2003) should be embraced as assets rather thanregarded as liabilities in improving Ireland’s standards of social protection.Chapter 5 has argued that elements of the three routes which have hitherto givenan individual access to social support in Ireland (citizen-based, insurance-basedand means-tested) need to be combined in a more deliberately integrated fashionthan before if Ireland’s welfare state is to complement the continuing trans-formation of the economy and secure social cohesion.
In recognition of the need for a more deliberate break with the habitual analyses,mindsets and procedures governing how social deficits are addressed in Ireland,the NESC Strategy for 2003-2005 proposed an alternative conceptualisation of thecore structure to the welfare state as better suited to guide future reforms.It provisionally termed this new structure, ‘the developmental welfare state’. Thisconceptualization posits three overlapping areas of welfare state activity. What iscontained within each area is summarily evoked in Figure 6.1 and the thrust of policyfor each area in Figure 6.2. They are expanded on further in sections 6.2 to 6.4.
A first area is a set of core services which the state undertakes responsibility forensuring are available to all members of society, at high standards and in ways thatare equitable but tailored to people’s circumstances (including their ability to pay)rather than uniform. These services range from familiar ones such as schooling andhospital access to newer ones such as childcare and adult learning. The servicesthemselves are not uniform outputs but are capable of gradation and adjustmentto help diverse groups attain similar outcomes. Needs of ‘non-traditional’ clientgroups, which were previously addressed outside the formal system, if at all, areaccepted as the responsibility of mainstream service providers who must now diver-sify and modulate their services to ensure equitable opportunities (e.g., access tohousing for those on low incomes or with special needs, education for childrenwith special needs and satisfactory school performance in disadvantaged areas,access everywhere for people with disabilities, knowledge of and preparation foremployment vacancies in disadvantaged areas). In the changed economic andsocial circumstances in which people now find themselves, access to this wide setof services has acquired a wholly new resonance; they underpin the social andeconomic participation of an increasingly diverse population and enhance labourmarket flexibility and competitiveness. Bringing these services on stream involves,
155
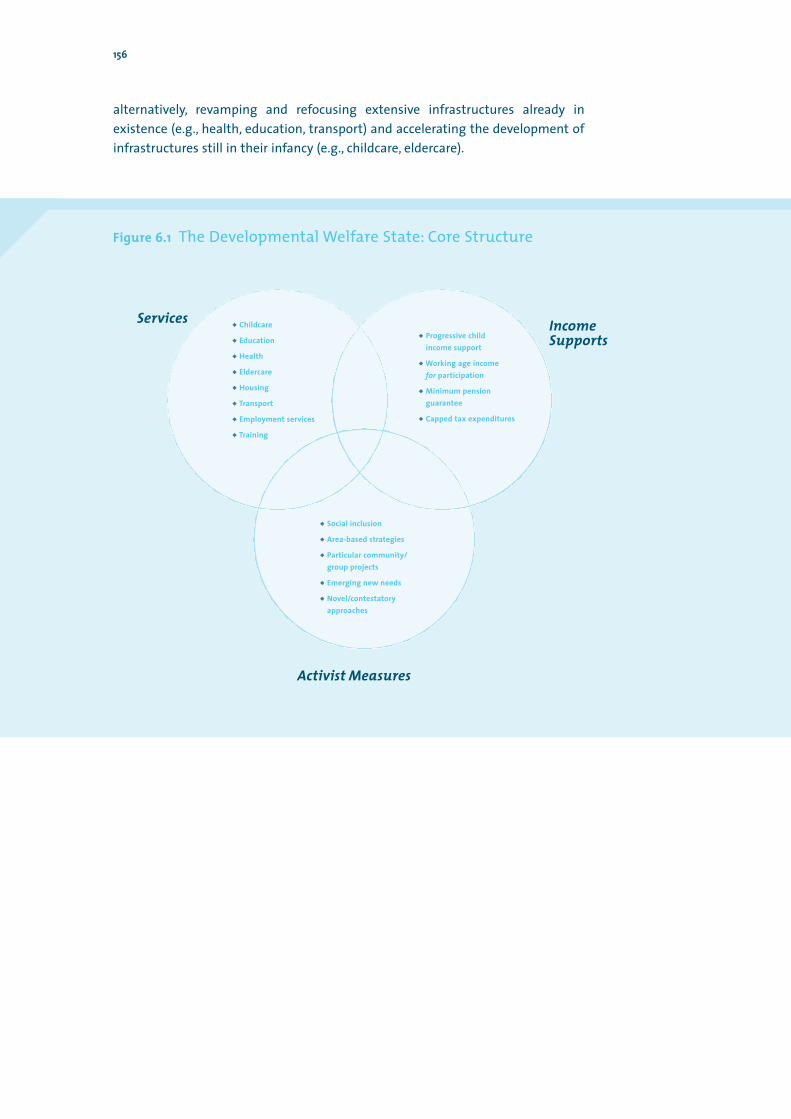
alternatively, revamping and refocusing extensive infrastructures already inexistence (e.g., health, education, transport) and accelerating the development ofinfrastructures still in their infancy (e.g., childcare, eldercare).
156
Figure 6.1 The Developmental Welfare State: Core Structure
s Social inclusion
s Area-based strategies
s Particular community/group projects
s Emerging new needs
s Novel/contestatoryapproaches
s Progressive child income support
s Working age income for participation
s Minimum pensionguarantee
s Capped tax expenditures
s Childcare
s Education
s Health
s Eldercare
s Housing
s Transport
s Employment services
s Training
Services IncomeSupports
Activist Measures
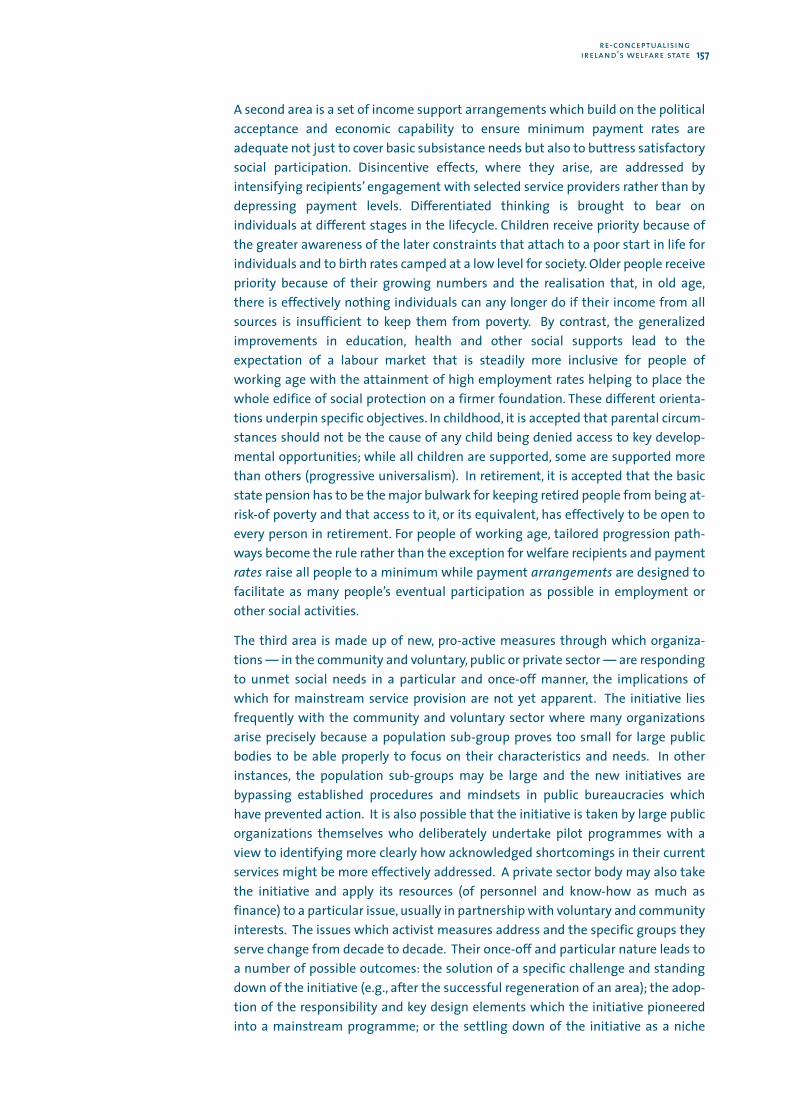
A second area is a set of income support arrangements which build on the politicalacceptance and economic capability to ensure minimum payment rates areadequate not just to cover basic subsistance needs but also to buttress satisfactorysocial participation. Disincentive effects, where they arise, are addressed byintensifying recipients’ engagement with selected service providers rather than bydepressing payment levels. Differentiated thinking is brought to bear onindividuals at different stages in the lifecycle. Children receive priority because ofthe greater awareness of the later constraints that attach to a poor start in life forindividuals and to birth rates camped at a low level for society. Older people receivepriority because of their growing numbers and the realisation that, in old age,there is effectively nothing individuals can any longer do if their income from allsources is insufficient to keep them from poverty. By contrast, the generalizedimprovements in education, health and other social supports lead to theexpectation of a labour market that is steadily more inclusive for people ofworking age with the attainment of high employment rates helping to place thewhole edifice of social protection on a firmer foundation. These different orienta-tions underpin specific objectives. In childhood, it is accepted that parental circum-stances should not be the cause of any child being denied access to key develop-mental opportunities; while all children are supported, some are supported morethan others (progressive universalism). In retirement, it is accepted that the basicstate pension has to be the major bulwark for keeping retired people from being at-risk-of poverty and that access to it, or its equivalent, has effectively to be open toevery person in retirement. For people of working age, tailored progression path-ways become the rule rather than the exception for welfare recipients and paymentrates raise all people to a minimum while payment arrangements are designed tofacilitate as many people’s eventual participation as possible in employment orother social activities.
The third area is made up of new, pro-active measures through which organiza-tions — in the community and voluntary, public or private sector — are respondingto unmet social needs in a particular and once-off manner, the implications ofwhich for mainstream service provision are not yet apparent. The initiative liesfrequently with the community and voluntary sector where many organizationsarise precisely because a population sub-group proves too small for large publicbodies to be able properly to focus on their characteristics and needs. In otherinstances, the population sub-groups may be large and the new initiatives arebypassing established procedures and mindsets in public bureaucracies whichhave prevented action. It is also possible that the initiative is taken by large publicorganizations themselves who deliberately undertake pilot programmes with aview to identifying more clearly how acknowledged shortcomings in their currentservices might be more effectively addressed. A private sector body may also takethe initiative and apply its resources (of personnel and know-how as much asfinance) to a particular issue, usually in partnership with voluntary and communityinterests. The issues which activist measures address and the specific groups theyserve change from decade to decade. Their once-off and particular nature leads toa number of possible outcomes: the solution of a specific challenge and standingdown of the initiative (e.g., after the successful regeneration of an area); the adop-tion of the responsibility and key design elements which the initiative pioneeredinto a mainstream programme; or the settling down of the initiative as a niche
re-conceptualising ireland’s welfare state 157
service with the organization behind it enjoying autonomy and long-term fundingin return for meeting agreed performance targets. A pattern that was importantin the history of the development of Ireland’s hybrid welfare state should not bepresumed to be over either: the expertise and dynamism initially brought to servea population sub-group may develop and diversify transforming the organizationbehind the small initiative into a relatively mainstream provider itself.
158
Figure 6.2 The Developmental Welfare State: Policy Thrusts
s Outcome focussed
s Evaluation and mainstreaming
s Multidimensional and tailored
s Public-voluntary-private partnerships
s Autonomy and long-term funding
s No child in poverty:progressive universalism
s Adequate welfare rateswithin progression pathways
s Inter and intra-generationalequity: capped universalism
s Government guarantorof levels, access,standards and equity
s Public sector providersimportant but notmonopolists
s Diverse provision
s Transparency and accountability
s Differentiated access
Services IncomeSupports
Activist Measures
6.2 Service Delivery in the Developmental Welfare State
6.2.1 State leadership in developing services
A radical development of services is the single most important route to improvingsocial protection for Ireland’s population in the years ahead. The services listed inFigure 6.1 are essential to attaining the workforce quality that underpins acompetitive, knowledge-based economy, maintaining social cohesion andcombating social exclusion. In some instances, a service is largely associated withpublic sector provision (e.g. education, health, employment services) and, in othercases, peripherally so (e.g. housing, childcare, transport). However, even in thelatter instances, the regulatory powers of the state and its responsibilities to ensureminimum service levels, quality standards and equitable access are majorinfluences on the provision of services by for-profit and non-profit private organi-sations. The state influences each service system through a wide variety of instru-ments — regulation, capital grants, grants-in-aid, tax expenditures, programmefunding, licensing arrangements, cash reimbursements, loan guarantees, publicprivate partnerships, etc. — as well as by undertaking direct public service provi-sion. Each service system has its own set of public bodies and agencies, alternatelyinvolved in regulating, planning, supporting and monitoring the service provisionof others or undertaking direct service provision themselves. The first public policychallenge, therefore, is to ensure that every member of Irish society has access tothe level and quality of service they need from the system, with quality and equitybeing assured. A subordinate challenge is to identify the appropriate scale andnature of direct public service provision.
The Irish state has long relied on a wide variety of ‘third parties’ to deliver socialprotection which the taxpayer funds in total or in part (recall the brief discussionin 3.2.2). Traditionally, church bodies and religious organisations were significantrecipients of public funds for public purposes. In more recent years, the set of thirdparties has significantly widened with the state using very different instrumentsor tools to enlist their involvement in meeting the goals of public social policy (e.g.,the Community Employment Programme to enlist community and voluntarygroups in activating the unemployed; PRSAs to enlist for-profit financial organi-sations in providing pensions; Part V of the 2000 Planning and Development Actand the long-term contracting of private rental accommodation to enlist privatedevelopers and landlords in providing social and affordable accommodation).Government today faces an increasing challenge in activating, orchestrating andmodulating the activities of a wide variety of actors to ensure that services ofdifferent types are delivered comprehensively and fairly to the Irish population.This is not the same as saying that the public sector is too large and needs torelinquish some of its activities to the private sector (‘privatisation’) or that it hasinherent inefficiencies which the introduction of overt or managed competitioncan overcome (‘reinventing government’). Rather, as social challenges grow indiversity and complexity, the state is having to have recourse to the expertise,niche positions, trust with client groups, flexibility and resources of for-profit andnon-profit private bodies to complement what it is able to achieve by fundingdirect public service provision.
re-conceptualising ireland’s welfare state 159
Perhaps the central reality of public problem solving for the foreseeable future(is) its collaborative nature, its reliance on a wide array of third parties inaddition to government to address public problems and pursue public purposes.…Under these circumstances… ‘network management’ rather than either publicmanagement or market dynamics comes closest to describing the central reali-ties involved. This form of management involves mutual adaptation throughbargaining and interaction rather than the command-and-control characteristicof public administration or the independent action characteristic of markets.(Salamon, 2002, The Tools of Government. A Guide to the New Governance,pp.8, 601)
One of the core requirements of public administration in the early 21st century,therefore, is to increase its expertise in ‘network management’ so as to facilitatediversified regimes for delivering services in each of which the state hasresponsibility for procuring comprehensive coverage, maintaining standards andensuring equity.1 Direct public provision of social services remains one routeamong others but, in the DWS, it too will be subject to accountability based on out-puts and to being challenged by research on how outputs relate to outcomes. Itsoperating premise will be that a combination of strong public sector organisationsand competition from private and non-profit organisations is most likely toachieve the best balance between accountability, innovation and efficiency. Thecore challenge to public sector providers is to replace a vicious circle between slowchange, unsatisfactory service standards, declining public support and low invest-ment with a virtuous one between successful change, leading standards, strongpublic support and high investment. In selected areas within a system, there maybe a case — and wide public support — for providing access to all members ofsociety on the basis of unconditional universalism (i.e., services free to users otherthan that they contribute to general taxation, e.g., schooling to age 16). Moregenerally, however, the state undertakes to ensure a set of differentiated routes ofaccess, tailored to people’s needs and circumstances, whereby no person isdeterred by limited income from using the service while capped charges remindusers of the resource consequences of their level of usage.
The structure of access to public health services is a case in point: medical care inpublic hospital wards is free to everyone normally resident in the state but with acharge per bed-night (subject to an annual ceiling) levied on the section of thepopulation considered to be in a position where they can pay a contribution totheir hospitalisation over and above their contribution to general tax revenue. It isconsistent to support this structure while believing that the standards of publicmedical care (e.g., waiting times), the income threshold below which there is freeaccess, and the level of the charges for patients above the income threshold, eachneed significant revision.
160
1. A case in point is the Council’s 2004 housing study, Housing in Ireland: Performance and Policy. Though less than one in ten house-holds has their housing provided directly by the state, the study underlined how every household has been, and is, vitally affected bythe quality, foresight and timing of public policy decisions in such areas as land management, spatial planning, infrastructuralinvestment, building regulation and its enforcement, and social housing. The study sought to accelerate a process whereby publicauthorities, at every level, have been slowly, unevenly but eventually understanding and managing Ireland’s housing system as awhole and discharging their complex and widening responsibilities in this area. It recommended greater pro-activity on the part ofthe public authorities in many areas while also concluding that an enhanced role is needed for the direct provision of housing by thepublic sector.
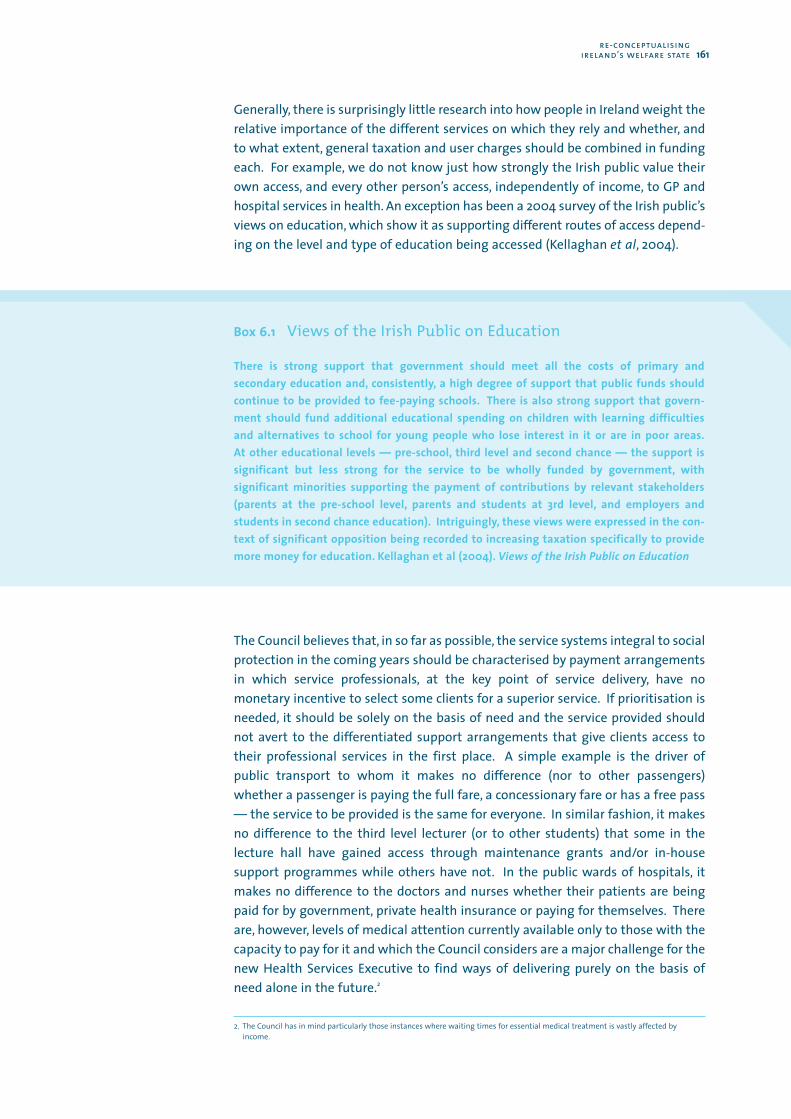
Generally, there is surprisingly little research into how people in Ireland weight therelative importance of the different services on which they rely and whether, andto what extent, general taxation and user charges should be combined in fundingeach. For example, we do not know just how strongly the Irish public value theirown access, and every other person’s access, independently of income, to GP andhospital services in health. An exception has been a 2004 survey of the Irish public’sviews on education, which show it as supporting different routes of access depend-ing on the level and type of education being accessed (Kellaghan et al, 2004).
The Council believes that, in so far as possible, the service systems integral to socialprotection in the coming years should be characterised by payment arrangementsin which service professionals, at the key point of service delivery, have nomonetary incentive to select some clients for a superior service. If prioritisation isneeded, it should be solely on the basis of need and the service provided shouldnot avert to the differentiated support arrangements that give clients access totheir professional services in the first place. A simple example is the driver ofpublic transport to whom it makes no difference (nor to other passengers)whether a passenger is paying the full fare, a concessionary fare or has a free pass— the service to be provided is the same for everyone. In similar fashion, it makesno difference to the third level lecturer (or to other students) that some in thelecture hall have gained access through maintenance grants and/or in-housesupport programmes while others have not. In the public wards of hospitals, itmakes no difference to the doctors and nurses whether their patients are beingpaid for by government, private health insurance or paying for themselves. Thereare, however, levels of medical attention currently available only to those with thecapacity to pay for it and which the Council considers are a major challenge for thenew Health Services Executive to find ways of delivering purely on the basis ofneed alone in the future.2
re-conceptualising ireland’s welfare state 161
2. The Council has in mind particularly those instances where waiting times for essential medical treatment is vastly affected byincome.
There is strong support that government should meet all the costs of primary andsecondary education and, consistently, a high degree of support that public funds shouldcontinue to be provided to fee-paying schools. There is also strong support that govern-ment should fund additional educational spending on children with learning difficultiesand alternatives to school for young people who lose interest in it or are in poor areas.At other educational levels — pre-school, third level and second chance — the support issignificant but less strong for the service to be wholly funded by government, withsignificant minorities supporting the payment of contributions by relevant stakeholders(parents at the pre-school level, parents and students at 3rd level, and employers andstudents in second chance education). Intriguingly, these views were expressed in the con-text of significant opposition being recorded to increasing taxation specifically to providemore money for education. Kellaghan et al (2004). Views of the Irish Public on Education
Box 6.1 Views of the Irish Public on Education
6.2.2 Challenges facing public sector providers
When the service systems that will be such a major part of social protection overthe coming decades are considered as a whole, the scope and quality of directpublic provision recur as a constant theme. While it is true that social protectionthat is paid for by the state does not have to be provided by the state, and probablethat many people now consider the quality of the service they receive moreimportant than who provides it, it is also the case that there can be an important— even leadership — role for public sector providers within services systems.Specific difficulties attend this scenario (see below) but their operations can becharacterised by low transaction costs (less need for regulators), equitable access,good working conditions, high levels of staff commitment and strong public trust.When these latent characteristics in a public sector organisation are developed,with neither efficiency nor service quality deteriorating, society has a particularlyvaluable asset. A UK study reflected: ‘In many public services, citizens value theservice received by others, as well as the service they themselves benefit from. Inother words, fair distribution in itself creates value’ (Kelly and Muers, 2002: 14).
The residualisation of public sector service providers
In reality, the ability of existing public sector service providers in Ireland to satisfyusers and retain the confidence of the public has come under unprecedented strainand there is evidence of a drift of the public from using them where the option exists.
s In health, private hospitals and private facilities within public hospitals arebeing used by a growing proportion of the population, partly to avoid the longwaiting times and more crowded facilities associated with public healthprovision. At the same time, a significant proportion of consultants’ time(though they receive full-time public sector salaries) is devoted to private prac-tice, while a declining proportion of GP’s time (whose status is self-employed)is devoted to public patients as the percentage of the population eligible for amedical card has declined.
s Within education, a growing number of parents are taking advantage of higherincomes to choose fee-paying schools for their children where the alternativeexists.3 A large proportion of students, by international standards, continue toenrolled in privately managed schools (non-fee paying and fee paying anddiscretionary private spending by their parents has been increasing (OECD, 2004).
s Within housing, local authority dwellings have declined significantly as aproportion of the national housing stock and, as tenancy of these dwellingsbecame increasingly associated with severe social disadvantage, better-offtenants redoubled their efforts to quit the sector and home-owners becamemore determined to avoid proximity to public housing. Satisfaction withhousing and neighbourhood conditions is particularly low among local author-ity tenants (Watson and Williams, 2003).
162
3. The number of pupils in fee-paying schools in Dublin increased as a proportion of all secondary school students from 24 per cent in1983-84 to 32 per cent in 2002/03.
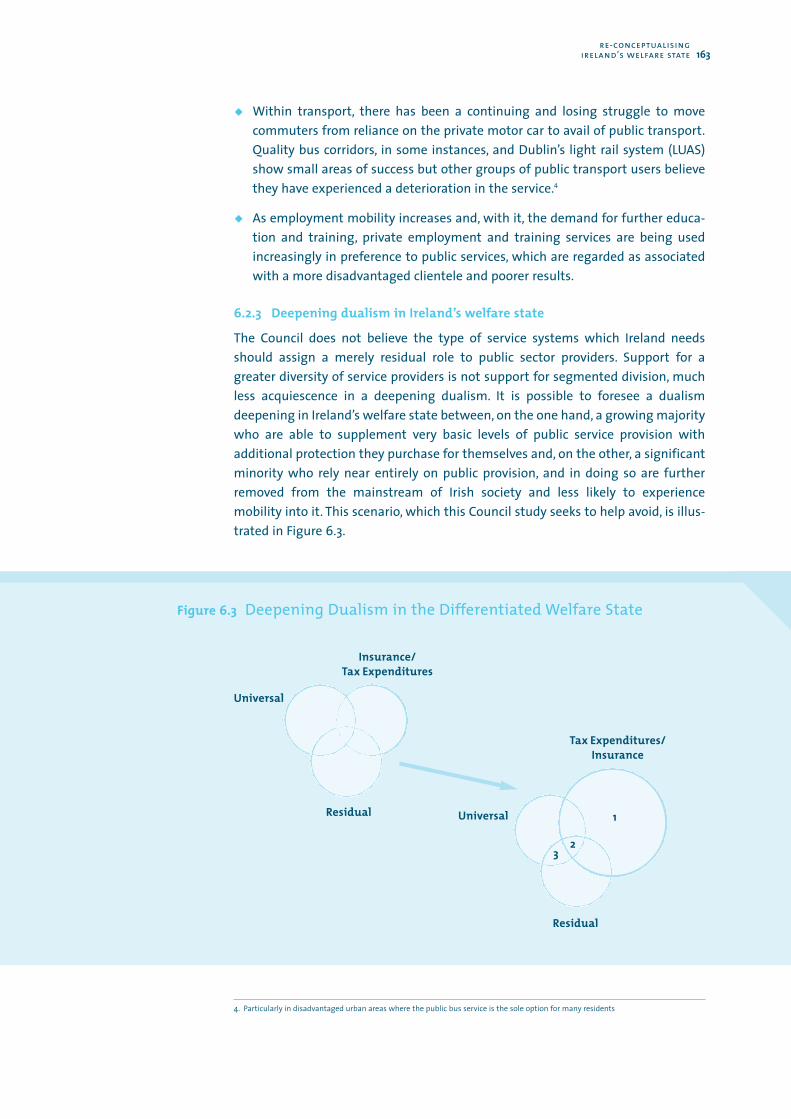
s Within transport, there has been a continuing and losing struggle to movecommuters from reliance on the private motor car to avail of public transport.Quality bus corridors, in some instances, and Dublin’s light rail system (LUAS)show small areas of success but other groups of public transport users believethey have experienced a deterioration in the service.4
s As employment mobility increases and, with it, the demand for further educa-tion and training, private employment and training services are being usedincreasingly in preference to public services, which are regarded as associatedwith a more disadvantaged clientele and poorer results.
6.2.3 Deepening dualism in Ireland’s welfare state
The Council does not believe the type of service systems which Ireland needsshould assign a merely residual role to public sector providers. Support for agreater diversity of service providers is not support for segmented division, muchless acquiescence in a deepening dualism. It is possible to foresee a dualismdeepening in Ireland’s welfare state between, on the one hand, a growing majoritywho are able to supplement very basic levels of public service provision withadditional protection they purchase for themselves and, on the other, a significantminority who rely near entirely on public provision, and in doing so are furtherremoved from the mainstream of Irish society and less likely to experiencemobility into it. This scenario, which this Council study seeks to help avoid, is illus-trated in Figure 6.3.
re-conceptualising ireland’s welfare state 163
4. Particularly in disadvantaged urban areas where the public bus service is the sole option for many residents
Figure 6.3 Deepening Dualism in the Differentiated Welfare State
Universal
Insurance/Tax Expenditures
Residual Universal
Tax Expenditures/Insurance
Residual
2
1
3
The movement depicted in this Figure (from the top left hand corner to the bottomright) and growth in relative size of the insurance/tax expenditures circle depictsseveral developments.
1. There is growing private social spending as more people come to rely on tax-subsidised (e.g., occupational and personal pensions, private health insurance),work-based (e.g., access to childcare, health insurance) or wholly unsubsidised(e.g., school fees, grind schools, neighbourhood security) social protection forthemselves and their families and less on what is publicly provided. Theuniversal benefits available to them out of general taxation (e.g., child benefit,medical treatment in public wards, etc.) and even their PRSI-based entitlements(e.g., unemployment benefit, the contributory pension) are insignificant tothem and scarcely feature in their planning for themselves and their families.
2. The proportion of people at work who yet experience the universal benefits andflat-rated insurance benefits to which they are entitled as significant bulwarksto their personal security grows smaller (2 and the overlap above), as does theproportion of them who are in receipt of some form of means-tested support(e.g., a medical card, local authority housing) because their earnings are so lowthat they qualify for benefits targeted on those with very low incomes (2 andthe overlap below).
3. There is a growing identification between being in receipt of means-testedsocial supports and being reliant on universal public services, a developmentwhich reduces the effectiveness of public services in helping people to overcomesocial marginalisation and secure satisfying work.
It should be noted that the unfolding of the scenario outlined in this way would besatisfactory for a large number of people. The quality of education, standards ofmedicine, attractiveness of neighbourhoods and security in retirement which theywould purchase could be higher than what they enjoy today and their sense ofcontrol would certainly improve. However, the Council does not support thedeliberate pursuit of greater reliance on higher private social spending as an over-arching strategy for Ireland’s welfare state. It considers that such a strategy forIreland would deepen rather than alleviate the dualism already characterising – tovarying degrees – people’s access to health services, housing, pensions, educationand much else. The strategy carries other risks too. It is extremely vulnerable toindividual’s employment careers and can be fairly said to undervalue the signifi-cant role of public service provision in combating social exclusion and fosteringsocial cohesion.
164
6.2.4 Challenges to the public sector
In avoiding this scenario, it is important to understand some of the structuralfactors with which public sector modernisation efforts are contending and todistinguish valid critiques of public service standards from those based on partialperceptions or exaggerated expectations.
Public sector service providers are frequently large. Very large organisations faceparticular challenges in identifying and responding to new developments on thesupply side and demand side, which niche organisations may be in a better posi-tion to exploit. In Ireland, public service bodies tend also to be very centralised.Size and centralisation make them particularly prone to adopt a ‘one size fits all’approach and less likely to respond to diversity. Public bodies may enjoy a full ornear monopoly position and not, therefore, be compelled by competition togenerate or rapidly adopt new procedures for improving efficiency and effective-ness. Public services are labour intensive and particularly prone to see their costsrise faster than the rest of the economy (‘Baumol’s disease’) as innovation occursdisproportionately in manufacturing and wherever processes are standardised; thedifficult of measuring improvements in service quality can make the rise in relativecost appear greater than it is. Public bodies can inherit and transmit a risk-averseand conservative culture where predictability and financial accountability withinshort time frames are valued to the detriment of innovation. Public bodies canhave had their efficiency and effectiveness reduced by past political interventionsthat, alternatively, influenced the level and quality of recruitment, caused a dearthof funds seriously undermining service provision (LA housing in the early 1990s), oroccasioned a surge in funding that ran ahead of their absorptive capacities (healthspending after 1997). Public bodies may be called to respond to social needs whereno prior experience exists in the public sector for dealing with them (refugees andasylum seekers) or which spill across boundaries more rapidly than innovationtakes place in ways of working jointly.
A final difficulty is not unique to public service providers but experienced in amajor way by them. Service providers across a wide spectrum (doctors, teachers,social workers, transport workers, call centre workers, etc.) face a better educated,more informed and more demanding public. Service users, through ombudsmen orthe courts, acting singly or organised as associations or local communities, areinsisting on entering into a dialogue, hitherto largely confined to government andservice providers, as to how public services should be provided and at what cost.The prospect of litigation has become a major consideration — and, sometimes, abaneful influence — on service professionals and their organisations in severalfields. It is argued that, if taxpayers choose not to rely on a publicly providedservice because they are dissatisfied with its quality and purchase a privatealternative instead, their expenditure should be tax-subsidised.
Understandably, existing public service providers stress the extent to whichperceived deficiencies on their part are primarily due to inadequate levels of publicinvestment and argue that extra resources allocated to them would be effective inraising the levels and standards of public services. However, it is inadequate tohold that current failures can be attributed primarily to an insufficient volume ofresources being channelled through existing systems. As often as not, the design
re-conceptualising ireland’s welfare state 165
of systems is also at fault. Innovation and radical organisational change frequentlyneed to accompany the extra investment if the public are to receive the servicesthey seek and staff to experience a sustained improvement in job satisfaction andworking conditions. Some public service providers face a major contraction indemand for their traditional services (e.g., post) but most face higher demand asIreland’s population rapidly increases. Yet the shared understanding betweenmanagement and workforce is too often lacking which would enable them to seizethe favourable context of rising demand to accelerate restructuring and innova-tion, and improve the service and how workers experience their role. The work-force profile of several public sector service providers suggest that they should beleaders in innovating on-the-job training and adult learning opportunities andbringing the country to make a reality of its ambitions in the area of life-longlearning. This is seldom the case and management in several public bodies hasbeen unable to initiate a virtuous circle between reform and higher investment. Atthe extreme, reluctance grows even on the part of government to make newservices a public sector activity because of concerns that cost effectiveness,responsiveness and flexibility will thereby be less than can be achieved throughalternative delivery arrangements. Public service providers should be more pro-active in ensuring ‘value for money’, leading the way in particular on programmes forup-skilling and retraining workers.
Notwithstanding these structural features, public sector providers can — and do — play leadership roles in instituting new types and standards of serviceprovision. There are several lines along which even large public service providerscan be successfully ‘reinvented’:
s Through being at the forefront in assimilating advanced technology andintroducing its benefits to the public;
s Through the management having the ability – and being given the freedom —to lead a workforce through painful restructuring to improved job satisfactionand greater security;
s Through central government divesting itself of operational functions —sometimes routine, sometimes specialised — so as to concentrate more onpolicy formulation and entrusting policy implementation to appropriatelyregulated executive agencies;
s Through accepting that non-public bodies can deliver social protection that ispublicly paid for and innovating new forms of principal-agent relationships inorder to enlist the characteristic talents of commercial and not-for-profitproviders (the public voluntary hospitals, privately managed schools, etc.) indoing so.
166
There is a particularly rich international literature on the organisational changes inpublic services in many countries which have given deliverers more autonomy todecide how they use resources in the pursuit of agreed outcomes and moreincentive to innovate in the search for improvements, while structuring theiraccountability to service users and central government in new ways. Among themost promising new arrangements are those described as ‘democratic experi-mentalism’ (Dorf and Sabel, 1998), ‘empowered deliberative democracy’ (Fung andWright, 2001), and ‘accountable autonomy’ (Fung, 2001). In these approaches topublic administration, local actors are given freedom to set goals for improvementand the means to achieve them. In return, they must propose measures for assess-ing their progress and provide rich information on their own performance. Thecentre pools the information and ranks local actors by reference to periodicallyrevised performance measures. This approach increases local innovation, butmakes the local transparent. The centre acquires two new functions while surren-dering all attempts to micro-manage what is happening at the interface betweenservice professionals and service users. A first function is to increase the capacityof local actors to act autonomously by providing different supports; a second is tohold them accountable through monitoring and, where necessary, sanctioning andintervening. But the latter function is exercised to complement, not undermine,local autonomy (Fung, 2001; Leibman and Sabel, 1999; Sabel and O’Donnell, 2000).
These organisational innovations go deeper than the new public management(NPM) reform agenda, which was largely based on the scope that existed forapplying organisational and financial systems developed in the private sector topublic bureaucracies. Significant developments took place. There was more separa-tion of policy formation from its implementation, more use of executive agencies,tighter performance management systems, more frequent and improved dataflows, etc. However, downsides also attended the practice of seeking to applyprivate sector management techniques to public services (Kelly and Muers, 2002):
s Efficiency was not the only, nor even the most important, consideration for thepublic who also valued the quality of a service (e.g., its treatment of the ‘wholeperson’) and equity;
s What could be measured influenced the formulation of objectives while whatcould not be measured tended to be overlooked;
s Piecemeal improvement was the norm and it was difficult to have the case for larger scale innovation seriously considered;
re-conceptualising ireland’s welfare state 167
s There was a tendency to micro-manage which reduced discretion for front-lineworkers while transactions costs increased because of the detailed supervisionrequired by the centre;
s The ability to separate policy formation and policy implementation wasoverstated. Executive agencies, through their experience of actually dealingwith the situations to be addressed, developed insights into what policy shouldbe and increased their power over the centre;
s Insufficient value was set on democratic engagement by service providers withservice users and other stakeholder groups.
By way of learning, there is now much greater attention:
s To privilege outputs with clear links to desired outcomes in the formulation oftargets, sacrificing detail if necessary in order not to exalt narrower outputs oractivity measures and, thus, make instrumental outputs into ends;
s To have floor targets in order to keep the variation in performance to a mini-mum and thus enhance the priority given to combating social exclusion;
s To develop sophisticated performance metrics which throw light on the valuebeing added by publicly funded interventions (see box);
168
The following example is suggestive only and does not support adopting the particularperformance metric it describes in Ireland’s schools. It serves to illustrate how goodperformance metrics can reveal high standards in surprising places and protect serviceproviders — in this instance, good teachers — from unfair criticism rather than exposethem to it.
In order to assess the effectiveness of reforms in the management of Chicago’s publicschools, a metric of school productivity was developed that attempts to isolate the impactof school factors — such as teaching, curriculum, atmosphere — on student learning whilediscounting factors that cannot be controlled through what is done within the school itselfsuch as the preparedness of children at the moment of entering school.
First, the subset of children who have attended class for the entire year is identified.Second, comparable standardized test scores of this subset of students in a test adminis-tered at the beginning of the year are subtracted from their year-end test scores. Thismethod discounts students who attend classes for only part of the year and also controls fordifferences in the preparedness of students prior to enrollment in the class. Annual‘productivity gains’ (or losses) that result from school specific factors can then be measuredby subtracting one year’s productivity from that of the preceding year.
Using this metric, it was found that, while the students entering Chicago’s public schoolsystem between 1987 and 1997 had become increasingly disadvantaged and less wellprepared, the majority of schools had become more effective in educating them.
Archon Fung (2001), ‘Accountable Autonomy:Towards Empowered Deliberation in Chicago Schools and Policing’.
Box 6.2 Performance Measurement

re-conceptualising ireland’s welfare state 169
s To incorporate some element of quality-related funding in payment arrange-ments, with particular attention being given to ratings of user satisfaction as arelatively unambiguous indicator of developments in service quality.
In broad summary, the shift in paradigm governing service delivery that accompa-nies the emergence of the Development Welfare State is set out in Table 6.1.
Table 6.1 Overview of the Shiftin Paradigm Governing Service Delivery
Former Welfare State Developmental Welfare State
Service defined by agency Service jointly defined by centre,agency and user
Crisis-oriented Seeks balance between prevention and intervention
Centre sets detailed directives Centre sets strategic objectives
Service deliverer accountable Service deliverer accountable for inputs and compliance for outputs and quality
Compliance with rules Attainment of standards
Annual budget Multi-annual budgeting
Provides categorical services Provides integrated services
Services delivered through Services delivered through teams credentialed professionals of professionals, non-professionals
and users' representatives
Funds isolated projects Levers local innovations into improvements in mainstream services
Public bodies with Autonomous bodies customer service ethos with public service ethos
‘One size fits all’ Assumption of need for diversity
Insulation from competition Exposure to competition
6.2.5 Conclusion
Advancing this perspective on service delivery gives valid grounds for concern. Onthe part of existing public service providers, there is understandable suspicion thatthe emphases on service quality, diversity of service providers, outcomes ratherthan inputs, joint setting of standards, agreement on accountability, etc., are analternative to needed increases in resources for current public services. There aredisturbing examples from other countries (particularly Britain) of how attempts tointroduce managed competition between service providers (managed markets) orrecourse to subcontracting have not improved service standards, lowered publicsector morale, reduced ‘diversity’ in service provision to ‘creaming’, effectivelyjettisoned the most socially disadvantaged, and fuelled profiteering. There is alsothe concern that formally adopting the perspective of ‘network management’ willmake it too easy to multiply agencies of one form or another and more difficultthan ever to achieve their rationalisation and simplification when that is required.A tendency to co-opt or otherwise respond to issue-groups with the establishmentof a new body may heighten the profile of an issue and ensure a new corps ofworkers emerges that is dedicated to highlighting it, but it does not necessarilyadvance the core reform of mainstream services that may be needed or make iteasier to achieve a more agile and co-ordinated services system.
On the part of new service providers, there is the fear that government will exploitits power of being a single buyer (monopsonist) in the new system, just as it didthat of being a single seller (monopolist) in the old, and that non-profit organi-sations will have standards and levels of service dictated to them that are unrealis-tic in the light of the resources they are given. There is already experience in Irelandthat, in the process of becoming more significant players and service providers,community and voluntary organisations are professionalizing and employingmore full-time paid workers; this makes higher demands of their remaining volun-teers and can endanger the unique cultures on which they rely to attract volun-teers in the first place. The non-profits can also fear that the contractual arrange-ments between them and government will not reflect their need to build capacity,be put on a sufficiently long-term basis or have evaluation procedures built intothem that are appropriate to their organisations. There is, finally, the fear that theculture of large public organisations and agencies will not change, and that theywill operate in the ‘new order’ with the intention, and ability, to swing resourceflows in their favour, and protect privileged working conditions, which character-ised them in the old regime.
The stakes, however, of failure are too large to allow defence of the status quo toveto change. The development of integrated services systems, in which theprimary role accorded government is as regulator and guarantor of a diversified,high quality and equitable regime, requires harnessing the characteristic contribu-tions of direct public provision, non-profit organisations and the commercialsector. The end result can be termed the ‘services dividend’ of the DevelopmentalWelfare State and is illustrated in Figure 6.4.
170
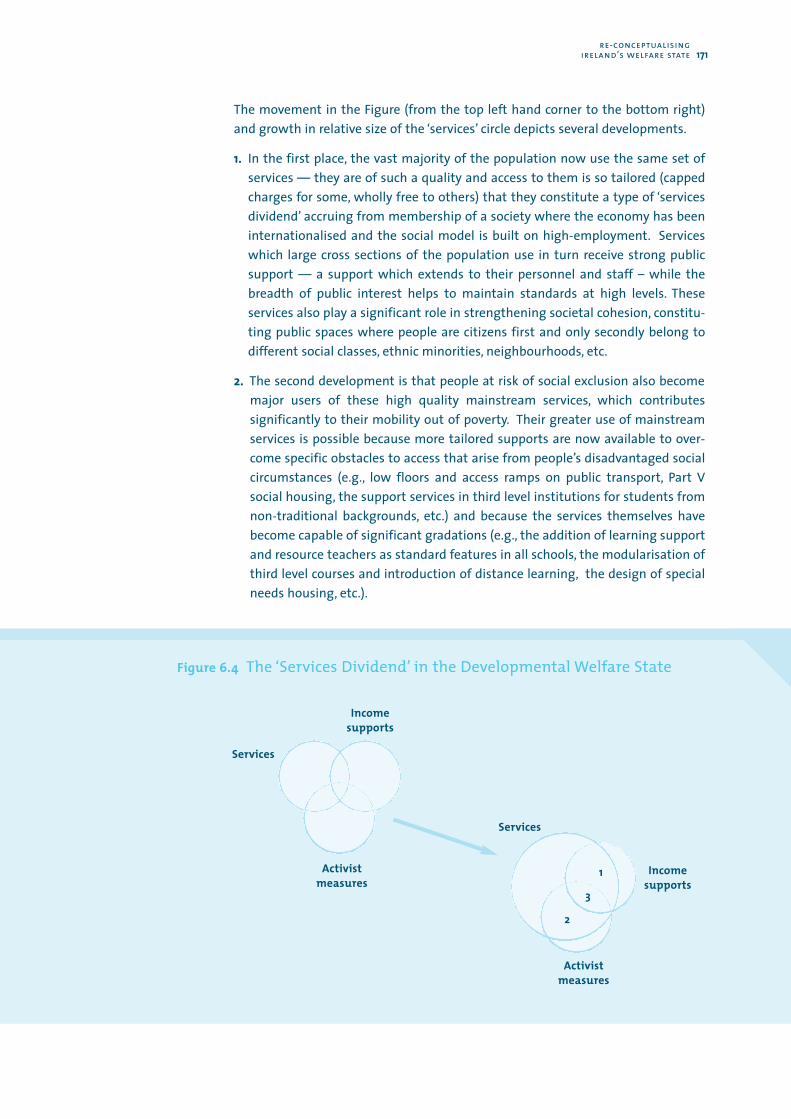
The movement in the Figure (from the top left hand corner to the bottom right)and growth in relative size of the ‘services’ circle depicts several developments.
1. In the first place, the vast majority of the population now use the same set ofservices — they are of such a quality and access to them is so tailored (cappedcharges for some, wholly free to others) that they constitute a type of ‘servicesdividend’ accruing from membership of a society where the economy has beeninternationalised and the social model is built on high-employment. Serviceswhich large cross sections of the population use in turn receive strong publicsupport — a support which extends to their personnel and staff – while thebreadth of public interest helps to maintain standards at high levels. Theseservices also play a significant role in strengthening societal cohesion, constitu-ting public spaces where people are citizens first and only secondly belong todifferent social classes, ethnic minorities, neighbourhoods, etc.
2. The second development is that people at risk of social exclusion also becomemajor users of these high quality mainstream services, which contributessignificantly to their mobility out of poverty. Their greater use of mainstreamservices is possible because more tailored supports are now available to over-come specific obstacles to access that arise from people’s disadvantaged socialcircumstances (e.g., low floors and access ramps on public transport, Part Vsocial housing, the support services in third level institutions for students fromnon-traditional backgrounds, etc.) and because the services themselves havebecome capable of significant gradations (e.g., the addition of learning supportand resource teachers as standard features in all schools, the modularisation ofthird level courses and introduction of distance learning, the design of specialneeds housing, etc.).
Figure 6.4 The ‘Services Dividend’ in the Developmental Welfare State
re-conceptualising ireland’s welfare state 171
Services
Incomesupports
Activistmeasures
Services
Incomesupports
Activistmeasures
3
1
2
3. A third development is the more frequent recourse to tailored packages ofsupports combining access to services, income supports and — where necessary— unique activist measures that are designed to constitute multi-facetedresponses to the complex situations of people in acute need (e.g., participationpackages for persons with disabilities, high support packages for people withemployment potential but far distant from the labour market, personal carepackages for older people living alone, etc.).
It can also be noted that the more successful services systems become at provid-ing a gradation or spectrum of services to meet the needs of a diverse public, theless prominent become new programmes which are exclusive to the needs ofdistinct groups who have fallen through the nets of mainstream service providers(the area of the circle representing activist measures that is outside both the othercircles gets smaller). Some ‘stand alone’ or once-off projects, however, will alwayscontinue to be needed and merit public support either because their client groupsare particularly small or because they are deliberately run as ‘pilots’ and evaluationleading to the decision either to discontinue them or mainstream them has not yetbeen completed. The Developmental Welfare State, in fact, should be strongly com-mitted to supporting ‘pilots’ and expert in their evaluation as a key strategy forensuring the dynamism and effectiveness of its service and income supportsystems.
6.3 Income Supports in the Developmental Welfare State
6.3.1 The debate on income transfers in Ireland
The debate in Ireland as to whether and how income support systems should befundamentally altered is not as strong as in other EU member states. Part of thereason is that trends in the lowest incomes have been positive, the sustainabilityof current arrangements is not under such immediate threat from ageing or highunemployment as elsewhere in the EU, while the administration of payments ishighly centralised and generally regarded as carried out with commendableefficiency and impartiality.
There have been significant discussions within the system rather than about itsbasic architecture. There has been on-going interest and success in including newgroups in the social insurance fund, and improving the risks against which insuredpeople are covered. A long debate as to whether social welfare payments shouldbe indexed to earnings rather than left to discretionary increases in annual Budgetshas proved inconclusive. Concern is expressed at Ireland’s high at-risk-of-povertyrates and high measures of income inequality in the EU comparative context.Progress towards a greater measure of individualisation in the social welfare codeis proceeding tentatively. The conditions and obligations attached to welfarepayment are separately visited from time to time, but there has been no compre-hensive review of what the payments are intended to achieve and how. In general,there is no demand for a fundamental review of social welfare such as was
172
conducted in 1986 when adequacy was the key concern (Commission on SocialWelfare) and in 1996 when it was increasing incentives to take employment(Integration of the Tax and Social Welfare Systems).
6.3.2 The debate on income transfers in mature welfare states
Challenges to rethink and redesign income support arrangements at each stage ofthe life cycle, however, are prominent among the challenges currently facing themature welfare states of other countries. Most evidently, there is the need torethink and redesign policies on pensions in order to respond to increasinglongevity and the growing proportion of older people in national populations.At the opposite end of the life cycle, there is an acceptance that income support forchildren is a new priority, not because children are growing as a proportion of thepopulation (they are shrinking in most OECD countries) but because the povertyrisk they face is increasing, as is our knowledge about the damaging and long-termconsequences of poverty in childhood. Consequently, it is accepted that endingchild poverty is, more than ever, in the national interest and an ethical imperative.Finally, new perspectives on providing income support to people of working ageare also characteristic of contemporary debates on income transfer policies. Thesetransfers have been growing, even in states where unemployment has fallen. Theconcept of an ‘active’ welfare state has become widespread, there has been aretreat from using passive income transfers to facilitate labour market withdrawaland economic restructuring, and greater attention is being given to the conditions,supports and assumptions surrounding income transfers to people of working age.5
The intention in this section is not to undertake a fundamental review of Ireland’sincome support arrangements, nor even to argue that one should now be under-taken. Chapters 3 and 4 contained significant information on how Ireland’s socialwelfare payments affect incomes, and identified several key challenges — in theareas of pensioner incomes and child income supports in particular. Responses tothese challenges will be outlined in Chapter 7. This section gives more extensivetreatment to income supports for people of working age.
Income transfers to people of working age
The OECD (2003) has adopted and refined data first developed by the Dutchauthorities as they sought to understand the nature and significance of benefitdependency among people of working age in the Netherlands.6 Table 6.2 ranks theten EU-15 countries on which data are available by descending order of theirbenefit dependency rates in 1999. It also ranks separately the English-speakingcountries outside the EU that are considered to have ‘liberal’ welfare states. For thepurposes of the Table, all people aged 15-64 in each country are classified as either
re-conceptualising ireland’s welfare state 173
5. The notion of ‘reciprocity’ is sometimes used here, suggesting that the state and the individual should mutually articulate theirunderstandings of the purpose and conditions under which income support is being provided and accepted. However, the enormousimbalance in power between the state and an individual with limited or no resources means the concept is inappropriate forgoverning relationships between a welfare recipient and the state; the former frequently has no fallback position whatsoever. Forthis reason, the text does not adopt reciprocity as a concept for guiding welfare reform.
6. Several important steps were taken in ensuring the data were comparable. For example, working-age is defined as 15-64 years;benefit dependant numbers are counted in full-time equivalents; benefits were grouped into seven types; survey data andadministrative records alike were consulted and harmonised where possible and necessary; etc. The reader is referred to Annex 1,OECD (2003), for more details.
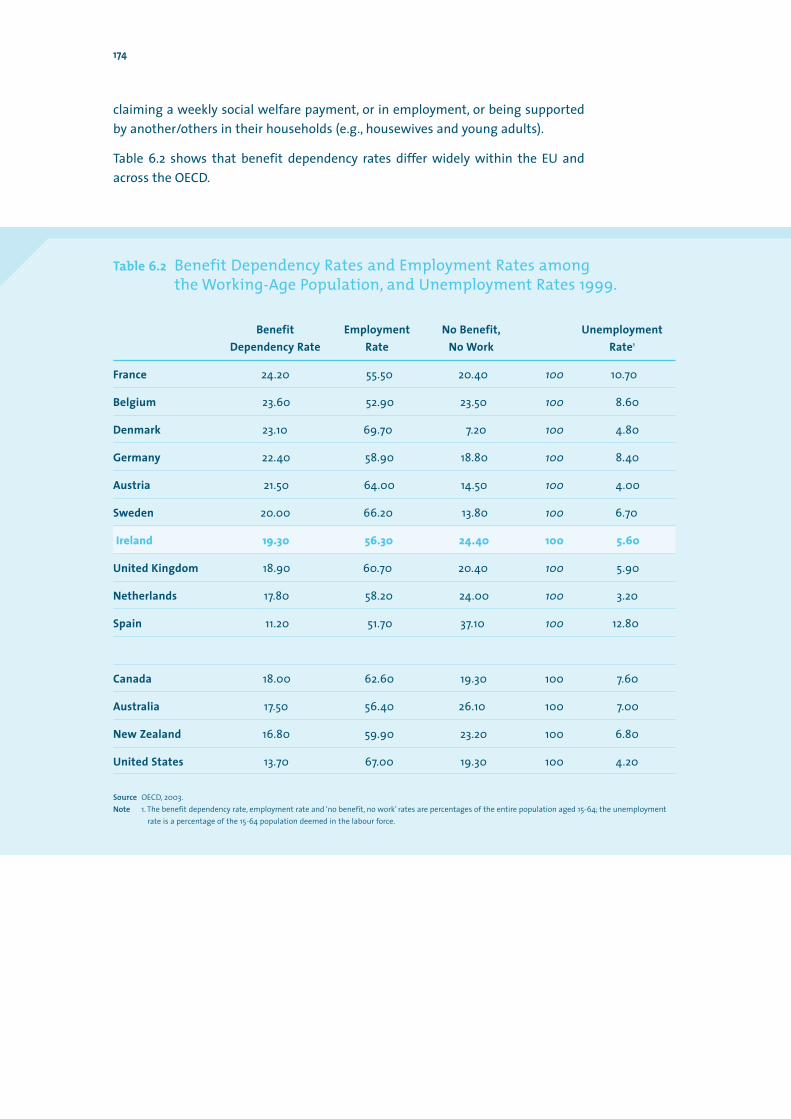
174
claiming a weekly social welfare payment, or in employment, or being supportedby another/others in their households (e.g., housewives and young adults).
Table 6.2 shows that benefit dependency rates differ widely within the EU andacross the OECD.
Table 6.2 Benefit Dependency Rates and Employment Rates among the Working-Age Population, and Unemployment Rates 1999.
Benefit Employment No Benefit, UnemploymentDependency Rate Rate No Work Rate1
France 24.20 55.50 20.40 100 10.70
Belgium 23.60 52.90 23.50 100 8.60
Denmark 23.10 69.70 7.20 100 4.80
Germany 22.40 58.90 18.80 100 8.40
Austria 21.50 64.00 14.50 100 4.00
Sweden 20.00 66.20 13.80 100 6.70
Ireland 19.30 56.30 24.40 100 5.60
United Kingdom 18.90 60.70 20.40 100 5.90
Netherlands 17.80 58.20 24.00 100 3.20
Spain 11.20 51.70 37.10 100 12.80
Canada 18.00 62.60 19.30 100 7.60
Australia 17.50 56.40 26.10 100 7.00
New Zealand 16.80 59.90 23.20 100 6.80
United States 13.70 67.00 19.30 100 4.20
Source OECD, 2003.Note 1. The benefit dependency rate, employment rate and ‘no benefit, no work’ rates are percentages of the entire population aged 15-64; the unemployment
rate is a percentage of the 15-64 population deemed in the labour force.
The Table shows, for example, that more than twice as many people of working agein France, Belgium and Denmark receive a weekly social welfare payment from thestate than in Spain. The inclusion of Spain — the sole representative of thesouthern Europe in the Table — is important for it highlights that one of the keysocietal factors which influences the benefit dependency rate is not theunemployment rate but intra-household sharing. Spain has the highest unem-ployment rate of the fourteen countries but the lowest benefit dependency ratebecause of its high proportion of people of working age who depend on someoneelse’s income in their household (earnings or welfare). The proportion of the popu-lation of working age neither in work nor receiving a benefit is more than fivetimes as great in Spain as in more individualised Denmark.
Ireland is in a mid-way position in Table 6.2. It has the highest benefit dependencyrate of the English-speaking world and was providing roughly the same proportionof its working population with a weekly social welfare income as Sweden, eventhough the Irish employment rate was some 10 percentage points lower.
Some light on why countries have very different benefit dependency rates isprovided by Table 6.3. This shows the levels of benefit dependency rates at thebeginning, middle and end of the 20-year period, 1980-1999, and the compositionof these aggregates by the types of benefits received. It is the cumulative impactof three types of benefit — viz., those for older workers, disability and unemploy-ment, in that order — which pushes countries to the head of the ranking.7 Trendsdiffer from the first to the second decade. The total benefit dependency rate roseeverywhere in the EU during the 1980s; Spain and Ireland had an increase of morethan 50 per cent and most countries experienced a rise of 20 per cent or more. Thedecade of the 1990s saw sharply contrasting experiences: benefit dependencyrates dropped in the Netherlands and Spain, but in neither case by sufficient toregain their 1980 levels; the UK, Denmark and Belgium were similar to Ireland inexperiencing near stability in their aggregate rates; Germany, Austria, France andSweden experienced further significant increases.
re-conceptualising ireland’s welfare state 175
7. A wide literature documents the reasoning behind the introduction of early retirement schemes, the way in which they easedindustrial restructuring, and the pessimistic assumptions about the labour market prospects of older workers that supported them. Anew consensus, however, is emerging quite rapidly that types of employment are feasible and desirable for older workers. Ireland'slow benefit rate in this regard should probably be interpreted as a fortunate accomplishment.
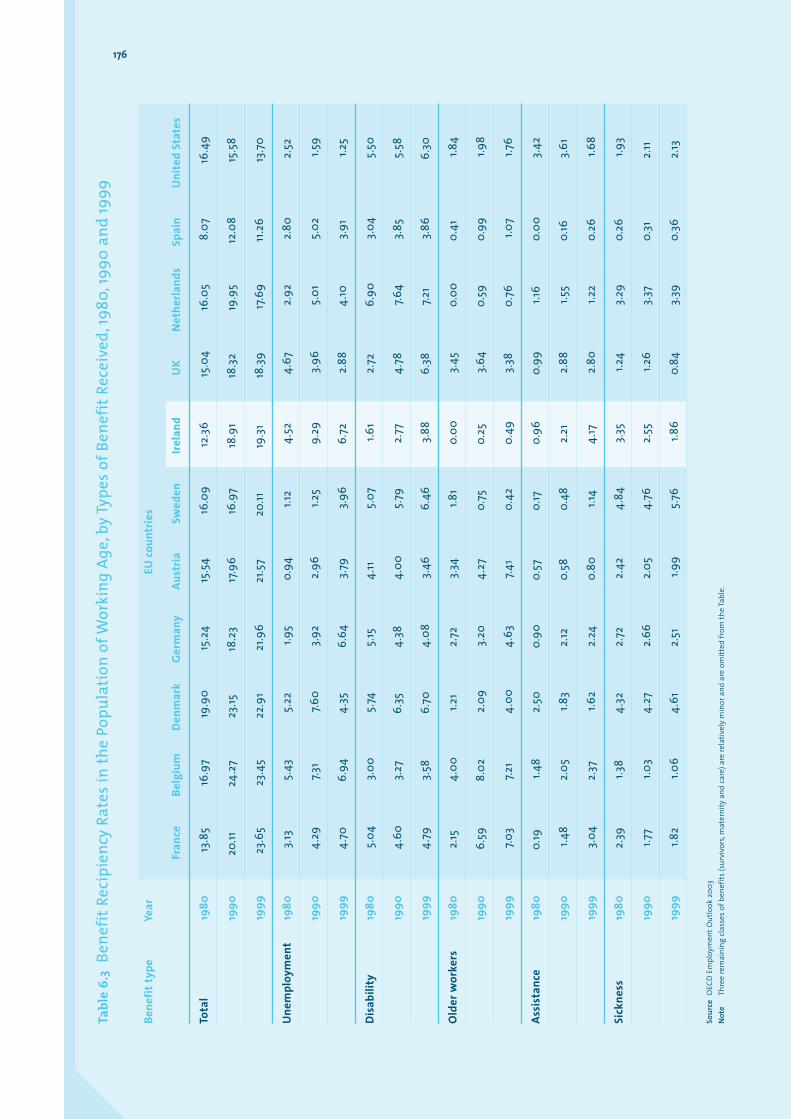
Tabl
e 6.
3Be
nefit
Reci
pien
cy R
ates
in th
e Po
pula
tion
of W
orki
ng A
ge,b
y Ty
pes
of B
enef
itRe
ceiv
ed,1
980,
1990
and
1999
Bene
fitty
peYe
ar
EU co
untr
ies
Fran
ceBe
lgiu
mD
enm
ark
Ger
man
yAu
stria
Sw
eden
Irela
ndU
K N
ethe
rland
sSp
ain
Uni
ted
Stat
es
Tota
l19
8013
.85
16.9
719
.90
15.2
415
.54
16.0
912
.36
15.0
416
.05
8.07
16.4
9
1990
20.11
24.2
723
.1518
.23
17.9
616
.97
18.9
118
.32
19.9
512
.08
15.5
8
1999
23.6
523
.45
22.9
121
.96
21.5
720
.1119
.31
18.3
917
.69
11.2
613
.70
Une
mpl
oym
ent
1980
3.13
5.43
5.22
1.95
0.94
1.12
4.52
4.67
2.92
2.80
2.52
1990
4.29
7.31
7.60
3.92
2.96
1.25
9.29
3.96
5.01
5.02
1.59
1999
4.70
6.94
4.35
6.64
3.79
3.96
6.72
2.88
4.10
3.91
1.25
Dis
abili
ty19
805.
043.
005.
745.
154.
115.
071.6
12.
726.
903.
045.
50
1990
4.60
3.27
6.35
4.38
4.00
5.79
2.77
4.78
7.64
3.85
5.58
1999
4.79
3.58
6.70
4.08
3.46
6.46
3.88
6.38
7.21
3.86
6.30
Old
er w
orke
rs19
802.
154.
001.2
12.
723.
341.8
10.
003.
450.
000.
411.8
4
1990
6.59
8.02
2.09
3.20
4.27
0.75
0.25
3.64
0.59
0.99
1.98
1999
7.03
7.21
4.00
4.63
7.41
0.42
0.49
3.38
0.76
1.07
1.76
Assi
stan
ce19
800.
191.4
82.
500.
900.
570.
170.
960.
991.1
60.
003.
42
1990
1.48
2.05
1.83
2.12
0.58
0.48
2.21
2.88
1.55
0.16
3.61
1999
3.04
2.37
1.62
2.24
0.80
1.14
4.17
2.80
1.22
0.26
1.68
Sick
ness
1980
2.39
1.38
4.32
2.72
2.42
4.84
3.35
1.24
3.29
0.26
1.93
1990
1.77
1.03
4.27
2.66
2.05
4.76
2.55
1.26
3.37
0.31
2.11
1999
1.82
1.06
4.61
2.51
1.99
5.76
1.86
0.84
3.39
0.36
2.13
Sour
ceO
ECD
Em
ploy
men
tOut
look
200
3N
ote
Thre
e re
mai
ning
cla
sses
of b
enef
its (s
urvi
vors
,mat
erni
ty a
nd c
are)
are
rela
tivel
y m
inor
and
are
om
itted
from
the
Tabl
e.
176
Tables 6.2 and 6.3 do not support the thesis that high welfare dependency amongpeople of working age is an indicator of poor economic performance. While thecombination of a high employment rate and low benefit dependency in the UnitedStates may seem to point in that direction, the combinations of high employmentrates with high levels of benefit dependency achieved by the Scandinaviancountries suggest that welfare arrangements can be supportive of high employ-ment. Denmark, for example, has the highest employment rate of the 14 countriesand one of the highest benefit dependency rates.
Different interpretations
Three lines of interpretation can be distinguished as to why some advancedindustrial countries, even in years when unemployment is low, have up to one fifthof their working age populations in receipt of social welfare.
1. A first line of interpretation sees the numbers receiving welfare as a problem.It is ‘dependency’, at levels which were unintended and unforeseen at the timeat which programmes were introduced. Growth in this benefit dependency issubject to a ratchet effect whereby — once the numbers have grown — it isextremely difficult to achieve significant reductions. Current levels need to bereduced, because of the pressures on the welfare budget coming from ageingand the need to spend more on services rather than income transfers. Two vari-ants can be discerned in this line of interpretation. A first emphasises the hang-over effects of an era when high unemployment fuelled fatalism about theemployment prospects of certain groups (e.g., as when early retirement schemeswere used to lubricate economic restructuring). A second emphasises the resist-ance of groups to realign their expectations with the fundamentally changedrelative position of their company, sector, region, etc., in more integrated andcompetitive world markets.
2. A second line of interpretation regards the growth in income supportexpenditure on people of working age as responding to real and rising hazardswhich people face as they attempt to remain employable and attached to thelabour market over their working lives. These hazards include parenting alone(particularly in the wake of a divorce or separation), caring for a houseboundfamily member, social exclusion (of members of ethnic minorities but also ofpeople living in regions dependent on traditional industries), skills obsolescence(in rapidly developing fields such as IT as well as in traditional occupations) andhealth problems (many of them induced by stress — a significant element of itwork-related — or arising from harmful lifestyles).
3. A third line of interpretation points to a general movement to have higherstandards of social protection and greater autonomy for the individual and towhich the social welfare state is responding. For example, it can be regarded asa social achievement if people with long employment records whoseproductivity has been sharply reduced by economic restructuring or adeterioration in health have the option to retire early rather than be forced toaccept significant downward mobility in the labour market, that young mothersor unemployed young people are not considered to be wholly the responsibilityof their parents, and that the state embrace a role for itself in supportinghouseholds to care for infirm or very elderly members.
re-conceptualising ireland’s welfare state 177
It is, of course, not necessary to adopt one of these interpretations to the exclusionof the others. Elements of each can be recognised within the same country. Thechallenge of modernising or recalibrating social welfare payments can beexpressed as trying to minimise the degree to which the first interpretation iscorrect and maximise the extent to which the other two apply. The task ofachieving this is helped by having a deep understanding of how and why socialwelfare payments can act in each of the three different ways.
Problematic levels of welfare dependency among people of working-age areattributed to various manifestations of ‘moral hazard’, i.e., people adjust theirbehaviour in a way that reduces their attempts to avoid a contingency simplybecause social welfare is available to provide cover should the contingency materi-alise. Stark presentations of this view suggest that young women become singleparents because of the welfare to which they then become entitled, and thatpeople who dislike their employment options develop medical complaints in a bidto secure disability status. It is not necessary, however, to believe that people takepotentially life-altering steps in a bid to secure the quality of life that a means-tested welfare payment affords. More complex processes can be at work thanrational choice based on income calculation. The family and community in which aperson has been reared and is living contribute to shaping the range of optionsthat person regards as feasible — they influence where the boundary runsbetween the familiar and the risky, their flows of information, their role models,their patterns of socialisation and how they perceive status. The limited effective-ness of policies which seek to alter people’s life trajectories with financialinducements alone (to stay on in school, to participate in education or training, totake a job, to have children, etc.) should caution against attributing a major effi-cacy to financial calculation operating in the reverse direction — i.e., it is unlikelythat people get into situations of welfare dependency because of a perversefinancial incentive alone.
It is a fairer summary of the evidence to say that the availability of welfare is not a significant influence on why people first have recourse to it (become unem-ployed, lone parents, ill or disabled, etc.) but that the conditions for its continuingreceipt can be significant in explaining their reluctance to leave it.8
Social welfare transfers to people of working-age function as an investment whenthey provide the space within which people cope with major life and family events(sickness, pregnancy, job loss, career change, etc.) in a way that protects andstrengthens their lifetime attachment to the workforce. It is because the economyand workplaces are being transformed by internationalisation and increasing com-petition, and because marital relationships are less stable, that more peopleexperience temporary difficulties in maintaining continuous employment.
178
8. Irish studies in support of this conclusion include DSFA (2000), Review of the One-Parent Family Payment, and Callan et al (2003),Taxes, Benefits and Labour Market Responses: New Evidence for Ireland. Policy Research Series No. 48, ESRI. The DSFA study reviews theIrish evidence for a link between improved state support for lone parents and their growing numbers. It points out: women whoseexperience of pregnancy is negative (unexpected, a shock, a crisis) are much more likely to be single than married; interviews withlone parents in a disadvantaged urban area produced no significant evidence that knowledge of their welfare entitlementsinfluenced their becoming pregnant; the number of teenagers becoming pregnant has not risen appreciably since the social welfareschemes for lone parents were introduced. As none of this supports the view that the number of lone parents has been pulled up bythe improved support available to them, the DSFA study concludes that public policy has more surely been responding to theirgrowing numbers than accounting for them. The ESRI study is the most sophisticated econometric study yet carried out on Irish dataof the impact of unemployment benefit/assistance on the duration of unemployment. It finds that unemployment benefit has apositive but modestly sized effect in prolonging a person’s unemployment spell, which it suggests should be interpreted asindividuals using the resources provided by benefits for more effective job search and thus a better more stable job. It found noevidence whatsoever that Unemployment Assistance has a disincentive effect.
A significant proportion might experience a welfare spell but typically it will be ofshort duration. A generous level of payment supports meaningful repositioning( job-search, re-entry to education, etc.) and contact with the welfare systemprovokes the formulation of personal plans and forward movement. The Nordiccountries have consistently achieved high employment rates over several decadesnot despite but because they have concentrated a considerable part of theirwelfare expenditure on serving the needs of people of working-age.
Social welfare transfers to people of working-age can also be regarded as theexpression of ethical and moral values for which there is, and should be, the‘willingness to pay’. Just as the payment of unemployment benefit/assistancebecame widely supported as societies became more aware of the employmentconsequences of business cycles and of structural changes in national economies,in a similar way, contemporary social and economic changes are prompting a moralrevaluation of the remit of the welfare state. For example, societies are having toaccept that separation and divorce are swelling the numbers of lone parents andleaving the social welfare system with effectively two choices — to allow povertyamong them grow or to enable more of them to function as independenthouseholds. It is not in the power of the social welfare system to stem theincidence of divorce or separation. As a second example, the demands of themodern workplace for demonstrable individual productivity, and the adaptabilityover time to sustain it, are higher today than in the past — fewer workplaces nowshelter people whose individual presence adds more to costs than to revenue. Butpeople are not infinitely malleable and some will simply not reach the threshold ofskills and competences required for entry to the flexible workforce in the moderneconomy. In other words, there are groups of working-age people whose potentialproductivity even after extensive retraining remains so low that economics on itsown would suggest that passive income transfers are more cost efficient thaninvesting in training in order to return them to the labour market (Heckman, 2000;Phelps, 1997). The welfare state must include income arrangements for them also.
In summary, there is an emerging concern in mature welfare states that publicincome transfers to people of working age should avoid any assumption thatrecipients have no future as potential members of the workforce. Rather, theyshould reflect, wherever possible, positive expectations of their recipients andremain open to support developmental trajectories. This concern has, in part, abudgetary dimension, i.e., more ‘active’ measures can reduce welfare case-loadsand free public resources for other urgent uses. However, the concern is also arecognition of the fact that the majority of welfare recipients of working age nowreceive their payments in confirmation of a status outside the workforce ratherthan as unemployed members of it, and that the very arrangements for payingthem risk converting their status outside the labour force into a more permanentstatus than need be the case.
re-conceptualising ireland’s welfare state 179
6.3.3 Advancing the debate in Ireland
In 2002, 25 per cent of the population aged 16-64 were recipients of some type ofweekly social welfare payment (approximately 577,ooo recipients and 73,000 adultdependants) (DFSA, 2003a). For some 42 per cent of the recipients, their paymentswere insurance-based and, in most cases, short-term by nature and of finiteduration (e.g., maternity benefit, unemployment benefit). In other instances,however, insurance-based payments were long-term, both intentionally so (e.g.,invalidity pension is paid to former workers who are considered to be permanentlyincapable of work) and unintentionally (e.g., disability benefit, though intended to be a short-term payment, has a high proportion in receipt of it for more than a year).
One quarter of a million people of working age, however, are the direct recipientsof Ireland’s lowest, means-tested social welfare payment. They receive the sameweekly rate of payment through six contingency-based schemes (the one parentfamily payment, unemployment assistance, disability allowance, supplementarywelfare allowance, the pre-retirement allowance and farm assist).14 Some of themain features of each scheme — principally the qualifying conditions and howthey are monitored but, sometimes, the level of any earnings disregard, theadditional benefits to which recipients are entitled, and the benefit withdrawalrates they face should they begin earning — differ to a significant extent. From thepoint of view of the individual, therefore, the category she or he is placed in has far-reaching implications. She is treated according to the rules governing thecontingency through which she qualifies and not according to her individualneeds, capabilities and circumstances. The administrations of the schemes alsorun in parallel.
There are new grounds and possibilities for adopting a more personal andindividualised approach to providing income support and assuming less aboutan individual’s true needs, capabilities and prospects from such common traits as— for example — being a lone parent, of a mature age, living with an disability,being jobless for a long time, etc. The relatively small number of water-tight cate-gories into which working-age, non-employed people are currently classed forpurposes of income receipt conceal significant heterogeneities in their populationswhich household-based means tests are not designed to capture and on which, infact, no information is gathered in the process by which people qualify for theincome support. Yet people experiencing the same contingency can differ hugelyin their need and capability for participating in society, the real prospects they faceof changing their situation and moving forward in their lives, the tailored supportswhich would enable them to achieve that form of social and economic partici-pation of which they are capable and which they want. No information is gatheredon these aspects as responsibility for encouraging and supporting a greater degreeof self-reliance is not a major objective of the programmes.
180
14. The Qualified Adult Allowance is identical also and the Child Dependant Allowance with the exception of the higher rate attached tothe One Parent Family Payment (c19.30 as against c16.80 on the other five schemes).
It is important that the assumptions and conditions attached to social welfaretransfers do not reduce the expectation or incentives for a person to better theirposition. There is considerable empirical evidence that income alone seldomsecures satisfactory economic and social participation for people of working age.More people are, fact, moving in and out of the workforce at several stages in theirlives, confirming that detachment from the workforce is not fixed, nor is exiting itirrevocable.9 Advances in health, improved medical aids and health appliances,new types of workstation and job descriptions which are less physicallydemanding have diminished the implications of specific health conditions and ofage for a person’s ability to participate in the economy and in society.
At the same time, developments in instruments of programme management havewidened what it is possible to offer people. More sophisticated and reliableinstruments are available to assess individuals’ capabilities and aptitudes(‘profiling’). Information technology and improved information retrieval systemsnow enable shared access on acceptable grounds of confidentiality to the uniquecircumstances of individuals on the part of diverse service providers. Wideropportunities can be made available for people to avail of pedagogies in furthereducation and training that are tailored for them. Innovation in such pedagogiesis an important form of social innovation when they effectively address the blocksto learning in individuals whom long years on means-tested assistance may haveserved to underline what they are considered deficient in rather than theirstrengths.
This greater potential to combine income support with activation measures isinadequately focused as a strategy to boost labour supply. It is primarily aboutenhancing individual well-being and the quality of people’s lives. Within the EU,the Minimum Income Recommendation includes that welfare benefits foremployable people (i.e., whose age, health and family situation permit labourmarket participation) should be conditional on availability for work, vocationaltraining or other economic and social integration measures — ‘not as a punish-ment but as an opportunity to improve their labour market perspectives’ (Amitsiset al, 2003: 207). In a similar vein, the OECD points to ‘a paradigm shift taking placewithin OECD countries in the approach taken towards disability, with moreemphasis on separating the concepts of ‘disability’ and ‘ability to work’. Integrationinto the workforce rather than passive compensation for loss of income isbecoming the more important policy objective in almost all OECD countries’(OECD, 2002: 107). It continues:
Merely looking after the financial needs of disabled people through cash bene-fits is insufficient; this would still leave many excluded from the labour marketand sometimes even from society generally. Therefore, each disabled personshould be entitled to a ‘participation package’ adapted to individual needs andcapacities. This package could contain rehabilitation and vocational training, jobsearch support, work elements from a wide range of forms of employment
re-conceptualising ireland’s welfare state 181
9. A case in point is the Invalidity Pension which is intended for people who are assessed as permanently incapable of working due to anillness or disability. By 2002, some 6.5 per cent of its 52,000 recipients had come forward to avail of employment supports (DSFA,2003b)..
(regular, part-time, subsidised, sheltered) and benefits in cash or in kind. It couldalso in some circumstances contain activities that are not strictly considered aswork, but contribute to the social integration of the disabled person. (OECD,2003: 11)
The concept of ‘participation packages’ which embrace income and tailoredsupport services is implicit in how policy developments are seeking to address theneeds of other groups such as early school leavers, lone parents, the long-termjobless, and older workers with low skills. A major review of Australia’s welfarestate states it simply: ‘A nation’s social support system must be judged by itscapacity to help people participate economically and socially, as well as by theadequacy of its income support arrangements’ (Reference Group on WelfareReform, 2000, Participation Support For a More Equitable Society, p.8).
There are several areas where income support as currently provided in Irelandcould be contextualised more strongly within a wider package of supports intend-ed to restore equality of opportunity and promote meaningful participation.
The One Parent Family Payment embodies no dynamic or evolution in expectationsof the recipient as the youngest child gets older. This, in effect, means it cansupport a lifetime dependency on social welfare.10 In several other countries, as theyoungest child passes various age thresholds, employment and training serviceproviders contact the parent to ensure that entry to part-time employment andeventually to full-time employment become more rather than less likely as timepasses. Periodic interviews with recipients need not be focussed only onemployment and vocational training but, particularly where recipients’educational attainment is low, can explore a return to more general education orthe conditions for increasing participation in the wider community.11 It isparticularly challenging to Ireland’s current practice that some countries withmuch lower poverty rates among their lone parents do not see parenting alone asrequiring a special income maintenance payment at all. For example, by effectivelyaddressing needs which are common across all family types (access to childcare,subsidies to the costs of parenting, training/further education for people with lowskills), Sweden has provided a general framework that has removed many of thesocial disadvantages associated with parenting alone (confirmed by its low povertyrates and high employment rates for lone parents).
The introduction of the One Parent Family Payment (OPFP) in 1997 incorporated a significant earnings disregard which, in effect, allowed some element of thepayment to be retained until earnings were higher than average female earningsin industry at the time (but see 3.4.4 above). This provided a much higher level ofencouragement to take employment than the programmes the OPFP replaced,while still supporting parents to remain in the home if that was their wish. Thecontribution of this generous earnings disregard to raising employment ratesamong lone parents is difficult to disentangle from the simultaneous influence of
182
10. DSFA (2000), Review of the One-Parent Family Payment. n. 8.15. See also 2.33 - 2.34 and 1.13.
11. Almost 60 per cent of Ireland's lone parents have only primary level education (op. cit.).
other factors. On the one hand, the employment rate of lone mothers had beenrising anyway — more rapidly than that of married mothers — in the buoyantlabour market prior to 1997 and the expansion of the Community EmploymentScheme alone served to bring a significant number of them into work. On theother hand, the unavailability and cost of childcare, the growing reliance of loneparents on Rent Supplement which they lose on taking employment and the weakearnings capacity of many of them remained obstacles beyond the power of theOPFP on its own to address. Currently, it is estimated that some 60 per cent of therecipients of the OPFP have some earnings but that most of them earn below thethreshold (d146 weekly) above which partial withdrawal of their payment begins.The Irish evidence to date would suggest that the work ethic among lone parentsis at least as strong as among the general population,12 and that the policychallenge is to facilitate them more effectively by — for example — increasingtheir earnings power, ensuring childcare, providing some degree of housingsupport in work, and directing them into training and employment programmeswith good progression prospects.
Similarly to the OPFP, the duration of receipt of illness and disability paymentstriggers no interviews much less systematic contact points with the providers ofrehabilitation, education, training or employment services as the duration ofreceipt grows longer. Where a disability or illness is severe, this will be irrelevantbut for a proportion of recipients with the potential for at least partial employ-ment (a number impossible to determine on the basis of the information currentlygathered as they qualify for their payments) it means that nothing issystematically structured into the payment arrangements to stem a slide from ashort term illness or shock at the onset of a disability into discouragement, theerosion of work habits and skills and a conviction that the world of employment isirretrievably beyond their reach. Some supports are in place to encouragerecipients to identify and take up opportunities for self-development, furthereducation, training or employment13 but they are considered to have pooroutcomes and to be undermined to a significant degree by other features of thecurrent social welfare code — for example, its ‘all or nothing’ classification ofpeople’s capacity for work with no possibility of a partial payment to accompanythe taking of limited employment, the restriction of entitlement to secondarybenefits to those who remain wholly outside the workforce, and the impact of theearnings disregard (d120 weekly for recipients of the Disability Allowance with aeuro for euro withdrawal of their payment after that) in promoting a view ofemployment as primarily for ‘topping up’ welfare even where people have thecapacity to pursue more substantial employment options.
The numbers of people in receipt of illness and disability payments have grownrapidly in recent years. A significant number of those who left the Live Registerhave moved to receipt of the Disability Allowance.14 In areas of disadvantage, they
re-conceptualising ireland’s welfare state 183
12. Noted also in some other countries — Phipps (2001) for Norway, Forssén and Hakovirta (1999) for Finland. Employment rates amonglone parents have risen significantly since 1994, though the quality of the employment may be poor (Russell et al, 2004). Otherthings being equal (e.g. educational attainment, access to childcare), lone parents have the incentive to earn of a head of householdand can value time out of the household.
13. These include: exemptions from the prohibition on working when employment or training is classed as ‘rehabilitative’ or‘therapeutic’ and for self-employment, income disregards in the former case, transfer to the Back to Work Allowance Scheme ifformer recipients take up full time employment in the open labour market, the services of Jobs Facilitators, and exemptions from allPRSI contributions in certain instances.
14. 15 per cent is the estimate in DSFA (2003b).
now regularly outnumber those who are classed as unemployed. It fails these people in the first place, while also not helping their communities or theExchequer, if their medical disability is too easily equated with incapacity for work.The Council endorses the recommendations in the Report of the Working Group onthe Review of the Illness and Disability Payment Schemes (DSFA, 2003b) that somemeaningful assessment should become possible of recipients’ potential foremployment and other forms of participation, that there should be recognitionthat recipients can have a partial capacity for work or other developmentopportunities, and that active engagement should take place with those who havesuch a capacity.
6.3.4 Conclusion
This discussion of income transfers to people of working age in contemporaryIreland, in the context of developments in mature welfare states overseas, leads tothe following conclusions:
s The composition and circumstances of the people of working age receivingsocial welfare of potentially long duration have changed, and can be expectedto change further;
s The distinction between being ‘unemployed’ (in the labour force as unem-ployed members of it) and ‘inactive’ (outside the labour force) is not a reliableguide to people’s interest in and capacity for employment;
s There is considerable diversity of circumstances and potential for eventualemployment among the recipients of the one parent family payment, of thedifferent illness and disability payments, and — most probably — of otherpayments also (the pre-retirement allowance, farm assist, supplementarywelfare allowance);
s Social welfare transfers to people of working-age function as an investmentwhen they provide the space within which people cope with major life andfamily events (sickness, pregnancy, job loss, career change, etc.) in a way thatprotects and strengthens their lifetime attachment to the workforce;
s More is lost than gained when attempts to enforce entry into employmentresult in people finding themselves below the poverty line;
s The income support they receive should avoid any aspect of being an ‘exclusionwage’. The availability of welfare is seldom a significant influence on why peoplefirst have recourse to it (become unemployed, lone parents, ill or disabled, etc.)but the conditions for its continuing receipt can be significant in explainingtheir reluctance to leave it;
s More systematic attention should be given to ensuring that the necessarysupports with which recipients can progress to fuller social and economic rolesare always present;
s The recognition that support services should be provided to recipients ofunemployment benefit/assistance should be extended to other groups ofworking-age welfare recipients also.
184

The implications of these secular trends in welfare receipt and their interpretationfor how income support to people of working age should be delivered by a welfare state that is more in tune with people’s circumstances and needs areoutlined in Table 6.4 below. The Table is partly summarising the discussion aboveand partly anticipating what will be developed in the next chapter as strategicrequirements.
re-conceptualising ireland’s welfare state 185
Table 6.4 Overview of the Shift in Paradigm Governing Income Support Systems for People of Working Age
Former Welfare State Developmental Welfare State
Household-based means test More individualised welfare code
Priority to contingencies Priority to individual tailoring
Maximum payment based on Maximum payment based means-test or contributions record on requirements for participation
Seeks integration of tax Seeks integration of income and welfare codes support and services
Seeks rationalisation of payment rates Seeks rationalisation of terms and conditions
Adequacy refers to basic needs Adequacy refers to basic needs and participation
Markedly different treatments Personally gradated differencesof unemployed people and in treatment across multiple those outside the labour force non-employed statuses
Priority to out-of-work benefits Priority to in-work benefits
Vigilance against Vigilance against high high replacement rates benefit withdrawal rates
Service entitlement based on Service entitlement based on qualifying contingency individual need and capacity
to benefit
Vigilance against paying Vigilance against deterring illegitimate claimants legitimate claimants
6.4 Activist Measures in the Developmental Welfare State
Activist measures are essentially innovative and start as particular projects.They are responses to unmet needs not being addressed by established providersthrough existing programmes. Some are conceived at the outset as unique, stand-alone projects for providing a particular service, some as pilots to be evaluatedwith a view to altering mainstream services. The issues they address andpopulation sub-groups they serve change over time. Rather than being grudging,surprised or indifferent at their presence, the Developmental Welfare State openlyrelies on activist measures for ensuring its own continuing vitality and improve-ment. Hence, the budgets of public bodies allow for the funding of what appears,initially, as unusual and untried, evaluation is a developed practice, the internalcapabilities of public bodies to conduct research and interact with academicresearch are developed, autonomy and a sufficiently long period of funding securityis given to initiatives in order to allow their merits to be identified. In this sense,activist measures are akin to the R&D sphere of the Developmental Welfare State.
The essentially innovative nature of activist measures means it is not possible toidentify beforehand what they should be. Rather, the particular success and failurewith which Ireland’s welfare state has been allowing activist measures to performtheir R&D function in shaping social policies are more easily examined retro-spectively. This is done below for initiatives that addressed unemployment andeducational disadvantage respectively.
6.4.1 Activist measures in response to unemployment
Some major developments in fighting social exclusion were spurred by the Irishexperience of high unemployment during the 1980s. New institutions and policieswere introduced and existing ones reshaped, new procedures were set in place anda growing volume of resources was channelled to alleviate the worst effects ofentrenched unemployment, improve the hard and soft skills of the unemployed,increase their incentives to seek and hold jobs, and ‘build capacity’ in local commu-nities. Major landmarks in the 1990s alone include the establishment of area-based partnerships (1992, 1994), the introduction of the Community EmploymentProgramme (1994), the creation of the Local Employment Service Network (1995),the drawing up of the National Anti-Poverty Strategy (1997), and the adoption ofthe referral process in the National Employment Action Plan (1998).
The community and voluntary sector participated actively in the European Union’sthree Anti-Poverty Programmes. The European Commission, in turn, influenced theshape of many anti-poverty initiatives in Ireland bringing them to concentrate onthe link between unemployment and social exclusion, develop a multidimensionalunderstanding of exclusion, adopt a programmatic approach and regard participa-tion and partnership as characteristics of good programmes. By the end of the1990s, ‘across Ireland there was an almost nationwide programme of locally drivenprojects tackling unemployment and social exclusion funded by the EU’ (Langford,1999: 109). Ireland, in fact, is regarded as a ‘good performer’ internationally for thelevel and variety of supports provided social partnership at the local level and forthe share of public social expenditure going on active labour market programmes(ALMPs).
186
It is clear that these activist measures on a large scale contributed to the majorreductions in unemployment and poverty which occurred during Ireland’s eco-nomic boom. It cannot be assumed, however, that measures which obtainedresults in the context of high unemployment will continue to do so in the newconditions which now surround Irish society’s most disadvantaged members. Thereality is more complex.
As strong aggregate labour market demand effectively dealt with the issue ofshort-term unemployment itself, an underlying heterogeneity among theunemployed was revealed and narrowly employment-focussed programmesproved unable to address the complex social needs of a growing proportion of theremaining jobless. The number and variety of services needed at the local levelincreased steadily — e.g., welfare information and advice, information on training,education and employment, money advice and debt management, personal andvocational counselling, parenting advice, childcare, elder and sick care, physical andmental services, addiction counselling, etc. The public sector was challenged tofind new ways of ensuring that multiple Government Departments and agenciescoordinated their services to the same individuals, families and communities moreeffectively. Voluntary and community groups secured funding — at levels un-dreamt of in the 1980s — to tackle social exclusion, educational disadvantage andarea development but experienced the problems more intractable than their initialanalyses had suggested. The traditional weakness of local government in Irelandcame to the fore with greater force as local authorities were recognised as themost obvious actors for ensuring the improved coordination and servicing of theincreasingly complex and numerous set of local initiatives. It became clearer thatthe availability of EU funding allowed an infrastructure to expand at local level ina manner that was more juxtaposed to, rather than integrated with, localgovernment and central state services. The expansion had been possible withoutmaking major demands on the budgets of centralised service deliverers and, thus,without them being obliged to align their core activities with the new localinfrastructures.
Several of Ireland’s ALMPs were seen to have contributed more surely to reducingunemployment and poverty than boosting labour supply. Evaluations of individualprogrammes and of their cumulative impact typically found only modest laboursupply effects and, if anything, tended to highlight aspects of programme designconsidered to be ill-suited to the new conditions of the Irish labour market and toreflect a previous era when the challenge was primarily to manage unemploymentrather than facilitate entry into the open labour market (Indecon, 2002: O’Connell,2002). For example, there was ground for concern that the people most in need oftraining because of their weak capabilities in the open labour market had moreincentives to enter public work-type programmes with poor progression prospectsrather than training programmes with better prospects, that support was beingchannelled to the stronger rather than the weaker candidates in the pool of joblesscausing significant deadweight and contributing to the neglect of those in mostneed, and that employment conditions on some ALMPs made progression to theopen labour market relatively unattractive.
re-conceptualising ireland’s welfare state 187
The collective challenge to Ireland’s social partners in the area of activist measures,therefore, is not a minor one of how to retain and make small adjustments to awinning set. Minimally, it is the deeper challenge of recognising the extent towhich current features of programme design and delivery need to be altered tomeet the increasingly complex and multifaceted needs of individuals, families andcommunities. Maximally, it is the challenge of re-conceptualising what theprogrammes are for and how they should be delivered. This last is proving difficultto do. The intensity and duration of debate about the Community EmploymentProgramme is a case in point. Its rapid expansion in the 1990s was facilitated byfunding from the European Social Fund monies and a Public Employment Service(FÁS) that saw few alternatives in the open labour market for many of itsparticipants. The ‘employment’ in question was largely created by groups in thecommunity and voluntary sector who were intent on filling gaps at the local levelin service provision that a centralised public sector was proving unable to meet. Inmore recent years, all this has changed. FÁS is more aware of labour marketscarcities and the desirability of routing more CE participants into the open labourmarket, community and voluntary groups are keen to maintain the types and levelsof service provision developed using CE while the opportunity cost to the Exchequerof funding the CE programme has grown (as EU monies have fallen).
There is a genuine sense, on the part of statutory and public workers and voluntaryand community activists, that activity tackling such issues as social exclusion,educational disadvantage and area deprivation has increased much more thanresults. An important part of the way forward is indicated by the evidence thatactivist measures, for improved effectiveness, need to accord genuine agency tothe local level (the school, the community, the project, etc.). This is essential toensuring that additional resources made available by central bodies (the amountdetermined by clear national criteria) are used with the flexibility and respon-siveness that situations on the ground demand. The primary responsibility of localactors, statutory or voluntary, is, then, to procure improved outcomes using publicfunds in a transparent and accountable way and with the freedom to tailor theiruse of resources as local knowledge and expertise dictates. Combining autonomyand accountability in the design of activist measures has major implications forcentral bodies and local actors. The centre needs to stimulate planning at the locallevel, allocate scarce national resources in an effective way and provide thosesupport services which enhance the capabilities and competences of local actorsbut are best provided at the national level. The local level needs to draw up clearplans and agree on how progress is to be monitored, outcomes measured andperformance evaluated.
Several things can go wrong. (i) Schemes for local interventions over which centralbodies nevertheless retain detailed control risk replicating the more negativeaspects of bureaucracy at the local level as people are led to respond more to therequirements of the centre than to the demands in front of them. This lineaccountability running outside the area can lead to a lack of effective workingtogether, thinly disguised by the discourse of ‘task force’, ‘partnership’ or ‘network-ing’.15 (ii) Eligibility for public funds can be structured in a way that penalises
188
15. ‘The brownie points are for doing what is required to ensure you are achieving the targets in your own plan. There’s no system tomeasure what you might be contributing to other people’s work and — you might say — there’s no value placed on it.’ Thiscomment, from an unpublished survey of inter-organisational contacts in one partnership area, captures the experience of manystaff in statutory agencies attempting to work in local partnership.
success. If funding levels are tied solely to indicators of need (e.g., levels of unem-ployment, early school leaving, etc.) and not also to performance, then success inreducing need can result in funds being withdrawn rather than freed forreallocation in ways that good evaluation suggests. (iii) Central agencies can seethe budget being allocated to local actors and their activities as a threat to theirown budget and standards of performance. This can lead to an inappropriate viewthat local actors are there to implement schemes for which central bodies haveresponsibility.
Chapter 4 highlighted the particularly high degree of reliance of Ireland’s welfarestate on means-testing. It is engaged in targeting not just income transfers but alarge amount of services also. However, what Ireland is doing a lot of, it is far fromexpert at. Many of the key ingredients for ensuring the effectiveness of targetingare significantly absent. For example, data at a sufficiently disaggregated level arefrequently simply not collected or not available to the service providers who needto it to identify their target group and monitor progress. The base line data whichnational surveys provide is often lacking, though it is needed to ground meaning-ful comparisons of the situation and achievements of targeted groups with thoseof society in general. The sophistication of techniques for measuring and moni-toring inputs, outputs and outcomes and for carrying out thorough evaluations ispatchy and, in many instances, lags far behind best international practice. Thedominant concept of evaluation is heavily influenced by financial accounting andbudgetary control and less by a commitment to ‘learning by doing’ and a desire toinnovate. Relationships between the local level where interventions actually occurand central bodies which supply public funding are frequently unsatisfactory, nothelped by Ireland’s traditionally weak local government structures; they are alsounderstandably complicated by the depth of changes occurring to the family,communities, voluntarism and the composition of the voluntary and communitysector. The processes through which particularly valuable social innovations are,respectively, identified, put on a secure financial footing, used to improve localinterventions elsewhere and/or to alter existing public services are haphazard;insufficient learning takes place from what is a wealth of local experimentationand experience.
Area-based partnerships
These observations on the requirements for improving the effectiveness of activistmeasures summarise, in fact, many of the experienced frustrations and sugges-tions for development in current Irish practices. Area-based partnerships provideone example. Area-based partnerships (ABPs) for tackling entrenched local concen-trations of unemployment and deprivation have been in place since the early1990s. Their mission today can be expressed as seeking to improve the inclusive-ness of Ireland’s labour market by appropriately supplementing or influencingactive labour market policies at the national level so that more of their clients indeprived areas can access Ireland’s stronger economy. However, it is not clear ifthey primarily constitute a further layer of administration required if central funds
re-conceptualising ireland’s welfare state 189
are to be properly targeted, or are there to innovate complementary activitieswhich enhance the local take-up of centrally-directed programmes, or are majorplayers which central bodies are there to support. For example:
s The greater part of the resources available to them comes to them throughnational programmes and has to be used, therefore, in accordance with cen-trally set and uniform criteria. The ABPs, for example, have had little scope touse public monies to choose among training providers those with the peda-gogies and track records indicating they were particularly likely to benefit theirclients. [see Box] At the same time, many of the public programmes to whichthey direct their clients are subject to no regular or transparent assessments oftheir effectiveness (ESRI, 2003: 168-169).
s Central agencies are in danger of regarding the local partnerships more asdelivery vehicles for national programmes whose level and conditions of useare determined by the centre, rather than conceiving of their role at the centreas providing supports to local agents who are in the best position (because oflocal knowledge, commitment and acquired specialist expertise) to determinehow to translate any given level of public resources into outcomes. For example,the conception of the Local Employment Service (LES) as a ‘gateway’ enablingdisadvantaged job seekers to access ALMPs was not meant to imply that muchof what lay beyond the gateway (the programmes to which the LES would grantaccess) were to remain tightly specified by the centre, with local innovationlargely confined to developing relatively minor ‘bridging’ programmes.
s Frequently, ABPs experience that the national programmes available to them asinstruments for use at the local level have design features limiting theirusefulness and which they, the local partnership, have neither the autonomynor authority to tailor to individual circumstances. When the perverse effectsof designs in national programmes are pointed out, there is no agreed – muchless speedy – procedure for translating local learning into programme redesign.26
Examples include the growing extent to which people making the transitionfrom welfare receipt to employment have seen most of the financial reward fordoing so eaten up by higher rent payments17, and the incentive that is createdfor people to remain unemployed longer when participation in certainprogrammes is restricted to individuals who are older or with longer unemploy-ment durations18.
s It is also that case that, while more than 12 years experience with ABPs hasproduced a considerable body of research into many aspects of their func-tioning, few firm and widely agreed conclusions have been drawn aboutwhether some have been more successful than others, why that is so, how user
190
16. Northside Partnership (2004), Policy Issues Inhibiting the Client Base of Northside Partnership. November; PLANET/LESN Co-ordinators'Network (2000), Local Employment Service Network: Core Part Of The Dual Stranded National Employment Service; INOU (2000),Combating Prejudice against the unemployed; NESF (2000) Enhancing theEffectiveness of the Local Employment Service; Eustace andClarke (1998), Evaluation of the Local Employment Service. Report Commission by the Policy Unit on Unemployment, DETE.
17. In 1992, a person on welfare and in receipt of supplementary welfare rent allowance could retain a portion of her rent allowance forup to 4 years (the amount paid tapering off). The amount she could receive became zero once her gross income exceeded $371.50weekly (£250), after which a 100 per cent withdrawal rate began. Though private rents have soared since 1992, and earnings levelsincreased substantially, this income ceiling governing eligibility for rent allowance has not been changed.
18. One of the ways in which it has been sought to ensure the more effective targeting of active labour market policies on the ' hard toemploy' has been to limit programme entitlement to individuals over a certain age or with longer than a specified duration ofunemployment. The more attractive and effective the programme to which only older or long-term unemployed individuals areentitled, the greater is the incentive for individuals to 'wait' until time makes them also eligible.
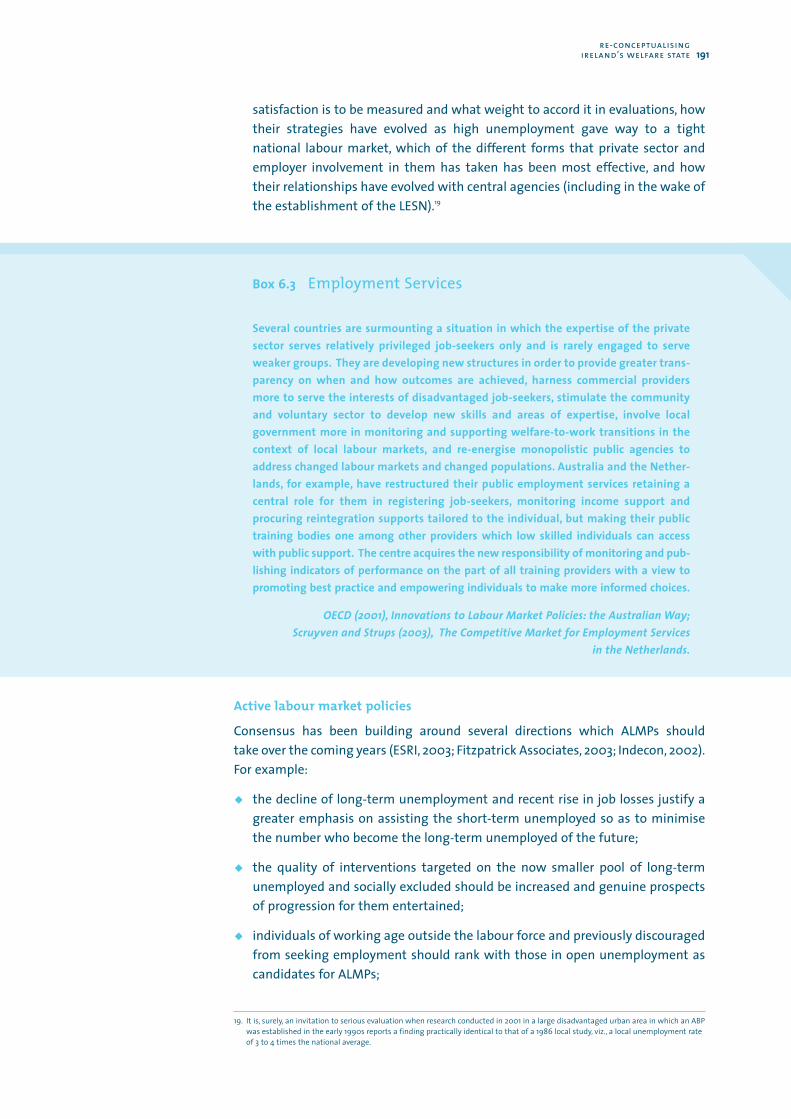
satisfaction is to be measured and what weight to accord it in evaluations, howtheir strategies have evolved as high unemployment gave way to a tightnational labour market, which of the different forms that private sector andemployer involvement in them has taken has been most effective, and howtheir relationships have evolved with central agencies (including in the wake ofthe establishment of the LESN).19
Active labour market policies
Consensus has been building around several directions which ALMPs should take over the coming years (ESRI, 2003; Fitzpatrick Associates, 2003; Indecon, 2002).For example:
s the decline of long-term unemployment and recent rise in job losses justify agreater emphasis on assisting the short-term unemployed so as to minimisethe number who become the long-term unemployed of the future;
s the quality of interventions targeted on the now smaller pool of long-termunemployed and socially excluded should be increased and genuine prospectsof progression for them entertained;
s individuals of working age outside the labour force and previously discouragedfrom seeking employment should rank with those in open unemployment ascandidates for ALMPs;
re-conceptualising ireland’s welfare state 191
19. It is, surely, an invitation to serious evaluation when research conducted in 2001 in a large disadvantaged urban area in which an ABPwas established in the early 1990s reports a finding practically identical to that of a 1986 local study, viz., a local unemployment rateof 3 to 4 times the national average.
Box 6.3 Employment Services
Several countries are surmounting a situation in which the expertise of the privatesector serves relatively privileged job-seekers only and is rarely engaged to serveweaker groups. They are developing new structures in order to provide greater trans-parency on when and how outcomes are achieved, harness commercial providersmore to serve the interests of disadvantaged job-seekers, stimulate the communityand voluntary sector to develop new skills and areas of expertise, involve localgovernment more in monitoring and supporting welfare-to-work transitions in thecontext of local labour markets, and re-energise monopolistic public agencies toaddress changed labour markets and changed populations. Australia and the Nether-lands, for example, have restructured their public employment services retaining acentral role for them in registering job-seekers, monitoring income support andprocuring reintegration supports tailored to the individual, but making their publictraining bodies one among other providers which low skilled individuals can accesswith public support. The centre acquires the new responsibility of monitoring and pub-lishing indicators of performance on the part of all training providers with a view topromoting best practice and empowering individuals to make more informed choices.
OECD (2001), Innovations to Labour Market Policies: the Australian Way;Scruyven and Strups (2003), The Competitive Market for Employment Services
in the Netherlands.
s further education and training for adults with weak labour market skills shouldreceive a priority at least equal to what has been accorded the early schoolleaver.
At the same time, in the face of the greater opportunities and need for currentlyjobless people to participate in the open labour market, it is important not toforget insights acquired during the painful years of high unemployment. Whilethe term ‘unemployable’ was used too liberally in the past (now superceded by‘not progression ready’), employment in the open labour market is not attainablein the short- or even medium-term for everyone; the cumulative impact of disad-vantage in some people’s lives has been too great. Forms of participation otherthan employment in the open labour market remain valid for some people ofworking age (in the social economy, youth and community work, etc.). This implies,for example, that, if the progression purpose of the CE programme were to becomedominant, an alternative channel of support for these other forms of participationwill be needed.
6.4.2 Activist measures in response to educational disadvantage
Consensus has also been building around what is needed to improve theeffectiveness of programmes tackling educational disadvantage. The fragmenta-tion of current schemes, their limited effectiveness and growing cost are a cause ofdeep concern and have been debated for some time. Studies already publishedcontain important pointers to what is entailed if greater coherence and effective-ness are to be achieved. The types of recommendation they make to improveprogrammes can be regarded as having application to areas other than educa-tional disadvantage as well (training for unemployed people, rehabilitation ofaddicts, non-school programmes for early school leavers, etc.).26 For example:
s Agreed national frameworks should provide for greater flexibility to respond ina more planned and integrated way to identified needs at the local level;
s There should be a substantial shift away from schemes understood as stand-alone programmes. Current schemes should be regarded as a menu ofapproaches from which a local actor (e.g., a school) can draw and not as deter-mining what is done;
s A single pool of financial resources should be available to local actors whoshould have the freedom to prioritise expenditure to meet local needs inaccordance with an agreed plan;
s Planning, monitoring progress and measuring outcomes are critical to ensuringthat additional resources have a real and sustainable impact on the groupstargeted;
s More investment is needed in gathering and making available the data foreffective monitoring and evaluation;
192
26. For example, DES (2005), Literacy and Numeracy in Disadvantaged Schools: Challenges for Teachers and Learners. An Evaluation by theInspectorate of the Department of Education and Science; Eivers, E., G. Shiel and F. Shortt (2004), Reading Literacy in DisadvantagedSchools. Dublin: Educational Research Centre; Educational Disadvantage Committee (2003), ‘A more integrated and effective deliveryof school-based educational inclusion measures’, Submission to the Minister for Education and Science, December.
s Local actors should ensure that their own interventions are integrated withother service providers and, in particular, recognise that multiple services canimpinge on the same family and household.
Focussing on primary schools serving areas of disadvantage, the evidence is thatchildren in them continue to have ‘dramatically low achievement levels’ in literacyand numeracy — with underachievement more evident in senior than juniorclasses (suggesting a decline rather than improvement in relative achievement asthe school years unfold) so that significant numbers of children progress tosecondary school unable, for example, to read fluently or understand what theyread.27 This is despite their primary schools being the beneficiaries of special pro-grammes, support initiatives and low pupil-teacher ratios.28 Formidable socio-economic factors and adverse home circumstances, of course, undermine many ofthese children’s capacities to benefit from their schooling; indeed, it is precisely theimpact of such factors which educational disadvantage programmes are designedand funded to redress. However, an evaluation by the Inspectorate of the Depart-ment of Education and Science concludes that much more can still be done fromwithin schools to combat educational underachievement. It points to significantweaknesses in how the full resources that make up school communities arecurrently mobilised and co-ordinated in pursuit of change and improvement.Many of its recommendations underline the potential and need for greaterautonomy to be exercised within the school — for example, boards of manage-ment and in-school management teams doing more to provide strategicleadership and systematically monitor the quality of educational provision in theirschools; whole-school plans being engaged with more and reflected in individualteacher’s plans; teachers using assessment to a much greater extent as an integralpart of the teaching and learning cycle. Other recommendations require theimprovement or redesign of supports provided by central bodies — for example,more in-career professional training, more training geared to teaching in deprivedareas, specific incentives to reduce staff turnover in schools where it is high. Greaterparental involvement and improved links with the local community remain corechallenges also and there too further initiatives, their design, accountability inusing resources and transparency in their evaluation need to be driven by the locallevel and supported by the Department of Education and Science and other centralbodies, rather than the other way around.
re-conceptualising ireland’s welfare state 193
27. While 43 per cent of children in a sample of 'disadvantaged' schools scored at or below the 20th percentile mark in standardisedliteracy tests, it was 47 per cent in fifth and sixth classes; 64 per cent overall scored at or below the 20th percentile in numeracy, but73 per cent in fifth and sixth class. (DES, 2005)
28. In the 12 ‘disadvantaged’ primary schools studied by the Inspectorate of the Department of Education and Science in May 2004, theoverall pupil-teacher ratio was 11:1; 119 ‘mainstream teachers’ were backed up by a further 75 teachers in a variety of support roles.(DES, 2005)
6.4.3 Conclusion
A characteristic of the Developmental Welfare State is that it recognises andembraces the role of activist measures in ensuring its own vitality and develop-ment. Initiatives in providing local services are fostered and examined. It accords,in particular, greater recognition to the community and voluntary sector forpioneering ways of addressing the marginalized position of individuals, familiesand communities — and seeks to create the right framework that allows this tohappen while also engaging community and voluntary groups in networks andprocesses which raise their standards, increase their effectiveness and ensuretransparency and accountability in return for funding security in the medium tolong-term. It also fosters the willingness and ability of government departmentsand public agencies to plan and implement pilot projects for experimenting withnew approaches and procedures. This entails pro-actively fostering a radicallygreater degree of autonomy for local actors and experimenting with new forms ofpublic-voluntary and public-private partnerships. These feature a strong emphasison performance and accountability, provision for systematic learning and evalua-tion, and new forms of centre-local relationships. A central aspect of these newrelationships is agreement on the outcomes being sought, how progress towardsthem is to be measured, the rights of the centre to the necessary data forevaluation and to intervene in certain circumstances, and the rights of the localactors to greater autonomy and security in funding. All this requires statutoryservice providers to reconfigure their own budgets and models of delivery. Theoverall shift in perspective and strategy is summarised in Table 6.5.
194
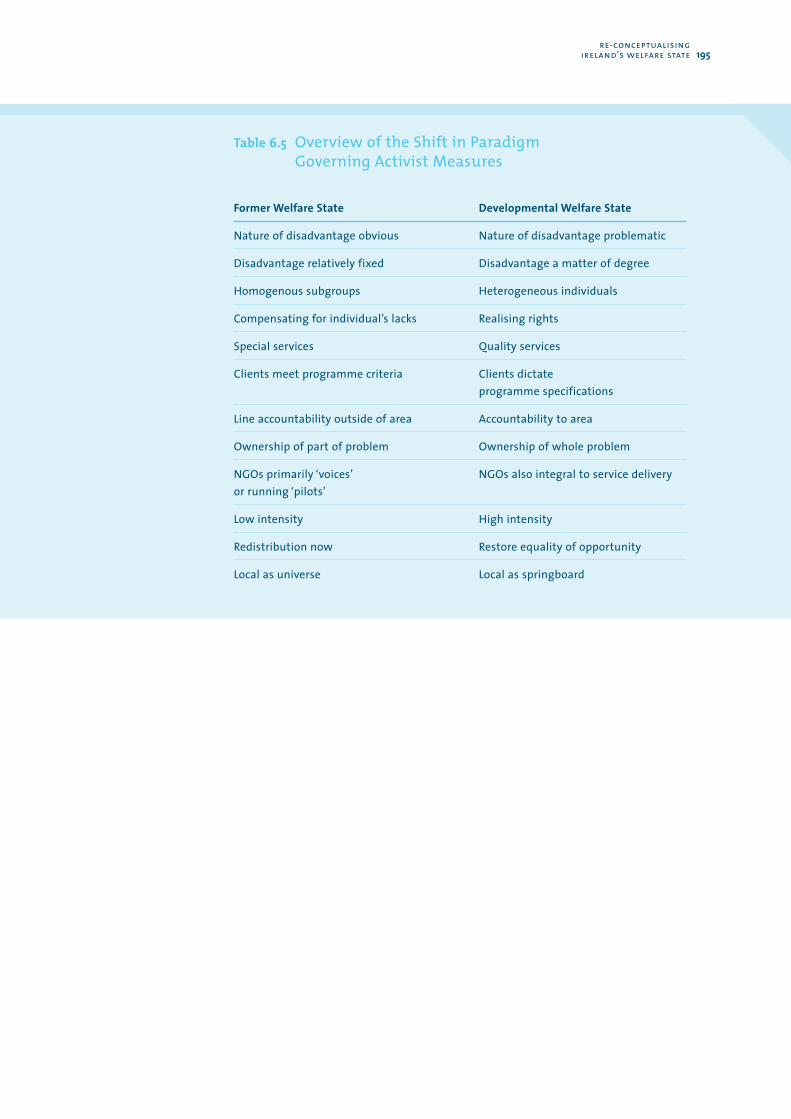
re-conceptualising ireland’s welfare state 195
Table 6.5 Overview of the Shift in Paradigm Governing Activist Measures
Former Welfare State Developmental Welfare State
Nature of disadvantage obvious Nature of disadvantage problematic
Disadvantage relatively fixed Disadvantage a matter of degree
Homogenous subgroups Heterogeneous individuals
Compensating for individual’s lacks Realising rights
Special services Quality services
Clients meet programme criteria Clients dictate programme specifications
Line accountability outside of area Accountability to area
Ownership of part of problem Ownership of whole problem
NGOs primarily ‘voices’ NGOs also integral to service delivery or running ‘pilots’
Low intensity High intensity
Redistribution now Restore equality of opportunity
Local as universe Local as springboard

The Developmental Welfare State:A Framework For Reform
7
7.1 Introduction
This chapter brings the Council’s conceptual discussion of Ireland’s DevelopmentalWelfare State to a conclusion. The argument which the report has unfolded in thefirst five chapters for major reform to Ireland’s social policies and welfare state isfirst summarised. A separate section summarises the essential framework andmore novel perspectives contained in Chapter 6. The next two sections then developthe strategic and operational requirements respectively of implementing theCouncil’s vision for Ireland’s welfare state and social policies. A sixth section clarifiespriority areas in the medium term for achieving the greater integration of services,income supports and activist measures to which the Developmental Welfare Statepoints for children, people of working age and older people respectively. A seventhsection sketches a comprehensive framework for guiding the evolution of socialpolicies in the longer term which the work programme of the Council and those ofmany other bodies must share responsibility for specifying further. An eight sectionconcludes.
7.2 The Argument of this Report
7.2.1 Motivation for the report (Chapter 1)
The Council’s starting conviction is that Ireland’s strong economic performance isa new context within which to seek major improvements in social protection. Asimportant as the higher level of social spending which economic strength makespossible is the manner in which the resources are used. The Council believes thatthe modernisation and reinvention of social policies and Ireland’s welfare state canbenefit appreciably from reflecting on how success has been achieved in the areaof economic policy. There is wide recognition of the need to improve social protec-tion on several fronts — in addressing the deep rooted social disadvantage of asection of the population showing little mobility off means-tested socialassistance, in supporting people at work as they seek to maintain and improvetheir experience of employment, and in setting and reaching wholly new standardsas to how people compromised in their personal autonomy are supported. At thesame time, there is evidence that much of the current thinking and approachescharacterising social policies are not leading to sufficient progress. The implemen-tation of formally agreed strategies is weak and there is a growing ‘process fatigue’in attempting to apply a social partnership approach to the solution of existingsocial deficits. It is an opportune time to attempt a re-conceptualisation of the
197
objectives of social policy, and of the role and basic architecture of Ireland’s welfarestate, in order to align Ireland’s new economic and social realities better with eachother. A new framework will serve as something of a route map to guide socialreform for the social partners and across the public sector.
7.2.2 Aligning economic and social policies (Chapter 2)
Ireland’s strong economic performance has made a huge contribution to socialprogress, principally by vastly improving employment prospects and reducingenforced emigration, raising real incomes and providing the state with a greaterlevel of resources. At the same time, it has been associated with wideninginequalities in several areas (e.g., incomes and housing) and occasioned new formsof social vulnerability (e.g., among immigrants). The international evidence is thata positive relationship between good economic performance and improved socialoutcomes does not occur or reach a satisfactory level in an automatic way. Trade-offs can and do exist. On the one hand, economic and technological turbulencecan damage social cohesion and fracture society unless social policy responses areintelligently designed and well resourced. On the other hand, ill-designed socialpolicies can undermine people’s co-operation with economic change andcontribute to undermining economic performance and, ultimately, the socialprotection that a country can provide its citizens. The conclusion is that goodeconomic performance and improved social protection are neither intrinsicallyopposed nor compelled to occur together in some automatic way, but that theycan be made to support each other. This requires sufficient shared understandingand commitment on the part of those who shape and implement a country’seconomic and social policies respectively. A primary mission of the politicalprocess is to strike a sustainable balance between economic dynamism and socialsecurity, between fostering the competition and structural change that improveeconomic performance and ensuring the protection that increases people’scooperation with on-going economic ‘reinvention’.
The availability and quality of employment is, simultaneously, an economic and asocial achievement. The maintenance and net expansion of jobs requiringmoderate to low levels of skills has been a valuable feature of Ireland’s recenteconomic resurgence. However, a significant number of the low skilled whoremain jobless are prevented by the insufficient development of services and stillunreformed aspects of the tax and welfare codes from accessing availableemployment or vocational and educational programmes. The juxtaposition ofsignificant demand for immigrant workers to perform relatively low skilled jobsalongside high non-employment rates among groups in the indigenous Irishpopulation has the potential to weaken the link between economic and socialdevelopment in the coming years. A more pro-active approach is now needed tointegrate social welfare, access to services, and training and education pro-grammes so that employment with progression prospects becomes a genuineoption for the significant number of people who continue to have low skills.
198
7.2.3 A hybrid system undergoing multiple changes (Chapter 3)
Ireland has developed a hybrid set of arrangements for providing social protectionin which the state is everywhere present but seldom in an omni-competent role.Indeed, without the strong involvement of religious and other voluntary organi-sations during the first half century of the state’s existence, social protectionwould have been much more limited than was the case. There has been majorgrowth and change in the state’s role over the last 20 years, and spending —particularly on health — has increased hugely. But much remains to be done.Deeply rooted disadvantages in educational and health attainments still strikedeeply at people’s capabilities to participate in the new Ireland. Welfare depend-ency among people of working-age has not reduced in scale despite the economicboom and employment expansion of the 1990s, but altered decisively in itscomposition. For example, people in receipt of lone parent’s and disabilityallowances today typically outnumber those in receipt of unemploymentassistance by two to one (the relationship was the inverse in the early 1990s).People in work receive less support from publicly funded services than in EUcountries that have been prosperous for longer than Ireland. For example, Irishworkers at low levels of earnings pay more for accessing public health services andmuch more for childcare than in other EU countries, their participation in trainingis far below the levels that constitute best international practice, and many alsocommute long distances to their places of work. A step-improvement in standardsis also needed in many areas if institutions are to reflect our stronger contem-porary awareness of the worth of each human person — for example, to supportthe participation of people with disabilities in Irish life and improve conditions incentres of institutional care of every type (prisons, psychiatric units, etc.). It hasnever been more important to have some framework that would support theidentification and prioritisation of social spending, reduce oversights and im-balances to the minimum and give people a strong sense that fairness and justiceare being applied to the allocation and use of the public resources produced bytheir involvement in the country’s economic success.
7.2.4 Social protection in Ireland in a comparative context (Chapter 4)
There is currently a significant gap between Ireland’s ‘welfare effort’ as conven-tionally measured and that of comparator countries. Some of this is due to factorssuch as having a young population and near full employment. Some of it is becausethe ways in which the statistics are gathered and compared make it easy forIreland to appear to ‘under-perform’. And some of it is due to sections of the Irishpopulation not enjoying the standards of social protection which their counter-parts in other advanced countries receive. In these last areas, some policydevelopments are under way that will contribute to raising Irish standardssignificantly (e.g., the National Disability Strategy). Higher social spending, how-ever, is a means to an end and not, in itself, an achievement. In each society,including Ireland, unique circumstances determine the relationship between socialoutcomes and levels of state spending. It is revealing, for example, that some edu-cational outcomes of Ireland’s 15-year olds compare well with those of severalother countries that are devoting higher proportions of their resources to publicspending on primary and secondary education; there is also broad public satis-faction with schools in Ireland. But it is also revealing that a major increase in the
the developmental welfare state:a framework for reform 199
proportion of public resources being devoted to health spending has, so far, notbeen associated with significant improvements in Ireland’s relatively poor healthoutcomes or higher levels of public satisfaction with health services. In a similarfashion, specific features of Ireland’s current arrangements for providing incomesupport deserve close scrutiny in cases where the levels of transfers in Ireland bearcomparison favourably with other countries but those countries have much lowerat-risk-of-poverty rates for the groups concerned. Several key variables interactwith public spending to determine the outcomes associated with it — e.g., theroles of the family and of the voluntary and community sector, establishedbehavioural patterns, the quality of management, the level and quality of trainingof staff, the ethos of public service in the professions, workplace practices, the easeof combining partial welfare support with some degree of earnings. It is importantthat strategies for social spending in each area reckon with the factors that co-produce the outcomes being sought.
7.2.5 Learning well from other countries (Chapter 5)
The structure of Ireland’s current welfare state has disparate elements thatresemble, respectively, the citizen-based Nordic welfare model, the social-insurance Continental European model and the residual Anglo-Saxon welfaremodel. A case can validly be made that the needed reform of Ireland’s welfarestate involves moving strongly in one of these directions. However, the Council isimpressed by the evidence that the welfare states of other countries are based notso much on pure ideologies as on characteristic cultures and institutions, thatthere is considerable ferment and the adoption of mixed elements within theirreform programmes, and that an overly ‘pure’ embodiment of any one model onIrish soil would still leave some serious social issues un-addressed. The conclusionis reached, therefore, that, while significant learning is possible and important inspecific instances from each of the more sharply defined welfare models, thehybrid character of the Irish system is more than ever, in the new economic andsocial circumstances in which Ireland now finds itself, a potential strength. Thechallenge in formulating an overarching strategy for Ireland’s welfare state is thenexpressed as identifying where and how elements of further universalism, extend-ed social insurance and redesigned targeting are required by Ireland’s new societyand economy, with paramount respect being accorded to improved outcomesrather than greater ideological clarity. However, the report also finds that institu-tional weaknesses and maladapted design characterise many of Ireland’s arrange-ments for providing social protection and that they are responsible for pooreroutcomes than it is possible to achieve even with the same level of resources.
200
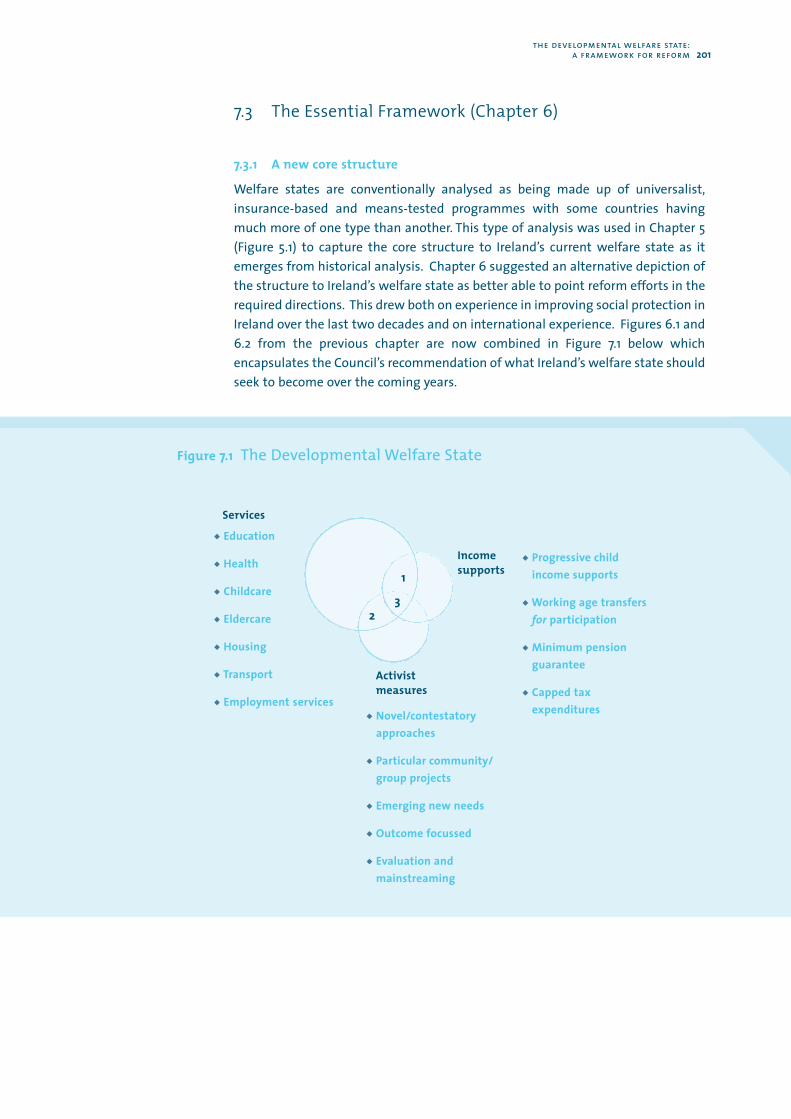
7.3 The Essential Framework (Chapter 6)
7.3.1 A new core structure
Welfare states are conventionally analysed as being made up of universalist,insurance-based and means-tested programmes with some countries havingmuch more of one type than another. This type of analysis was used in Chapter 5(Figure 5.1) to capture the core structure to Ireland’s current welfare state as itemerges from historical analysis. Chapter 6 suggested an alternative depiction ofthe structure to Ireland’s welfare state as better able to point reform efforts in therequired directions. This drew both on experience in improving social protection inIreland over the last two decades and on international experience. Figures 6.1 and6.2 from the previous chapter are now combined in Figure 7.1 below whichencapsulates the Council’s recommendation of what Ireland’s welfare state shouldseek to become over the coming years.
the developmental welfare state:a framework for reform 201
Figure 7.1 The Developmental Welfare State
Services
Incomesupports
Activistmeasures
s Education
s Health
s Childcare
s Eldercare
s Housing
s Transport
s Employment servicess Novel/contestatory
approaches
s Particular community/group projects
s Emerging new needs
s Outcome focussed
s Evaluation andmainstreaming
s Progressive childincome supports
s Working age transfersfor participation
s Minimum pensionguarantee
s Capped taxexpenditures
1
32
Figure 7.1 identifies a wide set of services which are needed to provide socialprotection in contemporary Ireland, views all income supports provided by thestate (including tax expenditures) together, and highlights the need for activistmeasures that ensure social innovation constantly occurs and is learned from. Thecircle representing the set of services is deliberately bigger than the other two.This reflects the strategic value placed on bringing the vast majority of thepopulation to use the same set of services. The services, therefore, have to be ofsuch a quality and access to them so tailored (capped charges for some, wholly freeto others) that they come to constitute, in effect, a ‘services dividend’ accruing frommembership of a society where the economy has been internationalised and thesocial model is built on high-employment. Services which a diverse population usethen receive strong public support, and play a significant role in strengtheningsocietal cohesion.
7.3.2 The services dividend
The Council believes that the development of services is the key to improvingsocial protection for Ireland’s population in the coming years. Adequate moneyincomes remain, everywhere, a necessary condition for satisfactory participation insociety and the economy but they are not a sufficient condition. The principalrequirements for widening participation today are of a nature which increases insocial welfare alone are inadequate to address — e.g., access to childcare by loneparents, education and training for people with low skills, affordable and availablehealth services and housing, secure and attractive housing areas, the return toeducation of early school leavers (both young and adult), public services and publicplaces that are accessible to persons with disabilities, rehabilitation facilities forpeople recovering from an addiction.
The Council believes that the population’s continuing cooperation with economicchange will have to be accompanied by improved services providing socialprotection. Previous chapters have highlighted the pivotal significance — toachieving societal cohesion, social inclusion and good economic performance — ofhigh quality services to which there is universal access but where the means ofaccess are tailored to individual’s specific circumstances. The primary role of thestate is to orchestrate the consolidation of service systems that support theseoutcomes, systems that may be characterised by more or less diversity of serviceproviders, in which the state has the responsibility for procuring comprehensivecoverage, maintaining standards and ensuring equity. There is widespread con-cern, which the Council shares, that the speed with which services deficits in keyareas are being addressed is insufficient (e.g., childcare, eldercare, life longlearning). This, it believes, will continue to be the case until networked manage-ment is developed and embraced more decisively by the multiple actors involved,the state’s role is redefined and it is re-equipped adequately to discharge its newrole in each system. This is spelt out more in section 7.4 below.
The changes needed in service provision in Ireland frequently involve achievingsignificantly more dynamic roles for public sector service providers within thesesystems.1 The Council emphasises that one critical requirement is that public sectorproviders embrace proactively the management, organisational and technological
202
1. All these points are exemplified in the Council's study, Housing in Ireland: Performance and Policy (2004), NESC Report No. 112.
changes that are necessary to provide high quality services and halt the currenterosion in the take-up of public services by individuals who have the means topurchase private sector alternatives. The public response to Dublin’s LUAS can betaken as an encouragement to seek a scale of improvement in quality across thespectrum of public services — in public hospital wards, non-fee paying schools,local authority housing, etc. — that would have the effect of making people willingto pay for inclusive public services rather than for exclusive private ones.
7.3.3 Tailored universalism
Inclusive public services, however, need not be — and, in many instances, shouldnot be — accessed by all people on the same terms. On the contrary, the Councilsupports an approach that can be termed ‘tailored universalism’. This means that,in so far as possible, mainstream providers embrace the challenge of adjustingtheir services to accommodate a more diverse public, including a public whoseindividual members have different requirements if they are to have an equalopportunity to benefit from the service. This route is consciously preferred to thealternative of developing wholly separate service provision for atypical groups.
Ireland’s welfare state to date has shown a strong ability to create new servicesthat are specific to the circumstances of vulnerable minorities (ALMPs, educationaldisadvantage programmes, etc.). It has been less successful in increasing the capa-bilities of mainstream services, public and private, to tailor what they provide so asto ensure access and proportionate benefit to socially disadvantaged users.Targeted services exclusive to poor people, however, remain difficult to evaluate andeasily deteriorate so as to embody low expectations of their clients.
The ideal the Council proposes for publicly-funded service provision is that, at thekey point of interface between a service professional and the person using theservice, there should be neither an incentive nor a reason for the provider to takeaccount of the income circumstances of the client but only of the person’s need.Individual professionals should not be publicly subsidised effectively to auctiontheir services to the highest bidders. Rather, the public funding of service profes-sionals’ salaries should ensure their freedom to accord individuals seeking theirservices treatment that is impartial with respect to the clients’ incomecircumstances. The need to ensure that demand for publicly-funded services istempered by awareness of the cost of supplying them is better met througharrangements such as differentiated charges through which the public systemrecoups some of its operating expenses. Tailored universalism is already achievedor anticipated in many developments: the third level lecturer need take no accountof the diverse arrangements that support students present in the lecture hall; itmakes no difference to the driver of public transport that passengers travel ondifferent terms and conditions.
Two complementary strategies can be distinguished for strengthening inclusiveservice provision; a first focuses on the challenge of so enhancing the responsive-ness and quality associated with public service providers that people who couldpurchase private sector alternatives lose interest in doing so; a second supportsmeasures that give people on low incomes access to privately produced services,through vouchers, licensing conditions, regulation and other measures and with-out introducing a two-tiered service on the part of the private providers.
the developmental welfare state:a framework for reform 203
In so far as a ‘services dividend’ to Ireland’s stronger economy is realised alongthese lines, some specific positive developments can be anticipated. More of the non-poor will find that transitions between jobs or between employment,caring, study, career breaks and self-employment are supported rather thanpenalised. Their lifetime attachment to the labour force and life-time productivitywill be enhanced to the benefit of the economy’s long-term growth path. They willaccept that their taxes and not just their take home pay bring them benefits inreturn for their work. They will, in effect, come to have a higher ‘social wage’ (area1 in Figure 7.1).
Where differentiated routes give people access to the same services, a significantcommonality is established that strengthens social cohesion and the scenario of‘poor services for poor people’ is avoided. This can contribute powerfully to dilutingthe problem of social exclusion (area 2 in Figure 7.1). It is notable, in this regard,that access to quality public services became a major plank in the revised anti-poverty strategy, and that the Charters of Service Standards drawn up by Govern-ment Departments are embracing the implications of a public which is increas-ingly diverse and, in particular, the obstacles to access that confront people whoare socially disadvantaged.
As the threshold of competencies and skills giving access even to the simpler jobshas risen and family and other support networks come under increasing pressure,more of the people who are unable to be self-reliant exhibit multiple needs. As thisreport has highlighted, the most innovative measures for supporting them aretaking the form of ‘high support’, ‘personal care’, and ‘participation’ packages inwhich the different service providers come together to offer holistic and tailoredresponses to the situations of individuals (area 3 in Figure 7.1).
7.3.4 Income as necessary but not sufficient
The overarching challenge to Ireland’s welfare state can be described as attainingthe more effective integration of the services, income supports and activistmeasures which provide social protection to people at each stage in their life cycle.This requires reinforcing new perspectives which are emerging on the provision ofincome support to people of working age.
Improving the adequacy of social welfare payments in Ireland has been — andremains — a key feature of social policy and social progress in Ireland since 1986(the publication of the Report of the Commission on Social Welfare). A minimummoney income is essential to live life with dignity as an adult in contemporaryIreland. Delivering on the commitments entered into by government, therefore,remains integral to the Council’s vision of a just and successful society.2 Indeed,there is a need, on an on-going basis, to continually improve the mix of policies thatenables the floor to money incomes to continue rising in Ireland. The Councilbelieves, however, that this will require a new perspective on what social paymentsare meant to achieve. The participation of people in society is not secured byincome alone, even a satisfactory one. Filling the role of a consumer is far fromexhausting what is meant by ‘participating in activities which are considered thenorm for other people in society.’ The latter also requires motivation and self-
204
2. The lowest social welfare payment reaching c150 a week (in 2002 terms) by 2007.
esteem, skills, competences and learning ability, interests and social networks. It iseven possible that the very arrangements through which a person has access to astream of income can damage these other attributes that normally ensure incomeis a springboard to participation. This is already recognised and allowed for in thecase of paying unemployment assistance where it is accepted that someintegration of the payment arrangement with service providers ( job placement,training and education) is needed to ensure that a person does not give upaltogether on a future as a worker. The prevention and activation (‘referral’)process under the National Employment Action Plan systematically links the pay-ment arrangements of the DSFA with the employment services of the DETE and hasbeen a notable innovation in this regard, but it remains a somewhat isolated case.
7.4 Strategic Requirements for Effective Reform: How
This report emphasises several strategic requirements if reform is to be effectiveand significant implementation deficiencies in the Irish context are to be over-come. Significant procedural and institutional innovations have already takenplace that are advancing the Irish social policy system in the direction of theDevelopmental Welfare State. The Council considers that what is being learned inand through, for example, efforts to progress the National Children’s Strategy, theNational Disability Strategy and the National Anti-Poverty Strategy can contributein an important way to reshaping Ireland’s entire welfare state. The followingstrategic requirements are partially anticipated in these strategies but require amuch fuller expression though them if they are to bear fruit:
i. Governance and leadership;
ii. Rights and standards;
iii. Integration at the local level;
iv Accountable autonomy.
7.4.1 Governance and leadership
The interventions of several government departments and public agencies aretypically required to respond effectively to the same social issue (e.g., educationaldisadvantage, child poverty, health inequalities, etc.). Increasingly, therefore, onepublic body needs to assume a lead role and to innovate new ways of workingacross the public sector that are interdepartmental, cross-agency and multidisci-plinary. This is demanding of a public sector culture where the boundaries ofjurisdiction and competence have been clearly drawn between departments andagencies and are the basis of accountability. However, the Irish public systemshares this challenge with many other countries and there has been extensiveinternational discussion and experimentation from which Ireland can benefit.
the developmental welfare state:a framework for reform 205
A comprehensive response to many social needs also typically involves theengagement of a wide range of actors outside of the public sector – on the part ofindividuals themselves, of their families and communities, of groups in the com-munity and voluntary sector, and of the private sector. The outcomes sought inmany social areas are essentially co-produced, so much so that, in some instances(e.g. health), the return to a given level of public spending is hugely augmented oroffset by behavioural patterns, peer group and community influences. Thus:
s many social problems have significant behavioural components and it ispatronising and, ultimately, ineffective to factor out personal responsibility andpersonal agency from the design and operation of programmes addressingsocial needs. These must recognise the extent to which solutions in manyinstances are co-produced by individuals, families and the intervening bodies;
s the arenas where unmet social needs have their most damaging consequencesare, frequently, the family and local community, and it is within them thatcommitment and the potential to remedy a situation can be the strongest.Strengthening the capacity of families and communities to address social needhas to be a core dimension in social programmes;
s civil society constantly throws up groups and organisations with specificinsights into and, frequently, accumulated expertise in addressing the needs ofspecific social groups. These insights extend into how services should bedelivered and public policies altered;
s the majority of people spend their working lives in the private sector and manyare willing — sometimes for profit and sometimes for solidaristic reasons — toapply some of the organisational know-how, networking ability, profits,employment and outsourcing opportunities of their companies to addressingsocial needs.
Consequently, the coalitions that can — and should — now be formed to ensurecomprehensive responses to many of Ireland’s social deficits need to be broad.Their composition should combine actors with insights into the impact onworkers, companies and the economy of the deficit in question, and of remediesthat are proposed for it, as well as those aware of the impact on individuals, fami-lies and communities. The coalitions need to realise that the outcomes, which therelevant actors jointly and genuinely seek, are beyond the competence of any oneof them to deliver singly (including central government), even if that actor hadaccess to unlimited resources.
Ireland’s public interventions for social protection are provided by a highlycentralised state, which — at the same time — is not a strong state. This meansthat there can be a major focus on what the state should do while, at the sametime, state measures are significantly limited in their effectiveness. The contrastbetween government and governance recognises limitations in the competence ofgovernment and seeks the engagement of all stakeholders with the significantchanges that are needed in the state’s capacity to steer society and the methods itmust use to do so.
206
As the range of actors whose roles need to be coordinated widens (statutory andnon-statutory bodies; professionals of different disciplines, para-professionals,voluntary workers and service users), the formation, implementation and review ofpolicies for social protection sphere become, increasingly, an exercise in gover-nance. Governance is a recognition that, because even the full exercise of statepowers in many areas cannot guarantee the outcomes sought, more progress ismade (with less wastage of resources on surveillance, enforcement and othertransaction costs) when all the parties whose actions constitute part of the neededresponse actively cooperate with the manner in which their diverse contributionsare to be governed in order to reach the desired outcomes.
Governance throws up the challenge of leadership and risks making it particularlylikely to be contested. It is the state’s role to set the framework, ensure universalcoverage to the necessary standards and with the required degree of diversity, andexercise a leadership that respects the characteristic contributions of the privateand the voluntary sectors. This requires striking a balance between providingfunding and ensuring accountability, levying charges and guaranteeing universalaccess, exercising leadership in a transparent and fair way and not allowing partialinterests to veto progress, engaging in consultations and making timely decisions.
7.4.2 Rights and standards
The growing diversity and sophistication of Irish society has set a dynamic under-way involving setting standards and framing social and economic rights.
The Council has emphasised that there are complex philosophical, political, legaland practical issues involved in the identification, creation, legislation and vindi-cation of social and economic rights.3 It believes that complexities and tensionsthat are within the rights tradition throw an important light on how social policiesand Ireland’s welfare state need to develop. It has argued that vindicating socio-economic rights — or even specifying what they mean — is not in the power ofcourts or governments acting on their own but requires wide societal engagementin creating the policies and institutions that establish their content and meaningin a specific context. It becomes of paramount importance, therefore, to concen-trate on specifying, attaining and monitoring the standards that should governthe various areas of service provision (health, education, social welfare, housing,employment services, etc.).
On the one hand, society’s attainment of higher general standards (of educationalattainment, life expectancy, median income, standard of housing, individualautonomy, etc.) influences the perception and articulation of just what it is thatthe individual has a right to. What otherwise are vague rights (to ‘employment’, an‘income’, ‘housing’, ‘health care’, etc.) become specified in terms of what is neces-sary to a person’s development in a given context and in terms of what well-func-tioning systems can actually deliver. Stronger institutional and policy capabilities,which are in part the fruit of an increase in resources, thus, enrich the content andmeaning of rights and lead to the formulation of new ones. On the other hand, the
the developmental welfare state:a framework for reform 207
3. Section 8.4 in An Investment in Quality: Services, Inclusion and Enterprise (2003). NESC report No.111. See also O'Donnell,R. (2003),Beyond Justiciable Rights — Standards and Quality.
articulation of rights propels the development of institutions and policies. Agreater appreciation of the human person and of the conditions that constitutethe essential framework for personal development (including as a social being) ina given context results in the articulation of the individual’s social and economicrights. The moral need to realise these rights and, where appropriate, the legalobligation to do so, then spurs and is inseparable from the development of insti-tutional and policy innovations for doing so.
Standards not only give content and meaning to rights but help to make a visionconcrete and to operationalise principles. For example, the vision might be to‘cherish all the children of the nation equally’ and the principle to have a ‘child-centred approach’ to primary education. A standard that accords with this visionand principle, however, would take the form ‘that children who enter primaryschool with a literacy disadvantage are to experience rates of improvement abovethe median’.
Standards are both statements to service users and statements by servicedeliverers. On the one hand, they allow service users to see the content of theirsocial and economic rights in the context of the actual society in which they areliving. They express what the individual has a right to expect and what she or heis committed to support being provided on her/his behalf for others in Irish society.On the other hand, standards express how service deliverers understand what iswithin their competence to provide (based on current technological, knowledgeand organisational frontiers) and what constitute the hallmarks of doing so profes-sionally.They ‘translate’, for example, mission statements into concrete undertakings.
In this context, it is instructive that the major attempt Ireland is making —through the National Disability Strategy, the Disability Bill and its associatedsectoral plans — to ensure that persons with disabilities can participate on anequal basis in society and the economy is, in effect, involving the articulation of‘new’ rights:
s the right that public services provided for in legislation should be responsive,flexible, person-centred and accountable;
s the right that the resources voted by the Oireachtas should be allocated fairlyand transparently, used efficiently and evaluated on the basis of outcomesachieved;
s the right that that the assessment of the needs of persons with disabilities,their individual service statements and the services they receive be subject tofair systems of appeal, review and remedy.
If standards are to realise social and economic rights and give dynamism toIreland’s welfare state, they need to:
s Be jointly and provisionally set — a deliberative process has to be co-ordinatedby an organ of the central state which elicits agreement among stakeholders asto what those operating at the technological, knowledge and organisationalfrontiers are currently able to achieve and which can serve as standards toimprove practice and performance throughout the service system;
208
s Be measurable in a way which allows degrees of performance to emerge (thisgenerally requires scaled rather than binary performance metrics) and bevalidly compared across diverse service providers (this requires standardisation).This requires the willing disclosure by service providers of information on theirprocesses and performance;
s Be used as tools for systematic learning – the purpose of asking service deliversto provide the data that enables them to be compared with each other andranked (an activity undertaken by the centre) is to improve the performance ofeach one while respecting its ethos and particularity. Standards includeperformance standards that allow service providers to see how well or not theyare doing and process standards that guide service providers in improving theirperformance. Both sets of standards emerge from the system of which they area part and from their own ‘profession’ and are not the arbitrary demands ofcentral government in return for funding;
s Be the basis of intervention by central authorities and affect the allocation ofpublic resources. Two different but complementary approaches are to rewardtop performers with additional funds on the evidence that the public is receiv-ing a high rate of return, and to use additional funds to support reforms whereclear room for improvement constitutes grounds for also expecting a goodreturn on scare public resources.
7.4.3 Integration at the local level
The key point of interface between people using services and the organisationsdelivering them is local, i.e., in or near the communities where people live. It is atthis level that feedback between service deliverers and service users needs to begenerated and learned from, that service deliverers need to coordinate their opera-tions more and where greater autonomy should be granted and exercised. Thereare key areas where a greater responsiveness of public services to local needs,including their integration, could significantly improve outcomes. In health, forexample, more services in people’s communities provided through local networksof primary care teams and more community bases for specialist service providerscould ease pressures on the hospital system, keeping some people from the needfor hospitalisation and improving the service for A&E attendees. If schools workedmore with local communities and deliberately fostered the role of parents as co-educators by developing as learning centres for their surrounding communities,children’s underperformance at school and adult educational disadvantage mightimprove together. The Council welcomes as particularly significant the establish-ment by local authorities of City and County Development Boards with their remitto support and enhance the multiple initiatives at local level through which peopleare seeking to exercise responsibility for improving standards and services wherethey live, including in disadvantaged areas. Indeed, frequently, it is in disadvan-taged areas that the need and quest for more locally based and better integratedservices has been most evident and innovations taken place — or been urged —that give insights into how to improve service delivery throughout the entiresystem.
the developmental welfare state:a framework for reform 209
Many challenges remain. Ireland has a tradition of weak local governmentstructures. Indeed, much of the difficulties with implementing agreed strategiesarise from the insufficient empowerment, coordination and performance of localactors. The Council believes that the agency of local actors (the primary care team,the school, the area partnership, the estate management body, etc.) can andshould be enhanced through bolder innovations featuring new types of relation-ships between central and local bodies. This is not the same as decentralising theoperations of central bodies. It requires a centre that is strong but not simplybecause it has a large network of regional or local offices or is able to use its fund-ing power to influence what recipient organisations do. The strength in questionis, rather, its ability to acquire, process and disseminate knowledge on feasiblestandards and how they can be attained, and to promote their adoptionthroughout a network of diverse and autonomous service providers.
7.4.4 Accountable autonomy
This report has drawn (Chapter 6) on the rich international literature on theorganisational changes in public services in many countries. Successful experi-ences in other countries point to the need to accord service deliverers moreautonomy to decide how they use resources in the pursuit of agreed outcomes andmore incentive to innovate in the search for improvements, while structuring theiraccountability to service users and central government in new ways.
More effective implementation requires that local service deliverers and thecentral bodies monitoring their performance see themselves as jointly engaged ina social learning network and committed to raising the standards that givemeaning to rights. For example:
The centre fosters mutual learning among the local deliberating units bycollecting and distributing information on experiences gathered within thenetwork. The most important task of the (network acting in coordination) is(then) to convert information on multiple parallel experiments into perform-ance standards based on the best practice found. These performance standardshelp local units to locate a large number of similar experiences and draw lessonsfrom them. They stimulate discussion on the reasons for shortcomings and pos-sibilities for improved performance. Such performance standards are construc-tive in that they not only entail an implicit criticism of sub-standard perform-ance, they also show ways of improving performance. [Eberlein and Kerwer,2004: 132]
There is the potential as well as the need for this new type of relationship betweenthe centre and regional or local service deliverers to develop in Ireland. The healthservices reform process features significant centralisation and, with it, theopportunity to pool and compare key information on the operation of individualhospitals and primary care teams. The thrust of this report supports greaterautonomy being accorded hospitals and primary care teams within the newcentrally coordinated and serviced national health service, so that commitmentand learning at the key point of service delivery is maximised, best practice isidentified and disseminated, minimum standards are adhered to and resourcesallocated in a fair and transparent manner. The Department of Education and
210
Science should develop a process through which the rate of progress made bychildren can be fairly compared across schools, practices and procedures in theschools recording the best progress be communicated to schools making the least,and incentives and supports be provided to poorly performing schools to helpthem close the gap with those that are performing well. The Housing Unit, a jointventure of central and local government, is a further example of where and howaccountable autonomy can be promoted; its brief is to identify and disseminatebest practice in the management of local authority housing.
The Council fully supports these developments and recommends their morevigorous and deliberate development across the entire spectrum of servicesproviding social protection (area-based strategies, drugs task forces, employmentservices, etc.).
7.5 Operational Requirements
Strategic requirements are one thing and the capacity to implement themanother. It is useful to distinguish four levels, on each of which challenges toestablished Irish practices have to be faced and overcome if implementationdeficits are to be addressed and Ireland’s welfare state develop along the linesindicated above.
7.5.1 National government and partnership
High-level political decisions and social partnership procedures must be supportiveof the required changes. Where a clear strategy and priorities are agreed at thenational level, maximum scope needs to be accorded the autonomy and initiativeof management and staff at the different operational levels to implement thestrategy, subject to the appropriate accountability. Otherwise, the small scale ofIrish society and its developed social partnership arrangements risk affordingdifferent interests the opportunity to push government towards micro-manage-ment, exercise vetoes on developments in the national interest and make localindustrial relation matters into national concerns.
7.5.2 Joined up government
If greater collaborative action between public bodies and across governmentis to be attained, significant improvements in the management of public expendi-ture are still required. The Council addressed some of these issues in an earlierstudy (NESC, 2002). It concluded that a stronger strategic focus needed be given toexpenditure allocations across and within government departments than iscurrently achieved through the Annual Estimates/Budgetary process. It arguedthat the formulation of strategic priorities (such as those which could be adoptedfor social protection in line with this report) should have a more transparentimpact on the allocation of public spending, both in the adequate funding of newdepartures and the trimming or closure of existing programmes. To this end, theCouncil recommended that the Department of Finance and key line departmentsshould jointly engage in a structured and deliberate way in evaluating options forattaining new strategic objectives and adopting a clear strategy. The Council
the developmental welfare state:a framework for reform 211
reiterates the importance of such a development. The allocation of additionalresources for social protection will always necessarily be influenced by Cabinetdeliberations and the composition of government. However, a stronger cross-departmental view and agreement on where and how significant advancestowards a focussed objective could be achieved by applying additional publicresources would significantly reduce fluctuations in policy, the duplication of initia-tives and the spreading of resources too thinly for the desired impact to materialise.
The Council’s earlier work also found that the current management of publicexpenditure is highly focussed on establishing that spending remains within thelimits set and is incurred on the items for which it was sanctioned. The question ofwhat the spending is intended to achieve — both in terms of levels of servicesoutput and their effectiveness in contributing to the outcomes that ultimatelymotivate the spending in the first place — is rarely articulated. Without diminish-ing the importance of financial control and efficient cost management, thestrategic requirements for the new type of welfare state to which this study pointsunderline the importance of incorporating into departmental reporting systemsmeasures of the outputs being produced and evidence of their contributions insupporting the attainment of outcomes (which are frequently co-produced withother actors, as discussed in 4.4 above).While the requirement to report on outputsand outcomes has major implications for the expertise and internal resources ofDepartments, it will enable quite a new approach to be taken to allocation withinDepartments and across them. For example, greater awareness of how inputs aretranslated into outputs and outputs used to support outcomes would allow lineDepartments to have greater autonomy in reallocating resources across pro-grammes. It would also increase the likelihood of agreement being reachedbetween the Department of Finance and line Departments as to how programmesand services competing for resources should be prioritised prioritised in pursuit ofa single focussed objective.
7.5.3 The public management of networked systems
It has been emphasised that the state shares public authority and public resourceswith a large number and wide diversity of ‘third parties’ in order to attain publicobjectives. The manner in which they are supported, regulated and monitored bypublic bodies is critical to satisfactory outcomes being produced. It is clear that, inpast decades, the state paid insufficient attention to monitoring the standards andaccountability governing the exercise of public authority and use of public fundsby third parties. However, in the very different society of today, the challenge togovernment is to become more expert in the management of complex networksand not to attempt extending the ‘command and control’ management charac-teristic of traditional public administration systems to what are autonomous for-profit and non-profit private institutions. The latter have been significantlyinvolved in providing social protection since the foundation of the state and, as theanalysis in this report makes clear, their role is only likely to increase. Publicadministrators must now neither surrender the public interest and allow ‘interestgroup capture’ nor weaken trust and collaborative action through initiatives thatare experienced as high-handed or inconsistent. The Council believes that majorchallenges face public administration today in developing its own capabilities toactivate, orchestrate and modulate networks of interdependent actors delivering
212
social protection in the years ahead. This will require new forms of principal-agentrelationships and their contractual expression (in public-private partnerships,public-voluntary partnerships and the like), improved evaluation skills and astronger performance culture.
7.5.4 Management and workforces
The quality of management at senior level, particularly in the public sector, is alsopivotal to generating the ‘services dividend’. Management and workers alike inseveral areas of the public sector face a more critical and sceptical public. They arebeing challenged to achieve a greater integration of the consultation anddeliberation characterising partnership with organisational changes that areeffective in modernising service delivery and improving its efficiency. The publicsector, generally, has a particularly highly educated workforce and, arguablytherefore, exceptional potential to benefit from the shift to a more participativemanagement culture and away from a top-down, hierarchical style. Yet aninformed judgement is that too few of its workplaces ‘are introducing the types ofhigh involvement human resource management practices’, ‘the improvement ofinformation flows and consultation’ and the ‘effective communication’ that are‘essential to harnessing the collective and individual knowledge and expertise ofemployees’ (NCPP, 2005: 77).5 The public sector has led the way in introducing job-sharing, part-time working, flexible hours, career breaks and the like. A strongcommitment to the interests of service users on the part of management andworkers is required to ensure that these leads support improvements in servicequality and efficiency rather than their opposite. The degree of change alreadyunderway in the culture and management of the public sector, however, shouldnot be overlooked, and its management and workforce have much less reasonthan in the past to fear tests of how well they achieve knowledge management,value for money, improved customer service, more open recruitment and a greaterdegree of ‘accountable autonomy’ for their own operating units.
At the local level and key point of interface with the service users, trust and unityof purpose between workers and management which are capable of generatinginnovations and not just of implementing changes decided on at higher levels areof key importance. The generation of a ‘services dividend’ is severely threatened ifworkers/staff regard management as an adversary, work as a relatively fixed ‘lump’to be husbanded, innovation as an opportunity to lever compensation for havingto change, and current jobs with their terms and conditions as entitlementsdivorced from service standards and output levels rather than justified by them.Yet workers also need to have their grounds for fearing the new and unknown andfor mistrusting management addressed. Effective workplace leadership, skilledmanagement, proactive unions (where unions are present) and timely publicsupports from outside the company/organisation are needed if people are to seethat their security lies in updating their skills rather than in seeking to freeze theircurrent job descriptions. The same factors are required if workforces are to embraceinnovation as a route to serving clients better and developing greater autonomyand flexibility for themselves, and a collaborative approach with management as
the developmental welfare state:a framework for reform 213
5. Forum on the Workplace of the Future (2005), Working to Our Advantage. A National Workplace Strategy. National Centre forPartnership and Performance.
the best guarantor that their current employments have a bright future. Workercommitment to — even enthusiasm for — new practices can be elicited inresponse to leadership at the local level which is trusted because it has madetransparent what is to happen and why, and how fairness in sharing pain and gainis to be guarded. Workers and staff in many different workplaces have a collectiveinterest in embracing innovation, to strengthen their market position (privatesector), improve public confidence and support (public sector) and underpin moreautonomy and the options for a better work-life balance (both sectors). Theircollective interest is not always expressed as strongly as the interests of a few inresisting innovation.
7.6 Getting there: Priorities and Time Frame
This report has sought to provide outline thinking on the reach, nature andimplications of the social protection people living in Ireland over the comingdecades need and deserve. It has made clear that Ireland’s current welfare stateand social policies are currently advancing in several respects in the requireddirections. Indeed, the framework advanced in the report reflects, to an importantextent, the thinking and experience being acquired through the more successfuldevelopments. However, it is also evident that much remains to be done and thatsimultaneous, substantial and immediate advances on all fronts is a resource andorganisational impossibility. While intending this report as a discussion documentrather than a focussed study grounding detailed policy recommendations, theCouncil, nevertheless, proposes the following broad priorities and time frame foraccelerating and reinforcing the required transformation of Ireland’s welfare state.
7.6.1 Children
The Council is unhesitating in reaffirming its view that a poor start for any child isan ethical challenge and undermines Ireland’s economic and social aspirations (seeNESC, 2003: Section 8.7). Research in many disciplines continues to point to thebenefits for children, families, employers, communities, the Exchequer and societyat large of public support for high quality, integrated services for young children(e.g., Shonkoff and Phillips, 2000; DES, 2004). Yet it is clear that a great deal stillneeds to be done if all children in Ireland ‘are to enjoy a fulfilling childhood andrealise their potential’ (NCS, 2002) and the country become ‘the best place in theworld to be a child’ (Barnardo’s, 2005). The Council wholeheartedly endorses thislevel of ambition. It continues to be a major challenge, however, to move from theNational Children’s Strategy (2000) to a plan or plans that would be adequate toits vision and, more so, to the institutional developments that would ensure theywere implemented.
Quite specific challenges arise in addressing the challenge of better integratingchild-contingent income supports with the services and activist measures that aredirected at children.
214
Chapter 3 drew attention to the major emphasis that has been put on child-contingent income support (in effect, Child Benefit) in recent years and how thishas profoundly altered the way in which children in the poorest households aresupported (with almost 70 per cent of that now being accounted for by ChildBenefit as against less than 25 per cent in 1992). The appropriate level at which topay Child Benefit remains of critical importance to expressing society’s recognitionof children as a social good and willingness on the part of households withoutchildren to support those in which children are being reared.
The Council is committed to helping explore ways in which supplementary incomesupport could be provided on behalf of the poorest children in the state in moretargeted ways than through Child Benefit. It is aware that, despite the widespreadadoption of the term ‘children’s incomes’, it is the case that children do not haveincomes but rely on the level and internal allocation of the income of thehousehold in which they are being reared. Children do not experience disadvan-tage on their own but in the context of their family. Such evidence as is availableof the damaging effect on their development of low household incomes points toparental stress, inattention, depression and other unsatisfactory coping mechan-isms as the primary factors linking low household incomes to the impairment ofchildren’s development. The challenge of ensuring no children are reared in house-holds which place them below the at-risk-of-poverty income line is primarily achallenge to ensure the adequacy of their parents’ incomes.
However, there is telling evidence that — by the standards of other welfare states— the services on which children rely are particularly underdeveloped in Ireland’scurrent welfare state [Bradshaw and Finch, 2002; DES, 2004; OECD, 2003a]. Thisreport has referred several times to the pivotal significance of services on whichchildren rely and to the strategic economic and social value of ensuring readyaccess to them on the part of all children, particularly those in need. No childrenshould be denied access to services which they need because of their parent’sincome situation. As Figure 7.2 seeks to highlight, where services to very youngchildren are concerned, the range of benefits suggest they can be justified simul-taneously as (i) supporting the family and promoting gender equality, (ii)strengthening social cohesion and stemming social exclusion, and (iii) wideningparticipation in the labour market and raising productivity.
In considering the needs of young children (0-6 years) alone, the Council is struckby the range of evidence as to how and where the experience of childhood inIreland can be improved. This includes the significant proportion of low birth-weights and paucity of arrangements for tracking these infants, the relativelyshort duration of childbirth-related leave in Ireland compared to other countries,the large number of children being reared in households which mean they are in‘consistent poverty’ or ‘at-risk-of-poverty’, the exposure of some children tohousing and neighbourhood conditions that place them at physical risk (particu-larly Traveller children), the rationing of childcare places in these disadvantagedareas and the high cost of childcare elsewhere, the large degree of reliance oninformal childminding arrangements of uneven quality, the cost to parents onmodest incomes of accessing even basic medical services for their children, the
the developmental welfare state:a framework for reform 215
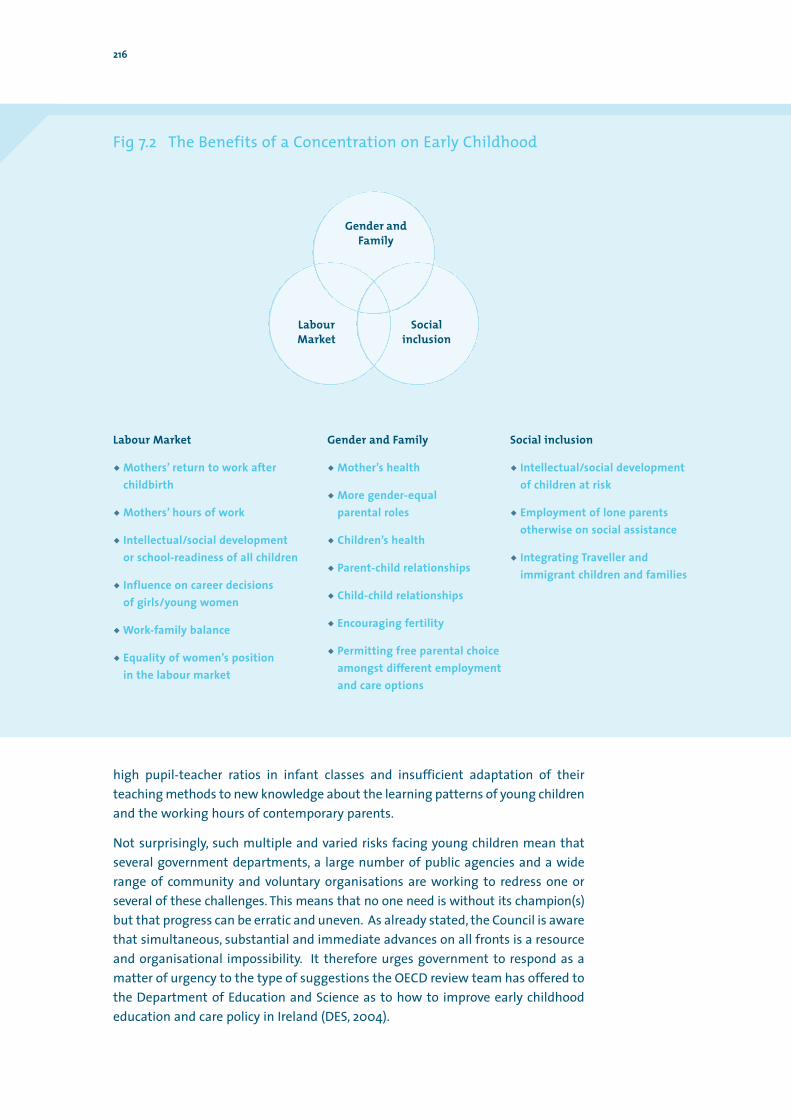
high pupil-teacher ratios in infant classes and insufficient adaptation of theirteaching methods to new knowledge about the learning patterns of young childrenand the working hours of contemporary parents.
Not surprisingly, such multiple and varied risks facing young children mean thatseveral government departments, a large number of public agencies and a widerange of community and voluntary organisations are working to redress one orseveral of these challenges. This means that no one need is without its champion(s)but that progress can be erratic and uneven. As already stated, the Council is awarethat simultaneous, substantial and immediate advances on all fronts is a resourceand organisational impossibility. It therefore urges government to respond as amatter of urgency to the type of suggestions the OECD review team has offered tothe Department of Education and Science as to how to improve early childhoodeducation and care policy in Ireland (DES, 2004).
216
Fig 7.2 The Benefits of a Concentration on Early Childhood
Labour Market
s Mothers’ return to work afterchildbirth
s Mothers’ hours of work
s Intellectual/social developmentor school-readiness of all children
s Influence on career decisions of girls/young women
s Work-family balance
s Equality of women’s position in the labour market
Gender and Family
s Mother’s health
s More gender-equal parental roles
s Children’s health
s Parent-child relationships
s Child-child relationships
s Encouraging fertility
s Permitting free parental choiceamongst different employmentand care options
Social inclusion
s Intellectual/social developmentof children at risk
s Employment of lone parentsotherwise on social assistance
s Integrating Traveller andimmigrant children and families
Gender andFamily
Socialinclusion
LabourMarket
In particular, the Council recommends:
i. Strengthening the coordination of departments, agencies and public resourcesin addressing the needs of 0-6 year old children;
ii. To this end, establishing a clear leadership role for one department for 0-3 year olds and of another for 4-6 year olds;
iii. Giving both departments joint responsibility for drawing up a National Plan forthe Development of Early Childhood Services;
iv. Devolving the implementation of this plan to integrated local agencies in awat that enhances the potential of the City and County Development Boards,the City and County Childcare Committees and the Family Centres supportedby the DSFA;
v. Planning for a significantly higher emphasis within departmental budgets onstrengthening childhood services;
vi. Ensuring the involvement of the expertise of the community and voluntarysector is an integral part of the National Plan and departmental budgeting;
vii. Enlisting the support of the corporate and business sectors in investing in thewell-being of children.
7.6.2 People of working age
As Ireland’s social model and ‘activities considered the norm’ in its society becomemore influenced by the population’s growing engagement with employment, therelative position of the large minority of its population of working-age who rely ona weekly social welfare payment is changing markedly. Minimally, some 20 percent of the 16-64 year old population is typically in this position. Though the ratesof their social welfare payments are regularly increased by more than the cost ofliving, their relative income position has been deteriorating as the earnings of theiremployed counterparts increase faster. Their relative position is changed in otherways also, however. The society in which they live is characterised by improvedlongevity and health, a higher general level of education and a stronger sense ofesteem for the individual and respect for her or his choices. While these do not inany way justify less generous support for people of working-age who need socialwelfare on a long-term basis, they enormously increase the importance of ensur-ing that how that support is given does not contribute to lowering people’s expec-tations of themselves or make it more difficult for them to set personal life goalsand pursue them.
As discussed in chapter 6, contingencies form the current basis to social welfarepayments to people of working age. These specify a set of situations in each ofwhich it is accepted that a person of working age is unable to secure an adequateincome from employment (lack of suitable employment offers, temporary orpermanent incapacity for work arising from an illness or disability, having soleresponsibility for rearing a child, being of an age that disadvantages a person inseeking employment or being retrained, etc.). This contingency-basis to social
the developmental welfare state:a framework for reform 217
welfare receipt by people of working age has significant strengths: they provide aclear-cut basis for paying most people when they need income support and arereasonably easily understood; most people who need a social welfare payment fitinto one of the established contingencies, most of the time; payments made ontheir basis are well targeted. The Council also notes, however, weaknesses whichwill become steadily more serious as Ireland’s economy and society develop.
As it is through a contingency that an individual becomes entitled to a socialwelfare income in the first place (e.g., being a lone parent, being permanentlyincapable of work because of an illness or disability, etc.), remaining covered bythat contingency becomes the basis of the person’s financial security. A perverseincentive is provided to people to remain attached to their qualifying condition(current family structure, medical status or length of time out of work) and toconcur with the social welfare code in seeing it as a fixed disadvantage (includingtheir age when they are in receipt of the pre-retirement allowance) which isrobbing them of their capacity for greater self-reliance. In society at large, how-ever, people’s adult lives are becoming increasingly characterised by multipletransitions — between jobs, between periods in and out of employment (for childrearing, study, career breaks, etc.), between family types, between periods in andout of the country, between places and types of residence. It contributes to furthermarginalising people in receipt of social welfare when transitions are made moredifficult for them rather than facilitated by how they receive their income support.
The contingencies currently identify sub-groups of people as entitled to similarlevels of support under similar terms and conditions when there are, in fact,significant differences within these sub-groups (lone parents, persons withdisabilities or an illness, etc.,) in the potential of individuals to develop a degree ofself-reliance. However, being accepted as meeting a prescribed contingency doesnot currently include any assessment of the individual’s capacity to benefit from— for example — personal development, counselling and social skills courses,participation in providing community services, vocational education or training,job search and interview skills. Neither do the payment arrangements entail anyautomatic or sequenced contact with interviews through which recipients arealerted to options and advised of personal strategies.
The Irish labour market is offering steadily more diverse employment options —more part-time work, causal employment, seasonal work, wider choice of hours,more sedentary and less physically demanding workstations, opportunities fortele-work (including from the home), etc. — while also maintaining a high level ofaggregate labour demand for a wide spectrum of skills. Groups not hithertoregarded as potential components of the workforce — e.g., secondary schoolstudents, women in the home, persons with disabilities — have been respondingto the new opportunities for tailored employments that suit their individualcircumstances. Contingencies based on establishing that a person is ‘unable towork’ risk, therefore, becoming increasingly anachronistic because they are basedon an outmoded concept of work as full-time and packaged in a standardised format.
Recognition of these weaknesses supports three strategic directions for the designof income support to people of working age. (i) The significance of the current‘contingencies’ should be downplayed in favour of regarding all people of workingage as basically equal but differing in their current positions and potential for
218
mobility on a spectrum that runs from being irreversibly and completelyundermined in their capacity for self-reliance to being proximately able to enteremployment and become self-reliant. (ii) A level of basic payment should bepursued that meets each individual’s need to live life with dignity in contemporaryIreland but realises that the basic rate of payment is a blunt instrument for helpingindividuals to surmount the specific barriers (particular medical expenses,mobility needs, costs of accommodation, accumulated debts, need for childcare,return to education, etc.) blocking their path to greater self-reliance and thatpersonally tailored packages featuring additional payments and access to servicesshould become the norm rather than the exception6. (iii) Both the basic paymentand the additional tailored package should be provided in ways which encouragethe partial and sporadic take-up of employment opportunities as well as entry intomore formal employment relationships.
Participation income
As a long-term goal, the Council envisages the eventual merging into the oneprogramme of the several contingency-based, social assistance payments whichcurrently provide welfare transfers to people of working-age. This could be termeda ‘participation income’ as the underlying purpose would be to ensure that eachpayment arrangement to people of working age acknowledges that meaningfulparticipation of some form is a legitimate expectation of people of working age(both their expectation of society and society’s expectation of them) and that, onlyin rare cases, should it be accepted that an individual does not have some capacityto develop a greater degree of self-reliance. The level of this payment should reflectthat all people alike need a similar money income to guarantee them access to thebasic necessities of life. Its precise level will continue to be difficult to determinein an objective manner and the Council welcomes the commitments in the RevisedAnti-Poverty Strategy and Programme for Government (2002) as the minimumjustified by the current circumstances.7 Ideally, however, the income supportarrangements governing people of working age over the coming years will also seethe erosion of differences in how people in the contingencies are treated, withrationalisation extending from the rates (already well advanced) to include similartreatment in individuals’ liabilities to tax, the earnings disregards they can avail of,their access to secondary benefits, the benefit withdrawal rates they face andthose other features which currently differentiate them.
Tailoring
Paradoxically, treating people of working age in receipt of social welfare moreequally will involve the personal tailoring of additional payments and entitlementsto services that address the specific barriers preventing people from realising theirpotential. Personally tailored packages of additional payments and service entitle-ments would reflect the fact that undoubted differences in people’s needs arise, notprimarily from the nature of their qualifying contingency as the current welfarecode implies, but from more individual sets of circumstances which require, andwould be more effectively addressed by, the tailored provision of services and
the developmental welfare state:a framework for reform 219
6. The features of some current programmes point in this direction: for example, the basic Supplementary Welfare Allowance adult ratecan be augmented by weekly supplements and once off special needs payments.
7. The lowest weekly social welfare payment is to reach c150 in 2002 terms by 2007.
income support. For example, where an individual of working age is preventedfrom realising their potential for participation by costs associated with respon-sibility for children, a health condition, disability, private rental accommodation orwhatever, these should be treated by the social welfare code in a way that isequitable to people with similar net incomes. The support available should not beconditional on employment status or sharply differentiated by contingencies.
Increasing the degree of tailoring permissible in Ireland’s social welfare codewould have major implications. Strengths in the current system should not be lost.Current payment arrangements, for example, are thoroughly centralised, deliveredas entitlements (the number of recipients is not allowed to affect the rate ofpayment — in this instance, at least, resources follow need) and the efficiency andeffectiveness of their administration command wide respect. There is an extent towhich these positive attributes of Ireland’s current arrangements for payingwelfare could be diluted by making tailored and, therefore, variable personalsupport packages more widespread features of Ireland’s welfare system. However,the Council considers that the downsides to the present system (the inability ofthe basic payments to address the real cost barriers facing many people, theincentives for people to remain in their contingencies, the long durations onwelfare, the lack of engagement with people who have the potential capacity toprogress to greater self-reliance, the differences in how people with similar netincomes are treated) require more resolute development in this direction.
Paying greater attention to individual circumstances and tailoring additionalsupports and service entitlements on that basis will have resource implicationsthat are difficult to estimate. On the one hand, significant administrative savingscan be anticipated when several programmes are successfully merged into onebringing such benefits as the similar treatment of earnings disregards and otherfeatures. On the other hand, the greater individual attention, wider engagementwith service providers and retention of a tapering level of in-work support to agreater number of people imply a net cost increase associated with the newapproach. There is already considerable relevant experience as personal assess-ments of need, access to advisors/facilitators and a generally active case manage-ment approach have developed in some of the employment supports currentlybeing provided to people in receipt of welfare. An overly static view of costingsshould be avoided, also. Dynamic savings associated with shorter life-time dura-tions on social assistance and stronger attachments to the workforce can be antici-pated but are particularly difficult to estimate. However, the Council recommendsexploring this strategic orientation not primarily to reduce demands on theExchequer but because it believes it is an orientation that will better serve manycurrent welfare recipients. The current contingency-based programmes do notembody sufficiently positive expectations of recipients or ensure access to theservices which would enable people to realise new ambitions.
Flexicurity and conditionality
The Council supports the deliberate development of an Irish form of Denmark’s‘flexicurity’. In this, against the backdrop of a successful economy in which inno-vation is welcomed and where company and sectoral re-structuring are facilitatedrather than blocked, generous rates of welfare payments in the short term are
220
combined with high quality employment services to support smooth and frequenttransitions between jobs. An alternative — which the Council does not support —is to rely on employment legislation to support one set of people in their currentjobs and welfare payments of long duration to support another set of people whoare long-term jobless. It believes that a concern to avoid the disincentive effects ofhigh replacement rates (for which there is little Irish evidence, see chapter 6) shouldnot inhibit exploring ways in which higher rates integrated with access to serviceswould do more to facilitate progression than minimally adequate welfare incomes.
The Council adverted in an earlier report to the challenge this poses to publicsector leadership and governance:
The payment of relatively high social welfare payments and the provision of prac-tical supports to enable recipients progress is a strategy for which the Councilwould like to see the full range of social actors in Ireland share responsibility inhelping to design and implement. The required evolution in designs and systemsmay require degrees of decentralisation and levels of participation by organi-sations closely involved with client groups which would be quite novel by Irishstandards. (NESC, 2003: 319).
The advocacy of a ‘participation income’ in this report incorporates the type ofconditionality which the Council finds acceptable and which earlier strategyreports variously termed ‘supportive conditionality’(1999) and ‘sensitive activation’(2003). This conditionality is not based on time limits or coercion but on theobligation and need for welfare recipients and public authorities alike to period-ically review the extent to which recipients’ best interests are being facilitated bythe arrangements governing their access to an income. The taking of employment,if coerced, seldom leads to a lasting job match or provides employers with thequality of employees they seek. What can be required of welfare recipients isparticipation in interviews where the range of public supports available to themare explored and they are offered every assistance to identify their personal goalsand seek the means to realise them.
7.6.3 Older people
Adopting a comprehensive plan
The challenge of ensuring that people in their retirement experience Irish societyas an attractive, supportive and secure place in which to live requires some form ofregular, authoritative and comprehensive review of the evolving needs of olderpeople and of the efficiency, effectiveness and responsiveness of the socialprotection extended to them through services and income supports of every type.The changing demography of the elderly in Ireland — their weight in thepopulation, their internal age distribution, their improving health status, theirliving arrangements, etc. — provoke challenges that are being acknowledged bymultiple government departments and public agencies. Significant progress isbeing made in extending to older people a set of services which enables them toenjoy a higher standard of living at any given income level. Housing and healthservice improvements are seeking to ensure that older people’s accommodationhas the features and back-up domiciliary care and supports, which enable them to
the developmental welfare state:a framework for reform 221
remain living in security and with the greatest degree of independence of whichthey are capable. A wider diversity of residential accommodation to suit the variedneeds of older people is beginning to develop. The concept of ‘personal carepackages’ is potentially powerful for bringing the different service providerstogether to tailor and align their supports to ensure key outcomes (security,participation, etc.) are attained with and for older people.8
The National Disability Strategy (NDS) could yet become a headline example insome respects as to how planning and provision for older people might bedeveloped. A Strategy for Older People would do well if it were to replicate, withthe due changes, the NDS’s ambitions to tailor attention to the individual, identifywhere and how service systems need to change, require sectoral plans of keygovernment departments, provide tailored statements to individuals of keyservices they will receive, and develop institutional arrangements around anequivalent to the National Disability Authority in order to ensure the implementa-tion and evaluation of a holistic strategy for older people9. The major provisionswhich the Health Service Executive and Local Authorities in particular must makefor Ireland’s growing and changing population of pensioners, in co-operation withthe community and voluntary sector, commercial interests and older people’sfamilies, would be better anticipated and come on stream more effectively if allrelevant actors were appropriately engaged in drawing up a National Plan forOlder People.
Ensuring adequate and sustainable incomes in retirement
Ensuring adequate and sustainable incomes in retirement for a much largerpopulation of older people, while not the only challenge of an ageing society, is thedominant one which the Developmental Welfare State must address in protectingolder people. The review of public spending on pensions above in earlier chapterspointed to adequacy as a major dimension to this challenge in Ireland. Thoughalleviating poverty in old age is a major objective of public policy, a growing propor-tion of the current population in retirement is at-risk-of-poverty (falling signifi-cantly below median income). While it is true that their relative living standardsare higher than measures of relative income alone capture, EU 15 data suggeststhat Ireland’s pensioners have particularly low money incomes in their nationalcontext. The adequacy of state social welfare pensions, however, cannot bedivorced from the sustainability of the arrangements for providing them. ThoughIreland’s favourable demographic position means it is a low spender on pensionsby EU 15 standards, its elderly dependency ratio (people over 65 as a proportion ofthe population of working age) is set to rise in a major way over the comingdecades. Policy, therefore, must improve the adequacy of pension cover withoutcompounding the problem of its sustainability. In this context, the Councilwelcomes and underlines the importance of the full review of Ireland’s pensionsystem being currently carried out by The Pensions Board.10
222
8. An example is the Choice Programme developed by the then North West Health Board. This holistic programme was developed afterstructured listening to the views of older people which challenged assumptions of frailty and dependence. It provides graduatedservices ranging from people receiving support in their own homes, to accessing day centres and day hospitals, with medicalsupports in their own homes, and, when they eventually need it, to moving to full-time residential care for respite periods orindefinite stays.
9. There would, presumably, not be the same controversy in defining 'old' as has emerged in defining 'disability'. Another criticism ofthe NDS, viz., that a comprehensive strategy is only as good as the volume of resources provided to implement it, applies, of course, toevery plan but an effective one is more likely to attract the level of resources required to produce the outcomes.
10. Required by the Pensions (Amendment) Act, 2002, the date for its completion was brought forward to mid-2005. For an outline of itsscope and main components, see www.pensionsboard.ie
There are, in fact, few grounds for believing there is particular complacency inIreland at the implications of population ageing for its welfare state and publicfinances. Nevertheless, the implications of growing longevity are difficult for mostof us to comprehend. Already, some 25 per cent of a man’s adult life and over 28per cent of a woman’s are being lived — on average — in retirement; should Irelandachieve the levels of life expectancy that pertain in Sweden (the current topperformer in the EU), this would become 26.4 per cent and 30 per cent respec-tively.11 These figures make clear the scale of provision that people at work need tomake, in one way or another, in anticipation of their retirement (assuming nochange in the balance between years spent at work and years spent in retirement).Expressed simply, major change is unavoidable if a larger population in retirement,living longer, are to have adequate incomes. At the extreme, the combination ofdelayed entry into the workforce as first education is prolonged, recourse to earlyretirement and increased life expectancy at age 65 has the potential to make thelevel of what people must save during their working years and/or pay in taxes tofund adequate pensions quite unsustainable.12
The Council believes that the protection of retired people’s incomes should bebased on as broad a front as possible and that developing the type of welfare stateoutlined in this report is integral to ensuring it. There are some key factors to enab-ling Irish society fund adequate pensions in a sustainable manner. In the firstplace, people of working age need to be as productive as possible and inemployment as steadily as possible. Secondly, the age at which people considertheir working life is over will have to respond to their increased life expectancy,improved health, and interest and capacity in working longer. In third place, pen-sion schemes will ideally have to incorporate some reward for people who chooseto defer receiving a payment because they wish to work longer; minimally,incentives to withdraw from the workforce early will have to be ended. Finally, inhow pensions are funded, the roles and respective merits of both pension incomefunded from current taxes (PAYG) and pension income funded from investedsavings (pre-funded) will have to respected and enhanced. Each are routes throughwhich a current generation sacrifices a degree if control over current resources inorder to ensure themselves an income in retirement. It is quite valid to anticipatethat some of this sacrifice will be made by channelling more tax revenue toimprove Ireland’s PAYG pensions and that some of will occur by people and thestate saving and investing more in pension funds.
The choice of the balance to be struck by the state between PAYG funding and pre-funding of pensions in meeting its pension obligations is beyond the scope of thisstudy to settle.
PAYG funding has low administrative costs, is particularly beneficial to low earnersand is easily understood. However, it can impact disproportionately on labour costs(as when PRSI is relied upon), bets heavily on the size and productivity of the futureworkforce and requires people to trust government in deciding the level at which
the developmental welfare state:a framework for reform 223
11. This is based on life expectancy at age 65 in the year 2002 and the assumption that people are adults at 18 and retire at 65. Morerigorous estimates would use the average age of exit from the labour force (usually lower than the official retirement age) and lifeexpectancy at that age; when this is done for the UK, the percent of adult male life spent in retirement in 2004 was 30.5 per cent, upfrom 18 per cent in 1950. UK pensions Commission (2005: 35).
12. If retirement ages remain as they are now, longevity alone is estimated to increase the cost of providing an average pension in theEU by 25 to 30 per cent over the period 2000-2050. Joint Report by the Commission and the Council on Adequate and SustainablePensions (2003).
they are taxed during their working life to support pensioners and what they willreceive as pensioners in turn during their retirement.
Pre-funding social welfare pensions offers the potential to transfer part of theburden of financing pensions from the earnings of future workers to the returnson capital. It brings the current generation to make an additional contribution toits own pensions (i.e., the 1 per cent of GNP going into the National Pension ReserveFund from tax revenue is additional to PRSI pension contributions); other thingsbeing equal, this will reduce the rise in taxes that future generations will pay. It isa form of provision for future pensions that impacts less on labour costs than PAYGas it is funded out of general tax revenue. However, financial markets are beingrelied upon with their uncertain returns, and the current generation is being askedto make a double contribution to their future pensions raising intergenerationalequity issues that are quite opaque.
A separate and related question, also deserving more detailed examination than ispossible in this study, is the appropriate level of state support to private occupa-tional and personal pensions. Through them a large and growing number of peoplein Ireland are relying on the pre-funding of their pensions. Their main advantagesare that they give people more say in the level of replacement income they have inretirement (because they are voluntary and allow different levels of contribution)and, in the case of occupational pensions, engage employers in making directcontributions. However, they easily reproduce or widen income inequality amongthe retired population, can lead to complex and opaque arrangements, have highadministrative costs and require people to trust financial markets and financialinstitutions.
In the final analysis, the balance to be struck between current tax revenue andinvestment income in funding pensions — though important — is secondary tothe deeper changes needed if society is to meet the challenge of ageing. This isbecause, whether a higher pension bill is funded from taxes or from investedsavings, some core economic facts remain the same. In the first place, the popula-tion in retirement uses its pension income, wherever it comes from, to lay claim toa share of the economy’s current output — only a productive economy can supportthis without inflation and a general reduction in living standards. In second place,the tax revenues generated by any given tax rates (significant where pensions arefunded on a PAYG basis), and the returns on pension funds invested (significantwhere pensions are pre-funded), alike depend on a healthy economy in which bothlabour and capital are put to their most productive use. In third place, both routes— PAYG and pre-funding — have major implications for the Exchequer; the firstincreases the bill for social welfare pensions and the second that for taxexpenditures.
In conclusion, there are several specific questions which can be raised as to howIreland’s pension arrangements might develop in the medium to long term andwhich deserve particular examination from the specialist bodies that monitorthem. These include:
224
s whether people should have the choice of postponing their retirement inexchange for a higher pension when they do retire;
s whether the contributory pension should include an earnings-related compo-nent which would reflect the value (and not just the number) of an individual’scontributions over her working life. Some other countries ensure (Singapore) orare proposing (USA) that their citizens have personal accounts within nationalinsurance funds over which individuals have some discretion as to how theirsavings are invested and used;
s whether Ireland should remain with an entirely voluntary approach to allpension provision above the flat-rate contributory pension or make somesecond tier pension cover mandatory. Experience with the take up of PRSAs willthrow important light on this issue;
s whether the contributory pension should be transformed into a citizen’spension based on residency (on the lines of Denmark and New Zealand) inrecognition of the large number of people in Ireland whose periods of employ-ment overseas (young workers in particular) or interruptions in employment(for study, caring and other purposes) will make the establishment of a satis-factory contributions record difficult;
s whether the right balance is being found as defined benefit schemes in whichbusinesses bear the risk are increasingly replaced by defined contributionschemes which transfer the risk to individuals.
The broad objective of this study means it is not the place to analyse these issuesin depth and clarify the options for developing Ireland’s pension arrangements inline with emerging needs and resources. It is in keeping with its outline of an over-arching architecture to Ireland’s welfare state to point out that, across the lifecycle, it is in retirement that income transfers have least or nil disincentive effectson recipients’ labour market participation. In other words, retired people living inpoverty can do almost nothing anymore to avoid poverty. In the light of theevidence that people in retirement in Ireland currently face a high risk of poverty,the Council endorses the high priority being given to increasing the rates of thecontributory and non-contributory pensions. Those dependent on the means-tested pension include many whose working lives were scarred by an era of highunemployment. Maintaining the non-contributory pension at a lower rate thanthe contributory pension could be revisited in the light of the hugely improvedcircumstances facing the current population of working age. They are unlikely tobe deterred from following a steady employment career or feel aggrieved if peoplenot in a position to have done so were to be given entitlement to a state pensionat a similar level. At the same time, the Council notes that the rate of payment ofthe old age contributory pension will remain the single greatest influence on theadequacy of pensioners’ incomes in Ireland.13 Increases in its rate would also havethe merit of alleviating pressure on occupational pension schemes in the signif-icant number of cases where the pensionable income on which their payments are
the developmental welfare state:a framework for reform 225
13. Even when the target of 70 per cent of people aged 30 or over in employment having a private occupational or personal pension isreached, a significant number will rely on the OACP for the greater proportion of their income in retirement.
based are calculated net of the OACP. Finally, introducing a lower ceiling to theamount of tax relief any one individual can claim in support of their privatepension could be one way to fund raising social welfare pensions and contribute tolessening income inequality among the retired population.
7.7 Towards a More Comprehensive Approach
Privileging the perspectives and experiences of the persons who need socialprotection (the ‘service user’, ‘citizen’, ‘client’, ‘customer’) requires that organisa-tions — public, private and non-profit — give much greater priority to finding waysof better integrating disparate delivery systems. Otherwise, the same persons canexperience them as fragmented and pulling them in different directions
A quite fundamental standpoint, therefore, from which to judge the adequacy andeffectiveness of overall social protection is to assess the risks and hazards whichthe individual person in Irish society faces and the supports available to them atdifferent stages in the life cycle. It provides a simple but comprehensive frameworkto ensure no population group is overlooked, and facilitates a more reasonedadjudication between competing priorities. The members of Irish society arechildren, adults of working age or aged 65 and over. At each stage, the hazards andrisks which confront the individual person have specific features and the individualhas characteristic capabilities and constraints in facing them. In addition, theCouncil believes it is useful to distinguish and give separate consideration topeople of working age who are radically challenged in their personal autonomy bya disability or long-standing health problem, and to distinguish — within the longperiod during which a person is reckoned to be of working age, — between youngadults (18-29) who must make several key transitions (into the labour market,independent living, parenthood) and, what we might term, ‘anchor’ adults (30-64)who typically bear a core set of responsibilities (mortgage, child rearing, eldercare,saving for retirement). This is illustrated in Figure 7.1.
226
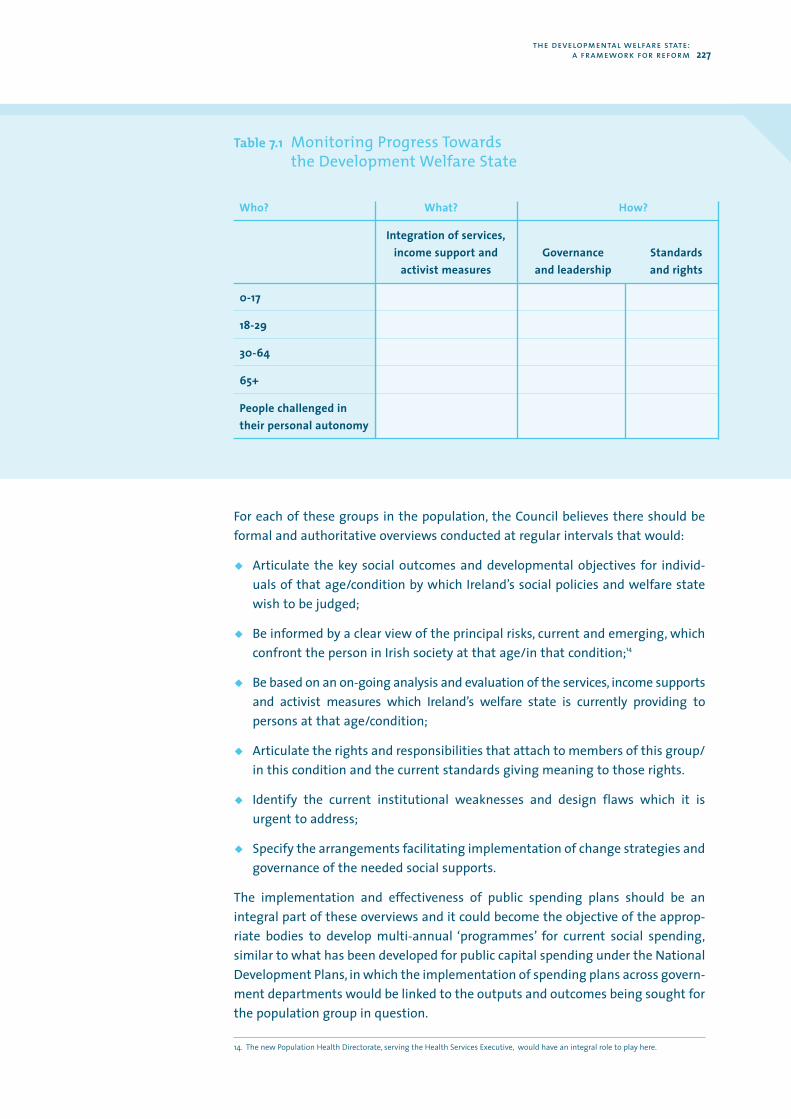
For each of these groups in the population, the Council believes there should beformal and authoritative overviews conducted at regular intervals that would:
s Articulate the key social outcomes and developmental objectives for individ-uals of that age/condition by which Ireland’s social policies and welfare statewish to be judged;
s Be informed by a clear view of the principal risks, current and emerging, whichconfront the person in Irish society at that age/in that condition;14
s Be based on an on-going analysis and evaluation of the services, income supportsand activist measures which Ireland’s welfare state is currently providing topersons at that age/condition;
s Articulate the rights and responsibilities that attach to members of this group/in this condition and the current standards giving meaning to those rights.
s Identify the current institutional weaknesses and design flaws which it isurgent to address;
s Specify the arrangements facilitating implementation of change strategies andgovernance of the needed social supports.
The implementation and effectiveness of public spending plans should be anintegral part of these overviews and it could become the objective of the approp-riate bodies to develop multi-annual ‘programmes’ for current social spending,similar to what has been developed for public capital spending under the NationalDevelopment Plans, in which the implementation of spending plans across govern-ment departments would be linked to the outputs and outcomes being sought forthe population group in question.
the developmental welfare state:a framework for reform 227
Table 7.1 Monitoring Progress Towards the Development Welfare State
Who? What? How?
Integration of services,income support and Governance Standards
activist measures and leadership and rights
0-17
18-29
30-64
65+
People challenged in their personal autonomy
14. The new Population Health Directorate, serving the Health Services Executive, would have an integral role to play here.
This is, effectively, what the National Children’s Strategy and National Children’sOffice are attempting for the 0-17 age group, what the National Disability Strategyand National Disability Authority are attempting for persons with disabilities, andwhat the National Anti-Poverty Strategy and National Office for Social Inclusionare attempting for people at risk of social exclusion. The Council believes that sig-nificant learning is possible from reflecting on the differences in the institutionalarrangements being relied upon to implement these different strategies. Theframework in Table 7.1 both helps to situate the huge significance of thesestrategies for Ireland’s hybrid welfare state and points to areas of relative underdevelopment. For example, changes in behaviour and life styles among youngadults (18-29) — their growing difficulty in accessing housing, postponement ofparenting, the impact on young males of less defined economic and social roles,the prolongation of education, different employment contracts, vulnerability torisky lifestyles, growing mobility, etc. — are, arguably, relatively poorly focussedand understudied in Ireland.15 In identifying, ‘anchor adults’ (30-64) as a singlegroup, the framework might also be taken as supporting the integration of what isbest in the Council of Europe’s focus on social cohesion and the European Commis-sion’s focus on social inclusion, thus reinforcing those elements in Ireland’sNational Action Plans against Poverty and Social Inclusion which address thetailoring of universal services rather than the creation of special ones.
7.8 A Successful Society
A successful economy requires a successful society, in a double sense. It is a moralrequirement because the population whose learning, work, entrepreneurship, flexi-bility, discipline and collaboration underpin on-going economic success deserves tolive in an attractive society characterised by fairness, inclusion, strong families, safecommunities and high standards of social protection. And it is a functional require-ment because a small economy will only remain agile and competitive in thisinternational age if it is supported by a society characterised by trust, low socialconflict, the retention of skilled workers, the embrace of life-long learning andwide participation in employment. The Developmental Welfare State (DWS), out-lined in this study, is the framework which the Council sees as necessary forproviding greater impetus, strategic direction and effectiveness in developing thesocial policies that will reflect and build a successful society in Ireland.
In the first place, it is a support and a reward for the people whose competencies,skills and work effort are the mainstay of the Irish economy. Ireland has had a longhistory of adapting to a chronic labour surplus, and to the selective labour marketand homogeneous society which resulted from it. It is being challenged now toreshape its welfare state to support a growing, more diverse and near fullyemployed population. The type of welfare state to which this study pointsspecifically embraces the challenge of facilitating and supporting the lifetimeattachment of people to the workforce — through the different transitions in andout of employment that mark their lives and across the spectrums of age, skill
228
15. E.g., Report of the High Level Group on the future of social policy in an Enlarged European Union (2004). DG for Employment andSocial Affairs; Proposals for a Dynamic and Solidary Society (2003). White Paper on the Welfare State. Italian Ministry of Labour andSocial Affairs.
levels and availability for employment that characterise those who seek it. The per-spective of the DWS is that satisfying employment, tailored to people’s capabilitiesand needs, is a social achievement as much as an economic one.
In second place, the Developmental Welfare State is confirmation and proof of thefinal eradication of all vestiges of the view that some groups in Irish society areredundant in building the economy and shaping social life. High emigration andunemployment and the highly homogeneous society of a previous Ireland provedto be a context in which personal traits such as being low skilled, an unmarriedmother, a child in institutional care, a member of the Traveller community, livingwith a disability, and much else, easily became the basis for low expectations — onthe part of society of those individuals and, often, internalised by the individualsthemselves — of the social and economic roles that the individuals should aspireto hold or be supported in preparing for. These low expectations were frequentlyembodied in the institutional arrangements that responded to these individualswhen they were in need. The new welfare state, by contrast, builds on tolerance, awelcome for diversity, a commitment to equality and respect for the individual.The Council believes these values are now espoused by contemporary Irish societywhich expects them to be embodied in its mainstream social policies. Part of theroute to the DWS lies precisely through identifying and revamping any arrange-ments for social protection that embody low expectations or assume unneces-sarily that some people’s social disadvantage is innate.
In third place, the developmental welfare state is a celebration of the fact thatsound economic performance is not an end in itself but valued because it providesa better framework for people to pursue fuller and more satisfying lives. This isparticularly apparent when it channels part of the higher level of resources thataccrue from economic and social success into increasing the quality and length oflife of people whose health, age, severity of disability or other circumstances renderunable to hold employment of any type. Irish society at large should take pridewhen its welfare state lifts the burden of caring for people in such circumstancesfrom their families and provides the health and caring services, the livingarrangements, social supports and — where necessary — institutionalisation thatallow people compromised in exercising their personal autonomy to live their liveswith dignity.
In fourth place, the developmental welfare state is the expression and institu-tionalisation of genuine and respectful interdependence between the severalpillars and multiple actors, among whom collaboration is indispensable if therequired high levels of social protection across Irish society are to be forthcoming.Ireland has traditionally had a welfare state that is highly reliant on non-publicbodies which government has learned to incentivise, guide and support in makingtheir contributions to public social goals. Historically, this arose because extremelylimited state resources made it impossible to develop satisfactory social protectionotherwise. In the Developmental Welfare State, a transformed and refined publicadministration is instrumental in enabling sets of actors to form networkedsystems through which the needed levels, quality, diversity and responsiveness ofservices are forthcoming. Space is deliberately created for social innovations — on
the developmental welfare state:a framework for reform 229

the part of public and private bodies — in order to ensure that the DevelopmentalWelfare State continues to change in line with the needs and potential of thepopulation it serves.
The Council is committed, through its own work programme and close workingrelationships with other bodies, to refining and implementing the objectives and principles for Ireland’s social policies and welfare state which are outlined inthis study.
230

the developmental welfare state:a framework for reform 231
232
Adema, W. (2001), Labour Marketand Social Policy — OccasionalPapers No. 52, Directorate forEducation, Employment, Labourand Social Affairs, OECD.
Amitsis, G., J. Berghman, A.Hemerijck, T. Sakellaropoulos, A.Stergiou and Y. Stevens (2003),Background Report: ConnectingWelfare Diversity within theEuropean Social Model, Interna-tional Conference of the HellenicPresidency of the European Union,21-22 May 2003.
Baldwin, R. and P. Krugman (2000),“Agglomeration, Integration andTax Harmonization”, CEPR Discus-sion Paper no. 2630, London: Centrefor Economic Policy Research.
Bennett, M., D. Fadden, D. Harney, P.O'Malley, C. Regan, L. Sloyan (2003),Population Ageing in Ireland and ItsImpact on Pension and HealthcareCosts. Report of Society ofActuaries Working Party onPopulation Studies. Society ofActuaries in Ireland.
Bird, E. (2001), “Does the welfarestate include risk-taking?” Journalof Public Economics, 80 (3).
Blackwell, J. (1988), A Review ofHousing Policy. NESC Report No. 87.
Blanchflower, D. (2000), “Self-employment in OECD countries”.Cambridge: NBER Working paper,no. 7486.
Blomqvist, P. (2004), “The ChoiceRevolution: Privatisation ofSwedish Welfare Services in the1990s”, Social Policy Administration.Vol. 38, No. 2, April.
Bradbury, B. and M. Jäntti (2001),“Child Poverty across theIndustrialised World: Evidencefrom the Luxembourg IncomeStudy”, in Vleminckx and Smeeding(eds.), Child Well-Being, ChildPoverty and Child Policy in ModernNations.
Bradshaw, J. and N. Finch (2002), AComparison of Child BenefitPackages in 22 Countries. A studycarried out on behalf of the DWP.University of York.
Callan,T., J. Walsh and K. Coleman(2004), “Budget 2005: Impact onDistribution and Relative IncomePoverty”, Quarterly EconomicQuarterly. Winter 2004. Dublin:ESRI.
Callan, T., R. Layte, A. van Soestand J. Walsh (2003), Taxes, Benefitsand Labour Market Responses:New Evidence for Ireland.Policy Research Series No. 48.Dublin: ESRI.
Callan, T., M. Keeney and J. Walsh(2002), “The Distributive Impact ofBudgetary Policy: A Medium-TermView”, in T. Callan, D. McCoy and D.Madden (eds.), Budget Perspectives.Dublin: ESRI.
Cameron, D. R. (1978), “TheExpansion of the Public Economy”,American Political Science Review,No. 72.
Council of Europe (2000), Strategyfor Social Cohesion. EuropeanCommittee for Social Cohesion andQuality of Life. Strasbourg.
Council of Europe (2004), RevisedStrategy for Social Cohesion.European Committee for SocialCohesion and Quality of Life.Strasbourg.
Council of the European Union(2003), Joint report by theCommission and the Council onadequate and sustainable pensions.7165/03.
Crouch, C. (2001), “Welfare StateRegimes and Industrial RelationsSystems: the Questionable Role ofPath Dependency Theory”, in B.Ebbinghaus and P. Manow (eds.),Comparing Welfare Capitalism:Social Policy and Political Economyin Europe, Japan and the US.London: Routledge.
CSO (2005), EU Survey on Incomeand Living Conditions (EU-SILC),First Results 2003. January. Dublin:Stationery Office.
CSO (2003), Measuring Ireland'sProgress. Dublin: Stationery Office.
De Grauwe, P. and M. Polan (2003),“Globalisation and SocialSpending”. CESifo Working PaperNo. 885.
Department of Education andScience (2005), Literacy andNumeracy in DisadvantagedSchools: Challenges for Teachers and Learners. An Evaluation by theInspectorate of the Department ofEducation and Science.
Department of Education andScience (2004), OECD ThematicReview of Early ChildhoodEducation and Care Policy inIreland. Dublin: Stationery Office.
Department of Finance (2004),Budgetary and Economic Statistics.Dublin: Stationery Office.
Department of Finance (2003),Evaluation of the Equal Opportuni-ties Childcare Programme 2000-2006. Dublin: Stationery Office.
Department of Health andChildren (2002), Acute Hospital BedCapacity. A National Review.Dublin: Stationery Office.
Department of Health andChildren (2001), Quality andFairness. A Health System for You.Dublin: Stationery Office.
Department of Health andChildren (1999), White Paper onPrivate Health Insurance. Dublin:Stationery Office
Department of Justice, Equalityand Law Reform (2004), NationalDisability Strategy, www.justice.ie.
Department of Social, Communityand Family Affairs (2003a), 2002Statistical Information on SocialWelfare Services. Dublin: StationeryOffice.
References
references 233
Department of Social, Communityand Family Affairs (2003b), Reportof the Working Group on theReview of the Illness and DisabilityPayment Schemes. Dublin:Stationery Office.
Department of Social, Communityand Family Affairs (2000), Reviewof the Qualifying Conditions for theOld Age (Contributory) andRetirement Pensions. Dublin:Stationery Office.
Dorf, M.C. and C. F. Sabel (1998),“A Constitution of DemocraticExperimentalism”, Columbia LawReview, March 1998.
Department of the Taoiseach(2005), Sustaining Progress. SocialPartnership Agreement 2003-2005.Seventh Progress Report.
Department of the Taoiseach(2003), Sustaining Progress. SocialPartnership Agreement 2003-2005.Dublin: Stationery Office.
Dréze, J. and E. Malinvaud (1994),“Growth and Employment: thescope for a European Initiative”,European Economy, no 1.
Economic and Social ResearchInstitute (2004), Report onPerinatal Statistics for 2000.Dublin: ESRI.
Educational Research Centre(2004), Analysis of schoolattendance data at primary andpost-primary levels for 2003/2004.Report to the National EducationalWelfare Board. Dublin: EducationalResearch Centre.
Eivers, E., G. Shiel and F. Shortt(2004), Reading Literacy inDisadvantaged Primary Schools.Dublin: Educational ResearchCentre.
Enterprise Strategy Group (2004),Ahead of the Curve: Ireland's Placein the Global Economy. Dublin:Forfás.
Esmail, N. and M. Walker (2004),How Good is Canadian HealthCare? 2004 Report. An InternationalComparison of Health Care Systems,The Fraser Institute.
Esping-Andersen, G. (1990) TheThree Worlds of Welfare Capitalism,Cambridge: Polity Press.
Esping-Andersen, G., D. Gallie, A.Hemerijck, and J. Myles (2002),Why we need a New Welfare State,Oxford: Oxford University Press.
European Commission (2002a),Social Protection in Europe 2001,Directorate-General forEmployment and Social Affairs.
European Commission (2002b),European Economy, 6.
European Commission (2001),European Governance — A WhitePaper.
European Commission (2001),Report on Indicators in the Field ofPoverty and Social Inclusion.October. Social ProtectionCommittee.
Eurostat (2004a), “Poverty andSocial Exclusion in the EU”,Statistics in Focus. Population andSocial Conditions. 16/2004.
Eurostat (2004b), Structures of theTaxation Systems in the EuropeanUnion, Data 1995-2002, 2004Edition.
Expert Working Group (1996),Integrating Tax and Social Welfare.Dublin: Government Publications.
FÁS (2003), The Irish Labour MarketReview/2002. Dublin: FÁS.
Ferrara, M., A. Hemerijck and M.Rhodes (2000) The Future of SocialEurope: Recasting Work and Welfarein the New Economy, Oeiras: CeltaEditora
Final Report of the ReferenceGroup on Welfare Reform (2000),Participation Support for a moreEquitable Society. Canberra:Commonwealth Department ofFamily and Community Services.
FISIM (2004), Developing a FullyInclusive Social Insurance Model.A review by Social Partners ofpointers to reform social insurancein a changing work and socialcontext. Dublin: DSFA.
Forum on the Workplace of theFuture (2005), Working to OurAdvantage. A National WorkplaceStrategy. National Centre forPartnership and Performance.
Fung, A. and E. O. Wright (2001),“Deepening Democracy:Innovations in EmpoweredParticipatory Governance”, Politicsand Society, vol. 29, No. 1, March2001, 5-41.
Fung, A. (2001), “AccountableAutonomy: Toward EmpoweredDeliberation in Chicago Schoolsand Policing”, Politics and Society,vol. 29, No.1, March 2001, 73-103.
Geve, B. (2004a), ed., NordicRegional Issue, Social PolicyAdministration, vol.38, no. 2.Blackwell Publishing.
Geve, B. (2004b), “Denmark:Universal or Not So UniversalWelfare State”, Social PolicyAdministration. Vol. 38, No. 2, April.
Goodin, R.E., B. Headey, R. Muffels& Henk-Jan Dirven (1999), The RealWorlds of Welfare Capitalism.Cambridge University Press.
Hanly, D. (chair), (2003), Report ofthe National Task Force on MedicalStaffing. Dublin: Stationery Office.
Healy, S. and B. Reynolds (2002),Choosing a Fairer Future — AnAgenda for Social Partnership afterthe Celtic Tiger. Dublin: CORI.
Healy S. and B. Reynolds, eds.(1998), Social Policy in Ireland:Principles, Practice and Problems.Dublin: CORI.
Hemerijck, A., and J. Visser (2001)Learning and Mimicking: HowEuropean Welfare States Reform,Manuscript: Leiden.
234
Henrekson, M. (2004), “The Effectson Sick Leave of Changes in theSickness Insurance System”, Journalof Labor Economics, Vol. 22, No. 1.
Hughes, G. (2003), “Taxation andEquity in Pension Provision”,Presentation at TASC and PensionsPolicy Research Group Seminar,Trinity College Dublin, May.
Kapstein, E. and B. Milanovic(2002), Income and Influence: SocialPolicy in Emerging MarketEconomies. The Upjohn Institute.
Kautto, M. (2002), “Investing inservices in West European welfarestates”, Journal of European SocialPolicy, Vol. 12 (1).
Kellaghan, T., P. McGee, D. Millarand R. Perkins (2004), Views of theIrish Public on Education: 2004Survey. Dublin: EducationalResearch Centre.
Kelly, G. and S. Muers (2002),Creating Public Value. An AnalyticalFramework for Public ServiceReform. UK Cabinet Office: StrategyUnit.
Lawlor, J. and C. McCarthy (2003),“Browsing Onwards: Irish PublicSpending in Perspective”, IrishBanking Review. Winter.
Liebman, J.S. and C. F. Sabel (2003),"The Federal No Child Left BehindAct and the Post-DesegregationCivil Rights Agenda", NorthCarolina Law Review, vol. 81, No. 4,May 2003.
Lindert, P. H. (2004), Growing PublicSocial Spending and EconomicGrowth since the EighteenthCentury, Cambridge UniversityPress.
Lundvall, B-A. (2002), Innovation,Growth and Social Cohesion. TheDanish Model. Cheltenham:Edward Elgar.
Madsen, P.K. (1999), Denmark:Flexibility, Security and LabourMarket Success. Employment andTraining Papers, No. 53, ILO: Geneva.
Madsen, P.K. (2002), “The DanishModel of 'Flexicurity' — a Paradisewith Some Snakes”, in Sarfati &Bonoli (eds.), Labour Market andSocial Protection Reforms inInternational Perspective: Parallel orConverging Tracks? Ashgate.
De Buitleir, D. and P. McArdle(2003), “Tax and Spend: A Look tothe Future with and Eye to thePast”, Kenmare EconomicsConference, October.
Morgan, M. (2000), School andPart-time Work in Dublin. TheFacts. Dublin Employment Pact.
Murphy, M. (2003), A Women’sModel for Social Welfare Reform,The National Women’s Council ofIreland.
National Anti-Poverty Strategy(2002), Building an InclusiveSociety: Review of the NationalAnti-Poverty Strategy under theProgramme for Prosperity andFairness, Dublin: Department ofSocial, Community and FamilyAffairs.
National Anti-Poverty Strategy(1997), Sharing in Progress. Dublin:Stationery Office.
National Children’s Strategy(2000), Our Children — Their Lives.Dublin: Stationery Office.
National Competitiveness Council,(2003), The CompetitivenessChallenge 2003. Dublin: Forfás.
National Economic and SocialCouncil (2002), Achieving QualityOutcomes: The Management ofPublic Expenditure, Report 109,Dublin: NESC
National Economic and SocialCouncil (2002), An Investment inQuality: Services, Inclusion andEnterprise, Overview, Conclusionsand Recommendations, Report 110.Dublin: NESC.
National Economic and SocialCouncil (2003), An Investment inQuality: Services, Inclusion andEnterprise, Report 111, Dublin: NESC
National Women’s Council ofIreland (2002), Valuing Care Work.
National Pensions Policy Initiative(1998), Securing Retirement Income.
National Women’s Council ofIreland (2002), Valuing Care Work.
O’Reardon, C. (2004), “ImprovingIrish Public Services”, Irish BankingReview. Summer.
OECD (2004d), Education at aGlance. OECD Indicators 2004,Paris: OECD.
OECD (2004c) Benefits and Wages.OECD Indicators. Paris: OECD.
OECD (2004b), OECD ThematicReview of Early ChildhoodEducation and Care Policy inIreland. Dublin: GovernmentPublications.
OECD (2004a), Completing theFoundation for Lifelong Learning.An OECD Survey of UpperSecondary Schools. Paris: OECD.
OECD (2003b), OECD EmploymentOutlook: Towards More and BetterJobs, Paris: OECD.
OECD (2003a), Babies and Bosses:Reconciling Work and Family LifeAustria, Ireland and Japan, Volume2, Paris: OECD.
OECD (2002), Society at a Glance.OECD Social Indicators. Edition 2002
OECD (2001), Innovations to LabourMarket Policies: the Australian Way.Paris: OECD.
Office for Social Inclusion (2004),National Action Plan againstPoverty and Social Exclusion 2003-2005. Dublin: Stationery Office.
Palier, B. (2002), Gouverner laSécurité Sociale: Les réformes dusystème français de protectionsociale depuis 1945, Paris: PressesUniversitaire de France.
Pierson, P. (ed.) (2001), The NewPolitics of the Welfare State,Oxford: Oxford University Press.
references 235
Rodrik, D. (1998), “Why do moreopen economies have biggergovernments”?, Journal of PoliticalEconomy, 106, October 1998.
Sabel, C.F. and R. O’Donnell (2000),“What To Do about WickedProblems after Whitehall (AndWhat Scotland May Just PossiblyAlready Be Doing)”, Paperpresented to the OECD Conferenceon Devolution and Globalization.Implications for Local Decision-makers. Glasgow, Scotland. 28/29February 2000
Saint-Paul, G. (1994), “Do laborMarket Rigidities fulfill DistributiveObjectives?”, IMF Staff Papers, vol.41, no. 4.
Salamon, L. M., et al (1999), GlobalCivil Society: Dimension of the Non-Profit Sector. Baltimore: JohnHopkins Institute for Policy Studies
Salamon, L. M., ed., (2002), TheTools of Government. A Guide tothe New Governance. OxfordUniversity Press.
Scharpf, F. W, and V.A. Schmidt(eds), (2000),Welfare and Work inthe Open Economy, Oxford: OxfordUniversity Press.
Seshamani, M. (2004), The Impactof Ageing on Health CareExpenditures. Impending crisis ormisguided concern? London: Officeof Health Economics.
Schonkoff, J.P. and D.A. Phillips(2000), From Neurons toNeighbourhoods. The Science ofEarly Childhood Development.Washington D.C.: NationalAcademy Press.
Schneider, R. (2003), “A new roadmap against unemployment:Reassessing the Jobs Strategy”,OECD Observer. September 25.
Sinn, H-W. (1996), “Social Insurance,incentives and risk taking”,International Tax and PublicFinance, 3.
Sinn, H-W. (1995), “A theory of thewelfare state”, ScandinavianJournal of Economics 97 (4).
Sinn, H-W. (2004), EU Enlargement,Migration and the NewConstitution. CESifo Working PaperNo.1367. December.
Struyven and Steurs (2003),The Competitive Market forEmployment Services in theNetherlands. OECD.DELSA/ELSA/WD/SEM (2003)13.
Timonen, V. (2003), Irish SocialExpenditure in a ComparativeInternational Context, Dublin:Institute of Public Administrationand Combat Poverty Agency.
Visser, J. and A. Hemerijck (1997), ADutch Miracle: Job Growth, WelfareReform and Corporatism in theNetherlands, Amsterdam:Amsterdam University Press.
Wilkinson, R. G. (1996), UnhealthySocieties. The Afflictions ofInequality. London and New York:Routledge.
Zeitlin, J. and D.M. Trubek (eds)(2003), Governing Work andWelfare in a New Economy,European and AmericanExperiments, Oxford: OxfordUniversity Press.
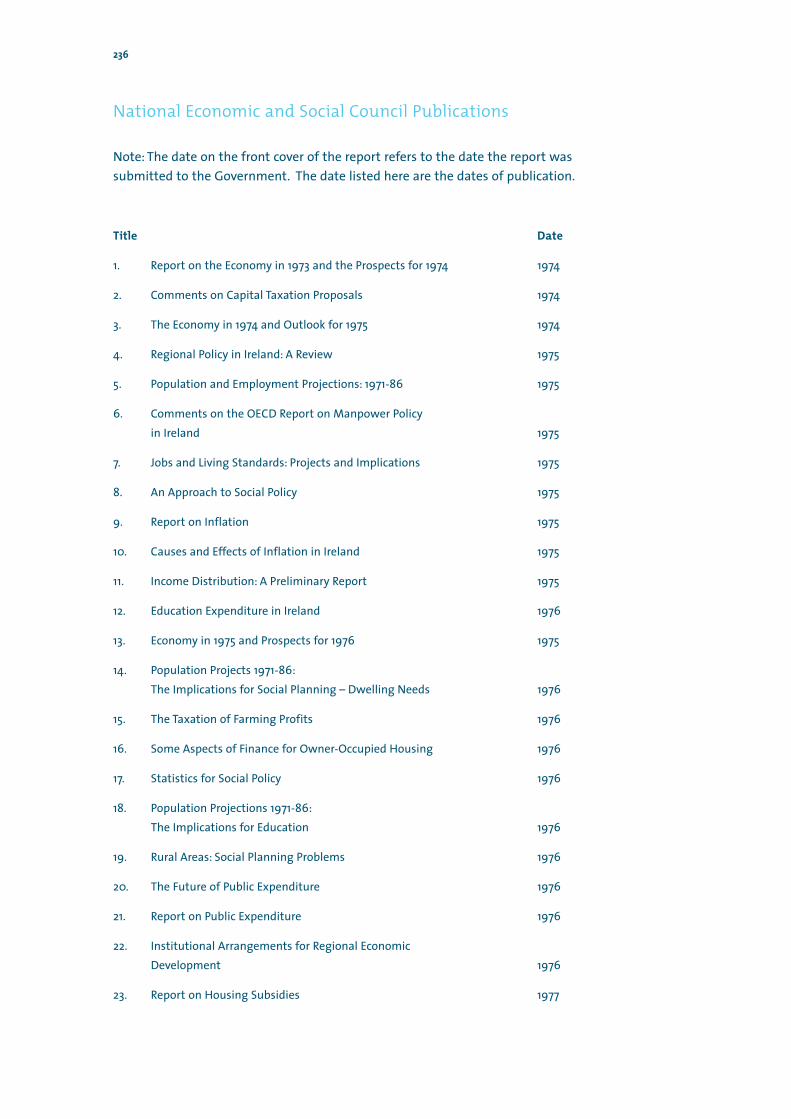
236
National Economic and Social Council Publications
Note: The date on the front cover of the report refers to the date the report wassubmitted to the Government. The date listed here are the dates of publication.
Title Date
1. Report on the Economy in 1973 and the Prospects for 1974 1974
2. Comments on Capital Taxation Proposals 1974
3. The Economy in 1974 and Outlook for 1975 1974
4. Regional Policy in Ireland: A Review 1975
5. Population and Employment Projections: 1971-86 1975
6. Comments on the OECD Report on Manpower Policy in Ireland 1975
7. Jobs and Living Standards: Projects and Implications 1975
8. An Approach to Social Policy 1975
9. Report on Inflation 1975
10. Causes and Effects of Inflation in Ireland 1975
11. Income Distribution: A Preliminary Report 1975
12. Education Expenditure in Ireland 1976
13. Economy in 1975 and Prospects for 1976 1975
14. Population Projects 1971-86:The Implications for Social Planning – Dwelling Needs 1976
15. The Taxation of Farming Profits 1976
16. Some Aspects of Finance for Owner-Occupied Housing 1976
17. Statistics for Social Policy 1976
18. Population Projections 1971-86:The Implications for Education 1976
19. Rural Areas: Social Planning Problems 1976
20. The Future of Public Expenditure 1976
21. Report on Public Expenditure 1976
22. Institutional Arrangements for Regional Economic Development 1976
23. Report on Housing Subsidies 1977
publications 237
24. A Comparative Study of Output, Value-Added and Growth in Irish and Dutch Agriculture 1976
25. Towards a Social Report 1977
26. Prelude to Planning 1976
27. New Farms Operators, 1971 to 1975 1977
28. Service-type Employment and Regional Development 1977
29. Some Major Issues in Health Policy 1977
30. Personal Incomes by County in 1973 1977
31. The Potential for Growth in Irish Tax Revenues 1977
32. The Work of NESC: 1974-1976 1977
33. Comments on Economic and Social Development,1976-1980 1977
34. Alternative Growth Rates in Irish Agriculture 1977
35. Population and Employment Projections 1986:A Reassessment 1977
36. University and Selectivity: Strategies in Social Policy 1978
37. Integrated Approaches to Personal Income Taxes and Transfers 1978
38. University and Selectivity: Social Services in Ireland 1978
39. The Work of the NESC: 1977 1978
40. Policies to Accelerate Agriculture Development 1978
41. Rural Areas: Change and Development 1978
42. Report on Policies for Agricultural and Rural Development 1978
43. Productivity and Management 1979
44. Comments on Development: Full Employment 1978
45. Urbanisation and Regional Development in Ireland 1979
46. Irish Forestry Policy 1979
47. Alternative Strategies for Family Income Support 1980
48. Transport Policy 1980
49. Enterprises in the Public Sector 1980
50. Major Issues in Planning Services for Mentally and Physically Handicapped Persons 1980
51. Personal Incomes by Region in 1977 1980
52. Tourism Policy 1980
53. Economic and Social Policy 1980-83:Aims and Recommendations 1980
54. The Future of the National Economic and Social Council 1981
55. Urbanisation: Problems of Growth and Decay in Dublin 1981
56. Industrial Policy and Development: A Survey of Literaturefrom the Early 1960s to the Present 1981
57. Industrial Employment and the Regions 1960-82 1981
58. The Socio-Economic Position of Ireland within the European Economic Community 1981
59. The Importance of Infrastructure to Industrial Development in Ireland – Roads, Telecommunications and Water Supply 1981
60. Minerals Policy 1981
61. Irish Social Policy: Priorities for Future Development 1981
62. Economic and Social Policy 1981 – Aims and Recommendations 1981
63. Population and Labour Force Projections by County and Region, 1979-1991 1982
64. A Review of Industrial Policy (A summary of this report is available separately) 1982
65. Farm Incomes 1982
66. Policies for Industrial Development:Conclusions and Recommendations 1982
67. An Analysis of Job Losses in Irish Manufacturing Industry 1983
68. Social Planning in Ireland:Its Purposes and Organisational Requirements 1983
69. Housing Requirements and Population Change,1981-1991 1983
70. Economic and Social Policy 1982:Aims and Recommendations 1983
71. Education: The Implications of Demographic Change 1984
72. Social Welfare: The Implications of Demographic Change 1984
73. Health Services: The Implications of Demographic Change 1984
74. Irish Energy Policy 1984
238
75. Economic and Social Policy 1983: Aims and RecommendationsA Review of the Implications of Recent Demographic ChangesFor Education, Social Welfare and the Health Services(Background Paper) 1984
76. The Role of Financing the Traded Sectors 1984
77. The Criminal Justice System: Policy and Performance 1985
78. Information for Policy 1985
79. Economic and Social Policy Assessment 1985
80. The Financing of Local Authorities 1985
81. Designation of Areas for Industrial Policy 1985
82. Manpower Policy in Ireland 1986
83. A Strategy for Development 1986-1990 (A Summary of this report is available separately) 1986
84. Community Care Service: An Overview 1987
85. Redistribution Through State Social Expenditure in the Republic of Ireland: 1973-1980 1988
86. The Nature and Functioning of Labour Markets 1988
87. A Review of Housing Policy 1989
88. Ireland in the European Community:Performance, Prospects and Strategy 1989
89. A Strategy for the Nineties:Economic Stability and Structural Change 1990
90. The Economic and Social Implications of Emigration 1991
91. Women’s Participation in the Irish Labour Market 1992
92. The Impact of Reform of the Common Agricultural Policy 1992
93. The Irish Economy in a Comparative Institutional Perspective 1993
94. The Association between Economic Growth and Employment 1993
95. Education and Training Policies for Economic and Social Development 1993
96. A Strategy for Competitiveness, Growth and Employment 1993
97. New Approaches to Rural Development 1995
98. Strategy into the 21st Century:Conclusions and Recommendations 1996
99. Strategy into the 21st Century 1996
publications 239
100. Networking for Competitive Advantage 1996
101. European Union: Integration and Enlargement 1997
102. Population Distribution and Economic Development:Trends and Policy Implications 1997
103. Private Sector Investment in Ireland 1998
104. Opportunities, Challenges and Capacities for Choice.Overview, Conclusion and Recommendations. 1999
105. Opportunities, Challenges and Capacities for Choice 1999
106. Review of the Poverty Proofing Process 2001
107. Benchmarking the Programme for Prosperity and Fairness 2002
108. National Progress Indicators 2002
109. Achieving Quality Outcomes:The Management of Public Expenditure 2002
110. An Investment in Quality:Services, Inclusion and Enterprise, Overview,Conclusions and Recommendations 2002
111. An Investment in Quality:Services, Inclusion and Enterprise 2003
112. Housing in Ireland:Performance and Policy 2004
NESC Research Series
RS
1. Clusters in IrelandThe Irish Dairy Processing Industry:An Application of Porter’s Cluster Analysis 1997
2. Clusters in IrelandThe Irish Popular Music Industry:An Application of Porter’s Cluster Analysis 1997
3. Clusters in IrelandThe Irish Indigenous Software Industry:An Application of Porter’s Cluster Analysis 1997
4. Profit Sharing Employee Share, Ownership and Gainsharing:What can they Achieve? 2000
Proceedings of NESC Seminar
Sustaining Competitive Advantage: Proceedings of NESC Seminar 1998
240