Embed Size (px)
Citation preview
MNRAS 438, 3093–3110 (2014) doi:10.1093/mnras/stt2421Advance Access publication 2014 January 14
The eccentric massive binary V380 Cyg: revised orbital elements andinterpretation of the intrinsic variability of the primary component�
A. Tkachenko,1†‡ P. Degroote,1§ C. Aerts,1,2 K. Pavlovski,3 J. Southworth,4
P. I. Papics,1 E. Moravveji,1 V. Kolbas,3 V. Tsymbal,5 J. Debosscher1 and K. Clemer1
1Instituut voor Sterrenkunde, KU Leuven, Celestijnenlaan 200D, B-3001 Leuven, Belgium2Department of Astrophysics, IMAPP, Radboud University Nijmegen, NL-6500 GL Nijmegen, the Netherlands3Department of Physics, University of Zagreb, Bijenicka cesta 32, 10000 Zagreb, Croatia4Astrophysics Group, Keele University, Staffordshire ST5 5BG, UK5Department of Astronomy, Tavrian National University, Simferopol, Ukraine
Accepted 2013 December 12. Received 2013 December 12; in original form 2013 October 27
ABSTRACTWe present a detailed analysis and interpretation of the high-mass binary V380 Cyg, basedon high-precision space photometry gathered with the Kepler space mission as well as high-resolution ground-based spectroscopy obtained with the HERMES spectrograph attached tothe 1.2 m Mercator telescope. We derive a precise orbital solution and the full physicalproperties of the system, including dynamical component mass estimates of 11.43 ± 0.19and 7.00 ± 0.14 M� for the primary and secondary, respectively. Our frequency analysisreveals the rotation frequency of the primary in both the photometric and spectroscopic dataand additional low-amplitude stochastic variability at low frequency in the space photometrywith characteristics that are compatible with recent theoretical predictions for gravity-modeoscillations excited either by the convective core or by sub-surface convective layers. Dopplerimaging analysis of the silicon lines of the primary suggests the presence of two high-contraststellar surface abundance spots which are located either at the same latitude or longitude.Comparison of the observed properties of the binary with present-day single-star evolutionarymodels shows that the latter are inadequate and lack a serious amount of near-core mixing.
Key words: binaries: eclipsing – stars: fundamental parameters – stars: individual:V380 Cyg – stars: oscillations – stars: variables: general.
1 IN T RO D U C T I O N
V380 Cyg (HR 7567, HD 187879, KIC 5385723) is a bright(V = 5.68) double-lined spectroscopic binary (SB2) consisting oftwo B-type stars residing in an eccentric 12.4 d orbit. The primary
� Based on the data gathered with NASA’s Discovery mission Kepler andwith the HERMES spectrograph, installed at the Mercator telescope, oper-ated on the island of La Palma by the Flemish Community, at the SpanishObservatorio del Roque de los Muchachos of the Instituto de Astrofısicade Canarias and supported by the Fund for Scientific Research of Flan-ders (FWO), Belgium, the Research Council of K. U. Leuven, Belgium,the Fonds National de la Recherche Scientific (F.R.S.–FNRS), Belgium, theRoyal Observatory of Belgium, the Observatoire de Geneve, Switzerlandand the Thuringer Landessternwarte Tautenburg, Germany.†E-mail: [email protected]‡ Postdoctoral Fellow of the Fund for Scientific Research (FWO), Flanders,Belgium.§ Postdoctoral Fellow of the Fund for Scientific Research (FWO), Flanders,Belgium.
component is an evolved star which is about to start its hydrogenshell burning phase, whereas the secondary, fainter component isa main-sequence star comparable in temperature. Most of the sys-tem’s brightness comes from the primary, with the secondary con-tributing about 6 per cent of the total flux. For this reason, the systemwas thought to be a single-lined spectroscopic binary for a long timeuntil Batten (1962) reported the detection of the secondary’s spectrallines on 22 newly obtained spectrograms. Although the double-linednature of the star was a subject of debate for another 20 years (seee.g. Popper 1981), Hill & Batten (1984) confirm that V380 Cyg isan SB2 star based on newly obtained high-dispersion spectroscopicdata. In addition to the orbital elements which differ insignificantlyfrom those derived by Batten (1962), the authors report on apsidalmotion of about 0.◦011 per period.
Since then, V380 Cyg was the subject of several more extensivestudies based on both ground-based spectroscopy and multicolourphotometry. Guinan et al. (2000, hereafter G2000) combined newlyobtained differential U, B, V photometry with the spectroscopicdata obtained by Popper & Guinan (1998) to refine the orbital so-lution and to determine precise physical properties of both binary
C© 2014 The AuthorsPublished by Oxford University Press on behalf of the Royal Astronomical Society
3094 A. Tkachenko et al.
components. The times of light minima were used to measure apsi-dal motion of the system which was found to be of 24◦ per 100 years(0.◦008 per period), slightly lower than but in reasonable agreementwith the value reported by Batten (1962).
Eclipsing binary stars are a prime source for testing evolutionarymodels, as their fundamental parameters like masses, radii, etc.can be derived to a very high precision. The proper solution of theconvective energy transport is one of the biggest issues of the currentevolutionary models. However, comparison of the observed stellarproperties with the theoretical predictions allows the deduction of animportant parameter such as the convective overshooting αov (thatstands for the stellar convective core overextension). For V380 Cyg,G2000 found that the position of the more massive primary onthe Hertzsprung–Russell (HR) diagram requires an extremely highvalue of αov of about 0.6 ± 0.1 to match the observed propertiesof the star with the theoretical models. This is actually the highestknown value of αov for B-type stars, whereas the typical value is ofthe order of 0.2 for single stars with similar masses (see e.g. Aertset al. 2003, 2011; Briquet et al. 2011). Assuming this typical valueof αov for the primary of V380 Cyg leads to inconsistency betweenthe mass deduced from the binary dynamics and the one obtainedfrom the evolutionary models. This inconsistency between the twomasses is usually called the mass discrepancy. It is worth notingthat the second highest value after V380 Cyg of αov ∼0.45 hasalso been found for the ∼8 M� primary component of a detachedbinary system (Briquet et al. 2007). Alternatively, the rate of theapsidal motion, depending on the internal mass distribution of astar, can be used to estimate the overshooting parameter αov. Thevalue obtained by G2000 in this way perfectly agrees with the onededuced from the position of the star in the HR diagram. On theother hand, Claret (2007) found that the apsidal motion rate of theV380 Cyg is compatible with αov = 0.4+0.2
−0.3.Pavlovski et al. (2009, hereafter P2009) collected about 150 high-
resolution echelle spectra using several telescopes and performed adetailed spectroscopic study of the system with the aim to determinethe precise orbital solution as well as the physical parameters ofboth stellar components. The authors also revisited the U, B, V lightcurves obtained by G2000 and analysed the data using a modifiedversion of the Wilson–Devinney (WD) code (Wilson & Devinney1971; Wilson 1979, 1993). The spectral disentangling (SPD) tech-nique applied by P2009 to their spectra, besides providing pre-cise orbital elements, revealed a faint secondary component in thecomposite spectra and provided high-quality disentangled spectrafor both stars. The spectra were further analysed to determine thefundamental parameters as well as to do the abundance analysisfor the primary. We refer to Table 1 for an intercomparison be-tween the physical parameters of the stars derived by G2000 andP2009.
Similar to G2000, P2009 found that the position of the moremassive primary in the HR diagram does not match the theoreticalpredictions for a single star of a similar mass. The authors finda mass discrepancy of about 1.5 M� for the primary componentof V380 Cyg. Though this is much less than what was found forV380 Cyg by, e.g., Lyubimkov et al. (1996) who reported a massdiscrepancy of 3.4 and 1.1 M� for the primary and the secondary,respectively, the value is still significant. The mass discrepancyproblem observed in massive O- and B-type stars has been knownfor more than 20 years already and has been discussed in detail byHerrero et al. (1992). Hilditch (2004) pointed out that the discrep-ancy does not disappear when the effects of rotation are includedinto the models; P2009 came to the same conclusion concerning theprimary of V380 Cyg.
It is thus important to have an independent estimate of the coreovershooting parameter αov for this type of stars, and this is providedby the asteroseismic methods. In Tkachenko et al. (2012, hereafterPaper I), we presented results of the preliminary analysis of ourdata consisting of high-quality Kepler space photometry and high-resolution, ground-based spectroscopy. We confirmed the double-lined nature of the binary and presented precise orbital elements,in general agreement with the two previous findings by G2000and P2009. Both photometric and spectroscopic data revealed thepresence of variability intrinsic to the primary component, whichwe interpreted in terms of stochastically excited gravity (g-) modeoscillations. Moreover, both data sets showed that at least part ofthis variability occurs at (higher) harmonics of the orbital frequencysuggesting a tidal nature for the pulsations.
In this paper, we present a solid interpretation of our full dataset that consists of the data presented in Paper I and additional fourquarters of Kepler data and some 50 high-dispersion, high signal-to-noise ratio (S/N) spectra. The data themselves as well as thedata reduction procedure are described in Section 2. Photometricanalysis of the system is presented in Section 3 while Section 4 isdevoted to the analysis of our spectra. Discussion and conclusionsare presented in Section 5.
2 O B S E RVAT I O N S A N D DATA R E D U C T I O N
The photometric analysis of the V380 Cyg system presented in thispaper is based on the high-quality Kepler space data. The data arereleased in quarters (periods of time between the two consecutivespacecraft rolls needed to keep the solar shutters pointing towardsthe Sun); each quarter comprises about three months of nearly con-tinuous observations. The telescope operates in two different modes,long and short cadence (LC and SC, respectively), which differ fromeach other by the time of integration which is 29.42 min for the LCand 58.85 s for the SC data. The exposure time is the same in bothmodes and equals 6.54 s (0.52 s of readout included). Thus, the twomodes basically differ by the time resolution where the LC inte-grates over 270 single exposures whereas one data point in the SCmode contains nine exposures. For V380 Cyg, we use all availableKepler data, i.e. Q7, Q9–Q10 and Q12–Q14, which gives a timespan of ∼560 d.
Because of the extreme brightness of the system (V = 5.68), adedicated customized aperture mask was defined to collect the fluxfrom the star. This is fully justified given that Kepler has proved al-ready that it can provide high-precision photometry even for highlysaturated targets (see, e.g., Bryson et al. 2010; Kolenberg et al. 2011;Paper I).
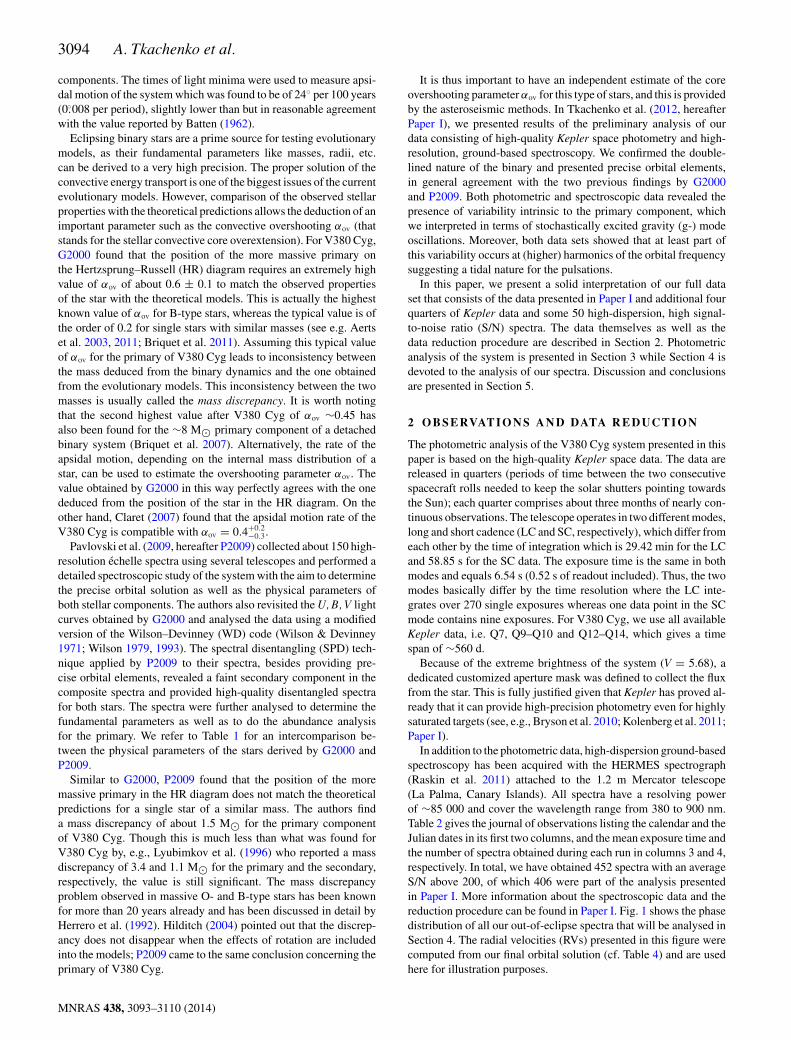
In addition to the photometric data, high-dispersion ground-basedspectroscopy has been acquired with the HERMES spectrograph(Raskin et al. 2011) attached to the 1.2 m Mercator telescope(La Palma, Canary Islands). All spectra have a resolving powerof ∼85 000 and cover the wavelength range from 380 to 900 nm.Table 2 gives the journal of observations listing the calendar and theJulian dates in its first two columns, and the mean exposure time andthe number of spectra obtained during each run in columns 3 and 4,respectively. In total, we have obtained 452 spectra with an averageS/N above 200, of which 406 were part of the analysis presentedin Paper I. More information about the spectroscopic data and thereduction procedure can be found in Paper I. Fig. 1 shows the phasedistribution of all our out-of-eclipse spectra that will be analysed inSection 4. The radial velocities (RVs) presented in this figure werecomputed from our final orbital solution (cf. Table 4) and are usedhere for illustration purposes.
MNRAS 438, 3093–3110 (2014)
A detailed analysis of the V380 Cyg system 3095
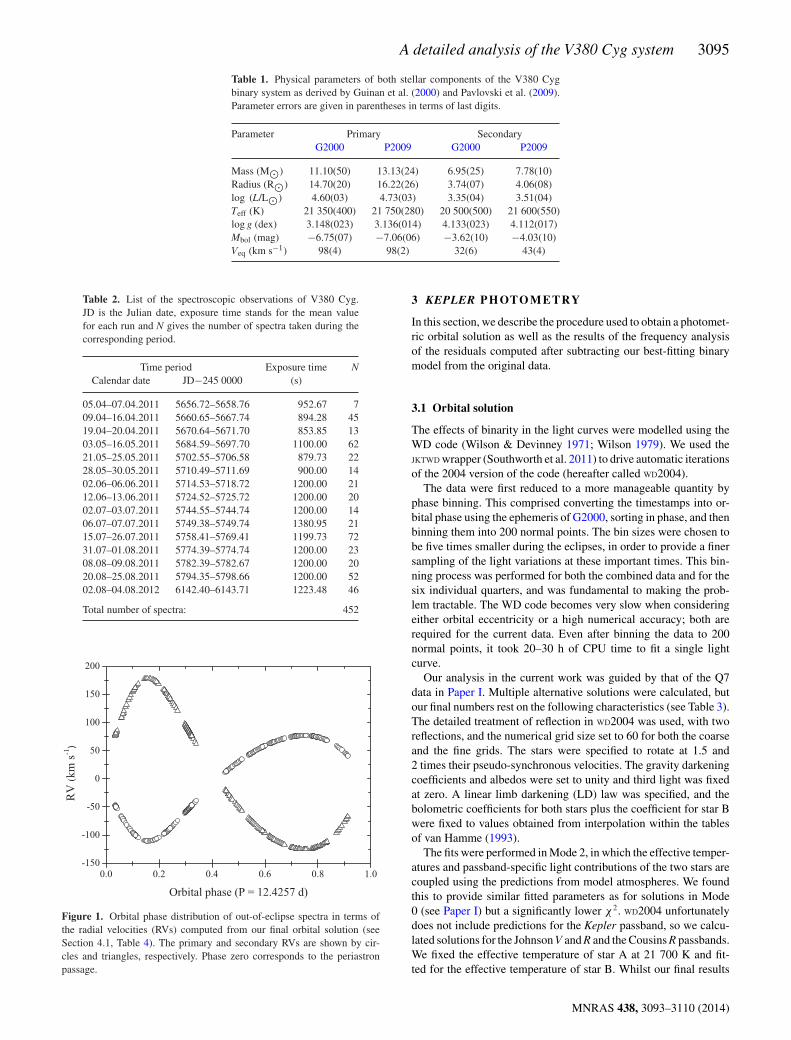
Table 1. Physical parameters of both stellar components of the V380 Cygbinary system as derived by Guinan et al. (2000) and Pavlovski et al. (2009).Parameter errors are given in parentheses in terms of last digits.
Parameter Primary SecondaryG2000 P2009 G2000 P2009
Mass (M�) 11.10(50) 13.13(24) 6.95(25) 7.78(10)Radius (R�) 14.70(20) 16.22(26) 3.74(07) 4.06(08)log (L/L�) 4.60(03) 4.73(03) 3.35(04) 3.51(04)Teff (K) 21 350(400) 21 750(280) 20 500(500) 21 600(550)log g (dex) 3.148(023) 3.136(014) 4.133(023) 4.112(017)Mbol (mag) −6.75(07) −7.06(06) −3.62(10) −4.03(10)Veq (km s−1) 98(4) 98(2) 32(6) 43(4)
Table 2. List of the spectroscopic observations of V380 Cyg.JD is the Julian date, exposure time stands for the mean valuefor each run and N gives the number of spectra taken during thecorresponding period.
Time period Exposure time NCalendar date JD−245 0000 (s)
05.04–07.04.2011 5656.72–5658.76 952.67 709.04–16.04.2011 5660.65–5667.74 894.28 4519.04–20.04.2011 5670.64–5671.70 853.85 1303.05–16.05.2011 5684.59–5697.70 1100.00 6221.05–25.05.2011 5702.55–5706.58 879.73 2228.05–30.05.2011 5710.49–5711.69 900.00 1402.06–06.06.2011 5714.53–5718.72 1200.00 2112.06–13.06.2011 5724.52–5725.72 1200.00 2002.07–03.07.2011 5744.55–5744.74 1200.00 1406.07–07.07.2011 5749.38–5749.74 1380.95 2115.07–26.07.2011 5758.41–5769.41 1199.73 7231.07–01.08.2011 5774.39–5774.74 1200.00 2308.08–09.08.2011 5782.39–5782.67 1200.00 2020.08–25.08.2011 5794.35–5798.66 1200.00 5202.08–04.08.2012 6142.40–6143.71 1223.48 46
Total number of spectra: 452
Figure 1. Orbital phase distribution of out-of-eclipse spectra in terms ofthe radial velocities (RVs) computed from our final orbital solution (seeSection 4.1, Table 4). The primary and secondary RVs are shown by cir-cles and triangles, respectively. Phase zero corresponds to the periastronpassage.
3 KEPLER P H OTO M E T RY
In this section, we describe the procedure used to obtain a photomet-ric orbital solution as well as the results of the frequency analysisof the residuals computed after subtracting our best-fitting binarymodel from the original data.
3.1 Orbital solution
The effects of binarity in the light curves were modelled using theWD code (Wilson & Devinney 1971; Wilson 1979). We used theJKTWD wrapper (Southworth et al. 2011) to drive automatic iterationsof the 2004 version of the code (hereafter called WD2004).
The data were first reduced to a more manageable quantity byphase binning. This comprised converting the timestamps into or-bital phase using the ephemeris of G2000, sorting in phase, and thenbinning them into 200 normal points. The bin sizes were chosen tobe five times smaller during the eclipses, in order to provide a finersampling of the light variations at these important times. This bin-ning process was performed for both the combined data and for thesix individual quarters, and was fundamental to making the prob-lem tractable. The WD code becomes very slow when consideringeither orbital eccentricity or a high numerical accuracy; both arerequired for the current data. Even after binning the data to 200normal points, it took 20–30 h of CPU time to fit a single lightcurve.
Our analysis in the current work was guided by that of the Q7data in Paper I. Multiple alternative solutions were calculated, butour final numbers rest on the following characteristics (see Table 3).The detailed treatment of reflection in WD2004 was used, with tworeflections, and the numerical grid size set to 60 for both the coarseand the fine grids. The stars were specified to rotate at 1.5 and2 times their pseudo-synchronous velocities. The gravity darkeningcoefficients and albedos were set to unity and third light was fixedat zero. A linear limb darkening (LD) law was specified, and thebolometric coefficients for both stars plus the coefficient for star Bwere fixed to values obtained from interpolation within the tablesof van Hamme (1993).
The fits were performed in Mode 2, in which the effective temper-atures and passband-specific light contributions of the two stars arecoupled using the predictions from model atmospheres. We foundthis to provide similar fitted parameters as for solutions in Mode0 (see Paper I) but a significantly lower χ2. WD2004 unfortunatelydoes not include predictions for the Kepler passband, so we calcu-lated solutions for the Johnson V and R and the Cousins R passbands.We fixed the effective temperature of star A at 21 700 K and fit-ted for the effective temperature of star B. Whilst our final results
MNRAS 438, 3093–3110 (2014)
3096 A. Tkachenko et al.
Table 3. Summary of the parameters for the WD2004 solution of theKepler SC light curve of V380 Cyg. For further details on the controlparameters, please see the WD2004 user guide (Wilson & Van Hamme2004). A and B refer to the primary and secondary stars, respectively.The uncertainties on the photometric parameters come from the scatterof appropriate solutions with different sets of fitted parameters, and aremuch greater than the formal errors of the best single solution.
Parameter WD2004 name Value ± error
Control and fixed parameters:WD2004 operation mode MODE 2Treatment of reflection MREF 2 (detailed)Number of reflections NREF 2Limb darkening law LD 1 (linear)Numerical grid size (normal) N1, N2 60Numerical grid size (coarse) N1L, N2L 60
Fixed parameters:Orbital period (d) PERIOD 12.425 719Primary eclipse time (HJD) HJD0 244 1256.544Mass ratio RM 0.6129Teff star A (K) TAVH 21 700Rotation rates F1, F2 1.5, 2.0Gravity darkening GR1, GR2 1.0Bolometric albedos ALB1, ALB2 1.0Bolometric LD coeff. A XBOL1 0.645Bolometric LD coeff. B XBOL2 0.681Third light EL3 0.0Passband LD coeff. B X2 0.224Orbital eccentricity E 0.2224
Fitted parameters:Phase shift PSHIFT −0.0502 ± 0.0003Star A potential PHSV 4.676 ± 0.020Star B potential PHSV 11.06 ± 0.11Orbital inclination (◦) XINCL 80.76 ± 0.24Longitude of periastron (◦) PERR0 138.4 ± 0.39Teff star B (K) TAVC 23840 ± 500Light from star A HLUM 12.045 ± 0.006Passband LD coeff. A X2 0.137 ± 0.064
Derived parameters:Light from star B CLUM 0.750 ± 0.012Fractional radius of star A 0.2633 ± 0.0015Fractional radius of star B 0.064 03 ± 0.000 72
Physical properties:Mass of star A (M�) 11.43 ± 0.19Mass of star B (M�) 7.00 ± 0.14Radius of star A (R�) 15.71 ± 0.13Radius of star B (R�) 3.819 ± 0.048Surface gravity star A (log g) 3.104 ± 0.006Surface gravity star B (log g) 4.120 ± 0.011Orbital semimajor axis (R�) 59.65 ± 0.35log(Luminosity A/L�) 4.691 ± 0.041log(Luminosity B/L�) 3.626 ± 0.038Mbol star A (mag) −6.98 ± 0.10Mbol star B (mag) −4.31 ± 0.10Distance (pc) 970 ± 21
yield an uncertainty of roughly 500 K on the effective temperatureof star B, the choice of different passbands moves the best-fittingvalue around by no more than 60 K. We therefore used the CousinsR passband in our final solutions, and added an extra ± 100 K onto the uncertainties of the effective temperature of star B.
Our exploratory fits revealed that the light curve yields poorerconstraints on the orbital shape (e and ω) than expected. The quan-tities e and ω are strongly correlated, a common situation when
studying eclipsing binaries, making it possible to match the lightcurve for 0.20 < e < 0.24. The time difference between adjacent pri-mary and secondary eclipses puts an excellent constraint on ecos ω,making this quantity well determined, whereas spectroscopy yieldsthe quantity e sin ω to a good precision. Without the ability to fitdirectly for these quantities in either WD2004 or in SPD, we insteadconstrained the orbital shape by iterating between the two analyses.We used the light curve to find the best ω for a given e, and thedisentangling to find the best e for a given ω. This procedure con-verged quickly to a solution which well satisfied both types of data,and the final solutions for the light-curve analysis were performedwith e fixed at 0.2224.
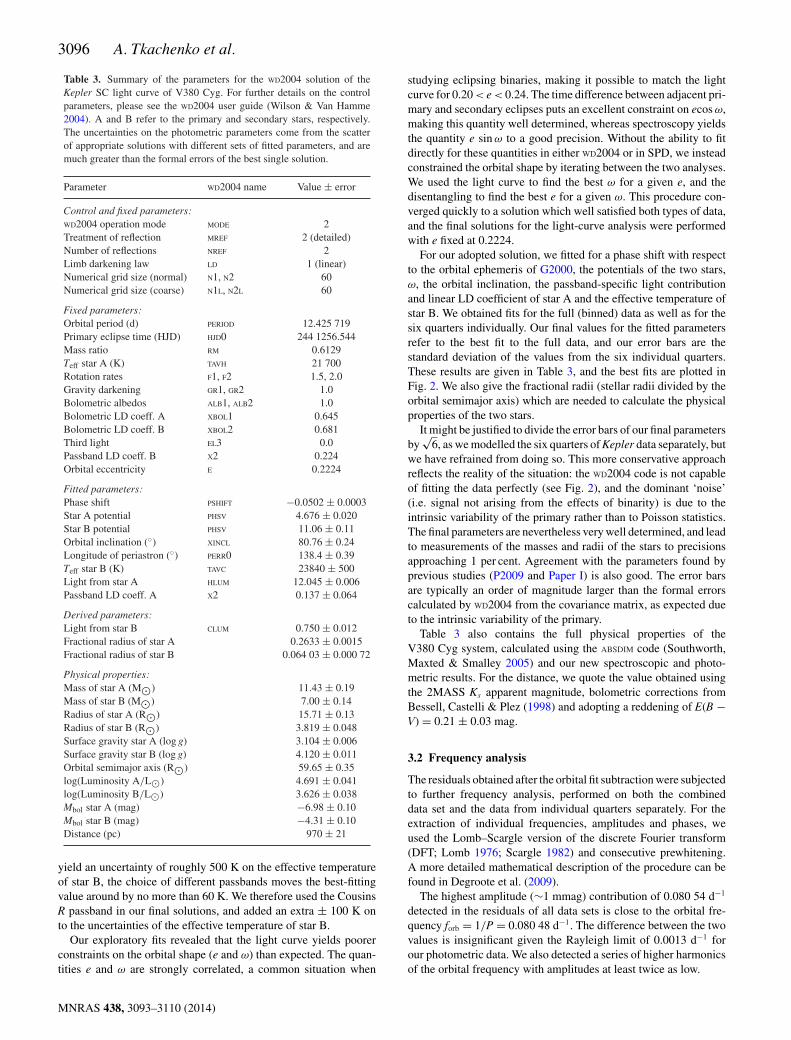
For our adopted solution, we fitted for a phase shift with respectto the orbital ephemeris of G2000, the potentials of the two stars,ω, the orbital inclination, the passband-specific light contributionand linear LD coefficient of star A and the effective temperature ofstar B. We obtained fits for the full (binned) data as well as for thesix quarters individually. Our final values for the fitted parametersrefer to the best fit to the full data, and our error bars are thestandard deviation of the values from the six individual quarters.These results are given in Table 3, and the best fits are plotted inFig. 2. We also give the fractional radii (stellar radii divided by theorbital semimajor axis) which are needed to calculate the physicalproperties of the two stars.
It might be justified to divide the error bars of our final parametersby
√6, as we modelled the six quarters of Kepler data separately, but
we have refrained from doing so. This more conservative approachreflects the reality of the situation: the WD2004 code is not capableof fitting the data perfectly (see Fig. 2), and the dominant ‘noise’(i.e. signal not arising from the effects of binarity) is due to theintrinsic variability of the primary rather than to Poisson statistics.The final parameters are nevertheless very well determined, and leadto measurements of the masses and radii of the stars to precisionsapproaching 1 per cent. Agreement with the parameters found byprevious studies (P2009 and Paper I) is also good. The error barsare typically an order of magnitude larger than the formal errorscalculated by WD2004 from the covariance matrix, as expected dueto the intrinsic variability of the primary.
Table 3 also contains the full physical properties of theV380 Cyg system, calculated using the ABSDIM code (Southworth,Maxted & Smalley 2005) and our new spectroscopic and photo-metric results. For the distance, we quote the value obtained usingthe 2MASS Ks apparent magnitude, bolometric corrections fromBessell, Castelli & Plez (1998) and adopting a reddening of E(B −V) = 0.21 ± 0.03 mag.
3.2 Frequency analysis
The residuals obtained after the orbital fit subtraction were subjectedto further frequency analysis, performed on both the combineddata set and the data from individual quarters separately. For theextraction of individual frequencies, amplitudes and phases, weused the Lomb–Scargle version of the discrete Fourier transform(DFT; Lomb 1976; Scargle 1982) and consecutive prewhitening.A more detailed mathematical description of the procedure can befound in Degroote et al. (2009).
The highest amplitude (∼1 mmag) contribution of 0.080 54 d−1
detected in the residuals of all data sets is close to the orbital fre-quency forb = 1/P = 0.080 48 d−1. The difference between the twovalues is insignificant given the Rayleigh limit of 0.0013 d−1 forour photometric data. We also detected a series of higher harmonicsof the orbital frequency with amplitudes at least twice as low.
MNRAS 438, 3093–3110 (2014)
A detailed analysis of the V380 Cyg system 3097
Figure 2. Best fits of the Kepler satellite light curves of V380 Cyg using WD2004. The binned data are shown in the upper part of the plot and the residuals ofthe fits in the lower part of the plot. The fits are shown for the combined data and for individual quarters.
The second dominant frequency in the combined data set wasfound to be of 0.129 46 d−1 (1.4978 µHz). The analysis performedon the data from individual quarters showed that this peak is vari-able in time, both in frequency and amplitude. We also detected thesecond harmonic at 0.258 79 d−1 (2.9942 µHz) of this frequency,and together with the orbital frequency, these are the three domi-nant peaks in the combined data set (left part of Table 8, labelled‘Photometry’). From the determined radius, inclination angle andprojected rotational velocity of the primary (cf. Table 3 and Sec-tion 4.2), we estimate the true rotation frequency of the star to be∼0.1250 d−1 (1.4463 µHz). This value is slightly different from0.129 46 d−1 (1.4978 µHz) deduced from the observed light varia-tions, which is not unexpected given that the former value representsthe rotational frequency averaged over the stellar interior. We thusspeculate that the frequency of 0.129 46 d−1 is associated with therotationally modulated signal originating from the primary com-ponent of V380 Cyg. The signal itself was found to be slightlynon-sinusoidal, and the higher frequency value (compared to thetrue rotation frequency) might be evidence for differential rotation(in the sense that the spot rotates faster than the bulk of the star). Weexplore the possibility of observing the spot signal in more detail inSection 4.5.
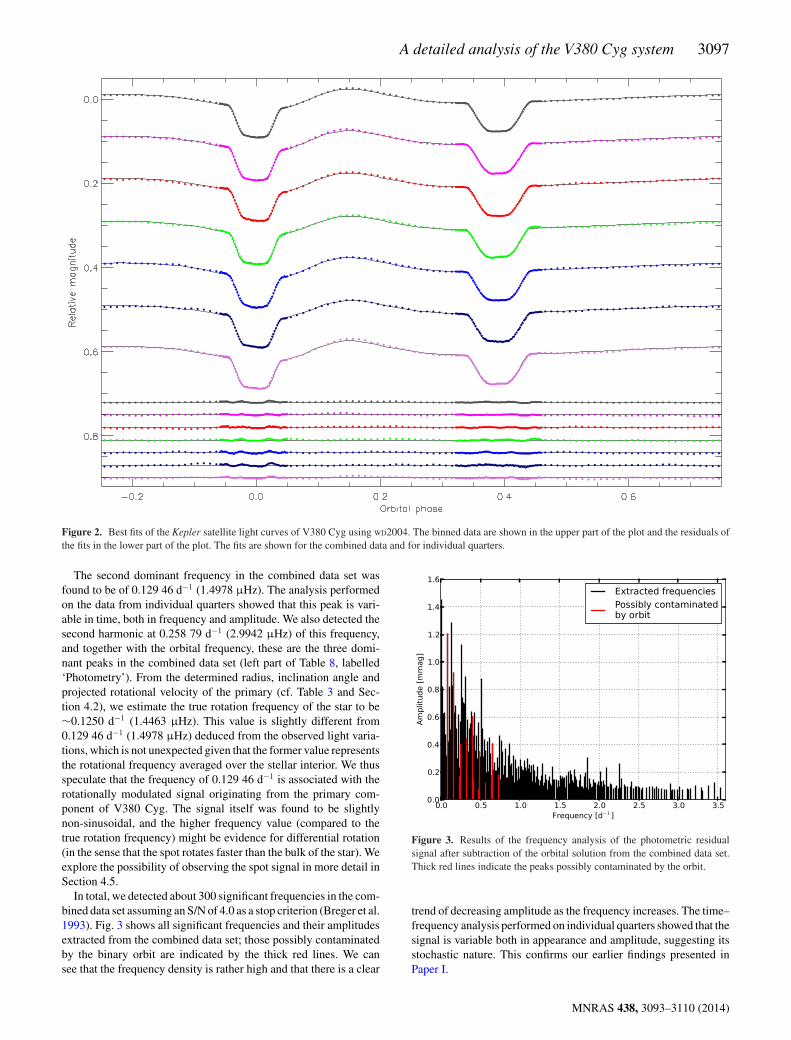
In total, we detected about 300 significant frequencies in the com-bined data set assuming an S/N of 4.0 as a stop criterion (Breger et al.1993). Fig. 3 shows all significant frequencies and their amplitudesextracted from the combined data set; those possibly contaminatedby the binary orbit are indicated by the thick red lines. We cansee that the frequency density is rather high and that there is a clear
Figure 3. Results of the frequency analysis of the photometric residualsignal after subtraction of the orbital solution from the combined data set.Thick red lines indicate the peaks possibly contaminated by the orbit.
trend of decreasing amplitude as the frequency increases. The time–frequency analysis performed on individual quarters showed that thesignal is variable both in appearance and amplitude, suggesting itsstochastic nature. This confirms our earlier findings presented inPaper I.
MNRAS 438, 3093–3110 (2014)
3098 A. Tkachenko et al.
3.3 Interpretation of the intrinsic variability of the primary
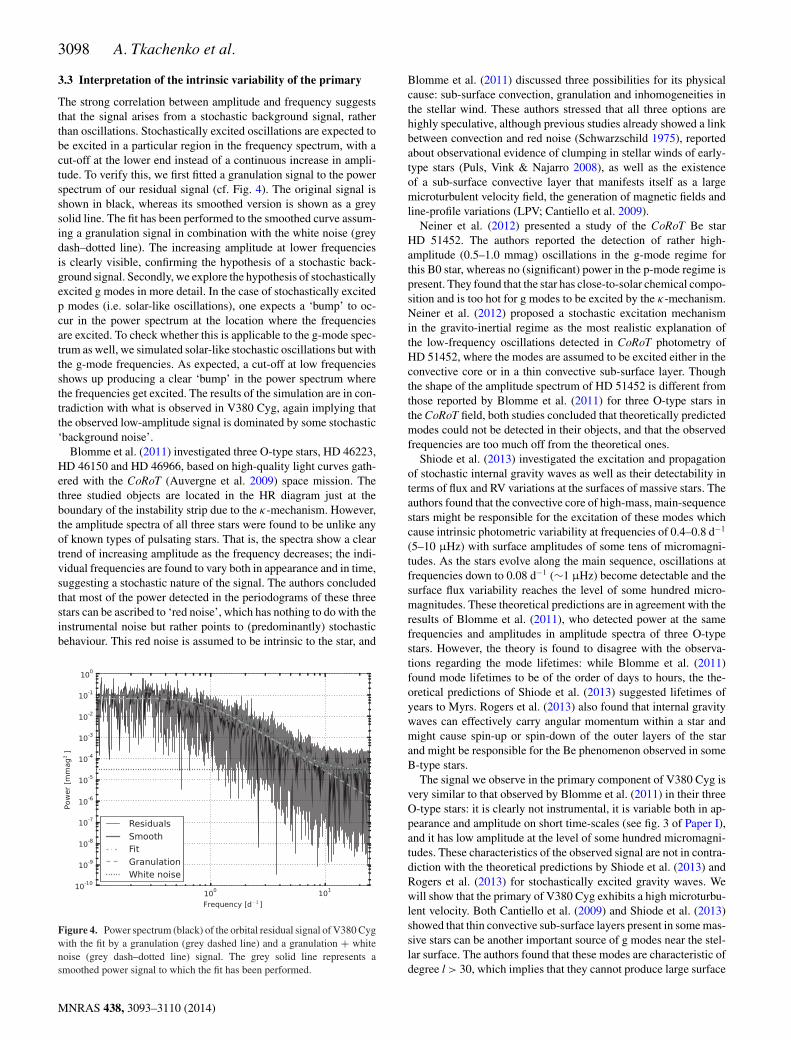
The strong correlation between amplitude and frequency suggeststhat the signal arises from a stochastic background signal, ratherthan oscillations. Stochastically excited oscillations are expected tobe excited in a particular region in the frequency spectrum, with acut-off at the lower end instead of a continuous increase in ampli-tude. To verify this, we first fitted a granulation signal to the powerspectrum of our residual signal (cf. Fig. 4). The original signal isshown in black, whereas its smoothed version is shown as a greysolid line. The fit has been performed to the smoothed curve assum-ing a granulation signal in combination with the white noise (greydash–dotted line). The increasing amplitude at lower frequenciesis clearly visible, confirming the hypothesis of a stochastic back-ground signal. Secondly, we explore the hypothesis of stochasticallyexcited g modes in more detail. In the case of stochastically excitedp modes (i.e. solar-like oscillations), one expects a ‘bump’ to oc-cur in the power spectrum at the location where the frequenciesare excited. To check whether this is applicable to the g-mode spec-trum as well, we simulated solar-like stochastic oscillations but withthe g-mode frequencies. As expected, a cut-off at low frequenciesshows up producing a clear ‘bump’ in the power spectrum wherethe frequencies get excited. The results of the simulation are in con-tradiction with what is observed in V380 Cyg, again implying thatthe observed low-amplitude signal is dominated by some stochastic‘background noise’.
Blomme et al. (2011) investigated three O-type stars, HD 46223,HD 46150 and HD 46966, based on high-quality light curves gath-ered with the CoRoT (Auvergne et al. 2009) space mission. Thethree studied objects are located in the HR diagram just at theboundary of the instability strip due to the κ-mechanism. However,the amplitude spectra of all three stars were found to be unlike anyof known types of pulsating stars. That is, the spectra show a cleartrend of increasing amplitude as the frequency decreases; the indi-vidual frequencies are found to vary both in appearance and in time,suggesting a stochastic nature of the signal. The authors concludedthat most of the power detected in the periodograms of these threestars can be ascribed to ‘red noise’, which has nothing to do with theinstrumental noise but rather points to (predominantly) stochasticbehaviour. This red noise is assumed to be intrinsic to the star, and
Figure 4. Power spectrum (black) of the orbital residual signal of V380 Cygwith the fit by a granulation (grey dashed line) and a granulation + whitenoise (grey dash–dotted line) signal. The grey solid line represents asmoothed power signal to which the fit has been performed.
Blomme et al. (2011) discussed three possibilities for its physicalcause: sub-surface convection, granulation and inhomogeneities inthe stellar wind. These authors stressed that all three options arehighly speculative, although previous studies already showed a linkbetween convection and red noise (Schwarzschild 1975), reportedabout observational evidence of clumping in stellar winds of early-type stars (Puls, Vink & Najarro 2008), as well as the existenceof a sub-surface convective layer that manifests itself as a largemicroturbulent velocity field, the generation of magnetic fields andline-profile variations (LPV; Cantiello et al. 2009).
Neiner et al. (2012) presented a study of the CoRoT Be starHD 51452. The authors reported the detection of rather high-amplitude (0.5–1.0 mmag) oscillations in the g-mode regime forthis B0 star, whereas no (significant) power in the p-mode regime ispresent. They found that the star has close-to-solar chemical compo-sition and is too hot for g modes to be excited by the κ-mechanism.Neiner et al. (2012) proposed a stochastic excitation mechanismin the gravito-inertial regime as the most realistic explanation ofthe low-frequency oscillations detected in CoRoT photometry ofHD 51452, where the modes are assumed to be excited either in theconvective core or in a thin convective sub-surface layer. Thoughthe shape of the amplitude spectrum of HD 51452 is different fromthose reported by Blomme et al. (2011) for three O-type stars inthe CoRoT field, both studies concluded that theoretically predictedmodes could not be detected in their objects, and that the observedfrequencies are too much off from the theoretical ones.
Shiode et al. (2013) investigated the excitation and propagationof stochastic internal gravity waves as well as their detectability interms of flux and RV variations at the surfaces of massive stars. Theauthors found that the convective core of high-mass, main-sequencestars might be responsible for the excitation of these modes whichcause intrinsic photometric variability at frequencies of 0.4–0.8 d−1
(5–10 µHz) with surface amplitudes of some tens of micromagni-tudes. As the stars evolve along the main sequence, oscillations atfrequencies down to 0.08 d−1 (∼1 µHz) become detectable and thesurface flux variability reaches the level of some hundred micro-magnitudes. These theoretical predictions are in agreement with theresults of Blomme et al. (2011), who detected power at the samefrequencies and amplitudes in amplitude spectra of three O-typestars. However, the theory is found to disagree with the observa-tions regarding the mode lifetimes: while Blomme et al. (2011)found mode lifetimes to be of the order of days to hours, the the-oretical predictions of Shiode et al. (2013) suggested lifetimes ofyears to Myrs. Rogers et al. (2013) also found that internal gravitywaves can effectively carry angular momentum within a star andmight cause spin-up or spin-down of the outer layers of the starand might be responsible for the Be phenomenon observed in someB-type stars.
The signal we observe in the primary component of V380 Cyg isvery similar to that observed by Blomme et al. (2011) in their threeO-type stars: it is clearly not instrumental, it is variable both in ap-pearance and amplitude on short time-scales (see fig. 3 of Paper I),and it has low amplitude at the level of some hundred micromagni-tudes. These characteristics of the observed signal are not in contra-diction with the theoretical predictions by Shiode et al. (2013) andRogers et al. (2013) for stochastically excited gravity waves. Wewill show that the primary of V380 Cyg exhibits a high microturbu-lent velocity. Both Cantiello et al. (2009) and Shiode et al. (2013)showed that thin convective sub-surface layers present in some mas-sive stars can be another important source of g modes near the stel-lar surface. The authors found that these modes are characteristic ofdegree l > 30, which implies that they cannot produce large surface
MNRAS 438, 3093–3110 (2014)
A detailed analysis of the V380 Cyg system 3099
brightness variations, but still could be responsible for large micro-turbulent fields observed in massive stars. The high microturbulentvelocity observed in the primary of V380 Cyg supports this theory.On the other hand, the large microturbulent velocity field can onlybe considered as an indirect confirmation of the theory, while suchhigh-degree non-radial modes cannot be directly observed becauseof their very low amplitudes in the disc integrated light.
4 SPECTRO SCOPIC ANALYSIS
In this section, we present a detailed spectroscopic analysis of theV380 Cyg system based on the high-quality spectroscopic data de-scribed in Section 2. The analysis includes determination of theorbital parameters and the disentangled spectra of both componentsby means of the SPD technique, estimation of the atmospheric pa-rameters and chemical composition for both stars as well as furthercomparison with the evolutionary models, and the frequency anal-ysis and the Doppler imaging (DI) analysis of the selected spectrallines in the spectrum of the primary component.
4.1 Spectral disentangling
We use the spectral disentangling (SPD) method (Simon & Sturm1994) to determine the orbital elements for the V380 Cyg system.The method enables simultaneous separation of the intrinsic indi-vidual spectra of the components and determination of the orbitalparameters in a self-consistent way from time series of the observedcomposite spectra of a binary system. In this sense, the measure-ments of the RVs of the components from usually complex blendsof spectral lines are by-passed, and a set of the orbital elements isoptimized instead.
SPD has been performed in Fourier space as formulated byHadrava (1995) and implemented in the FDBINARY code (Ilijic et al.2004). Such implementation is less demanding on the memory stor-age, and on the CPU time than the original method introduced bySimon & Sturm (1994). The DFT is used in the FDBINARY codewhich enables more freedom in the selection of the spectral regionsas well as an arbitrary number of selected pixels which allows betterpreservation of the original spectral resolution of the input spectra.
Spectral lines of both stars get distorted in the course of thecorresponding eclipses due to the Rossiter–McLaughlin effect(McLaughlin 1924; Rossiter 1924). Therefore, the principal con-dition of SPD stating that no variation other than that due to theorbital motion should be present in the spectra is violated at thesephases. Hence, only out-of-eclipse spectra of V380 Cyg have beenselected by us for the SPD analysis. However, without any signifi-cant change in the fractional light contribution of the components inthe course of the orbital cycle, the zero-order Fourier mode becomessingular. This leads to an ambiguity in the obtained disentangledspectra – external information on the light ratio is needed for theirproper renormalization (cf. Pavlovski & Hensberge 2005, 2010;Pavlovski & Southworth 2009). Moreover, undulations in the dis-entangled spectra might appear but this unwanted disturbance couldbe handled with appropriate phase coverage of the input spectra(Hensberge, Ilijic & Torres 2008).
Out of 452 spectra, 237 measurements were taken at the out-of-eclipse phases. The optimization in the FDBINARY code is performedby means of the simplex algorithm. In order to avoid possible localminima in the solution, we ran a very large number of independentruns which makes SPD quite demanding on CPU time even with thereduced (to 237) number of input spectra. From the previous studies(G2000; P2009; Paper I), it is known that the effective temperaturesof the components are similar (∼22 000 K), and are in the range of
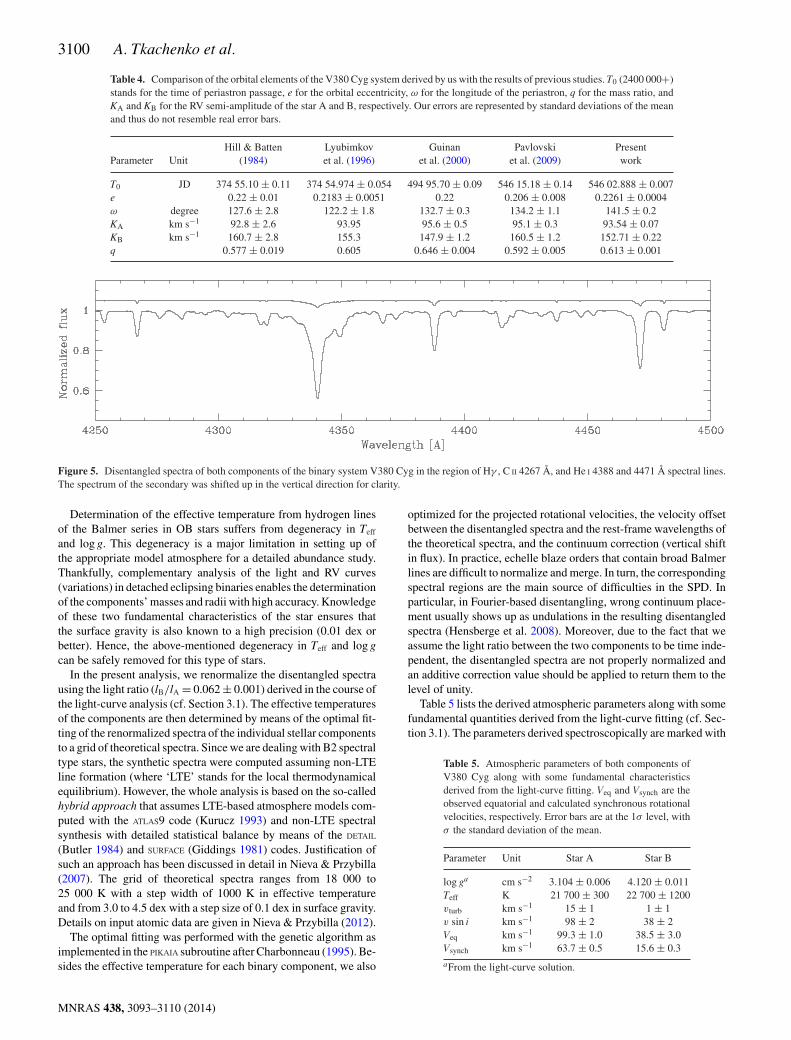
the maximum intensity of He I lines. This is a fortunate situation forthe quality of the determination of the orbital parameters in the caseof a large light ratio between the components. Mainly due to theirlarge intrinsic width, Balmer lines are not suitable for the accuratedetermination of the orbital elements. Thus, the orbital elementswere derived by focusing on several wavelength intervals centredat the prominent He I lines at λλ4026, 4388, 4471, 4713, 4920 and6678 Å; the mean orbital elements are listed in the last column ofTable 4. The errors quoted are the standard deviations of the mean.These are not realistic (systematic) errors but rather illustrate anexcellent consistency between the orbital elements derived fromdifferent spectral regions.
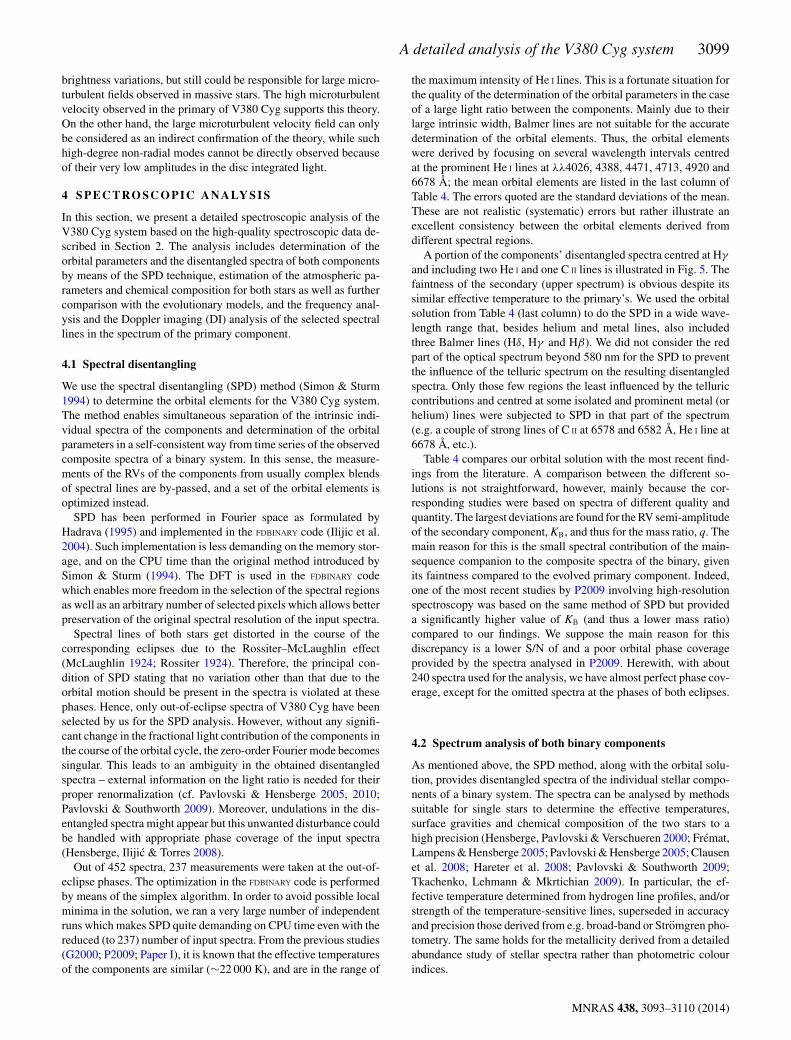
A portion of the components’ disentangled spectra centred at Hγ
and including two He I and one C II lines is illustrated in Fig. 5. Thefaintness of the secondary (upper spectrum) is obvious despite itssimilar effective temperature to the primary’s. We used the orbitalsolution from Table 4 (last column) to do the SPD in a wide wave-length range that, besides helium and metal lines, also includedthree Balmer lines (Hδ, Hγ and Hβ). We did not consider the redpart of the optical spectrum beyond 580 nm for the SPD to preventthe influence of the telluric spectrum on the resulting disentangledspectra. Only those few regions the least influenced by the telluriccontributions and centred at some isolated and prominent metal (orhelium) lines were subjected to SPD in that part of the spectrum(e.g. a couple of strong lines of C II at 6578 and 6582 Å, He I line at6678 Å, etc.).
Table 4 compares our orbital solution with the most recent find-ings from the literature. A comparison between the different so-lutions is not straightforward, however, mainly because the cor-responding studies were based on spectra of different quality andquantity. The largest deviations are found for the RV semi-amplitudeof the secondary component, KB, and thus for the mass ratio, q. Themain reason for this is the small spectral contribution of the main-sequence companion to the composite spectra of the binary, givenits faintness compared to the evolved primary component. Indeed,one of the most recent studies by P2009 involving high-resolutionspectroscopy was based on the same method of SPD but provideda significantly higher value of KB (and thus a lower mass ratio)compared to our findings. We suppose the main reason for thisdiscrepancy is a lower S/N of and a poor orbital phase coverageprovided by the spectra analysed in P2009. Herewith, with about240 spectra used for the analysis, we have almost perfect phase cov-erage, except for the omitted spectra at the phases of both eclipses.
4.2 Spectrum analysis of both binary components
As mentioned above, the SPD method, along with the orbital solu-tion, provides disentangled spectra of the individual stellar compo-nents of a binary system. The spectra can be analysed by methodssuitable for single stars to determine the effective temperatures,surface gravities and chemical composition of the two stars to ahigh precision (Hensberge, Pavlovski & Verschueren 2000; Fremat,Lampens & Hensberge 2005; Pavlovski & Hensberge 2005; Clausenet al. 2008; Hareter et al. 2008; Pavlovski & Southworth 2009;Tkachenko, Lehmann & Mkrtichian 2009). In particular, the ef-fective temperature determined from hydrogen line profiles, and/orstrength of the temperature-sensitive lines, superseded in accuracyand precision those derived from e.g. broad-band or Stromgren pho-tometry. The same holds for the metallicity derived from a detailedabundance study of stellar spectra rather than photometric colourindices.
MNRAS 438, 3093–3110 (2014)
3100 A. Tkachenko et al.
Table 4. Comparison of the orbital elements of the V380 Cyg system derived by us with the results of previous studies. T0 (2400 000+)stands for the time of periastron passage, e for the orbital eccentricity, ω for the longitude of the periastron, q for the mass ratio, andKA and KB for the RV semi-amplitude of the star A and B, respectively. Our errors are represented by standard deviations of the meanand thus do not resemble real error bars.
Hill & Batten Lyubimkov Guinan Pavlovski PresentParameter Unit (1984) et al. (1996) et al. (2000) et al. (2009) work
T0 JD 374 55.10 ± 0.11 374 54.974 ± 0.054 494 95.70 ± 0.09 546 15.18 ± 0.14 546 02.888 ± 0.007e 0.22 ± 0.01 0.2183 ± 0.0051 0.22 0.206 ± 0.008 0.2261 ± 0.0004ω degree 127.6 ± 2.8 122.2 ± 1.8 132.7 ± 0.3 134.2 ± 1.1 141.5 ± 0.2KA km s−1 92.8 ± 2.6 93.95 95.6 ± 0.5 95.1 ± 0.3 93.54 ± 0.07KB km s−1 160.7 ± 2.8 155.3 147.9 ± 1.2 160.5 ± 1.2 152.71 ± 0.22q 0.577 ± 0.019 0.605 0.646 ± 0.004 0.592 ± 0.005 0.613 ± 0.001
Figure 5. Disentangled spectra of both components of the binary system V380 Cyg in the region of Hγ , C II 4267 Å, and He I 4388 and 4471 Å spectral lines.The spectrum of the secondary was shifted up in the vertical direction for clarity.
Determination of the effective temperature from hydrogen linesof the Balmer series in OB stars suffers from degeneracy in Teff
and log g. This degeneracy is a major limitation in setting up ofthe appropriate model atmosphere for a detailed abundance study.Thankfully, complementary analysis of the light and RV curves(variations) in detached eclipsing binaries enables the determinationof the components’ masses and radii with high accuracy. Knowledgeof these two fundamental characteristics of the star ensures thatthe surface gravity is also known to a high precision (0.01 dex orbetter). Hence, the above-mentioned degeneracy in Teff and log gcan be safely removed for this type of stars.
In the present analysis, we renormalize the disentangled spectrausing the light ratio (lB/lA = 0.062 ± 0.001) derived in the course ofthe light-curve analysis (cf. Section 3.1). The effective temperaturesof the components are then determined by means of the optimal fit-ting of the renormalized spectra of the individual stellar componentsto a grid of theoretical spectra. Since we are dealing with B2 spectraltype stars, the synthetic spectra were computed assuming non-LTEline formation (where ‘LTE’ stands for the local thermodynamicalequilibrium). However, the whole analysis is based on the so-calledhybrid approach that assumes LTE-based atmosphere models com-puted with the ATLAS9 code (Kurucz 1993) and non-LTE spectralsynthesis with detailed statistical balance by means of the DETAIL
(Butler 1984) and SURFACE (Giddings 1981) codes. Justification ofsuch an approach has been discussed in detail in Nieva & Przybilla(2007). The grid of theoretical spectra ranges from 18 000 to25 000 K with a step width of 1000 K in effective temperatureand from 3.0 to 4.5 dex with a step size of 0.1 dex in surface gravity.Details on input atomic data are given in Nieva & Przybilla (2012).
The optimal fitting was performed with the genetic algorithm asimplemented in the PIKAIA subroutine after Charbonneau (1995). Be-sides the effective temperature for each binary component, we also
optimized for the projected rotational velocities, the velocity offsetbetween the disentangled spectra and the rest-frame wavelengths ofthe theoretical spectra, and the continuum correction (vertical shiftin flux). In practice, echelle blaze orders that contain broad Balmerlines are difficult to normalize and merge. In turn, the correspondingspectral regions are the main source of difficulties in the SPD. Inparticular, in Fourier-based disentangling, wrong continuum place-ment usually shows up as undulations in the resulting disentangledspectra (Hensberge et al. 2008). Moreover, due to the fact that weassume the light ratio between the two components to be time inde-pendent, the disentangled spectra are not properly normalized andan additive correction value should be applied to return them to thelevel of unity.
Table 5 lists the derived atmospheric parameters along with somefundamental quantities derived from the light-curve fitting (cf. Sec-tion 3.1). The parameters derived spectroscopically are marked with
Table 5. Atmospheric parameters of both components ofV380 Cyg along with some fundamental characteristicsderived from the light-curve fitting. Veq and Vsynch are theobserved equatorial and calculated synchronous rotationalvelocities, respectively. Error bars are at the 1σ level, withσ the standard deviation of the mean.
Parameter Unit Star A Star B
log ga cm s−2 3.104 ± 0.006 4.120 ± 0.011Teff K 21 700 ± 300 22 700 ± 1200vturb km s−1 15 ± 1 1 ± 1v sin i km s−1 98 ± 2 38 ± 2Veq km s−1 99.3 ± 1.0 38.5 ± 3.0Vsynch km s−1 63.7 ± 0.5 15.6 ± 0.3
aFrom the light-curve solution.
MNRAS 438, 3093–3110 (2014)
A detailed analysis of the V380 Cyg system 3101
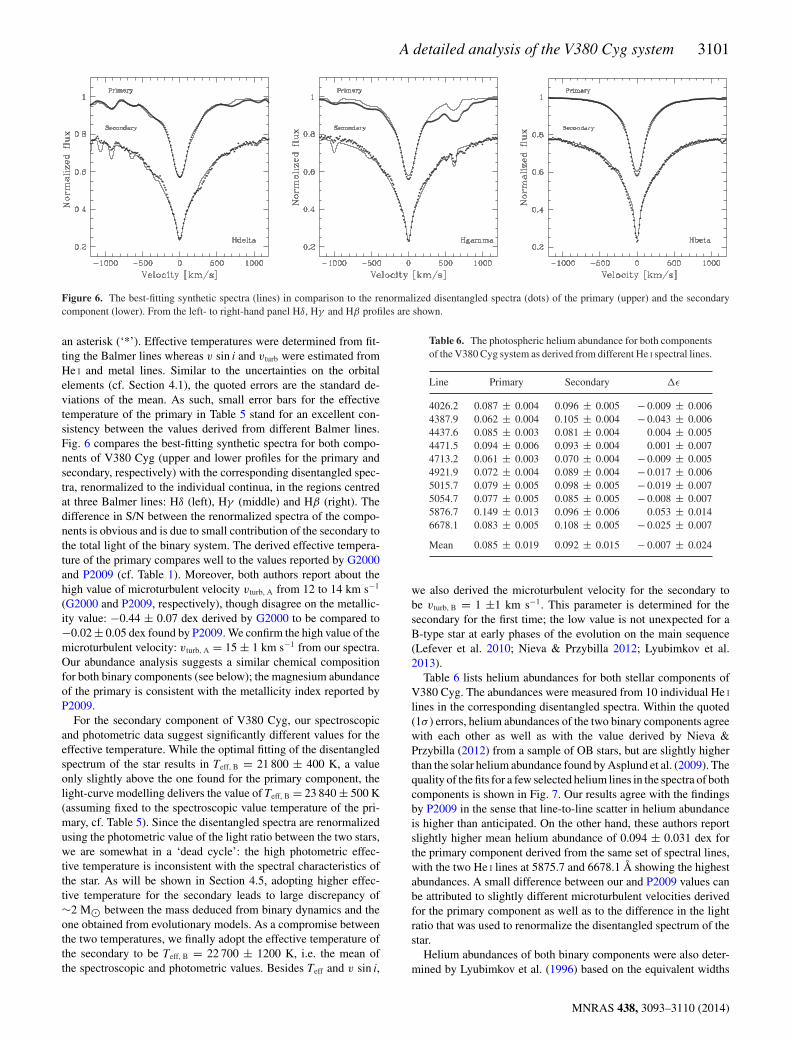
Figure 6. The best-fitting synthetic spectra (lines) in comparison to the renormalized disentangled spectra (dots) of the primary (upper) and the secondarycomponent (lower). From the left- to right-hand panel Hδ, Hγ and Hβ profiles are shown.
an asterisk (‘*’). Effective temperatures were determined from fit-ting the Balmer lines whereas v sin i and vturb were estimated fromHe I and metal lines. Similar to the uncertainties on the orbitalelements (cf. Section 4.1), the quoted errors are the standard de-viations of the mean. As such, small error bars for the effectivetemperature of the primary in Table 5 stand for an excellent con-sistency between the values derived from different Balmer lines.Fig. 6 compares the best-fitting synthetic spectra for both compo-nents of V380 Cyg (upper and lower profiles for the primary andsecondary, respectively) with the corresponding disentangled spec-tra, renormalized to the individual continua, in the regions centredat three Balmer lines: Hδ (left), Hγ (middle) and Hβ (right). Thedifference in S/N between the renormalized spectra of the compo-nents is obvious and is due to small contribution of the secondary tothe total light of the binary system. The derived effective tempera-ture of the primary compares well to the values reported by G2000and P2009 (cf. Table 1). Moreover, both authors report about thehigh value of microturbulent velocity vturb, A from 12 to 14 km s−1
(G2000 and P2009, respectively), though disagree on the metallic-ity value: −0.44 ± 0.07 dex derived by G2000 to be compared to−0.02 ± 0.05 dex found by P2009. We confirm the high value of themicroturbulent velocity: vturb, A = 15 ± 1 km s−1 from our spectra.Our abundance analysis suggests a similar chemical compositionfor both binary components (see below); the magnesium abundanceof the primary is consistent with the metallicity index reported byP2009.
For the secondary component of V380 Cyg, our spectroscopicand photometric data suggest significantly different values for theeffective temperature. While the optimal fitting of the disentangledspectrum of the star results in Teff, B = 21 800 ± 400 K, a valueonly slightly above the one found for the primary component, thelight-curve modelling delivers the value of Teff, B = 23 840 ± 500 K(assuming fixed to the spectroscopic value temperature of the pri-mary, cf. Table 5). Since the disentangled spectra are renormalizedusing the photometric value of the light ratio between the two stars,we are somewhat in a ‘dead cycle’: the high photometric effec-tive temperature is inconsistent with the spectral characteristics ofthe star. As will be shown in Section 4.5, adopting higher effec-tive temperature for the secondary leads to large discrepancy of∼2 M� between the mass deduced from binary dynamics and theone obtained from evolutionary models. As a compromise betweenthe two temperatures, we finally adopt the effective temperature ofthe secondary to be Teff, B = 22 700 ± 1200 K, i.e. the mean ofthe spectroscopic and photometric values. Besides Teff and v sin i,
Table 6. The photospheric helium abundance for both componentsof the V380 Cyg system as derived from different He I spectral lines.
Line Primary Secondary �ε
4026.2 0.087 ± 0.004 0.096 ± 0.005 − 0.009 ± 0.0064387.9 0.062 ± 0.004 0.105 ± 0.004 − 0.043 ± 0.0064437.6 0.085 ± 0.003 0.081 ± 0.004 0.004 ± 0.0054471.5 0.094 ± 0.006 0.093 ± 0.004 0.001 ± 0.0074713.2 0.061 ± 0.003 0.070 ± 0.004 − 0.009 ± 0.0054921.9 0.072 ± 0.004 0.089 ± 0.004 − 0.017 ± 0.0065015.7 0.079 ± 0.005 0.098 ± 0.005 − 0.019 ± 0.0075054.7 0.077 ± 0.005 0.085 ± 0.005 − 0.008 ± 0.0075876.7 0.149 ± 0.013 0.096 ± 0.006 0.053 ± 0.0146678.1 0.083 ± 0.005 0.108 ± 0.005 − 0.025 ± 0.007
Mean 0.085 ± 0.019 0.092 ± 0.015 − 0.007 ± 0.024
we also derived the microturbulent velocity for the secondary tobe vturb, B = 1 ±1 km s−1. This parameter is determined for thesecondary for the first time; the low value is not unexpected for aB-type star at early phases of the evolution on the main sequence(Lefever et al. 2010; Nieva & Przybilla 2012; Lyubimkov et al.2013).
Table 6 lists helium abundances for both stellar components ofV380 Cyg. The abundances were measured from 10 individual He I
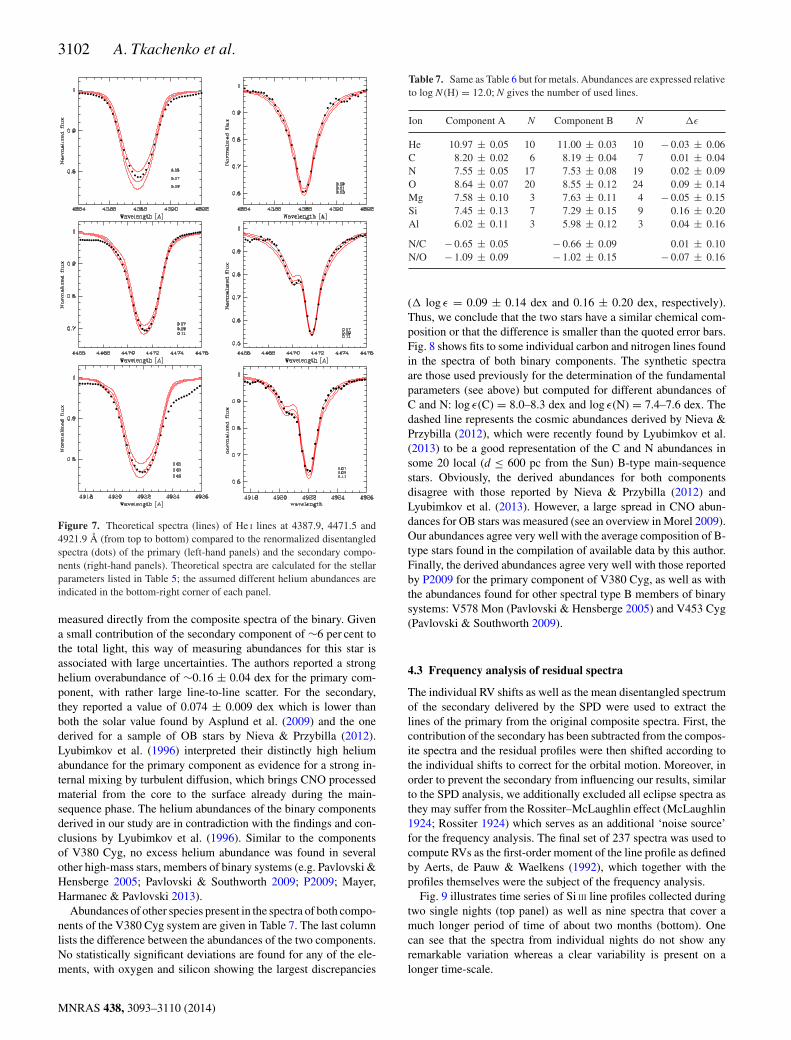
lines in the corresponding disentangled spectra. Within the quoted(1σ ) errors, helium abundances of the two binary components agreewith each other as well as with the value derived by Nieva &Przybilla (2012) from a sample of OB stars, but are slightly higherthan the solar helium abundance found by Asplund et al. (2009). Thequality of the fits for a few selected helium lines in the spectra of bothcomponents is shown in Fig. 7. Our results agree with the findingsby P2009 in the sense that line-to-line scatter in helium abundanceis higher than anticipated. On the other hand, these authors reportslightly higher mean helium abundance of 0.094 ± 0.031 dex forthe primary component derived from the same set of spectral lines,with the two He I lines at 5875.7 and 6678.1 Å showing the highestabundances. A small difference between our and P2009 values canbe attributed to slightly different microturbulent velocities derivedfor the primary component as well as to the difference in the lightratio that was used to renormalize the disentangled spectrum of thestar.
Helium abundances of both binary components were also deter-mined by Lyubimkov et al. (1996) based on the equivalent widths
MNRAS 438, 3093–3110 (2014)
3102 A. Tkachenko et al.
Figure 7. Theoretical spectra (lines) of He I lines at 4387.9, 4471.5 and4921.9 Å (from top to bottom) compared to the renormalized disentangledspectra (dots) of the primary (left-hand panels) and the secondary compo-nents (right-hand panels). Theoretical spectra are calculated for the stellarparameters listed in Table 5; the assumed different helium abundances areindicated in the bottom-right corner of each panel.
measured directly from the composite spectra of the binary. Givena small contribution of the secondary component of ∼6 per cent tothe total light, this way of measuring abundances for this star isassociated with large uncertainties. The authors reported a stronghelium overabundance of ∼0.16 ± 0.04 dex for the primary com-ponent, with rather large line-to-line scatter. For the secondary,they reported a value of 0.074 ± 0.009 dex which is lower thanboth the solar value found by Asplund et al. (2009) and the onederived for a sample of OB stars by Nieva & Przybilla (2012).Lyubimkov et al. (1996) interpreted their distinctly high heliumabundance for the primary component as evidence for a strong in-ternal mixing by turbulent diffusion, which brings CNO processedmaterial from the core to the surface already during the main-sequence phase. The helium abundances of the binary componentsderived in our study are in contradiction with the findings and con-clusions by Lyubimkov et al. (1996). Similar to the componentsof V380 Cyg, no excess helium abundance was found in severalother high-mass stars, members of binary systems (e.g. Pavlovski &Hensberge 2005; Pavlovski & Southworth 2009; P2009; Mayer,Harmanec & Pavlovski 2013).
Abundances of other species present in the spectra of both compo-nents of the V380 Cyg system are given in Table 7. The last columnlists the difference between the abundances of the two components.No statistically significant deviations are found for any of the ele-ments, with oxygen and silicon showing the largest discrepancies
Table 7. Same as Table 6 but for metals. Abundances are expressed relativeto log N (H) = 12.0; N gives the number of used lines.
Ion Component A N Component B N �ε
He 10.97 ± 0.05 10 11.00 ± 0.03 10 − 0.03 ± 0.06C 8.20 ± 0.02 6 8.19 ± 0.04 7 0.01 ± 0.04N 7.55 ± 0.05 17 7.53 ± 0.08 19 0.02 ± 0.09O 8.64 ± 0.07 20 8.55 ± 0.12 24 0.09 ± 0.14Mg 7.58 ± 0.10 3 7.63 ± 0.11 4 − 0.05 ± 0.15Si 7.45 ± 0.13 7 7.29 ± 0.15 9 0.16 ± 0.20Al 6.02 ± 0.11 3 5.98 ± 0.12 3 0.04 ± 0.16
N/C − 0.65 ± 0.05 − 0.66 ± 0.09 0.01 ± 0.10N/O − 1.09 ± 0.09 − 1.02 ± 0.15 − 0.07 ± 0.16
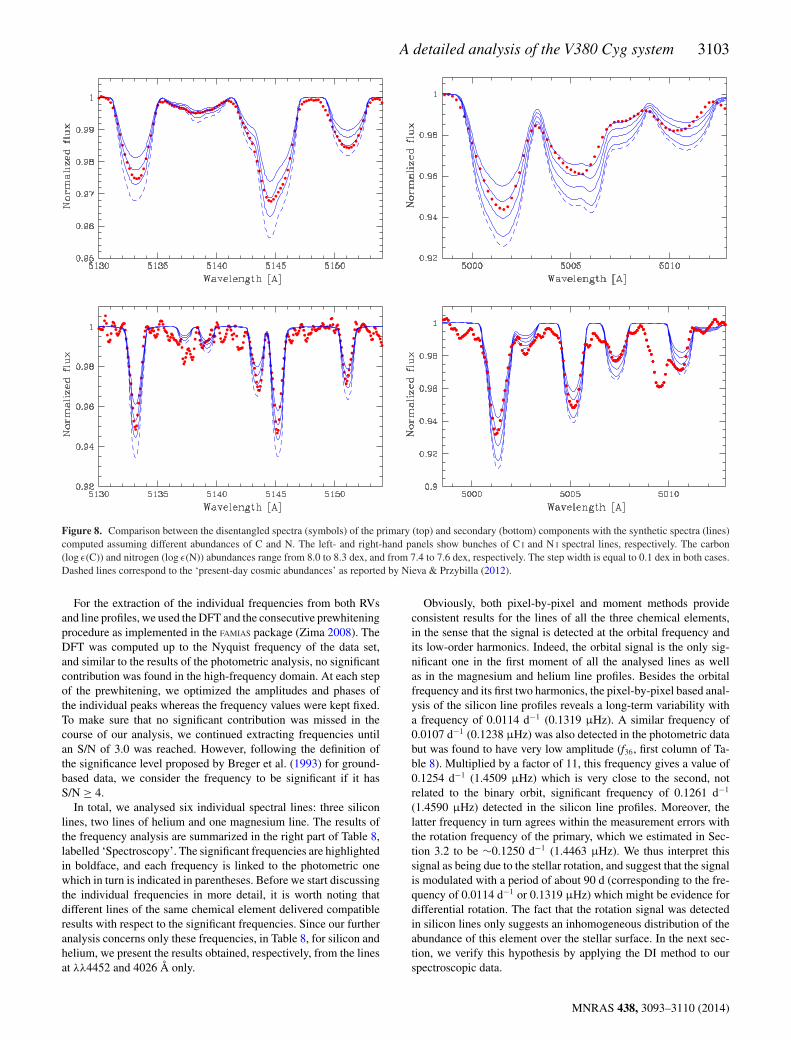
(� log ε = 0.09 ± 0.14 dex and 0.16 ± 0.20 dex, respectively).Thus, we conclude that the two stars have a similar chemical com-position or that the difference is smaller than the quoted error bars.Fig. 8 shows fits to some individual carbon and nitrogen lines foundin the spectra of both binary components. The synthetic spectraare those used previously for the determination of the fundamentalparameters (see above) but computed for different abundances ofC and N: log ε(C) = 8.0–8.3 dex and log ε(N) = 7.4–7.6 dex. Thedashed line represents the cosmic abundances derived by Nieva &Przybilla (2012), which were recently found by Lyubimkov et al.(2013) to be a good representation of the C and N abundances insome 20 local (d ≤ 600 pc from the Sun) B-type main-sequencestars. Obviously, the derived abundances for both componentsdisagree with those reported by Nieva & Przybilla (2012) andLyubimkov et al. (2013). However, a large spread in CNO abun-dances for OB stars was measured (see an overview in Morel 2009).Our abundances agree very well with the average composition of B-type stars found in the compilation of available data by this author.Finally, the derived abundances agree very well with those reportedby P2009 for the primary component of V380 Cyg, as well as withthe abundances found for other spectral type B members of binarysystems: V578 Mon (Pavlovski & Hensberge 2005) and V453 Cyg(Pavlovski & Southworth 2009).
4.3 Frequency analysis of residual spectra
The individual RV shifts as well as the mean disentangled spectrumof the secondary delivered by the SPD were used to extract thelines of the primary from the original composite spectra. First, thecontribution of the secondary has been subtracted from the compos-ite spectra and the residual profiles were then shifted according tothe individual shifts to correct for the orbital motion. Moreover, inorder to prevent the secondary from influencing our results, similarto the SPD analysis, we additionally excluded all eclipse spectra asthey may suffer from the Rossiter–McLaughlin effect (McLaughlin1924; Rossiter 1924) which serves as an additional ‘noise source’for the frequency analysis. The final set of 237 spectra was used tocompute RVs as the first-order moment of the line profile as definedby Aerts, de Pauw & Waelkens (1992), which together with theprofiles themselves were the subject of the frequency analysis.
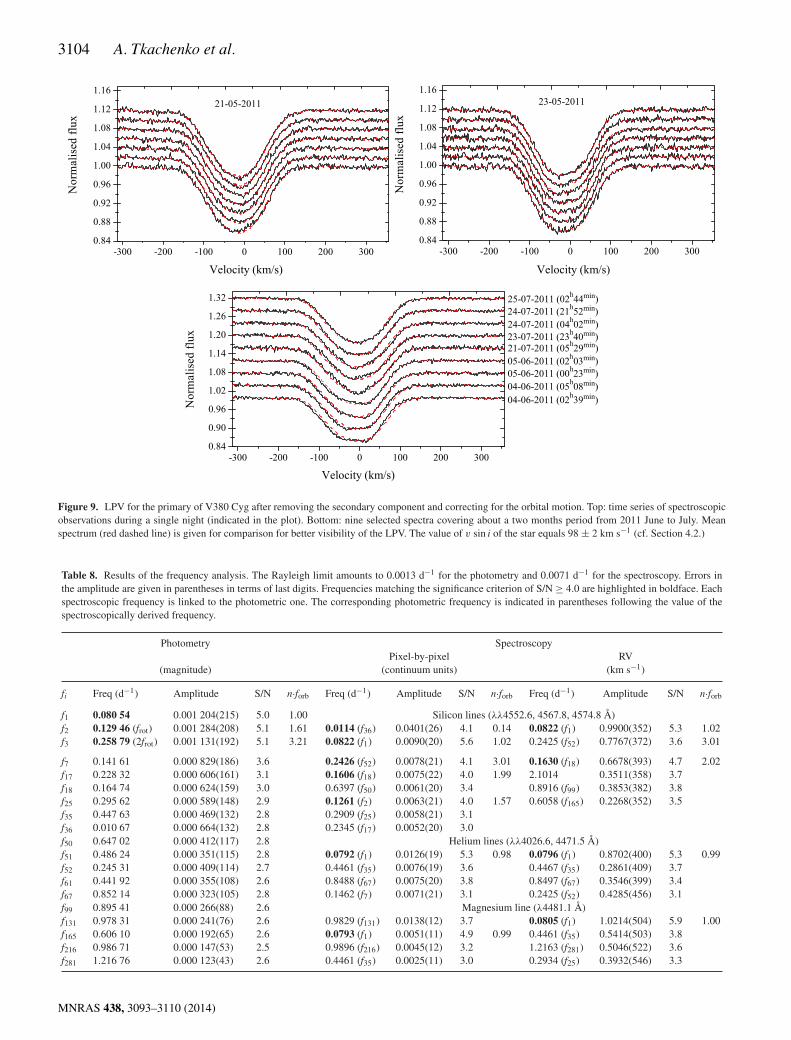
Fig. 9 illustrates time series of Si III line profiles collected duringtwo single nights (top panel) as well as nine spectra that cover amuch longer period of time of about two months (bottom). Onecan see that the spectra from individual nights do not show anyremarkable variation whereas a clear variability is present on alonger time-scale.
MNRAS 438, 3093–3110 (2014)
A detailed analysis of the V380 Cyg system 3103
Figure 8. Comparison between the disentangled spectra (symbols) of the primary (top) and secondary (bottom) components with the synthetic spectra (lines)computed assuming different abundances of C and N. The left- and right-hand panels show bunches of C I and N I spectral lines, respectively. The carbon(log ε(C)) and nitrogen (log ε(N)) abundances range from 8.0 to 8.3 dex, and from 7.4 to 7.6 dex, respectively. The step width is equal to 0.1 dex in both cases.Dashed lines correspond to the ‘present-day cosmic abundances’ as reported by Nieva & Przybilla (2012).
For the extraction of the individual frequencies from both RVsand line profiles, we used the DFT and the consecutive prewhiteningprocedure as implemented in the FAMIAS package (Zima 2008). TheDFT was computed up to the Nyquist frequency of the data set,and similar to the results of the photometric analysis, no significantcontribution was found in the high-frequency domain. At each stepof the prewhitening, we optimized the amplitudes and phases ofthe individual peaks whereas the frequency values were kept fixed.To make sure that no significant contribution was missed in thecourse of our analysis, we continued extracting frequencies untilan S/N of 3.0 was reached. However, following the definition ofthe significance level proposed by Breger et al. (1993) for ground-based data, we consider the frequency to be significant if it hasS/N ≥ 4.
In total, we analysed six individual spectral lines: three siliconlines, two lines of helium and one magnesium line. The results ofthe frequency analysis are summarized in the right part of Table 8,labelled ‘Spectroscopy’. The significant frequencies are highlightedin boldface, and each frequency is linked to the photometric onewhich in turn is indicated in parentheses. Before we start discussingthe individual frequencies in more detail, it is worth noting thatdifferent lines of the same chemical element delivered compatibleresults with respect to the significant frequencies. Since our furtheranalysis concerns only these frequencies, in Table 8, for silicon andhelium, we present the results obtained, respectively, from the linesat λλ4452 and 4026 Å only.
Obviously, both pixel-by-pixel and moment methods provideconsistent results for the lines of all the three chemical elements,in the sense that the signal is detected at the orbital frequency andits low-order harmonics. Indeed, the orbital signal is the only sig-nificant one in the first moment of all the analysed lines as wellas in the magnesium and helium line profiles. Besides the orbitalfrequency and its first two harmonics, the pixel-by-pixel based anal-ysis of the silicon line profiles reveals a long-term variability witha frequency of 0.0114 d−1 (0.1319 µHz). A similar frequency of0.0107 d−1 (0.1238 µHz) was also detected in the photometric databut was found to have very low amplitude (f36, first column of Ta-ble 8). Multiplied by a factor of 11, this frequency gives a value of0.1254 d−1 (1.4509 µHz) which is very close to the second, notrelated to the binary orbit, significant frequency of 0.1261 d−1
(1.4590 µHz) detected in the silicon line profiles. Moreover, thelatter frequency in turn agrees within the measurement errors withthe rotation frequency of the primary, which we estimated in Sec-tion 3.2 to be ∼0.1250 d−1 (1.4463 µHz). We thus interpret thissignal as being due to the stellar rotation, and suggest that the signalis modulated with a period of about 90 d (corresponding to the fre-quency of 0.0114 d−1 or 0.1319 µHz) which might be evidence fordifferential rotation. The fact that the rotation signal was detectedin silicon lines only suggests an inhomogeneous distribution of theabundance of this element over the stellar surface. In the next sec-tion, we verify this hypothesis by applying the DI method to ourspectroscopic data.
MNRAS 438, 3093–3110 (2014)
3104 A. Tkachenko et al.
Figure 9. LPV for the primary of V380 Cyg after removing the secondary component and correcting for the orbital motion. Top: time series of spectroscopicobservations during a single night (indicated in the plot). Bottom: nine selected spectra covering about a two months period from 2011 June to July. Meanspectrum (red dashed line) is given for comparison for better visibility of the LPV. The value of v sin i of the star equals 98 ± 2 km s−1 (cf. Section 4.2.)
Table 8. Results of the frequency analysis. The Rayleigh limit amounts to 0.0013 d−1 for the photometry and 0.0071 d−1 for the spectroscopy. Errors inthe amplitude are given in parentheses in terms of last digits. Frequencies matching the significance criterion of S/N ≥ 4.0 are highlighted in boldface. Eachspectroscopic frequency is linked to the photometric one. The corresponding photometric frequency is indicated in parentheses following the value of thespectroscopically derived frequency.
Photometry SpectroscopyPixel-by-pixel RV
(magnitude) (continuum units) (km s−1)
fi Freq (d−1) Amplitude S/N n·forb Freq (d−1) Amplitude S/N n·forb Freq (d−1) Amplitude S/N n·forb
f1 0.080 54 0.001 204(215) 5.0 1.00 Silicon lines (λλ4552.6, 4567.8, 4574.8 Å)f2 0.129 46 (frot) 0.001 284(208) 5.1 1.61 0.0114 (f36) 0.0401(26) 4.1 0.14 0.0822 (f1) 0.9900(352) 5.3 1.02f3 0.258 79 (2frot) 0.001 131(192) 5.1 3.21 0.0822 (f1) 0.0090(20) 5.6 1.02 0.2425 (f52) 0.7767(372) 3.6 3.01
f7 0.141 61 0.000 829(186) 3.6 0.2426 (f52) 0.0078(21) 4.1 3.01 0.1630 (f18) 0.6678(393) 4.7 2.02f17 0.228 32 0.000 606(161) 3.1 0.1606 (f18) 0.0075(22) 4.0 1.99 2.1014 0.3511(358) 3.7f18 0.164 74 0.000 624(159) 3.0 0.6397 (f50) 0.0061(20) 3.4 0.8916 (f99) 0.3853(382) 3.8f25 0.295 62 0.000 589(148) 2.9 0.1261 (f2) 0.0063(21) 4.0 1.57 0.6058 (f165) 0.2268(352) 3.5f35 0.447 63 0.000 469(132) 2.8 0.2909 (f25) 0.0058(21) 3.1f36 0.010 67 0.000 664(132) 2.8 0.2345 (f17) 0.0052(20) 3.0f50 0.647 02 0.000 412(117) 2.8 Helium lines (λλ4026.6, 4471.5 Å)f51 0.486 24 0.000 351(115) 2.8 0.0792 (f1) 0.0126(19) 5.3 0.98 0.0796 (f1) 0.8702(400) 5.3 0.99f52 0.245 31 0.000 409(114) 2.7 0.4461 (f35) 0.0076(19) 3.6 0.4467 (f35) 0.2861(409) 3.7f61 0.441 92 0.000 355(108) 2.6 0.8488 (f67) 0.0075(20) 3.8 0.8497 (f67) 0.3546(399) 3.4f67 0.852 14 0.000 323(105) 2.8 0.1462 (f7) 0.0071(21) 3.1 0.2425 (f52) 0.4285(456) 3.1f99 0.895 41 0.000 266(88) 2.6 Magnesium line (λ4481.1 Å)f131 0.978 31 0.000 241(76) 2.6 0.9829 (f131) 0.0138(12) 3.7 0.0805 (f1) 1.0214(504) 5.9 1.00f165 0.606 10 0.000 192(65) 2.6 0.0793 (f1) 0.0051(11) 4.9 0.99 0.4461 (f35) 0.5414(503) 3.8f216 0.986 71 0.000 147(53) 2.5 0.9896 (f216) 0.0045(12) 3.2 1.2163 (f281) 0.5046(522) 3.6f281 1.216 76 0.000 123(43) 2.6 0.4461 (f35) 0.0025(11) 3.0 0.2934 (f25) 0.3932(546) 3.3
MNRAS 438, 3093–3110 (2014)
A detailed analysis of the V380 Cyg system 3105
4.4 Doppler imaging
The DI technique allows us to invert time series of observations intothe stellar surface distribution maps of different physical parameters(elemental abundances, temperatures, magnetic field, etc.). Thismethod is widely used for studying chemically peculiar (CP) starsthat show a non-uniform distribution of one or several chemicalelement abundances on their surfaces.
Though stellar surface inhomogeneities were mainly detected inA- and late B-type as well as in cooler stars so far, we recentlystarted to observe a similar behaviour in more massive and hotterearly B-type stars too. Similar to A-type stars, stellar surface in-homogeneities observed in these objects are usually accompaniedby strong and, sometimes, complex magnetic fields suggesting thatit is this field that is responsible for the formation of spots. Forexample, Kochukhov et al. (2011) presented the results of the anal-ysis of early B-type CP star HD 37776. The authors reported onthe detection of strong and complex magnetic field as well as onthe inhomogeneous distribution of He on the surface of this star.Rivinius et al. (2013) reported on strong LPV of both carbon andhelium photospheric lines in the helium strong B star HR 7355.The authors attribute the variability to the surface abundance spotswith a rather large, a couple of dex, gradient between the regionsof enhancement and depletion of the chemical element. Degrooteet al. (2011) and Papics et al. (2012) reported on the detection of therotational signal from both CoRoT photometry and high-resolutionspectroscopy in two B-type stars HD 174648 and HD 43317, re-spectively. Degroote et al. (2011) showed that for HD 174648, thesignal can be explained by the two circumpolar spots, whereas thespot-like scenario for HD 43317 is supported by the recent detec-tion of a magnetic field for this star (Briquet et al. 2013). Petit et al.(2013) presented a summary of physical, rotational and magneticproperties of all known magnetic O and B stars (see their table 1).Hubrig et al. (2006) reported the detection of a weak longitudinalmagnetic field of the order of a few hundred of gauss in 13 SlowlyPulsating B (SPB) stars and one β Cep variable (ξ 1 CMa) althoughthis was recently criticized (Bagnulo et al. 2012; Shultz et al. 2012).
There are several theories to explain the existence of the mag-netic fields in massive, early-type stars. The most disseminatedtheory is the one of fossil magnetic fields, i.e. the remnant of themagnetic field gained by the star in the course of its formation phase(Braithwaite & Nordlund 2006). There are also theories proposingthat the convective core of the massive stars (Brun, Browning &Toomre 2005) or a dynamo process operating in the differentiallyrotating radiative layers (Mullan & MacDonald 2005) is at the ori-gin of the magnetic fields observed at the surfaces of these stars.Cantiello et al. (2009, 2011) suggested, from their theoretical cal-culations and the magnetohydrodynamic simulations, the presenceof a sub-surface convective region in massive stars that is capableof producing localized magnetic fields observable at their surfaces.The authors also suggested that this convective region might beresponsible for the large microturbulent velocity fields typical formassive early-type stars.
The fact that Si III line profiles of the primary component ofV380 Cyg show a clear variability with the period close to the(expected) rotation period of the star suggests that the system maycontain yet another rotationally modulated B-type star. Phase-foldedsilicon profiles on which we base our further analysis (see below)show the same kind of variability as shown in Fig. 9 (bottom).
We used the Si III spectral line at λ4452 Å to check whetherthe observed LPV can be explained by the rotation effect due tospot(s) on the stellar surface. The analysis is based on the above-
described method of DI as implemented in the INVERS8 FORTRAN
code (Piskunov & Rice 1993). The code inverts time series of theobserved line profiles into surface abundance distribution maps byminimizing the difference between the observations and the model.Since the problem is strongly ill-posed, it has to be regularizedwhich is done by means of Tikhonov regularization. From a math-ematical point of view, the regularization is performed by addingan additional term of the form �F(ε) to the total error function thatis a subject of minimization, where � represents a regularizationparameter (usually, taking a value between 10−2 and 10−4) and F(ε)stands for the regularization functional. The algorithm then itera-tively reduces the total error function until the discrepancy betweenthe observations and the model is of the same order as the individualerrors of measurement (Kochukhov 2003).
Calculations with the INVERS8 code are based on the pre-computedtables of the local line profiles. These profiles are computed fordifferent positions on the stellar disc (20 in our case), which allowsus to take the centre-to-limb variation of the intensity, and for a setof individual abundances of a given chemical element. The profilesare then convolved with the instrumental profile of a certain width,which in our case corresponds to the high-resolution mode (R =85 000) of the HERMES instrument (Raskin et al. 2011). Since theprimary component of V380 Cyg is a hot B-type giant star, non-LTEline formation must be assumed when synthesizing its line profiles.The local profiles were computed with the non-LTE version ofthe SYNTHV code developed by VT. To synthesize the spectra, thecode uses pre-computed non-LTE departure coefficients, which inour case were calculated with the TLUSTY model atmospheres code(Hubeny 1988; Hubeny & Lanz 1995).
In our calculations with the INVERS8 code, we limited the totalnumber of iterations to 500 but in all cases the program convergedmuch faster, typically after completing 170–200 iterations. The cal-culations were performed using three values of the regularizationparameter �: 10−2, 10−3 and 10−4. The resulting Si-abundancemaps for all the three values of � are shown in Fig. 10 (left) in Mer-cator projection. Obviously, in all three cases, the algorithm favoursa solution with two ‘dominant’ spots, of which one is bright (abun-dance depletion) and another is dark (abundance enrichment). Themap computed for � = 10−2 also exhibits a third spot at a longitudeof about 130◦ but it is of much lower contrast compared to the bulkof the star than the two others. The essential difference betweenthis map (top) and the two other maps (middle and bottom) is thatthe spots are located at almost the same latitude φ but at differentlongitudes θ such that only one of the high-contrast spots is visibleat a given instant of time (except for the phases when both spots arevisible at the very limb of the star). In the two other cases, the spotshave rather the same longitude but different latitudes which makesthem invisible for almost half of the rotation cycle. The quality ofthe fit of the observed profiles for all three maps is almost the same,as is illustrated in Fig. 10 (right). The major part of the observedspectroscopic variability can be explained by either of our models,also confirming the suggestion made in Sections 3.2 and 4.4 thatthe star shows a signature of rotational modulation.
A careful look at the obtained maps and the corresponding abun-dance gradients allows us to exclude the one computed for the lowestvalue of � = 10−4 (cf. Fig. 10, bottom). This map exhibits an un-reliably high gradient of the Si abundance of about 2 dex betweenthe two spots, which is compensated by other small-scale struc-tures on the stellar surface (e.g. low-contrast but elongated spots at[θ , φ] = [−135◦, +55◦]; [−75◦, +0◦]) to provide a good fit to theobservations. Moreover, the rather high mean abundance (withouttaking the two spots into account) of ∼3.5 dex characteristic of this
MNRAS 438, 3093–3110 (2014)

3106 A. Tkachenko et al.
Figure 10. Si-abundance surface maps in Mercator projection (left) and the comparison between the observed (solid black line) and computed (dashedred line) profiles. The calculations are based on three values of the regularization parameter �: 10−2, 10−3 and 10−4 (from top to bottom). The profilescorresponding to different rotation phases are vertically shifted by a small, constant value for better visibility. X- and Y-axes on the maps give longitude θ andlatitude φ coordinates, respectively. The dark and bright areas refer to the regions of enhanced and depleted Si abundance, respectively. The maximal abundancegradient increases from the top map to the bottom and is (in dex): [Min:Max] = [−4.41:−4.10] – top, [−4.65:−3.61] – middle and [−4.69:−2.56] – bottom.
map is not compatible with the Si abundance estimated from thespectrum analysis of the disentangled spectrum of the primary (cf.Section 4.2). To some extent, this also concerns the map computedfor � = 10−3 (cf. Fig. 10, middle), as the estimated mean Si abun-dance for this map is ∼3.95 dex which also seems to be too high.We thus favour the map showing two large spots located at almostthe same latitude (cf. Fig. 10, top) though we are aware that it israther difficult to decide which of the two maps (� = 10−2 or 10−3)is the most appropriate one.
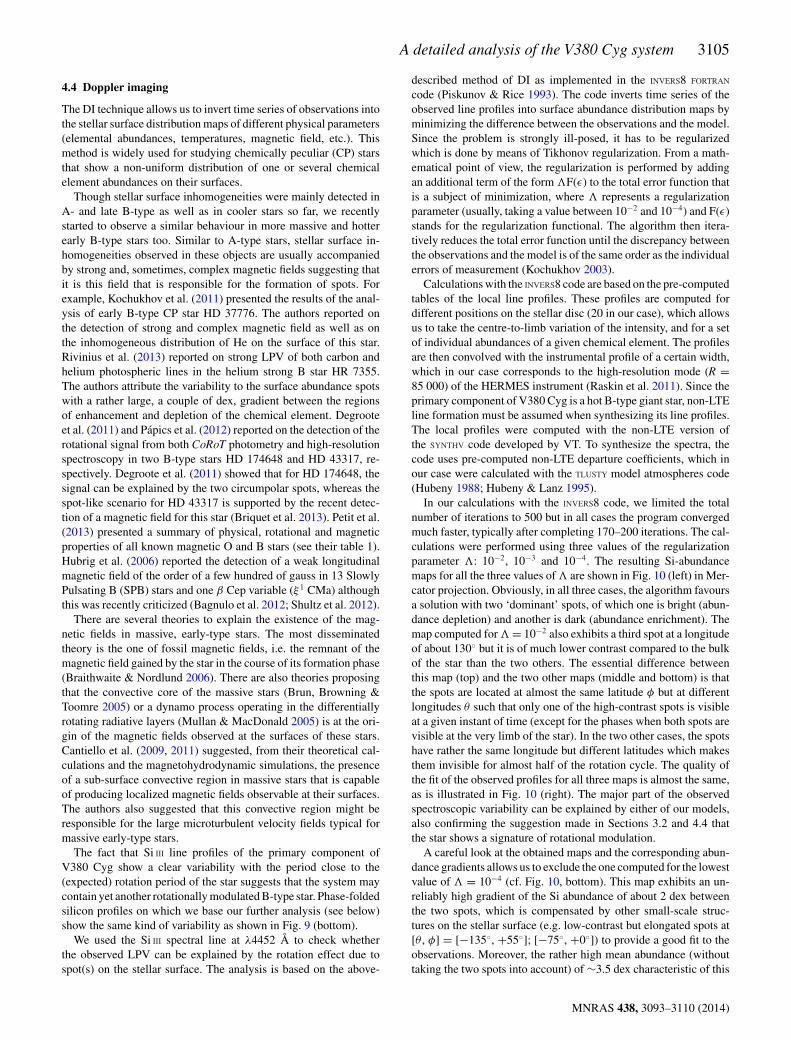
Fig. 11 shows the selected map in spherical projection and at fourdifferent rotational phases. Though the detected total Si-abundancegradient of about 0.3 dex is small, it is significant compared tothe estimated errors. As stated by Piskunov & Rice (1993), themost reliable errors on the reconstructed abundances are obtainedby ‘mapping’ several spectral lines of the same chemical element
separately. We thus performed the DI analysis of all the three Silines used by us for the frequency analysis (cf. Table 8). The sur-face abundance distributions obtained from the individual lines arecompatible with each other, also when assuming different valuesof the regularization parameters �. The delivered abundance gra-dients are consistent as well, giving a maximum abundance am-plitude of ∼0.35 dex for the map computed with � = 10−2. Theerrors estimated from the abundance scatter between the maps ob-tained based on the three individual spectral lines are of the or-der of 0.1 dex, thanks to the very high S/N of our spectroscopicdata, which makes the detection of such a low abundance gradientpossible. The continuum normalization of the spectra usually alsoserves as an additional source of uncertainty on the reconstructedmaps, but is minimal in our case due to the high quality of thedata.
MNRAS 438, 3093–3110 (2014)
A detailed analysis of the V380 Cyg system 3107
Figure 11. Si-abundance map in spherical projection computed for � =10−2. The dark and bright areas refer to the regions of enhanced and depletedSi abundance, respectively.
As an additional check for the consistency between the frequencyanalysis of the line profiles and the DI results, we applied the al-gorithm to both He and Mg lines in which we could not detect thesignal that we interpret as being due to rotation of the star. Similarto the case of silicon, we used the same spectral lines as for thefrequency analysis, i.e. two He and one Mg lines (cf. Table 8). It isworth noting that a visual inspection of the lines of both elementsfolded with the rotation period was enough to conclude that theydo not exhibit variability similar to the silicon lines but are stableover the rotation cycle instead. Indeed, the DI algorithm deliversrather structured surface maps even for the regularization parameterof � = 10−2 and with a very low abundance gradient below 0.1 dex.Such a gradient is considered insignificant as it is comparable tothe estimated uncertainties, and we conclude that both helium andmagnesium show a uniform distribution of their abundances overthe stellar surface.
4.5 Evolutionary models
As already mentioned (cf. Section 1), both components of theV380 Cyg system show a discrepancy between the dynamical massand the one obtained from evolutionary models. P2009 showedthat the discrepancy in mass does not disappear with the inclusionof rotation effects into the evolutionary models, whereas G2000suggested a high value of the convective overshoot parameter(αov = 0.6 ± 0.1) as a possible solution for the mass problem.In the present study, the fundamental stellar parameters of bothcomponents of V380 Cyg are refined, and used to compare to anew set of evolutionary model calculations. We use the MESAstellar evolution code (Paxton et al. 2011, 2013) to compute thetracks. The basic setup includes an initial hydrogen mass fractionof X = 0.70 and metal abundance fractions from Asplund et al.(2009). The initial rotation velocity on the pre-main-sequence trackis set to vinit = 0 km s−1 (no rotation), and we choose to includecore overshooting as a step function, parametrized with an αov = 0.2pressure scaleheight by default. The Schwarzschild criterion is usedin the convection treatment. We choose a standard mixing lengthαMLT = 1.8 pressure scale-height. The MESA equation of state isused, and the N14 reaction rate from Imbriani et al. (2004). Wecompared the stellar models computed with MESA to those in thegrid of stellar models computed with the Code Liegois d’Evolution
Stellaire (CLES) by Briquet et al. (2011) and used by Saesen et al.(2013) for asteroseismic modelling of B-type pulsators in the opencluster NGC 884. Excellent agreement was found for the same inputphysics.
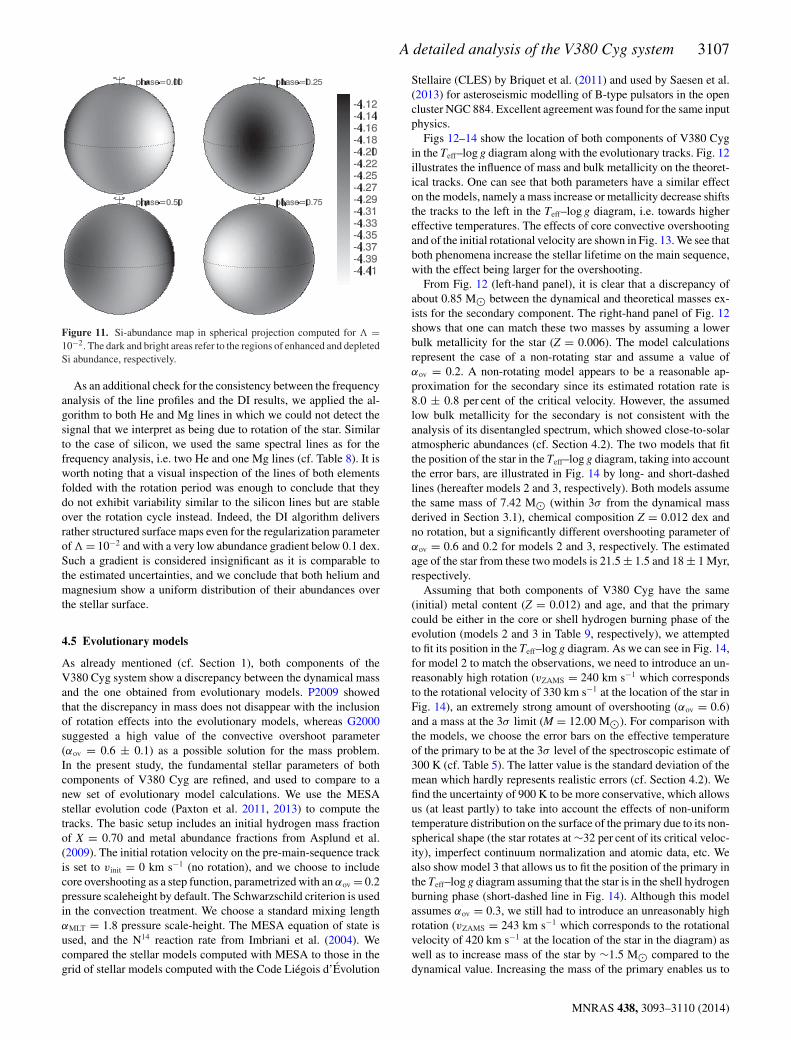
Figs 12–14 show the location of both components of V380 Cygin the Teff–log g diagram along with the evolutionary tracks. Fig. 12illustrates the influence of mass and bulk metallicity on the theoret-ical tracks. One can see that both parameters have a similar effecton the models, namely a mass increase or metallicity decrease shiftsthe tracks to the left in the Teff–log g diagram, i.e. towards highereffective temperatures. The effects of core convective overshootingand of the initial rotational velocity are shown in Fig. 13. We see thatboth phenomena increase the stellar lifetime on the main sequence,with the effect being larger for the overshooting.
From Fig. 12 (left-hand panel), it is clear that a discrepancy ofabout 0.85 M� between the dynamical and theoretical masses ex-ists for the secondary component. The right-hand panel of Fig. 12shows that one can match these two masses by assuming a lowerbulk metallicity for the star (Z = 0.006). The model calculationsrepresent the case of a non-rotating star and assume a value ofαov = 0.2. A non-rotating model appears to be a reasonable ap-proximation for the secondary since its estimated rotation rate is8.0 ± 0.8 per cent of the critical velocity. However, the assumedlow bulk metallicity for the secondary is not consistent with theanalysis of its disentangled spectrum, which showed close-to-solaratmospheric abundances (cf. Section 4.2). The two models that fitthe position of the star in the Teff–log g diagram, taking into accountthe error bars, are illustrated in Fig. 14 by long- and short-dashedlines (hereafter models 2 and 3, respectively). Both models assumethe same mass of 7.42 M� (within 3σ from the dynamical massderived in Section 3.1), chemical composition Z = 0.012 dex andno rotation, but a significantly different overshooting parameter ofαov = 0.6 and 0.2 for models 2 and 3, respectively. The estimatedage of the star from these two models is 21.5 ± 1.5 and 18 ± 1 Myr,respectively.
Assuming that both components of V380 Cyg have the same(initial) metal content (Z = 0.012) and age, and that the primarycould be either in the core or shell hydrogen burning phase of theevolution (models 2 and 3 in Table 9, respectively), we attemptedto fit its position in the Teff–log g diagram. As we can see in Fig. 14,for model 2 to match the observations, we need to introduce an un-reasonably high rotation (vZAMS = 240 km s−1 which correspondsto the rotational velocity of 330 km s−1 at the location of the star inFig. 14), an extremely strong amount of overshooting (αov = 0.6)and a mass at the 3σ limit (M = 12.00 M�). For comparison withthe models, we choose the error bars on the effective temperatureof the primary to be at the 3σ level of the spectroscopic estimate of300 K (cf. Table 5). The latter value is the standard deviation of themean which hardly represents realistic errors (cf. Section 4.2). Wefind the uncertainty of 900 K to be more conservative, which allowsus (at least partly) to take into account the effects of non-uniformtemperature distribution on the surface of the primary due to its non-spherical shape (the star rotates at ∼32 per cent of its critical veloc-ity), imperfect continuum normalization and atomic data, etc. Wealso show model 3 that allows us to fit the position of the primary inthe Teff–log g diagram assuming that the star is in the shell hydrogenburning phase (short-dashed line in Fig. 14). Although this modelassumes αov = 0.3, we still had to introduce an unreasonably highrotation (vZAMS = 243 km s−1 which corresponds to the rotationalvelocity of 420 km s−1 at the location of the star in the diagram) aswell as to increase mass of the star by ∼1.5 M� compared to thedynamical value. Increasing the mass of the primary enables us to
MNRAS 438, 3093–3110 (2014)
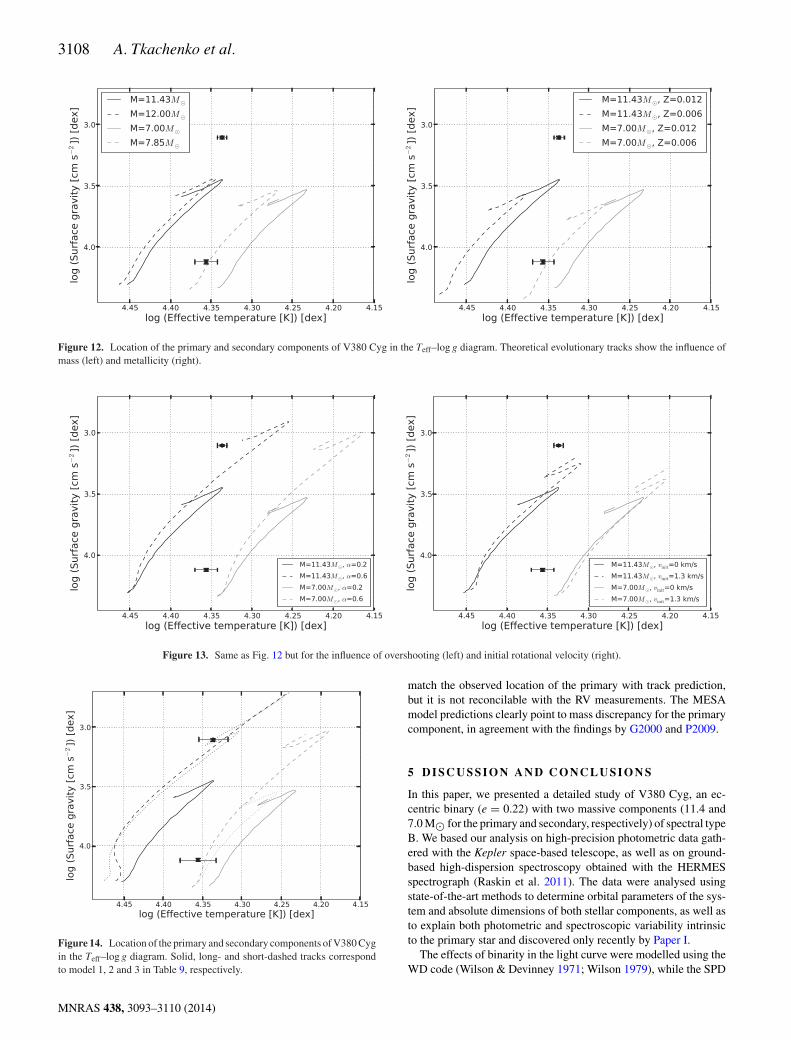
3108 A. Tkachenko et al.
Figure 12. Location of the primary and secondary components of V380 Cyg in the Teff–log g diagram. Theoretical evolutionary tracks show the influence ofmass (left) and metallicity (right).
Figure 13. Same as Fig. 12 but for the influence of overshooting (left) and initial rotational velocity (right).
Figure 14. Location of the primary and secondary components of V380 Cygin the Teff–log g diagram. Solid, long- and short-dashed tracks correspondto model 1, 2 and 3 in Table 9, respectively.
match the observed location of the primary with track prediction,but it is not reconcilable with the RV measurements. The MESAmodel predictions clearly point to mass discrepancy for the primarycomponent, in agreement with the findings by G2000 and P2009.
5 D I S C U S S I O N A N D C O N C L U S I O N S
In this paper, we presented a detailed study of V380 Cyg, an ec-centric binary (e = 0.22) with two massive components (11.4 and7.0 M� for the primary and secondary, respectively) of spectral typeB. We based our analysis on high-precision photometric data gath-ered with the Kepler space-based telescope, as well as on ground-based high-dispersion spectroscopy obtained with the HERMESspectrograph (Raskin et al. 2011). The data were analysed usingstate-of-the-art methods to determine orbital parameters of the sys-tem and absolute dimensions of both stellar components, as well asto explain both photometric and spectroscopic variability intrinsicto the primary star and discovered only recently by Paper I.
The effects of binarity in the light curve were modelled using theWD code (Wilson & Devinney 1971; Wilson 1979), while the SPD
MNRAS 438, 3093–3110 (2014)
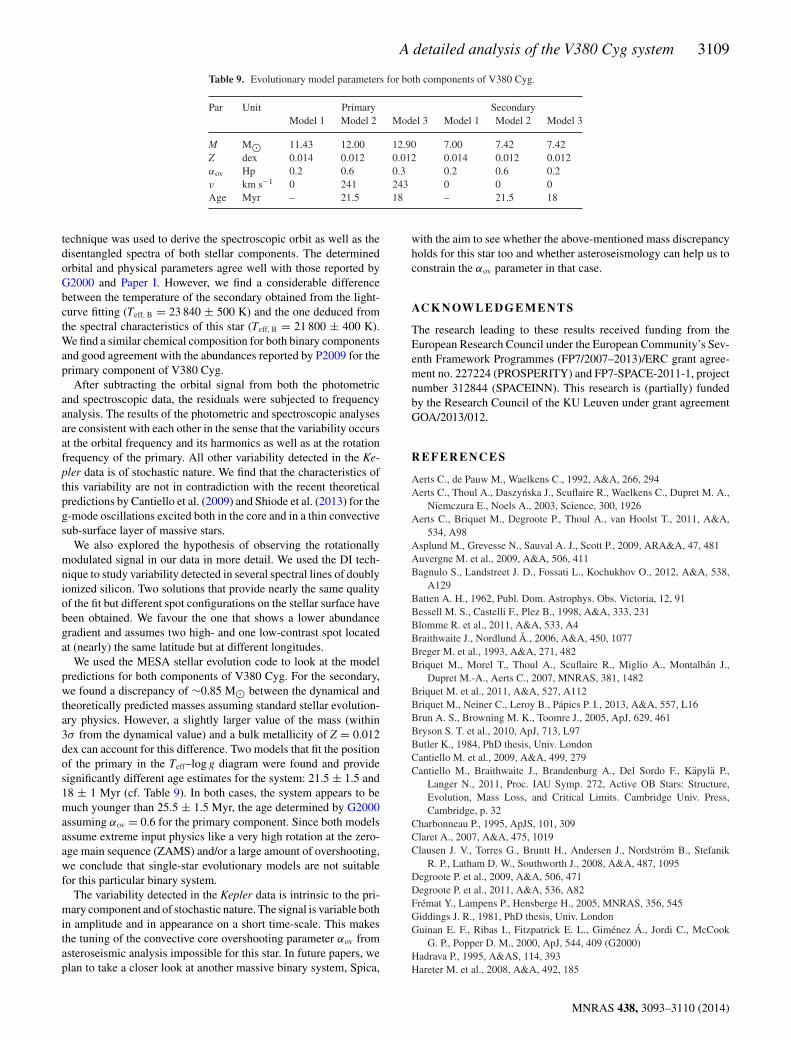
A detailed analysis of the V380 Cyg system 3109
Table 9. Evolutionary model parameters for both components of V380 Cyg.
Par Unit Primary SecondaryModel 1 Model 2 Model 3 Model 1 Model 2 Model 3
M M� 11.43 12.00 12.90 7.00 7.42 7.42Z dex 0.014 0.012 0.012 0.014 0.012 0.012αov Hp 0.2 0.6 0.3 0.2 0.6 0.2v km s−1 0 241 243 0 0 0Age Myr – 21.5 18 – 21.5 18
technique was used to derive the spectroscopic orbit as well as thedisentangled spectra of both stellar components. The determinedorbital and physical parameters agree well with those reported byG2000 and Paper I. However, we find a considerable differencebetween the temperature of the secondary obtained from the light-curve fitting (Teff, B = 23 840 ± 500 K) and the one deduced fromthe spectral characteristics of this star (Teff, B = 21 800 ± 400 K).We find a similar chemical composition for both binary componentsand good agreement with the abundances reported by P2009 for theprimary component of V380 Cyg.
After subtracting the orbital signal from both the photometricand spectroscopic data, the residuals were subjected to frequencyanalysis. The results of the photometric and spectroscopic analysesare consistent with each other in the sense that the variability occursat the orbital frequency and its harmonics as well as at the rotationfrequency of the primary. All other variability detected in the Ke-pler data is of stochastic nature. We find that the characteristics ofthis variability are not in contradiction with the recent theoreticalpredictions by Cantiello et al. (2009) and Shiode et al. (2013) for theg-mode oscillations excited both in the core and in a thin convectivesub-surface layer of massive stars.
We also explored the hypothesis of observing the rotationallymodulated signal in our data in more detail. We used the DI tech-nique to study variability detected in several spectral lines of doublyionized silicon. Two solutions that provide nearly the same qualityof the fit but different spot configurations on the stellar surface havebeen obtained. We favour the one that shows a lower abundancegradient and assumes two high- and one low-contrast spot locatedat (nearly) the same latitude but at different longitudes.
We used the MESA stellar evolution code to look at the modelpredictions for both components of V380 Cyg. For the secondary,we found a discrepancy of ∼0.85 M� between the dynamical andtheoretically predicted masses assuming standard stellar evolution-ary physics. However, a slightly larger value of the mass (within3σ from the dynamical value) and a bulk metallicity of Z = 0.012dex can account for this difference. Two models that fit the positionof the primary in the Teff–log g diagram were found and providesignificantly different age estimates for the system: 21.5 ± 1.5 and18 ± 1 Myr (cf. Table 9). In both cases, the system appears to bemuch younger than 25.5 ± 1.5 Myr, the age determined by G2000assuming αov = 0.6 for the primary component. Since both modelsassume extreme input physics like a very high rotation at the zero-age main sequence (ZAMS) and/or a large amount of overshooting,we conclude that single-star evolutionary models are not suitablefor this particular binary system.
The variability detected in the Kepler data is intrinsic to the pri-mary component and of stochastic nature. The signal is variable bothin amplitude and in appearance on a short time-scale. This makesthe tuning of the convective core overshooting parameter αov fromasteroseismic analysis impossible for this star. In future papers, weplan to take a closer look at another massive binary system, Spica,
with the aim to see whether the above-mentioned mass discrepancyholds for this star too and whether asteroseismology can help us toconstrain the αov parameter in that case.
AC K N OW L E D G E M E N T S
The research leading to these results received funding from theEuropean Research Council under the European Community’s Sev-enth Framework Programmes (FP7/2007–2013)/ERC grant agree-ment no. 227224 (PROSPERITY) and FP7-SPACE-2011-1, projectnumber 312844 (SPACEINN). This research is (partially) fundedby the Research Council of the KU Leuven under grant agreementGOA/2013/012.
R E F E R E N C E S
Aerts C., de Pauw M., Waelkens C., 1992, A&A, 266, 294Aerts C., Thoul A., Daszynska J., Scuflaire R., Waelkens C., Dupret M. A.,
Niemczura E., Noels A., 2003, Science, 300, 1926Aerts C., Briquet M., Degroote P., Thoul A., van Hoolst T., 2011, A&A,
534, A98Asplund M., Grevesse N., Sauval A. J., Scott P., 2009, ARA&A, 47, 481Auvergne M. et al., 2009, A&A, 506, 411Bagnulo S., Landstreet J. D., Fossati L., Kochukhov O., 2012, A&A, 538,
A129Batten A. H., 1962, Publ. Dom. Astrophys. Obs. Victoria, 12, 91Bessell M. S., Castelli F., Plez B., 1998, A&A, 333, 231Blomme R. et al., 2011, A&A, 533, A4Braithwaite J., Nordlund Å., 2006, A&A, 450, 1077Breger M. et al., 1993, A&A, 271, 482Briquet M., Morel T., Thoul A., Scuflaire R., Miglio A., Montalban J.,
Dupret M.-A., Aerts C., 2007, MNRAS, 381, 1482Briquet M. et al., 2011, A&A, 527, A112Briquet M., Neiner C., Leroy B., Papics P. I., 2013, A&A, 557, L16Brun A. S., Browning M. K., Toomre J., 2005, ApJ, 629, 461Bryson S. T. et al., 2010, ApJ, 713, L97Butler K., 1984, PhD thesis, Univ. LondonCantiello M. et al., 2009, A&A, 499, 279Cantiello M., Braithwaite J., Brandenburg A., Del Sordo F., Kapyla P.,
Langer N., 2011, Proc. IAU Symp. 272, Active OB Stars: Structure,Evolution, Mass Loss, and Critical Limits. Cambridge Univ. Press,Cambridge, p. 32
Charbonneau P., 1995, ApJS, 101, 309Claret A., 2007, A&A, 475, 1019Clausen J. V., Torres G., Bruntt H., Andersen J., Nordstrom B., Stefanik
R. P., Latham D. W., Southworth J., 2008, A&A, 487, 1095Degroote P. et al., 2009, A&A, 506, 471Degroote P. et al., 2011, A&A, 536, A82Fremat Y., Lampens P., Hensberge H., 2005, MNRAS, 356, 545Giddings J. R., 1981, PhD thesis, Univ. LondonGuinan E. F., Ribas I., Fitzpatrick E. L., Gimenez A., Jordi C., McCook
G. P., Popper D. M., 2000, ApJ, 544, 409 (G2000)Hadrava P., 1995, A&AS, 114, 393Hareter M. et al., 2008, A&A, 492, 185
MNRAS 438, 3093–3110 (2014)

3110 A. Tkachenko et al.
Hensberge H., Pavlovski K., Verschueren W., 2000, A&A, 358, 553Hensberge H., Ilijic S., Torres K. B. V., 2008, A&A, 482, 1031Herrero A., Kudritzki R. P., Vilchez J. M., Kunze D., Butler K., Haser S.,
1992, A&A, 261, 209Hilditch R. W., 2004, in Hilditch R. W., Hensberge H., Pavlovski K., eds,
ASP Conf. Ser. Vol. 318, Spectroscopically and Spatially Resolving theComponents of the Close Binary Stars. Astron. Soc. Pac., San Francisco,p. 198
Hill G., Batten A. H., 1984, A&A, 141, 39Hubeny I., 1988, Comput. Phys. Commun., 52, 103Hubeny I., Lanz T., 1995, ApJ, 439, 875Hubrig S., Briquet M., Scholler M., De Cat P., Mathys G., Aerts C., 2006,
MNRAS, 369, L61Ilijic S., Hensberge H., Pavlovski K., Freyhammer L. M., 2004, in Hilditch
R. W., Hensberge H., Pavlovski K., eds, ASP Conf. Ser. Vol.318, Spectro-scopically and Spatially Resolving the Components of the Close BinaryStars. Astron. Soc. Pac., San Francisco, p. 111
Imbriani G. et al., 2004, A&A, 420, 625Kochukhov O., 2003, PhD thesis, Uppsala UniversityKochukhov O., Lundin A., Romanyuk I., Kudryavtsev D., 2011, ApJ, 726,
24Kolenberg K. et al., 2011, MNRAS, 411, 878Kurucz R., 1993, ATLAS9 Stellar Atmosphere Programs and 2 km/s
grid. Kurucz CD-ROM No. 13. Smithsonian Astrophysical Observatory,Cambridge, MA
Lefever K., Puls J., Morel T., Aerts C., Decin L., Briquet M., 2010, A&A,515, A74
Lomb N. R., 1976, Ap&SS, 39, 447Lyubimkov L. S., Rachkovskaya T. M., Rostopchin S. I., Tarasov A. E.,
1996, Astron. Rep., 40, 46Lyubimkov L. S., Lambert D. L., Poklad D. B., Rachkovskaya T. M.,
Rostopchin S. I., 2013, MNRAS, 428, 3497Mayer P., Harmanec P., Pavlovski K., 2013, A&A, 550, A2McLaughlin D. B., 1924, ApJ, 60, 22Morel T., 2009, Commun. Asteroseismol., 158, 122Mullan D. J., MacDonald J., 2005, MNRAS, 356, 1139Neiner C. et al., 2012, A&A, 546, A47Nieva M. F., Przybilla N., 2007, A&A, 467, 295Nieva M.-F., Przybilla N., 2012, A&A, 539, A143Papics P. I. et al., 2012, A&A, 542, A55Pavlovski K., Hensberge H., 2005, A&A, 439, 309Pavlovski K., Hensberge H., 2010, in Prsa A., Zejda M., eds, ASP Conf.
Ser. Vol. 435, Binaries – Key to Comprehension of the Universe. Astron.Soc. Pac., San Francisco, p. 207
Pavlovski K., Southworth J., 2009, MNRAS, 394, 1519Pavlovski K., Tamajo E., Koubsky P., Southworth J., Yang S., Kolbas V.,
2009, MNRAS, 400, 791 (P2009)Paxton B., Bildsten L., Dotter A., Herwig F., Lesaffre P., Timmes F., 2011,
ApJS, 192, 3Paxton B. et al., 2013, ApJS, 208, 4Petit V. et al., 2013, MNRAS, 429, 398Piskunov N. E., Rice J. B., 1993, PASP, 105, 1415Popper D. M., 1981, ApJS, 47, 339Popper D. M., Guinan E. F., 1998, PASP, 110, 572Puls J., Vink J. S., Najarro F., 2008, A&AR, 16, 209Raskin G. et al., 2011, A&A, 526, A69Rivinius T., Townsend R. H. D., Kochukhov O., Stefl S., Baade D., Barrera
L., Szeifert Th., 2013, MNRAS, 429, 177Rogers T. M., Lin D. N. C., McElwaine J. N., Lau H. H. B., 2013, ApJ, 772,
21Rossiter R. A., 1924, ApJ, 60, 15Saesen S., Briquet M., Aerts C., Miglio A., Carrier F., 2013, AJ, 146, 102Scargle J. D., 1982, ApJ, 263, 835Schwarzschild M., 1975, ApJ, 195, 137Shiode J. H., Quataert E., Cantiello M., Bildsten L., 2013, MNRAS, 430,
1736Shultz M. et al., 2012, ApJ, 750, 2Simon K. P., Sturm E., 1994, A&A, 281, 286Southworth J., Maxted P. F. L., Smalley B., 2005, A&A, 429, 645Southworth J. et al., 2011, MNRAS, 414, 2413Tkachenko A., Lehmann H., Mkrtichian D. E., 2009, A&A, 504, 991Tkachenko A. et al., 2012, MNRAS, 424, L21 (Paper I)van Hamme W., 1993, AJ, 106, 2096Wilson R. E., 1979, ApJ, 234, 1054Wilson R. E., 1993, in Leung K.-C., Nha I.-S., eds, ASP Conf. Ser. Vol. 38,
New Frontiers in Binary Star Research. Astron. Soc. Pac., San Francisco,p. 91
Wilson R. E., Devinney E. J., 1971, ApJ, 166, 605Wilson R. E., Van Hamme W., 2004, Computing Binary Star Observ-
ables (Wilson-Devinney program user guide). Univ. Florida, Gainsville,Florida
Zima W., 2008, Commun. Asteroseismol., 155, 17
This paper has been typeset from a TEX/LATEX file prepared by the author.
MNRAS 438, 3093–3110 (2014)