Embed Size (px)
Citation preview
The Economic Growth of Gujarat Deccleration in the Third P lan: Some Reasons
Mahesh Bhatt V K Chawds
In the Second Plan the rate of growth achieved by Gujarat was appreciably higher than that of the national economy. In the first three years of the Third Plan, however, there has been a marked deccleration in the pace of growth in Gujarat. The rate of growth of State income and of industrial production in the State have been lower than that of national income and industrial production in the country as a whole, modest as the latter themselves have been.
An attempt is made here to examine in some detail this lapering off of growth in Gujarat and to suggest some possible explanations for it.
THE Techno-Economic Survey of Gujarat carried out by the Na
tional Council of Applied Economic Research largely deals with the economic position of Gujarat at the time of its, inception, in May 1960. Hence if would be useful to examine the performance of Gujarat's economy since then. Such examination should help the public as well as the policy makers in planning the future course of action, particularly during the Fourth Plan.
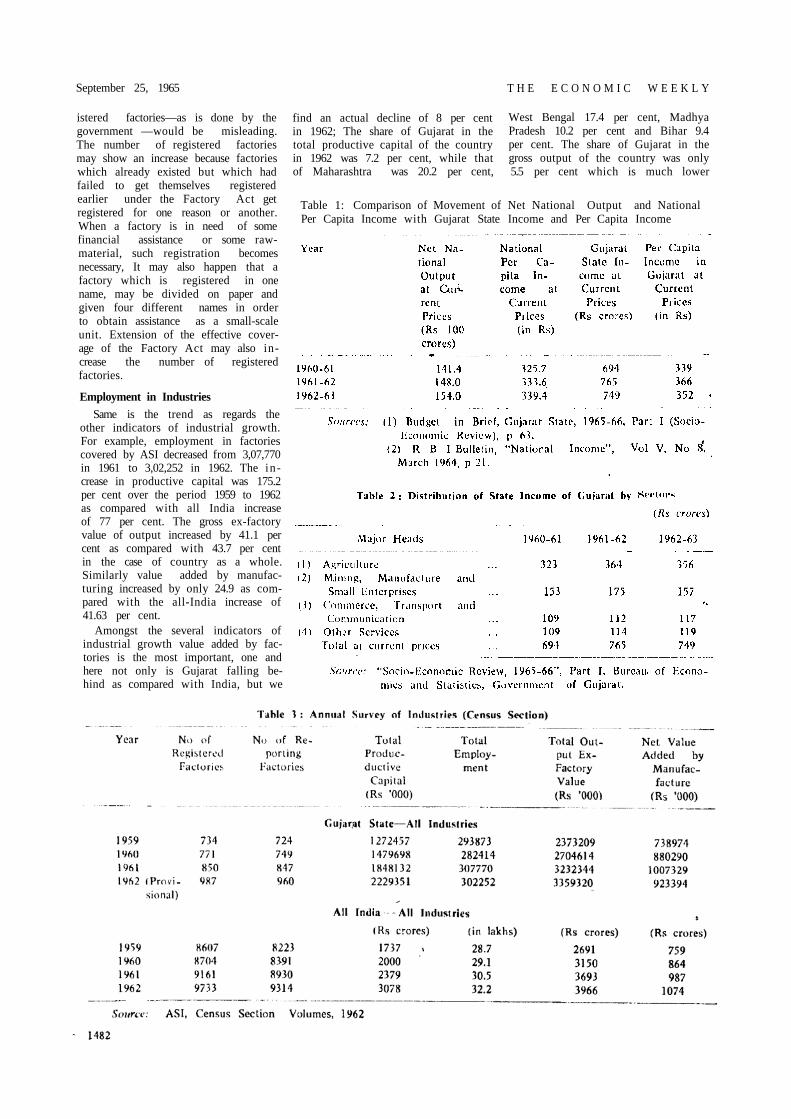
According to the NCAER Survey the net output of Gujarat increased at the annual rate of 5.3 per cent dur-ing the Second Plan period. compared In the 3.8 per cent rate achieved by the country as a whole. Thus in the S e c o n d Plan the rate of development of Gujarat's economy was higher than that of the country as a whole. However, in the first three years of the Third Plan (1960-61 to 1962-63) the average rate of growth in the slate income was 2.61 per cent compared to the rate of 2.94 per cent achieved by the country as a whole. Similarly average rate of growth in per capita income of Gujarat was 1.28 per cent compared to 1,33 per cent for the country as a whole [see Table 1).
Thus the rate of development of Gujarat's economy during 1960-51 in 1962-63 has been slower than that during the Second Plan period and also slower than the rate of development of the country as a whole during 1960-61 to 1962-63. Stale income which was Rs 765 crores in 1961-62 declined to Rs 749 crores in 1962-63, i e a net decline of Rs 16 crores. Agriculture accounted for 50 per cent of this decline (see Table 2).
It is true that the decline in the contribution of agriculture to State tacrine may have been due to seasonal factors. However the decline in the contribution of the other sectors can-not be ascribed to the seasonal fac-tor. What is noteworthy is that the
major decline was in the industrial sector [Mining, Manufacturing, and Small-enterprises). Its contribution to Slate income declined by Rs 18 crors and this is only partly compensated by an increase of Rs 5 crores in Commerce, Transport and Communi-cation and of another Rs 5 crores in other services. In the country as a whole the industrial sector has progressively expanded year after year. For example the contribution of this sector which was Rs 21.1 abja in 1960-61 increased to Rs 23.0 abja in 1962-63 and Rs 24.4 abja in 1963-64.
It would be interesting to study the performance of the industrial sector in Gujarat in a little detail-The contribution to the State income of manufacturing activities alone is 15 per cent. Table 3 gives the performance of this sector over the period of 1959 to 1962. Total number of factories increased from 734 to 987 or by 34.47 per cent. What is more important is the number of reporting factories. These increased from 724 to 960, i e by 32.5 per cent. As far as the number of lactones is enncern-cd the performance of Gujarat as compared with the all-India record is undoubtedly encouraging. In the case of the country as a whole number of factories and the number of reporting factories increased only by 13 per cent over the same period. The contribution of this sector to State income is higher than its contribution to national income. Here it is necessary to note that the information in Table 3 relates to those factories only which are included In the Census Part of the Annual Survey of Industries. Every registered factory is included in the Census Part of the ASI, if it (1) employs 50 or more workers if aided by power or (ii) employs 100 or more workers if not aided by power. The difference between the number of factories given in the State Government publications and
in AST is mainly due to the different in definition of factories. State Government publications include all factories which are registered under the Factory Act irrespective of the number of people employed.
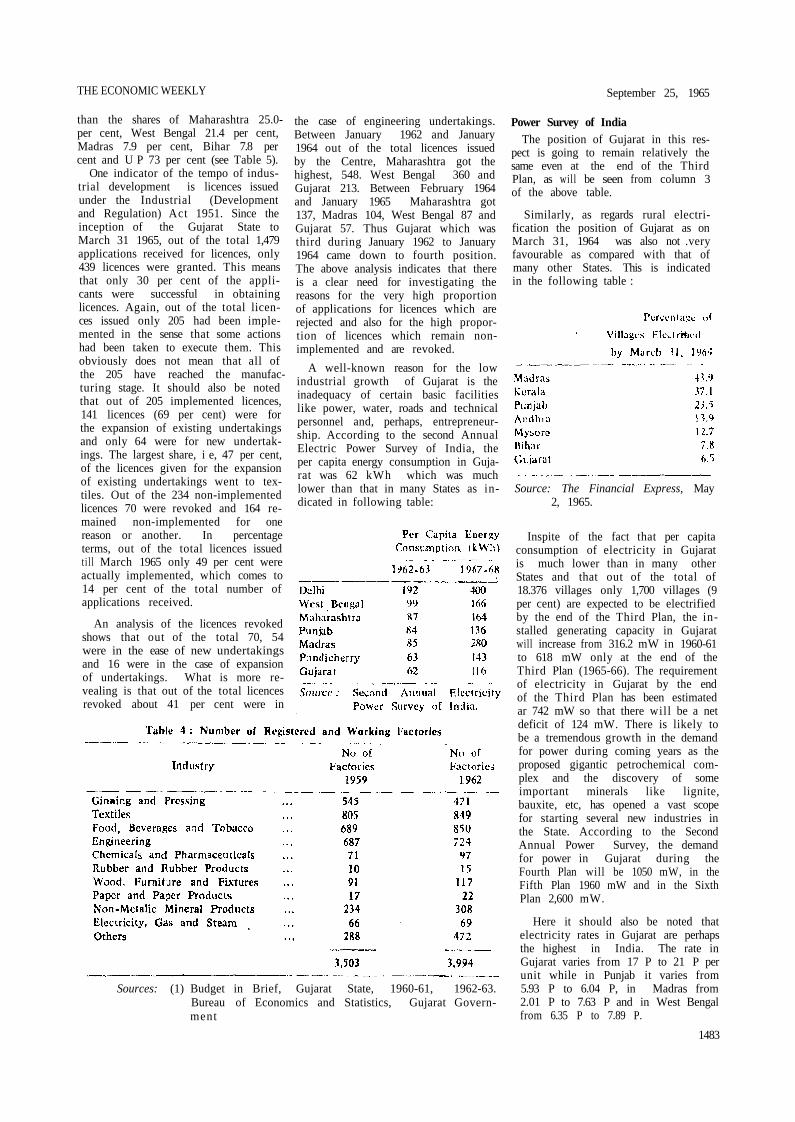
If we take ASI data regarding factories in Gujarat and the information in Table 4 together it can he seen that out of the total of 3,994 registered factories in Gujarat in 1962 only 987 factories employed 50 or more workers with power or 100 or more workers without power. The re-maining 3,007 factories were of small size giving employment to 68.730 persons out of the total factory employment of 3.70.982 in 1962.
A further analysis of these data shows that the largest increase in factories (64 per cent) has taken place in factories which are classified as "others". We do not know what types of factories this category includes: but it is clear that it dues not include industries of any sub-stantial significance as all important industries worth mentioning are separately classified. The smallest increase i e 4.5 per cent, is in the number of electricity, gas and steam facto-lies followed by engineering 15.38 per cent). Thus it is clear that most of the increase in the number of factories has taken place in these years in Gujarat is in industries which have very little significance from the view point of the industrial growth of the economy. Analysis of, data for factories included in ASI reveals the same fact. The increase in gross output tex-factory value) of basic in dustrial chemicals was only 10.3 per cent and of machinery [including elec-irical machiery) only 2.1. while that in gross output of consumers goods industries like textiles, food, animal oils and fats and grain mill was 70 per cent.
To measure industrial growth in terms of increase in number of reg-
1481
September 25, 1965 T H E E C O N O M I C W E E K L Y
istered factories—as is done by the government —would be misleading. The number of registered factories may show an increase because factories which already existed but which had failed to get themselves registered earlier under the Factory Act get registered for one reason or another. When a factory is in need of some financial assistance or some raw-material, such registration becomes necessary, It may also happen that a factory which is registered in one name, may be divided on paper and given four different names in order to obtain assistance as a small-scale unit. Extension of the effective coverage of the Factory Act may also increase the number of registered factories.
Employment in Industries Same is the trend as regards the
other indicators of industrial growth. For example, employment in factories covered by ASI decreased from 3,07,770 in 1961 to 3,02,252 in 1962. The increase in productive capital was 175.2 per cent over the period 1959 to 1962 as compared with all India increase of 77 per cent. The gross ex-factory value of output increased by 41.1 per cent as compared with 43.7 per cent in the case of country as a whole. Similarly value added by manufacturing increased by only 24.9 as compared with the all-India increase of 41.63 per cent.
Amongst the several indicators of industrial growth value added by factories is the most important, one and here not only is Gujarat falling behind as compared with India, but we
Table 1: Comparison of Movement of Net National Output and National Per Capita Income with Gujarat State Income and Per Capita Income
find an actual decline of 8 per cent in 1962; The share of Gujarat in the total productive capital of the country in 1962 was 7.2 per cent, while that of Maharashtra was 20.2 per cent,
West Bengal 17.4 per cent, Madhya Pradesh 10.2 per cent and Bihar 9.4 per cent. The share of Gujarat in the gross output of the country was only 5.5 per cent which is much lower
THE ECONOMIC WEEKLY September 25, 1965
than the shares of Maharashtra 25.0-per cent, West Bengal 21.4 per cent, Madras 7.9 per cent, Bihar 7.8 per cent and U P 73 per cent (see Table 5).
One indicator of the tempo of industrial development is licences issued under the Industrial (Development and Regulation) Act 1951. Since the inception of the Gujarat State to March 31 1965, out of the total 1,479 applications received for licences, only 439 licences were granted. This means that only 30 per cent of the applicants were successful in obtaining licences. Again, out of the total licences issued only 205 had been implemented in the sense that some actions had been taken to execute them. This obviously does not mean that all of the 205 have reached the manufac-turing stage. It should also be noted that out of 205 implemented licences, 141 licences (69 per cent) were for the expansion of existing undertakings and only 64 were for new undertakings. The largest share, i e, 47 per cent, of the licences given for the expansion of existing undertakings went to textiles. Out of the 234 non-implemented licences 70 were revoked and 164 remained non-implemented for one reason or another. In percentage terms, out of the total licences issued t i l l March 1965 only 49 per cent were actually implemented, which comes to 14 per cent of the total number of applications received.
An analysis of the licences revoked shows that out of the total 70, 54 were in the ease of new undertakings and 16 were in the case of expansion of undertakings. What is more revealing is that out of the total licences revoked about 41 per cent were in
the case of engineering undertakings. Between January 1962 and January 1964 out of the total licences issued by the Centre, Maharashtra got the highest, 548. West Bengal 360 and Gujarat 213. Between February 1964 and January 1965 Maharashtra got 137, Madras 104, West Bengal 87 and Gujarat 57. Thus Gujarat which was third during January 1962 to January 1964 came down to fourth position. The above analysis indicates that there is a clear need for investigating the reasons for the very high proportion of applications for licences which are rejected and also for the high proportion of licences which remain non-implemented and are revoked.
A well-known reason for the low industrial growth of Gujarat is the inadequacy of certain basic facilities like power, water, roads and technical personnel and, perhaps, entrepreneur-ship. According to the second Annual Electric Power Survey of India, the per capita energy consumption in Gujarat was 62 kWh which was much lower than that in many States as indicated in following table:
Power Survey of India The position of Gujarat in this res
pect is going to remain relatively the same even at the end of the Third Plan, as will be seen from column 3 of the above table.
Similarly, as regards rural electrification the position of Gujarat as on March 31, 1964 was also not .very favourable as compared with that of many other States. This is indicated in the following table :
Source: The Financial Express, May 2, 1965.
Inspite of the fact that per capita consumption of electricity in Gujarat is much lower than in many other States and that out of the total of 18.376 villages only 1,700 villages (9 per cent) are expected to be electrified by the end of the Third Plan, the installed generating capacity in Gujarat will increase from 316.2 mW in 1960-61 to 618 mW only at the end of the Third Plan (1965-66). The requirement of electricity in Gujarat by the end of the Third Plan has been estimated ar 742 mW so that there will be a net deficit of 124 mW. There is likely to be a tremendous growth in the demand for power during coming years as the proposed gigantic petrochemical complex and the discovery of some important minerals like lignite, bauxite, etc, has opened a vast scope for starting several new industries in the State. According to the Second Annual Power Survey, the demand for power in Gujarat during the Fourth Plan will be 1050 mW, in the Fifth Plan 1960 mW and in the Sixth Plan 2,600 mW.
Here it should also be noted that electricity rates in Gujarat are perhaps the highest in India. The rate in Gujarat varies from 17 P to 21 P per unit while in Punjab it varies from 5.93 P to 6.04 P, in Madras from 2.01 P to 7.63 P and in West Bengal from 6.35 P to 7.89 P.
Sources: (1) Budget in Brief, Gujarat State, 1960-61, 1962-63. Bureau of Economics and Statistics, Gujarat Govern-ment
1483
THE ECONOMIC WEEKLY September 25, 1965
Another important factor which has retarded the industrial growth of Gujarat is the inadequacy of roads. In 1961, there were 14,055 miles of roads in Gujarat out of which 6,905 were metalled and 7,150 miles non-metalled. The target fixed for road construction in the Third Plan is 3,474 miles, out of which t i l l 1963-64 only 1;236 miles of metalled roads and 827 miles of non-metalled roads were built. This means that only 56.5 per cent of the target had been achieved in the first three years. The position of Gujarat in respect of roads per sq mile remains unsatisfactory as compared with many other States. This is indicated in the following table :
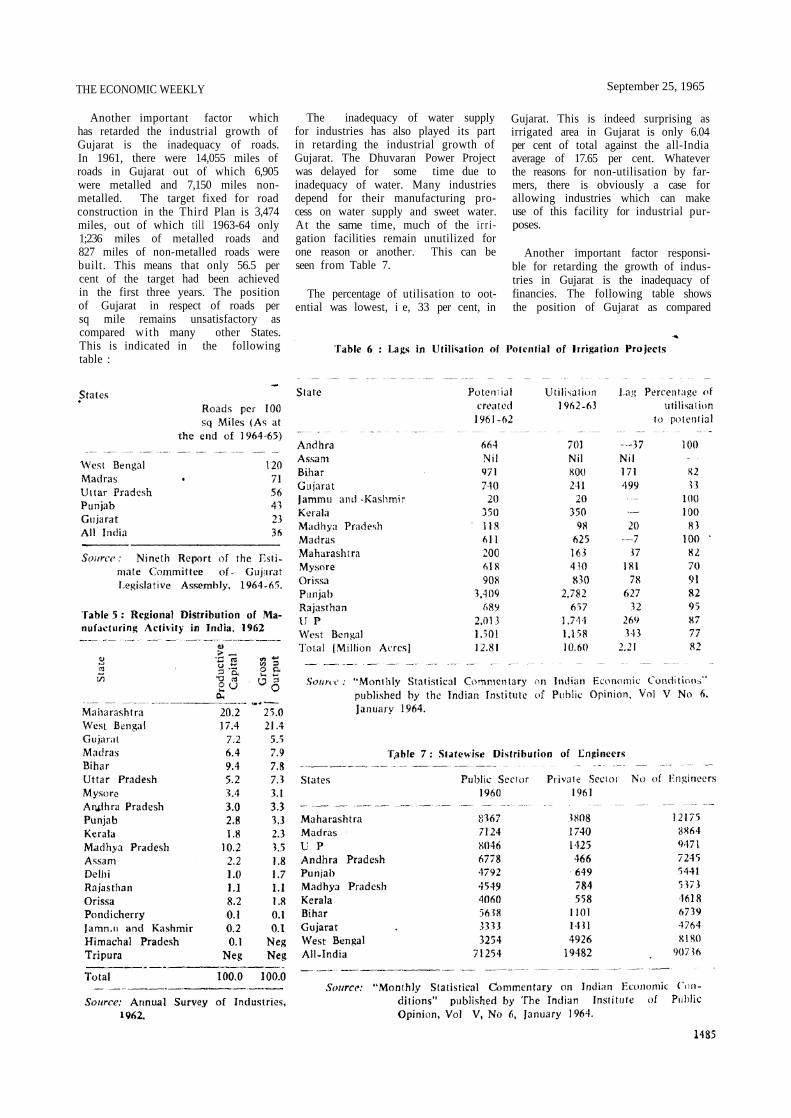
The inadequacy of water supply for industries has also played its part in retarding the industrial growth of Gujarat. The Dhuvaran Power Project was delayed for some time due to inadequacy of water. Many industries depend for their manufacturing process on water supply and sweet water. At the same time, much of the i r r i gation facilities remain unutilized for one reason or another. This can be seen from Table 7.
The percentage of utilisation to oot-ential was lowest, i e, 33 per cent, in
Gujarat. This is indeed surprising as irrigated area in Gujarat is only 6.04 per cent of total against the all-India average of 17.65 per cent. Whatever the reasons for non-utilisation by farmers, there is obviously a case for allowing industries which can make use of this facility for industrial purposes.
Another important factor responsible for retarding the growth of industries in Gujarat is the inadequacy of financies. The following table shows the position of Gujarat as compared
September 25, 1965 T H E E C O N O M I C W E E K L Y
to that of other States in respect of loans sanctioned by State Financial Corporation, upto March 1965 ;
physical facilities and resources available hut also on the availability of technical personnel. Here also the position of Gujarat is unsatisfactory as revealed by the recent study by the Institute of Applied Manpower Research. The position of Gujarat in this respect is indicated in Table 7.
Besides these factors, delay in granting licences, in acquiring land or loan and in obtaining essential raw-materials, particularly non-ferrous metals, are other factor which retard the in dustrial development of Gujarat. In fact one is surprised to note that the quota fixed for essential raw materials like non-ferrous metals, pig-iron, hardcoke, etc, by the Government of India is on the basis of the
capacity which existed before Gujarat came into existence. This is obviously inequitous to new and expanding industries.
We have analysed above the performance of Gujarat's economy since the inception of the State. The emerging picture is definitely not very encouraging. We feel that unless sufficient awareness of the problems responsible for retarding industrial growth is shown both by the Government and by the private sector the target of per capita output of Rs 445 by 1975-76, implying a 54 per cent increase in the net output of agriculture and 170 per cent increase in the net value of industrial output, would be impossible to achieve.
1486