Embed Size (px)
Citation preview

The Effectiveness of Management-By-Walking-Around: A Randomized Field Study
CitationTucker, Anita L., and Sara J. Singer. "The Effectiveness of Management-By-Walking-Around: A Randomized Field Study." Production and Operations Management (forthcoming).
Published Versionhttp://onlinelibrary.wiley.com/doi/10.1111/poms.12226/abstract
Permanent linkhttp://nrs.harvard.edu/urn-3:HUL.InstRepos:12534914
Terms of UseThis article was downloaded from Harvard University’s DASH repository, and is made available under the terms and conditions applicable to Open Access Policy Articles, as set forth at http://nrs.harvard.edu/urn-3:HUL.InstRepos:dash.current.terms-of-use#OAP
Share Your StoryThe Harvard community has made this article openly available.Please share how this access benefits you. Submit a story .
Accessibility
The Effectiveness of Management-By-Walking-Around: A Randomized Field Study
Anita L. Tucker, Harvard Business School
Sara J. Singer, Harvard School of Public Health
September 4, 2013
Abstract
Management-By-Walking-Around (MBWA) is a widely adopted technique in hospitals that involves
senior managers directly observing frontline work. However, few studies have rigorously examined
its impact on organizational outcomes. This paper examines an improvement program based on
MBWA in which senior managers observe frontline employees, solicit ideas about improvement
opportunities, and work with staff to resolve the issues. We randomly selected 19 hospitals to
implement the 18-month long MBWA-based improvement program; 56 work areas participated. We
find that the program, on average, had a negative impact on performance. To explain this surprising
finding, we use mixed methods to examine the impact of the work area’s problem solving approach.
Results suggest that prioritizing easy-to-solve problems was associated with improved performance.
We believe this was because it resulted in greater action taking. A different approach was
characterized by prioritizing high value problems, which was not successful in our study. We also
find that assigning to senior managers responsibility for ensuring that identified problems get
resolved resulted in better performance. Overall, our study suggests that senior managers’ physical
presence on their organizations’ frontlines was not helpful unless it enabled active problem solving.
Funding provided by Agency for Healthcare Research and Quality RO1 HSO13920.
Additional funding from Fishman Davidson Center at Wharton.
1
1. Introduction
Hospitals face an imperative to improve quality of care and decrease medical errors that harm
patients. Healthcare thought leaders and policy makers have advocated for the adoption of
“Management-By-Walking-Around” (MBWA) to achieve these goals, resulting in widespread
adoption in the U.S. and the U.K. (Institute for Healthcare Improvement 2004, National Patient
Safety Agency 2011). These types of programs—in which senior managers visit the frontlines to
work with staff to identify and resolve obstacles—came to the attention of hospitals with the
publication of one healthcare system’s success at improving safety climate through its MBWA-based
intervention (Frankel et al. 2003).
Despite the intuitive appeal of MBWA, evidence on the program’s efficacy is mixed. Of seven
hospitals that implemented an MBWA-based program, only two sustained the effort over a three-
year period (Frankel et al. 2008). Those two reported a positive impact on staff perceptions of safety
climate, but the effect on the five aborting hospitals was not reported. A study of one Veterans
Affairs hospital found that patient safety climate worsened on two units that implemented the
program, while it improved or stayed the same on two control units that did not implement the
program (Singer et al. 2013). Another found that hospitals that implemented a general improvement
program with an MBWA component did not improve on a variety of measures compared to control
hospitals (Benning et al. 2011).
To test more systematically the impact of MBWA-based improvement programs, we
implemented one such program in 19 randomly selected hospitals. We compared nurses’
perceptions of improvement in performance in work areas that implemented the program to the
same type of areas at 68 randomly selected control hospitals that did not implement the program.
Our study thus sheds insight into the program’s generalizability beyond those where senior
managers decided on their own to implement such a program. We find that, on average, our
MBWA-based program had a negative impact on nurse perceptions of performance, suggesting that
2
senior manager presence on hospital frontlines to solicit improvement ideas could be detrimental to
workers’ perceptions. However, we find that our MBWA-based program was associated with
improved perceptions of performance under two conditions: (1) when a higher percentage of solved
problems were considered “easy” to solve, enabling more problem solving, and (2) when senior
managers took responsibility for ensuring that identified problems were resolved. This suggests that
the action-taking that results from the program, rather than the mere physical presence of the senior
managers, is what positively impacts the front line staff.
2. MBWA-based Improvement Program’s Impact on Performance
Research has found that quality improvement programs that solicit frontline workers’ ideas, such as
MBWA, can have a beneficial impact on organizational outcomes (Dow et al. 1999, Powell 1995).
MBWA relies on managers to make frequent, learning-oriented visits to their organization’s
frontlines to observe work and solicit employees’ opinions (Packard 1995). Hewlett-Packard, the
company in which MBWA originated, attributed its success using MBWA to good listening skills,
willing participation, a belief that every job is important and every employee is trustworthy, and a
culture where employees felt comfortable raising concerns (Packard 1995). MBWA is similar to the
Toyota Production System’s “gemba walks” (Mann 2009, Toussaint et al. 2010, Womack 2011). In a
gemba walk, managers go to the location where work is performed, observe the process, and to talk
with the employees (Mann 2009). The purpose is to see problems in context, which aids problem
solution (Mann 2009, Toussaint et al. 2010, Womack 2011).
MBWA has resulted in positive organizational change (Frankel et al. 2003, Pronovost et al.
2004). One explanation is that MBWA leads to successful problem resolution because seeing a
problem in context improves managers’ understanding of the problem, its negative impact, and its
causes; increasing their motivation and ability to work with frontline staff and managers to resolve
the issue (Mann 2009, Toussaint et al. 2010, von Hippel 1994, Womack 2011). Theory further
3
suggests that MBWA’s repeated cycles of identifying and resolving problems may create an
organizational capability for improvement that reduces the cost of future improvement efforts,
creating a positive dynamic (Fine 1986, Fine and Porteus 1989, Ittner et al. 2001). This virtuous
cycle is further strengthened because communication from frontline workers about problems aligns
manager’s perspectives with customers’ experiences (Hansen et al. 2010, Hofmann and Mark 2006,
Huang et al. 2010, Singer et al. 2009), enabling managers to effectively allocate scarce resources
among the organization’s multiple improvement opportunities. Performance is also enhanced
because managers’ presence on the frontlines sends a visible signal that the organization is serious
about resolving problems. This increases employees’ beliefs that leadership values improvement,
which in turn spurs employees to engage in the discretionary behaviors necessary for process
improvement (McFadden et al. 2009, Zohar and Luria 2003). For these reasons, we hypothesize
that MBWA will positively impact performance.
Hypothesis 1 (H1). Participation in a MBWA-type program leads to improved performance.
2.1. The Effect of Problem Solving Approach
Although we hypothesize a positive impact from MBWA, programs that solicit employee
suggestions can uncover more problems than an organization can resolve given its limited problem
solving resources (Bohn 2000, Frankel et al. 2003, Repenning and Sterman 2002). When this
happens, the organization’s problem-solving support personnel must decide which of the identified
issues they will work to resolve and which ones will be ignored or delayed (Keating et al. 1999,
Morrison and Repenning 2011). Thus, an MBWA’s program’s success may be contingent upon
which problems the organization decides to address.
One approach to prioritizing problems would be to address issues that are causing—or have the
potential to cause—large disruptions. A high value prioritization approach ranks problems according to a
value score and solves the highest valued problems. This approach is part of many structured
approaches to improvement, such as 6-sigma and risk management (Anderson et al. 2013). Hospital
4
incident reporting systems (Bagian et al. 2001) and MBWA-based programs (Frankel et al. 2003) use
this approach to calculate a problem’s “value” by multiplying the problem’s scores for severity and
frequency of occurrence (Bagian et al. 2001, Frankel et al. 2003). The organization would then
resolve the highest value problems first, followed by the second highest, continuing until problem
solving resources are depleted or remaining problems fall below a threshold value (Bagian et al.
2001). Surfacing and solving these high value problems should yield substantial gain in performance
(Bagian et al. 2001, Girotra et al. 2010). This approach ensures that limited resources are preserved
for high value problems (Frankel et al. 2003). Prioritizing high-value problems may also be helpful
because it enables low value problems to consume few resources, which queuing theory suggests is
necessary to prevent the queue of unsolved problems from growing unmanageably long (Bohn
2000). The potential negative impact of not resolving all identified problems is predicted to be low
because ignored problems constitute the “trivial many” that do not have a large negative impact on
performance (Juran et al. 1999). We thus predict that tending toward a high value prioritization
approach will be associated with improved performance.
Hypothesis 2 (H2): Work areas that resolve a higher percentage of high value problems will have greater
improvement in performance than work areas that solve a lower percentage of high value problems.
Another approach is to prioritize problems that are easy to solve (Johnson 2003, Repenning and
Sterman 2002). An easy-to-solve prioritization approach enables the organization to address problems
that are straightforward and quick to remedy—the so-called “low hanging fruit”. This approach may
free up resources for addressing problems because the more formal approach of assigning a
prioritization score based on severity and occurrence has required significant resources in the case of
incident reporting systems in both aviation and healthcare (Johnson 2003).
An easy-to-solve prioritization approach may also be helpful because the cumulative benefit of
resolving many small problems can add up to be a significant source of improvement (Jimmerson et
al. 2005). It may also be that organizations need to address basic, fundamental problems before they
5
can benefit from trying to address more complex organizational issues. Problem solving efforts are
most successful when the organization uses relatively straightforward problems to develop sufficient
problem-solving capacity before trying to tackle larger, more complex issues (Keating et al. 1999,
Morrison and Repenning 2011). Addressing easy-to-solve problems enables frequent problem
solving cycles, which further develops employees’ expertise at problem solving (Adler et al. 2003).
These dynamics suggest that organizational problem solving capacity is more like a muscle that
strengthens with exercise rather than a resource that gets depleted with use (Fine 1986, Fine and
Porteus 1989, Ittner et al. 2001). Finally, research has found that major accidents typically result
from an unpredictable combination of small magnitude problems rather than from a single large
magnitude problem (Perrow 1984, Reason 2000). According to the “Swiss Cheese Theory,”
multiple small-scale problems in an organization’s defensive layers can align in an unfortunate way
that enables an error to harm the customer (Cook and Woods 1994, Reason 2000). Consequently,
resolving seemingly low value problems can be beneficial because they otherwise might contribute
to the next major accident (Perrow 1984). For these reasons, we hypothesize that tending toward an
easy-to-solve prioritization approach will be associated with improved performance.
Hypothesis 3 (H3): Work areas that solve a higher percentage of easy-to-solve problems will have greater
improvement in performance than work areas that solve a lower percentage of easy-to-solve problems.
2.2. The Role of Senior Managers in Problem Solving
Advocates have proposed that successful MBWA implementation requires senior managers to take
responsibility for ensuring that problems are resolved (Frankel et al. 2005, Pronovost et al. 2004).
This recommendation would seem to contradict the quality improvement literature, which
emphasizes frontline employees’ involvement in identifying and resolving issues (Jimmerson et al.
2005). However, quality improvement research has found that both manager support and employee
engagement are necessary (Dow et al. 1999, Kaplan et al. 2012, Samson and Terziovski 1999).
Senior managers can be helpful to frontline workers’ resolution efforts because they control financial
6
resources needed to address issues that involve capital investment (Carroll et al. 2006). They also
possess the perspective necessary to solve problems that cross organizational boundaries
(MacDuffie 1997). Furthermore, resolving problems requires that people take time away from their
direct production responsibilities (Repenning and Sterman 2002, Victor et al. 2000), which can be
difficult for frontline employees. Senior managers can authorize frontline workers to spend time on
resolution efforts (Repenning and Sterman 2002). Therefore, we hypothesize that assigning to senior
managers the responsibility for ensuring that a problem gets addressed will achieve better results.
Hypothesis 4 (H4). Work areas with a higher percentage of problems assigned to a senior manager to ensure
resolution exhibit greater improvement than those with a lower percentage of problems assigned to a senior manager.
These four hypotheses outline the theoretical links between our MBWA-based program and
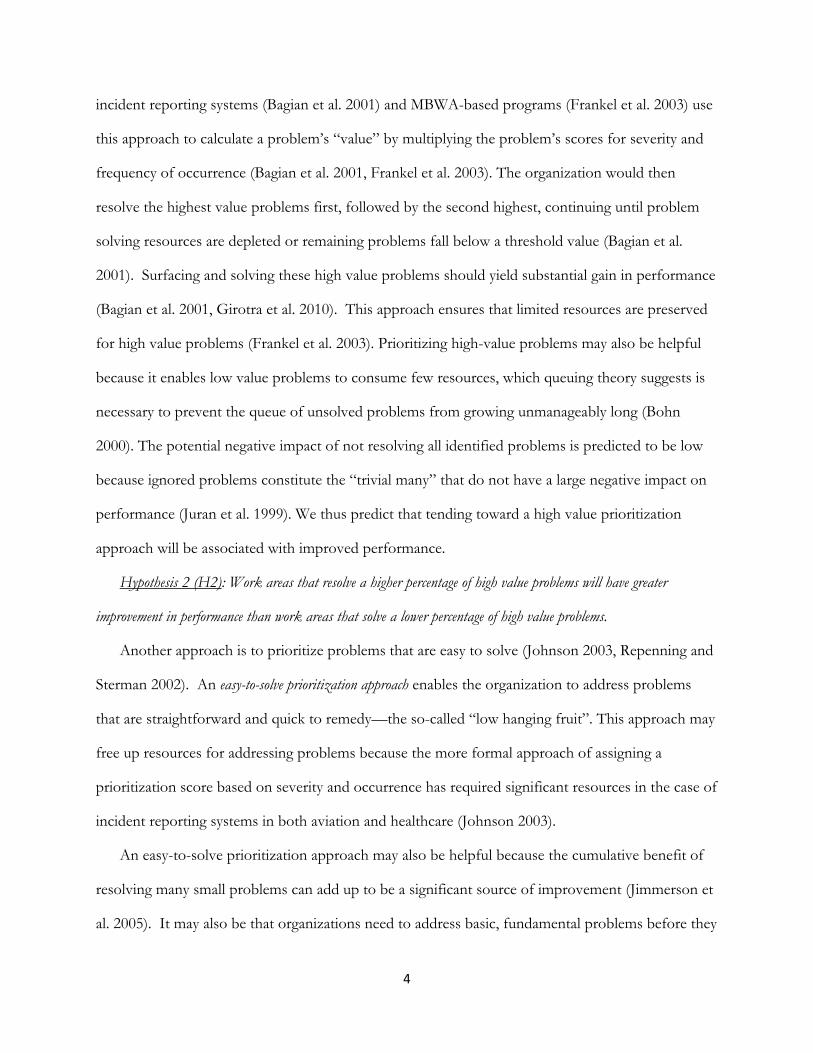
improved performance. Figure 1 depicts these relationships.
Figure 1. Model of Management-By-Walking-Around’s Impact on Performance
MBWA
Program Performance
Problem solving activities
used in MBWA
Address high-
value problems
Address “easy-to-
solve” problems
Managers ensure
problems are
resolved
H1+
H2+
H3+
H4+
7
3. Methodology
We test our hypotheses in a field study of U.S. hospitals randomly selected to participate in a patient
safety research study, with a subset of the hospitals randomly selected (a second time) to implement
our MBWA-based program. The program was launched in January 2005 and lasted for 18 months.
3.1 The MBWA-based Program
We drew on prior research to design our MBWA-based program (Frankel et al. 2008, Pronovost et
al. 2004, Thomas et al. 2005). It consisted of repeated cycles of senior manager-staff interaction,
debriefing, problem solving, and follow up. Senior managers, such as the Chief Executive,
Operating, Medical, and Nursing Officers (CEO, COO, CMO, and CNO, respectively), interacted
with frontline staff in a work area to generate, select, and solve improvement ideas. The work area
manager was also involved in the selection and solution activities. Senior manager interactions took
two forms: visits, called “work system visits,” to work areas to observe frontline work; and special
meetings, called “safety forums,” with a larger group of frontline staff from the area to discuss safety
concerns. The activities were coordinated with the work area manager.
In work system visits, four senior managers would spend 30 minutes to two hours visiting the
same work area. The senior managers would each observe a different process, such as medication
administration, or a different person, such as a nurse or physician, to shed cross-disciplinary insight
into the work done in the area. The purpose was to build senior managers’ understanding of the
frontline work context and gather grounded information about problems (Frankel et al. 2008).
Senior managers also facilitated a safety forum in the work area, which was an informal meeting
between senior managers and the frontline staff from the work area, held in the work area, during
which the staff talked about their work area’s safety weaknesses and strengths. We added this
component to our MBWA-based intervention for two reasons. First, a San Diego children’s
hospital improved its organizational climate by holding meetings where frontline staff spoke directly
to the hospital CEO about their concerns and ideas (Sobo and Sadler 2002). Second, research found
8
that an MBWA-based program only succeeded in improving the perceptions of frontline staff who
participated in a work system visit (Thomas et al. 2005), which suggested that relying only on work
system visits might be insufficient to change organizational climate.
The MBWA-based program continued with a “debrief meeting,” which organized information
collected from the work system visits and safety forums. Senior managers attended, as did work area
managers, selected frontline workers, and the hospitals’ patient safety officers. The group compiled
the improvement ideas identified, discussed and in some work areas prioritized them, and decided
next steps, ranging from doing nothing to suggesting solutions and assigning responsibility. Action
to address problems selected for resolution followed the debriefing. Managers were encouraged to
communicate with staff about implementation efforts, describing what changes, if any, were made in
response to identified ideas. Patient safety officers entered the ideas generated and actions taken into
an electronic spreadsheet we provided and sent this spreadsheet to our research team for analysis.
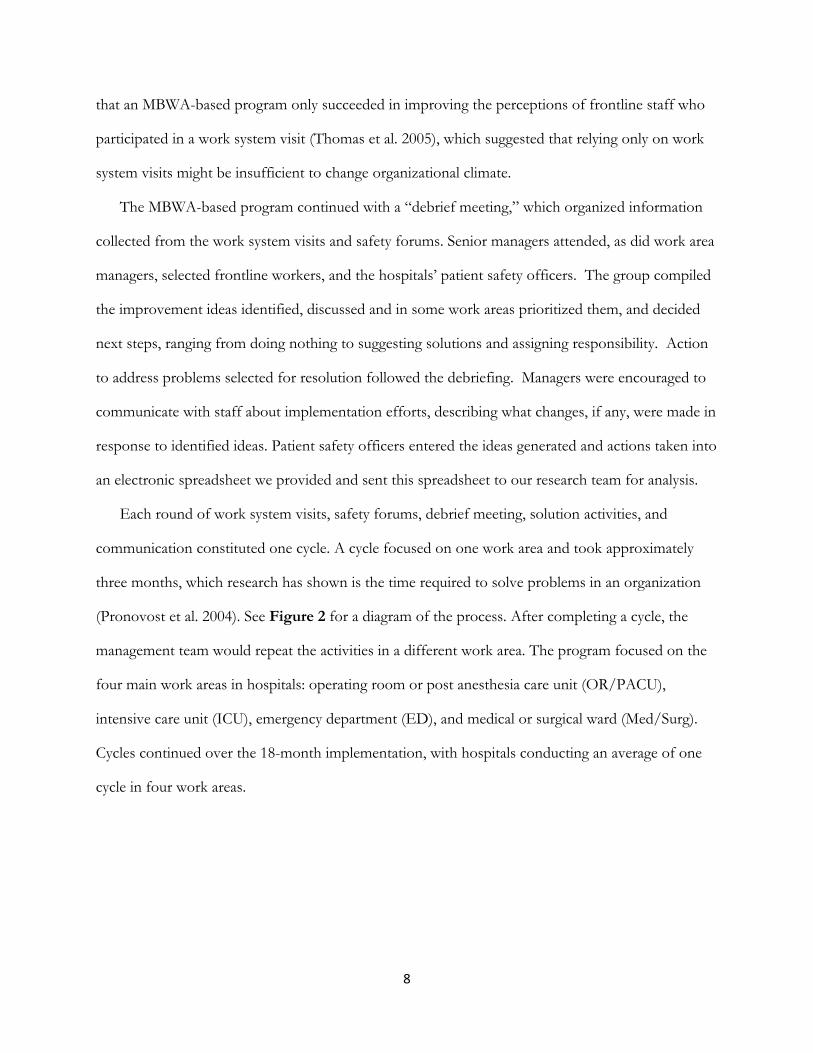
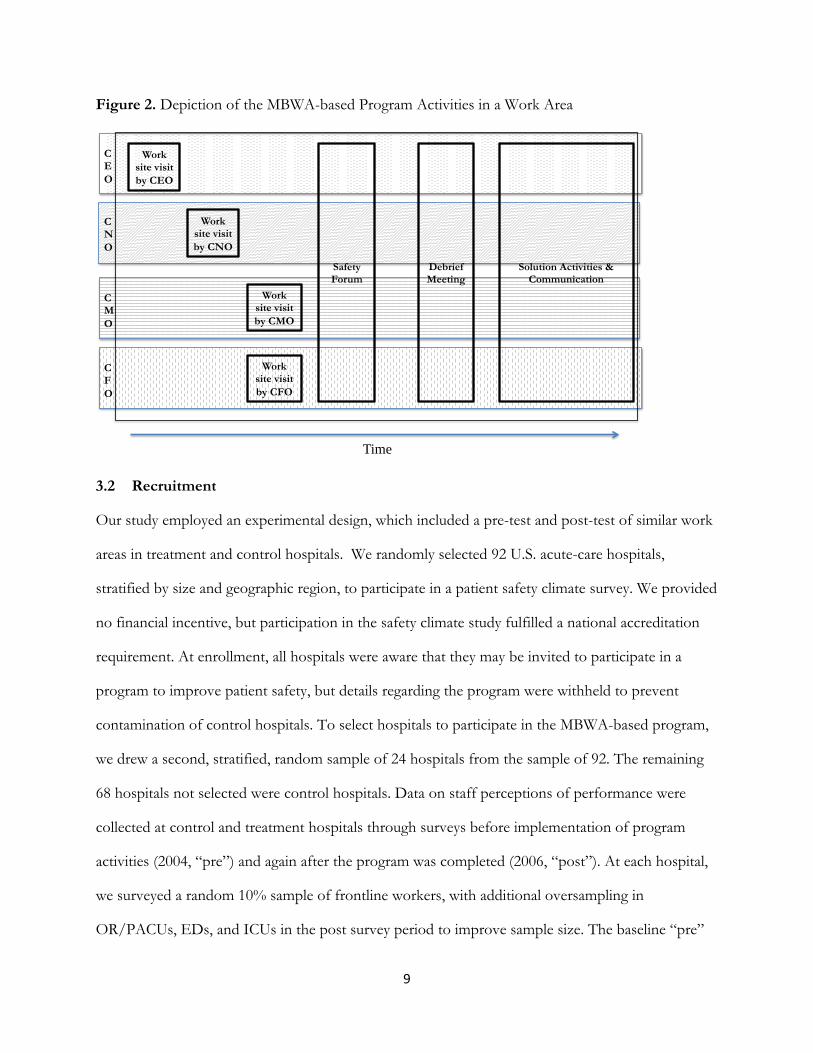
Each round of work system visits, safety forums, debrief meeting, solution activities, and
communication constituted one cycle. A cycle focused on one work area and took approximately
three months, which research has shown is the time required to solve problems in an organization
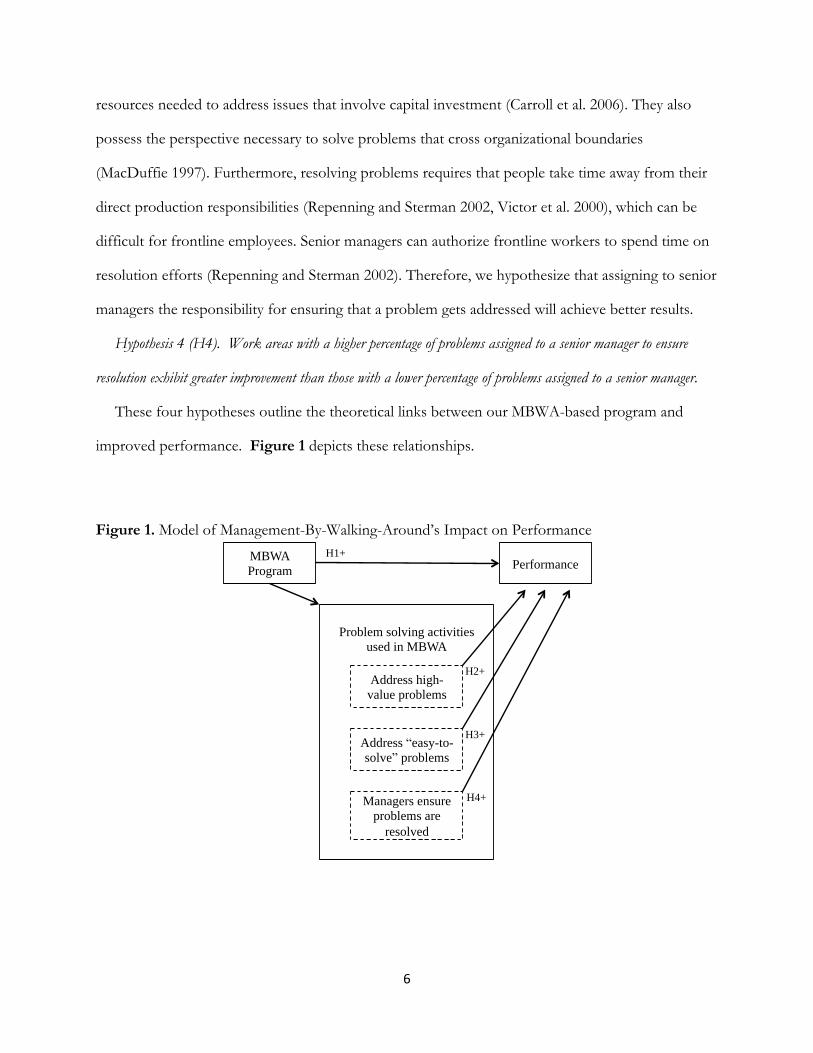
(Pronovost et al. 2004). See Figure 2 for a diagram of the process. After completing a cycle, the
management team would repeat the activities in a different work area. The program focused on the
four main work areas in hospitals: operating room or post anesthesia care unit (OR/PACU),
intensive care unit (ICU), emergency department (ED), and medical or surgical ward (Med/Surg).
Cycles continued over the 18-month implementation, with hospitals conducting an average of one
cycle in four work areas.
9
Figure 2. Depiction of the MBWA-based Program Activities in a Work Area
3.2 Recruitment
Our study employed an experimental design, which included a pre-test and post-test of similar work
areas in treatment and control hospitals. We randomly selected 92 U.S. acute-care hospitals,
stratified by size and geographic region, to participate in a patient safety climate survey. We provided
no financial incentive, but participation in the safety climate study fulfilled a national accreditation
requirement. At enrollment, all hospitals were aware that they may be invited to participate in a
program to improve patient safety, but details regarding the program were withheld to prevent
contamination of control hospitals. To select hospitals to participate in the MBWA-based program,
we drew a second, stratified, random sample of 24 hospitals from the sample of 92. The remaining
68 hospitals not selected were control hospitals. Data on staff perceptions of performance were
collected at control and treatment hospitals through surveys before implementation of program
activities (2004, “pre”) and again after the program was completed (2006, “post”). At each hospital,
we surveyed a random 10% sample of frontline workers, with additional oversampling in
OR/PACUs, EDs, and ICUs in the post survey period to improve sample size. The baseline “pre”
Work site visit
by CEO
Work site visit
by CNO
Work site visit
by CMO
Safety Forum
Debrief Meeting
Solution Activities & Communication
Time
Work site visit
by CFO
CE
O
C
N
O
CM
O
C
F
O
10
response rate was 52%; and the follow-up “post” response rate was 39%. For our analyses, we used
data from registered and licensed vocational nurses (n=1,117 pre and n=903 post).
Of the 24 treatment hospitals, 20 completed the program in at least two work areas. Of the four
that did not complete the treatment, one went out of business, one was purchased, and two
experienced significant senior management turnover. As a result, they were unable to complete more
than one cycle of activities and did not provide data. We thus excluded these four from our analysis.
There was no difference in staff perceptions of performance in the pre period between the four
hospitals that dropped out of the treatment and the 20 that did not. Of the original 68 control
hospitals, 48 completed the posttest survey, making an initial total sample of 68 hospitals. There was
no difference on survey measures in the pre period between the 20 control hospitals that dropped
out of the post survey and remaining hospitals. There was also no difference between treatment and
control work areas on pre period measures of staff perceptions of performance.
3.3 Data and Measures
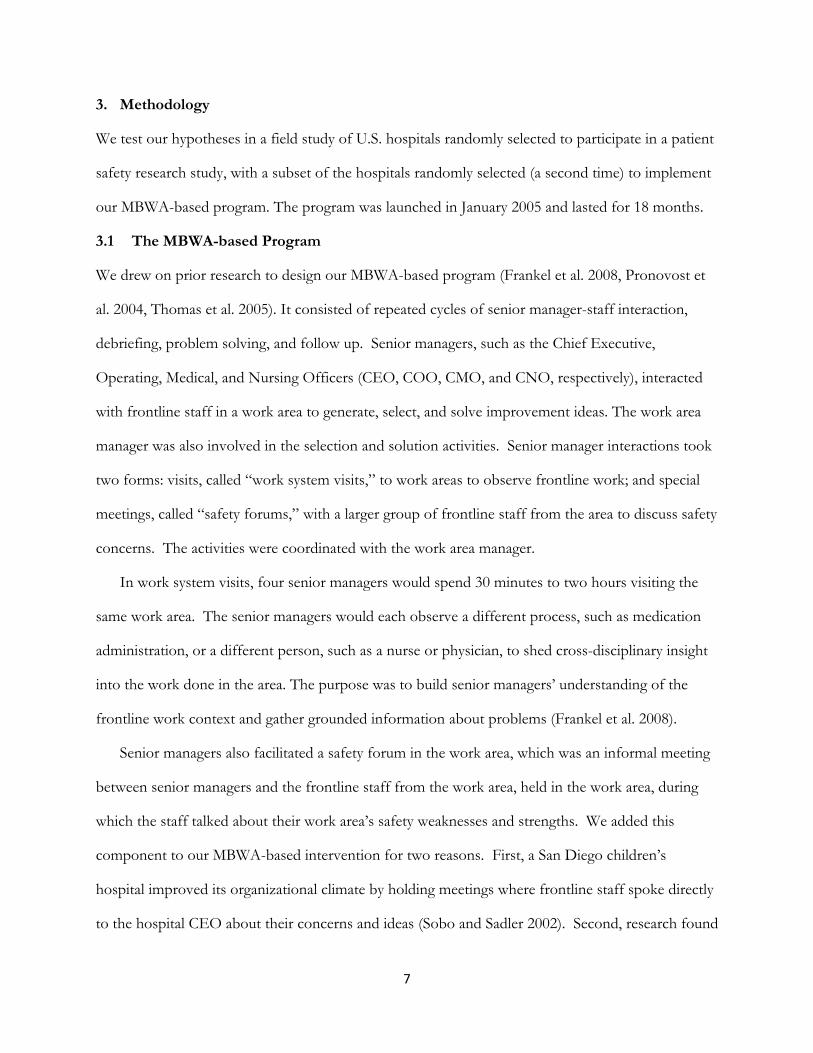
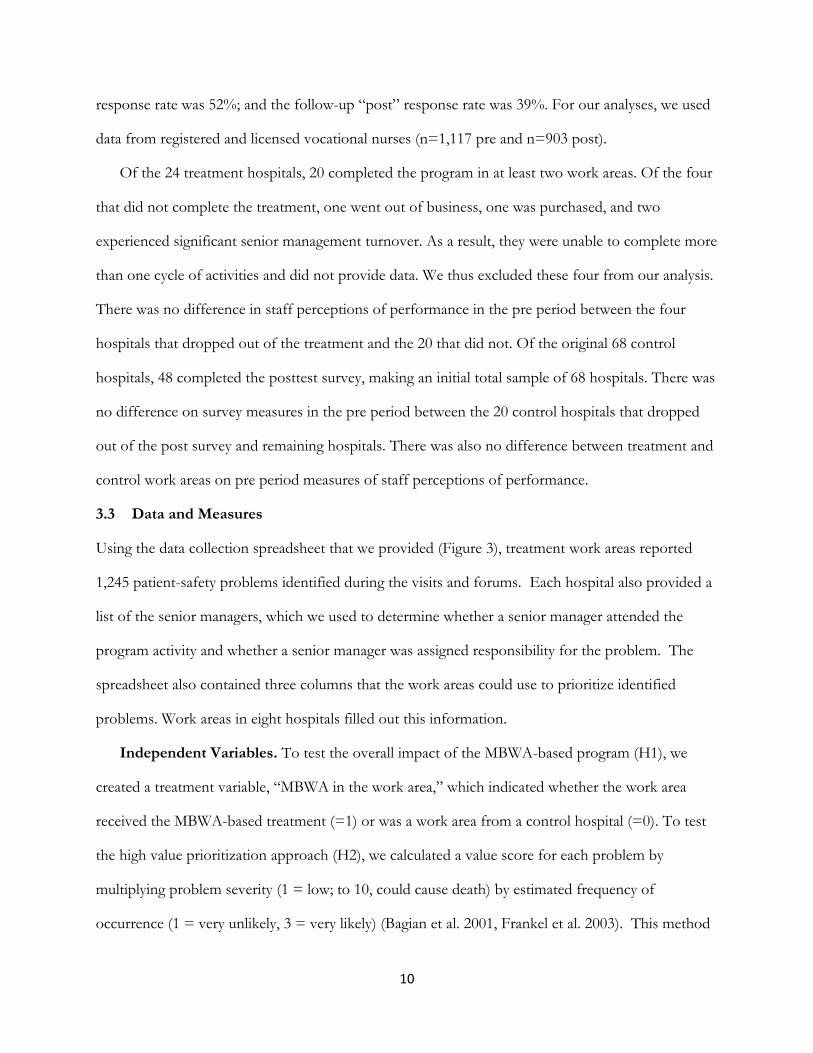
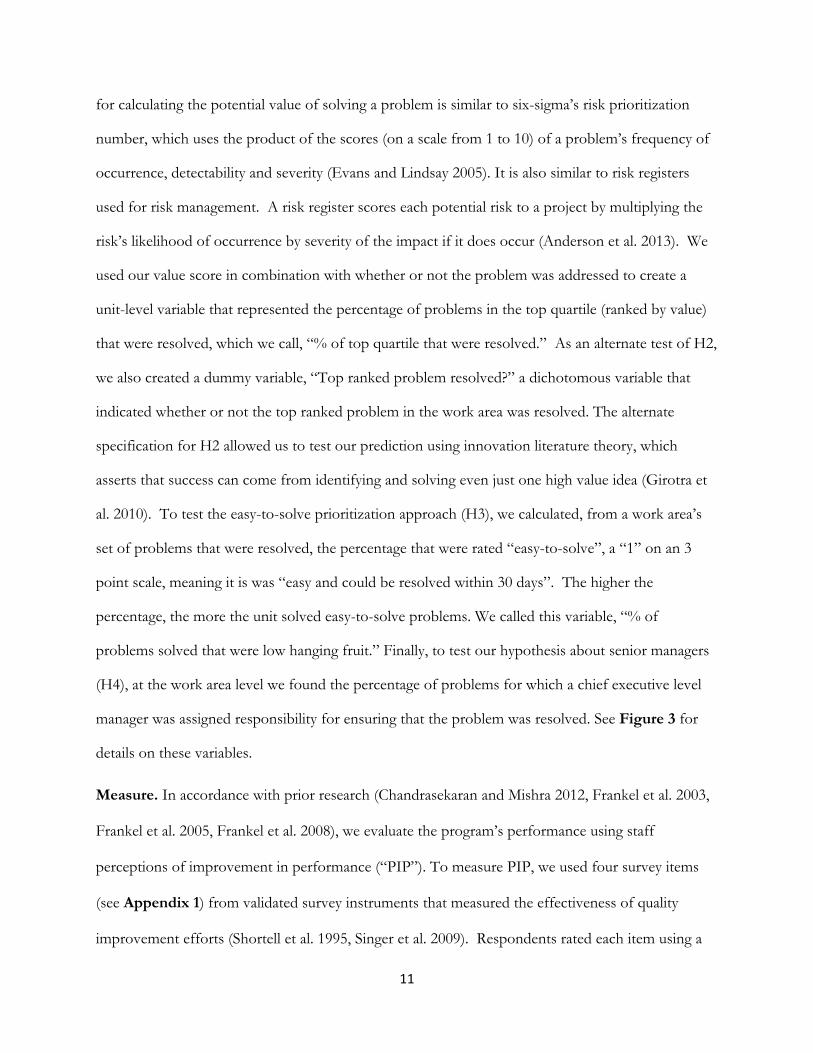
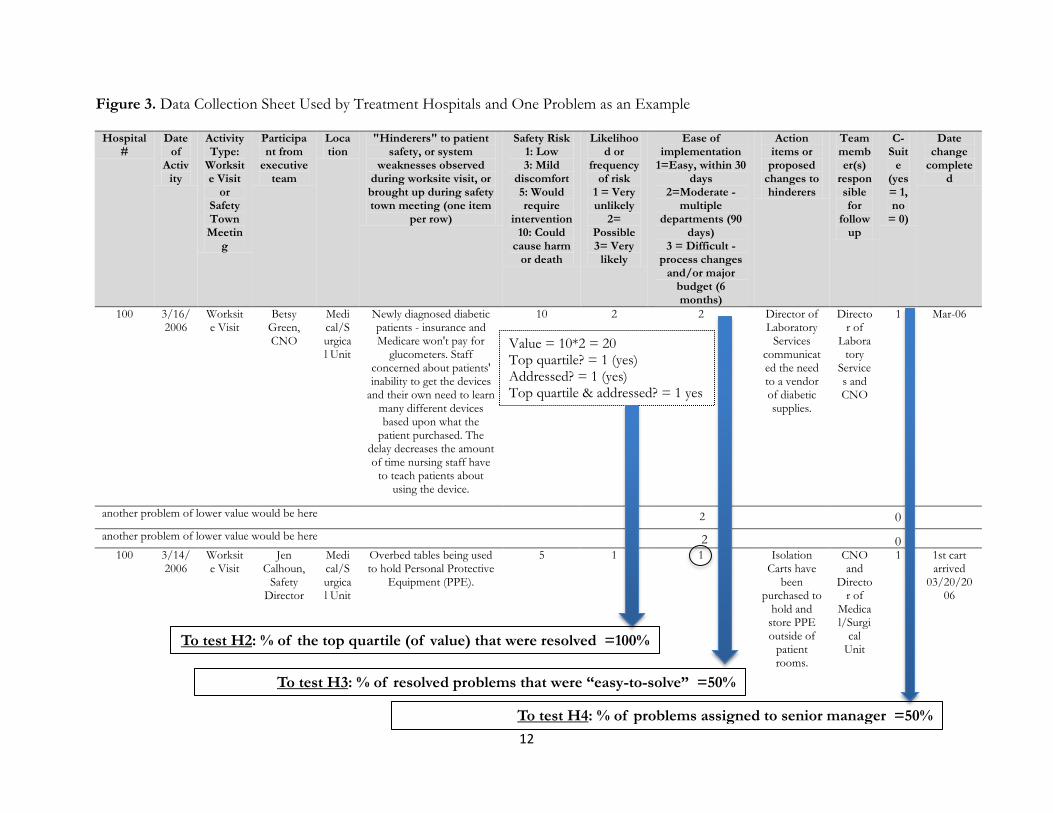
Using the data collection spreadsheet that we provided (Figure 3), treatment work areas reported
1,245 patient-safety problems identified during the visits and forums. Each hospital also provided a
list of the senior managers, which we used to determine whether a senior manager attended the
program activity and whether a senior manager was assigned responsibility for the problem. The
spreadsheet also contained three columns that the work areas could use to prioritize identified
problems. Work areas in eight hospitals filled out this information.
Independent Variables. To test the overall impact of the MBWA-based program (H1), we
created a treatment variable, “MBWA in the work area,” which indicated whether the work area
received the MBWA-based treatment (=1) or was a work area from a control hospital (=0). To test
the high value prioritization approach (H2), we calculated a value score for each problem by
multiplying problem severity (1 = low; to 10, could cause death) by estimated frequency of
occurrence (1 = very unlikely, 3 = very likely) (Bagian et al. 2001, Frankel et al. 2003). This method
11
for calculating the potential value of solving a problem is similar to six-sigma’s risk prioritization
number, which uses the product of the scores (on a scale from 1 to 10) of a problem’s frequency of
occurrence, detectability and severity (Evans and Lindsay 2005). It is also similar to risk registers
used for risk management. A risk register scores each potential risk to a project by multiplying the
risk’s likelihood of occurrence by severity of the impact if it does occur (Anderson et al. 2013). We
used our value score in combination with whether or not the problem was addressed to create a
unit-level variable that represented the percentage of problems in the top quartile (ranked by value)
that were resolved, which we call, “% of top quartile that were resolved.” As an alternate test of H2,
we also created a dummy variable, “Top ranked problem resolved?” a dichotomous variable that
indicated whether or not the top ranked problem in the work area was resolved. The alternate
specification for H2 allowed us to test our prediction using innovation literature theory, which
asserts that success can come from identifying and solving even just one high value idea (Girotra et
al. 2010). To test the easy-to-solve prioritization approach (H3), we calculated, from a work area’s
set of problems that were resolved, the percentage that were rated “easy-to-solve”, a “1” on an 3
point scale, meaning it is was “easy and could be resolved within 30 days”. The higher the
percentage, the more the unit solved easy-to-solve problems. We called this variable, “% of
problems solved that were low hanging fruit.” Finally, to test our hypothesis about senior managers
(H4), at the work area level we found the percentage of problems for which a chief executive level
manager was assigned responsibility for ensuring that the problem was resolved. See Figure 3 for
details on these variables.
Measure. In accordance with prior research (Chandrasekaran and Mishra 2012, Frankel et al. 2003,
Frankel et al. 2005, Frankel et al. 2008), we evaluate the program’s performance using staff
perceptions of improvement in performance (“PIP”). To measure PIP, we used four survey items
(see Appendix 1) from validated survey instruments that measured the effectiveness of quality
improvement efforts (Shortell et al. 1995, Singer et al. 2009). Respondents rated each item using a
12
Figure 3. Data Collection Sheet Used by Treatment Hospitals and One Problem as an Example
Hospital #
Date of
Activity
Activity Type:
Worksite Visit
or Safety Town Meetin
g
Participant from
executive team
Location
"Hinderers" to patient safety, or system
weaknesses observed during worksite visit, or brought up during safety town meeting (one item
per row)
Safety Risk 1: Low 3: Mild
discomfort 5: Would require
intervention 10: Could
cause harm or death
Likelihood or
frequency of risk
1 = Very unlikely
2= Possible 3= Very
likely
Ease of implementation
1=Easy, within 30 days
2=Moderate - multiple
departments (90 days)
3 = Difficult - process changes
and/or major budget (6 months)
Action items or proposed
changes to hinderers
Team member(s)
responsible for
follow up
C-Suit
e (yes = 1, no
= 0)
Date change
completed
100 3/16/2006
Worksite Visit
Betsy Green, CNO
Medical/Surgical Unit
Newly diagnosed diabetic patients - insurance and Medicare won't pay for
glucometers. Staff concerned about patients' inability to get the devices
and their own need to learn many different devices based upon what the
patient purchased. The delay decreases the amount of time nursing staff have
to teach patients about using the device.
10 2 2 Director of Laboratory
Services communicated the need to a vendor of diabetic supplies.
Director of
Laboratory
Services and CNO
1 Mar-06
another problem of lower value would be here
another problem of lower value would be here
100 3/14/2006
Worksite Visit
Jen Calhoun,
Safety Director
Medical/Surgical Unit
Overbed tables being used to hold Personal Protective
Equipment (PPE).
5 1 1 Isolation Carts have
been purchased to
hold and store PPE outside of
patient rooms.
CNO and
Director of
Medical/Surgi
cal Unit
1 1st cart arrived
03/20/2006
Value = 10*2 = 20 Top quartile? = 1 (yes) Addressed? = 1 (yes) Top quartile & addressed? = 1 yes
To test H2: % of the top quartile (of value) that were resolved =100%
0
0
To test H3: % of resolved problems that were “easy-to-solve” =50%
To test H4: % of problems assigned to senior manager =50%
2
2
13
5-point scale ranging from 1=strongly disagree to 5=strongly agree. Agreement indicated that
respondents thought quality and safety performance were improving. The scale exhibited high
reliability (Nunnally 1967), with a Cronbach’s alpha of 0.84 (n=1147 nurses) in the pre period and
0.88 (n=1103 nurses) in the post period.
We used perception of performance for four reasons. First, employee perceptions are an
important outcome because they influence behaviors, which in turn impact objective measures
(Zohar and Luria 2003). Second, staff perceptions of performance are a valid indicator of
performance (Ketokivi and Schroeder 2004). This is because employees are close to the work and
often know if system failures are decreasing or increasing. Research has found that nurses’
perceptions of safety are correlated with objective measures of safety outcomes, such as mortality,
readmissions, and length of stay (Hansen et al. 2010, Hofmann and Mark 2006, Huang et al. 2010,
Singer et al. 2009). Third, employee perceptions have been widely used as outcome measures in
operations management research because they enable comparison across organizations (Anderson et
al. 2013, Atuahene-Gima 2003, Bardhan et al. 2012, Chandrasekaran and Mishra 2012, Flynn et al.
1995, Kaynak 2003, Swink et al. 2006). Finally, the use of a perceptual measure was necessitated by
hospitals’ unwillingness to share data on safety incidents.
Our dependent variable was the change in PIP from the pre to the post period. The use of change
scores allowed us to examine change over time (Fitzmaurice 2001). To create a composite change
score for each work area, we used the pre data to calculate the mean of the four items for each
nurse, and then averaged by work area. We repeated this process for the post data, and subtracted
each work area’s pre score from its post score. We calculated intraclass correlations (ICC) and mean
interrater agreement score (rWG) to test whether aggregation of PIP was appropriate. Significant
intraclass correlations (ICC[1]=.06, F=5.69, p-value < .000, and ICC[2] = .82) supported
aggregation (Bliese 2000). The rWG for nurses’ rating of PIP was 0.60, which also was sufficient for
aggregation (Zellmer-Bruhn 2003). Furthermore, our use of a change score as our dependent
14
variables met the two conditions specified by Bergh and Fairbank (2002): the reliabilities of our
survey measures for PIP in pre and post periods were high (.84 and .86 respectively) and the
correlation between the measures from the two different time periods was low (=.24, p<.001). As
is common in studies using a change score (Bergh and Fairbank 2002), the correlation between the
change score and the PIP measure in the pre period was negative (= -0.67, p<.001). This indicates
that there was a greater opportunity for improvement in PIP among work areas with a low PIP in
the pre period (Fitzmaurice 2001). Therefore, to control for impact of a work area’s starting point
on the change in PIP, we included a dichotomous variable indicating whether PIP in the pre period
was in the lower quartile (“bottom quartile for 2004 PIP”). The variable was coded “1” if the work
area was in the bottom quartile of work areas in PIP in the pre period and “0” for all others. This
method enabled us to test for the change in PIP while controlling for a low starting point.
3.3.1 Control Variables. For H1, which tested the overall impact of our MBWA-based
program, the large sample size enabled us to include the following control variables: major teaching
hospital (1 = yes, 0 = no); Dun & Bradstreet’s measure of the hospital’s financial stress, with higher
numbers indicating a higher likelihood that the business will seek legal relief from creditors or cease
operations without paying creditors in full over the next 12 months; and a set of dummy variables
for the number of hospital beds (reference group = less than 100 beds; medium = 100 to 250 beds;
large = more than 250 beds); a set of dummy variables for type of work area (reference group =
non-clinical; OR/PACU; ICU; ED; Med/Surg unit; and other clinical unit). Data on size and
teaching came from the 2004 American Hospital Association Survey of Hospitals.
For the hypotheses about problem prioritization (H2 and H3), our sample size was limited to the
24 work areas that formally prioritized their problems in the data collection spreadsheet. As a result,
for these hypotheses we did not have a large enough sample size to include non-significant control
variables in our regression. However, our random selection of hospitals helps alleviate concerns that
our model may be subject to omitted variable bias (Antonakis 2010). We did not include control
15
variables for unit type (e.g. ED, ICU, OR/PACU) as none were significant and their inclusion did
not change our results. We also tested for hospital-level control variables, such as teaching status
and number of beds, but none were significant and their inclusion did not change our results. We
controlled for availability of “low hanging fruit”, which was the percentage of identified problems
that were rated as easy to solve. We also controlled for the average value of the top quartile of
identified problems.
Our regression equation for H4, the impact of a senior manager being assigned responsibility for
problem resolution, included the full set of 58 intervention work areas. We controlled for the
percentage of problems within a work area that were resolved (% of problems resolved) by coding a
problem as having had solution effort if there was evidence in the data set that action had been
taken to address the problem, and taking the average of this variable at the work area level. We also
controlled for the fidelity of implementation with the following variables: the number of work
system visits that were conducted, whether a work system visit was conducted by a senior manager
(1=yes, 0=no), and whether a safety forum was conducted in the area (1=yes, 0=no).
3.4 Sample Size and Analysis
We used linear regression with robust standard errors and clustered by hospital (Rabe-Hesketh and
Everitt 2004) in Stata 11.1™ to test our hypotheses. The Shapiro-Wilk test for all regressions
showed that the residuals were normally distributed (V close to 1 and p>.10) (Royston 1992).
Multicollinearity was also not an issue as all Variance Inflation Factors for all of our equations were
less than 2.5, well below the upper threshold of 10 (Chatterjee and Hadi 1986).
To test the overall impact of our MBWA-based program (H1), we use data from the four main
clinical work areas (OR/PACU, ICU, ED, Med/Surg). We had data for both pre and post PIP
measures from 58 intervention work areas in 20 treatment hospitals and 138 work areas in 48
control hospitals. However, missing data for a control variable (financial stress) in two intervention
work areas resulted in a final sample size of 56 intervention work areas. To test the impact of
16
problem selection (H2, H3), we used data from the 24 work areas from eight treatment hospitals
that formally prioritized their problems. Finally, to test the impact of senior manager assignment to
problem resolution (H4), we used the full set of intervention work areas (n=58).
3.5 Qualitative Data Collection and Analysis
During the intervention, we visited each treatment hospital to tour the clinical areas, and to observe
MBWA activities, including work system visits, safety forums, and debrief meetings. In addition, we
discussed and observed examples of changes implemented in response to problems identified
through the program to verify accuracy of the data submitted. There were no discrepancies. We also
conducted semi-structured interviews with a frontline staff member, a department manager, and the
CEO from each hospital (See Appendix 2). Interviews addressed the nature of performance
improvement in the hospital in general and as it related to implementing the MBWA-based program.
Interviews and notes from the meetings were recorded and transcribed. Investigators also wrote a
journal of the day’s activities from notes taken during the day. The journal and transcripts from each
hospital were combined into a single document, which served as our source of qualitative data.
After the intervention was complete, we used these qualitative data in combination with the
problem data submitted by the work areas to illuminate differences among work areas in the types of
issues identified, actions taken to resolve them, and managers’ attitudes. We analyzed transcripts
using the procedure described in Miles and Huberman (1994, p. 58-62). We initially used a list of
codes based on our interview questions. We read the transcripts multiple times, revising the codes as
we deepened our understanding of similarities and contrasts among the implementation of the
program. How the managers prioritized problems for solution efforts emerged as a main theme.
One author went through the qualitative data to select all relevant quotes for this theme. Both
authors independently reviewed the quotes while blinded from the performance results. We
compared our perceptions to come to consensus.
17
4. Results
4.1. Summary Statistics
Average PIP in the 56 treatment work areas was 3.78 in the pre period and 3.69 in the post period.
The difference of -.09 was not statistically significant at the 10% significance level. The same four
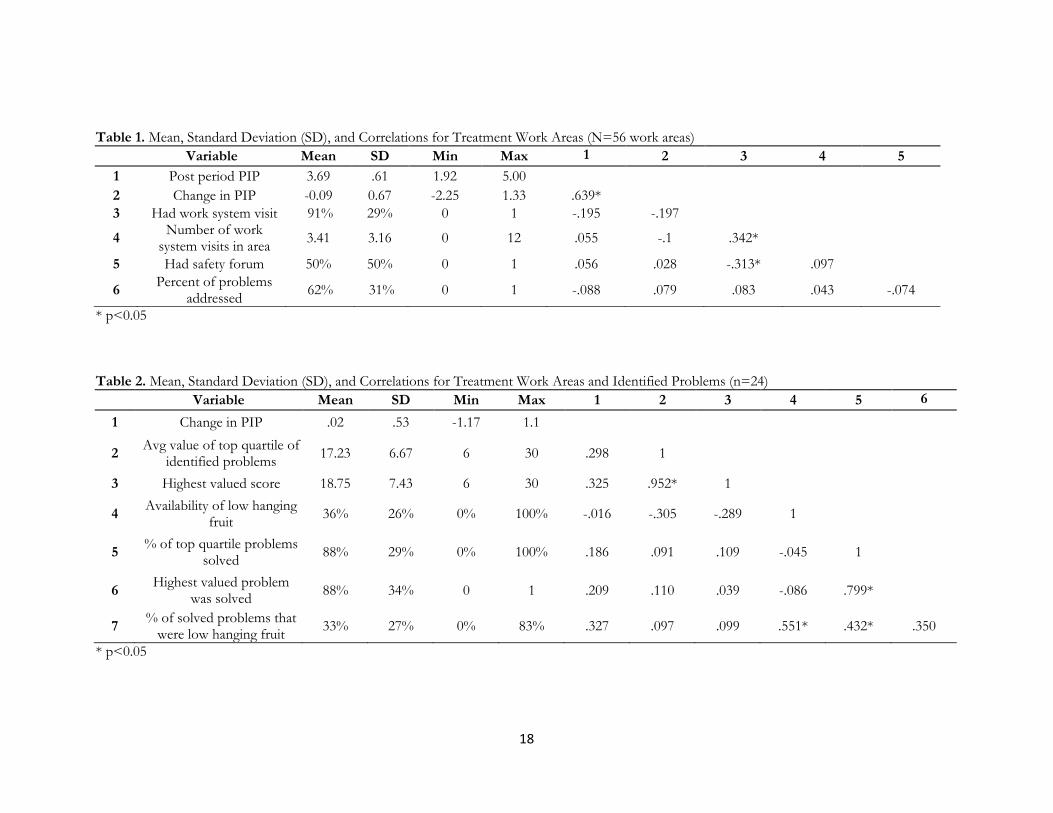
types of work areas (n=138) in control hospitals had a mean PIP of 3.8 in both time periods. Table
1 shows descriptive statistics. Using the subset of work areas that prioritized their problems (n=24),
the mean value score for all identified problems was seven on the scale of 1 (lowest) to 30 (highest).
Descriptive statistics and correlations are shown in Table 2. On average, the mean value score was
17 for the top quartile of identified problems. The highest score, on average, was about 19.
4.2. Regression Results
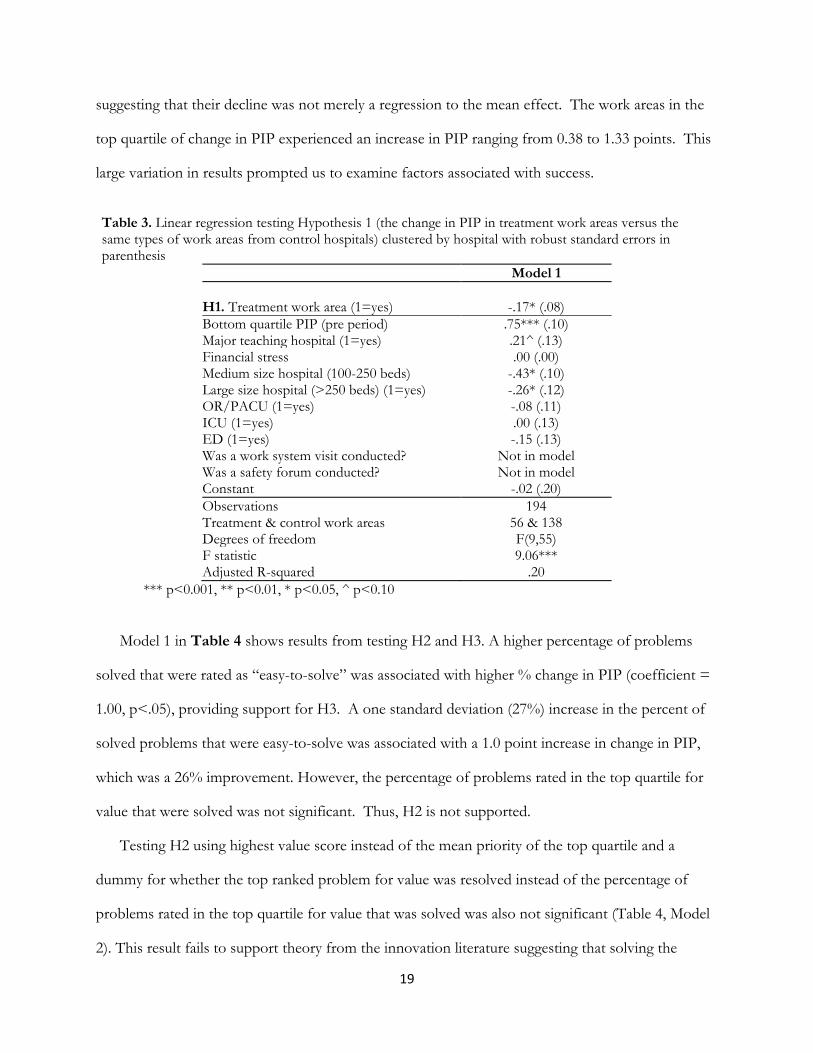
Contrary to our prediction, the MBWA-based treatment was associated with a statistically significant
decrease in PIP (-.17, p<0.05) compared to the same types of work areas in control hospitals (H1,
Table 3, Model 1). A possible explanation is that some treatment work areas failed to conduct the
recommended activities (Nembhard, et. al., 2009). However, the following statistics provide
evidence that treatment areas did indeed implement the MBWA-based program: 91% had a work
system visit; each treatment work area received a mean of 3.41 visits (SD = 3.16, maximum of 12);
50% had a safety forum; on average, they identified 19 problems and took action on 11 (Table 1).
The effectiveness of the program did vary, however, among work areas. As you can see in Model
1, our control variable for whether or not the work area was in the bottom quartile for pre-period
PIP was significant (=0.75, p<.001), suggesting that work areas with the lowest PIP scores in the
pre-intervention period exhibited a positive change in PIP over the course of the intervention.
Additional analysis revealed that the work areas that were in the bottom quartile for our dependent
variable, change in PIP, had a decline in PIP ranging from 0.375 to 2.25. Of these 15 work areas
that experienced the greatest decline in PIP, four were already below median in the pre-period,
18
Table 1. Mean, Standard Deviation (SD), and Correlations for Treatment Work Areas (N=56 work areas)
Variable Mean SD Min Max 1 2 3 4 5
1 Post period PIP 3.69 .61 1.92 5.00
2 Change in PIP -0.09 0.67 -2.25 1.33 .639*
3 Had work system visit 91% 29% 0 1 -.195 -.197
4 Number of work
system visits in area 3.41 3.16 0 12 .055 -.1 .342*
5 Had safety forum 50% 50% 0 1 .056 .028 -.313* .097
6 Percent of problems
addressed 62% 31% 0 1 -.088 .079 .083 .043 -.074
* p<0.05 Table 2. Mean, Standard Deviation (SD), and Correlations for Treatment Work Areas and Identified Problems (n=24)
Variable Mean SD Min Max 1 2 3 4 5 6
1 Change in PIP .02 .53 -1.17 1.1
2 Avg value of top quartile of
identified problems 17.23 6.67 6 30 .298 1
3 Highest valued score 18.75 7.43 6 30 .325 .952* 1
4 Availability of low hanging
fruit 36% 26% 0% 100% -.016 -.305 -.289 1
5 % of top quartile problems
solved 88% 29% 0% 100% .186 .091 .109 -.045 1
6 Highest valued problem
was solved 88% 34% 0 1 .209 .110 .039 -.086 .799*
7 % of solved problems that
were low hanging fruit 33% 27% 0% 83% .327 .097 .099 .551* .432* .350
* p<0.05
19
suggesting that their decline was not merely a regression to the mean effect. The work areas in the
top quartile of change in PIP experienced an increase in PIP ranging from 0.38 to 1.33 points. This
large variation in results prompted us to examine factors associated with success.
Table 3. Linear regression testing Hypothesis 1 (the change in PIP in treatment work areas versus the same types of work areas from control hospitals) clustered by hospital with robust standard errors in parenthesis
Model 1
H1. Treatment work area (1=yes) -.17* (.08)
Bottom quartile PIP (pre period) .75*** (.10) Major teaching hospital (1=yes) .21^ (.13) Financial stress .00 (.00) Medium size hospital (100-250 beds) -.43* (.10) Large size hospital (>250 beds) (1=yes) -.26* (.12) OR/PACU (1=yes) -.08 (.11) ICU (1=yes) .00 (.13) ED (1=yes) -.15 (.13) Was a work system visit conducted? Not in model Was a safety forum conducted? Not in model Constant -.02 (.20)
Observations 194 Treatment & control work areas 56 & 138 Degrees of freedom F(9,55) F statistic 9.06*** Adjusted R-squared .20
*** p<0.001, ** p<0.01, * p<0.05, ^ p<0.10
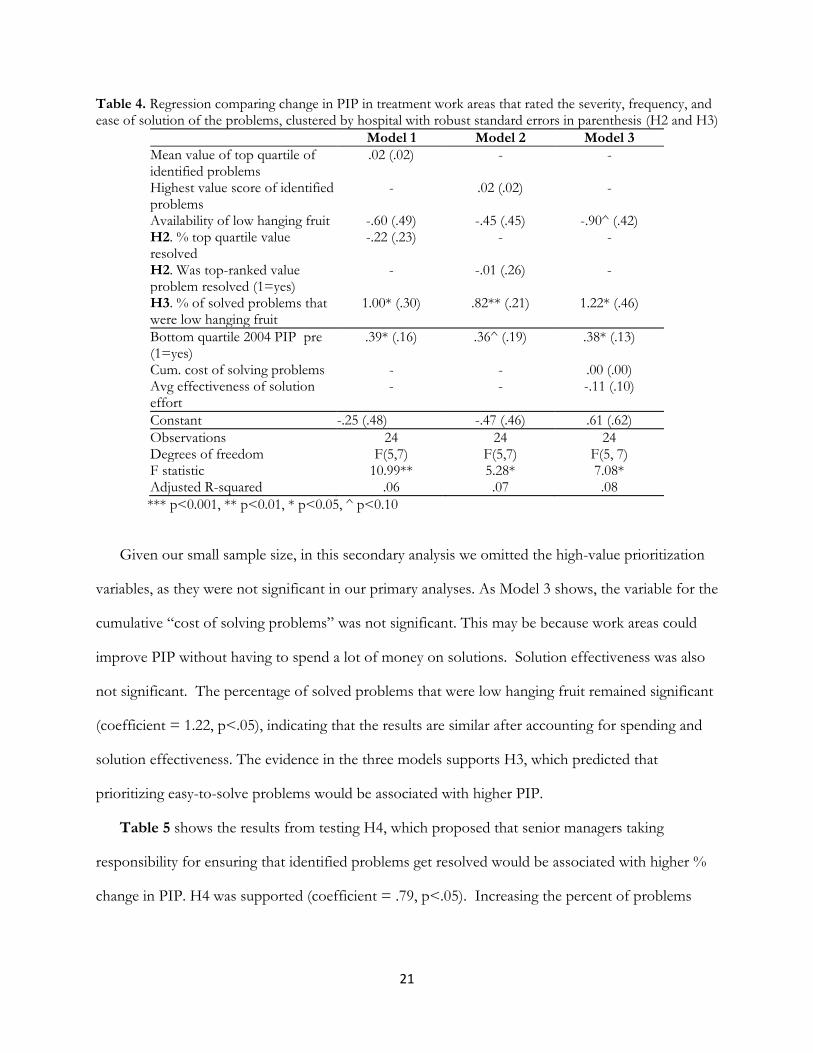
Model 1 in Table 4 shows results from testing H2 and H3. A higher percentage of problems
solved that were rated as “easy-to-solve” was associated with higher % change in PIP (coefficient =
1.00, p<.05), providing support for H3. A one standard deviation (27%) increase in the percent of
solved problems that were easy-to-solve was associated with a 1.0 point increase in change in PIP,
which was a 26% improvement. However, the percentage of problems rated in the top quartile for
value that were solved was not significant. Thus, H2 is not supported.
Testing H2 using highest value score instead of the mean priority of the top quartile and a
dummy for whether the top ranked problem for value was resolved instead of the percentage of
problems rated in the top quartile for value that was solved was also not significant (Table 4, Model
2). This result fails to support theory from the innovation literature suggesting that solving the
20
highest value idea drives performance in our context. However, the percentage of problems resolved
that were rated “easy-to-solve” remained significant in this model (coefficient = .82, p<.01)
providing additional support for H3. Prioritizing easy-to-solve problems appeared to increase PIP.
An alternate explanation for our finding could be that work areas were more successful because
they spent more money on problem solving rather than because they prioritized easy problems. To
control for this “spend more” explanation, the authors individually rated the rough cost of each
solved problem on a scale of 1 to 3 with 1=low (cost<= $500), 2=medium (cost> $500<$150,000),
and 3=high (cost>= $150,000) based on the description of how work areas solved the problem and
independent research to check the cost of products or services mentioned in the description. Actual
examples of actions and their class of solution cost are: for “1”, apply a coating to one window to
improve patient privacy; for “2”, purchase new lighting in a catheterization laboratory to illuminate
procedures; and for “3”, hire several new personnel to address patient transportation needs. We
compared scores and discussed our rationale until we reached consensus for all solved problems. We
then summed the total estimated solution costs, estimating 1 = $250; 2=$5000; 3=$150,000, for all
of the solved problems in each work area.
Another possible explanation is that variation in quality of solution efforts impacted the results
(e.g. some work areas might have engaged in only superficial steps while others might have
systematically resolved underlying causes). We also controlled for this “higher quality” explanation
by hiring 10 nurses not affiliated with our study hospitals to rate the solution effectiveness of the
proposed solution for each problem using a scale from 1 to 10, with 1 being “no information given”
and 10 being “systemic fix” that would prevent recurrence (scale is available from authors).
Agreement among nurses on their ratings was acceptable (kappa = 0.23) (Landis and Koch 1977).
The mean rating for solution effectiveness was higher at 5.9 for solved problems (“solution action in
progress” on our scale) than 2.7 (“no solution implemented”) for unsolved problems, which
validates their coding.
21
Table 4. Regression comparing change in PIP in treatment work areas that rated the severity, frequency, and ease of solution of the problems, clustered by hospital with robust standard errors in parenthesis (H2 and H3)
Model 1 Model 2 Model 3
Mean value of top quartile of identified problems
.02 (.02) - -
Highest value score of identified problems
- .02 (.02) -
Availability of low hanging fruit -.60 (.49) -.45 (.45) -.90^ (.42) H2. % top quartile value resolved
-.22 (.23) - -
H2. Was top-ranked value problem resolved (1=yes)
- -.01 (.26) -
H3. % of solved problems that were low hanging fruit
1.00* (.30) .82** (.21) 1.22* (.46)
Bottom quartile 2004 PIP pre (1=yes)
.39* (.16) .36^ (.19) .38* (.13)
Cum. cost of solving problems - - .00 (.00) Avg effectiveness of solution effort
- - -.11 (.10)
Constant -.25 (.48) -.47 (.46) .61 (.62)
Observations 24 24 24 Degrees of freedom F(5,7) F(5,7) F(5, 7) F statistic 10.99** 5.28* 7.08* Adjusted R-squared .06 .07 .08
*** p<0.001, ** p<0.01, * p<0.05, ^ p<0.10
Given our small sample size, in this secondary analysis we omitted the high-value prioritization
variables, as they were not significant in our primary analyses. As Model 3 shows, the variable for the
cumulative “cost of solving problems” was not significant. This may be because work areas could
improve PIP without having to spend a lot of money on solutions. Solution effectiveness was also
not significant. The percentage of solved problems that were low hanging fruit remained significant
(coefficient = 1.22, p<.05), indicating that the results are similar after accounting for spending and
solution effectiveness. The evidence in the three models supports H3, which predicted that
prioritizing easy-to-solve problems would be associated with higher PIP.
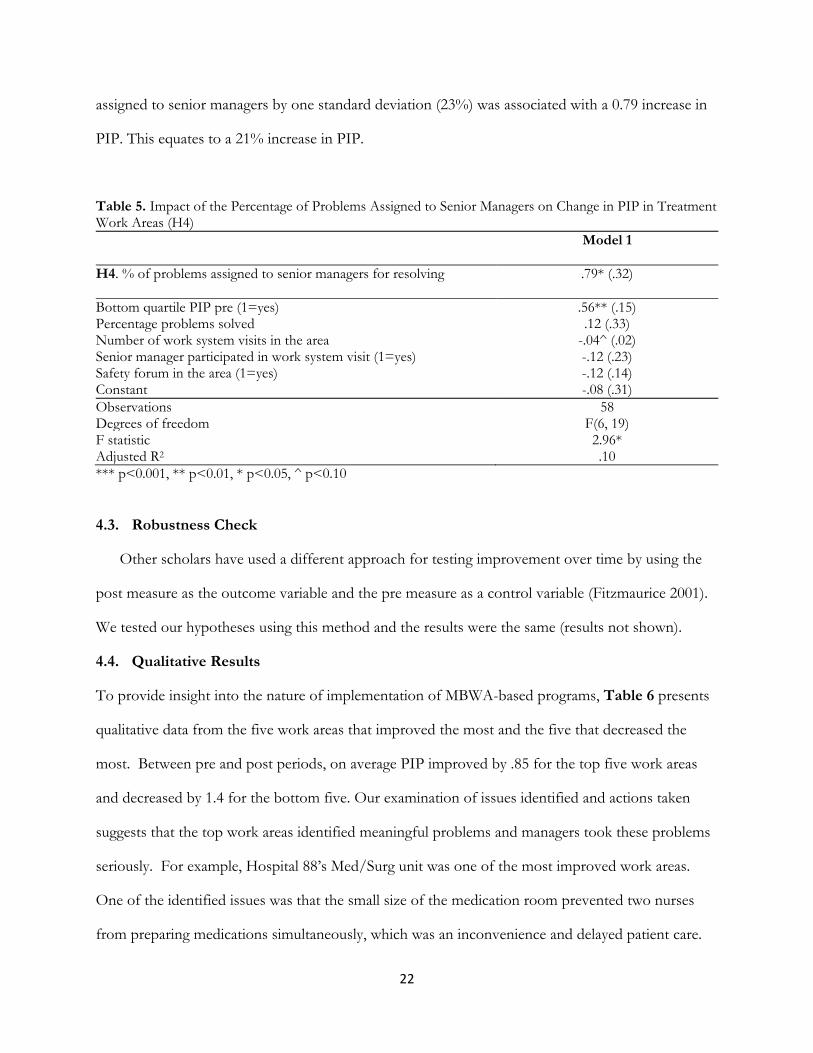
Table 5 shows the results from testing H4, which proposed that senior managers taking
responsibility for ensuring that identified problems get resolved would be associated with higher %
change in PIP. H4 was supported (coefficient = .79, p<.05). Increasing the percent of problems
22
assigned to senior managers by one standard deviation (23%) was associated with a 0.79 increase in
PIP. This equates to a 21% increase in PIP.
Table 5. Impact of the Percentage of Problems Assigned to Senior Managers on Change in PIP in Treatment Work Areas (H4)
Model 1
H4. % of problems assigned to senior managers for resolving .79* (.32)
Bottom quartile PIP pre (1=yes) .56** (.15) Percentage problems solved .12 (.33) Number of work system visits in the area -.04^ (.02) Senior manager participated in work system visit (1=yes) -.12 (.23) Safety forum in the area (1=yes) -.12 (.14) Constant -.08 (.31)
Observations 58 Degrees of freedom F(6, 19) F statistic 2.96* Adjusted R2 .10
*** p<0.001, ** p<0.01, * p<0.05, ^ p<0.10
4.3. Robustness Check
Other scholars have used a different approach for testing improvement over time by using the
post measure as the outcome variable and the pre measure as a control variable (Fitzmaurice 2001).
We tested our hypotheses using this method and the results were the same (results not shown).
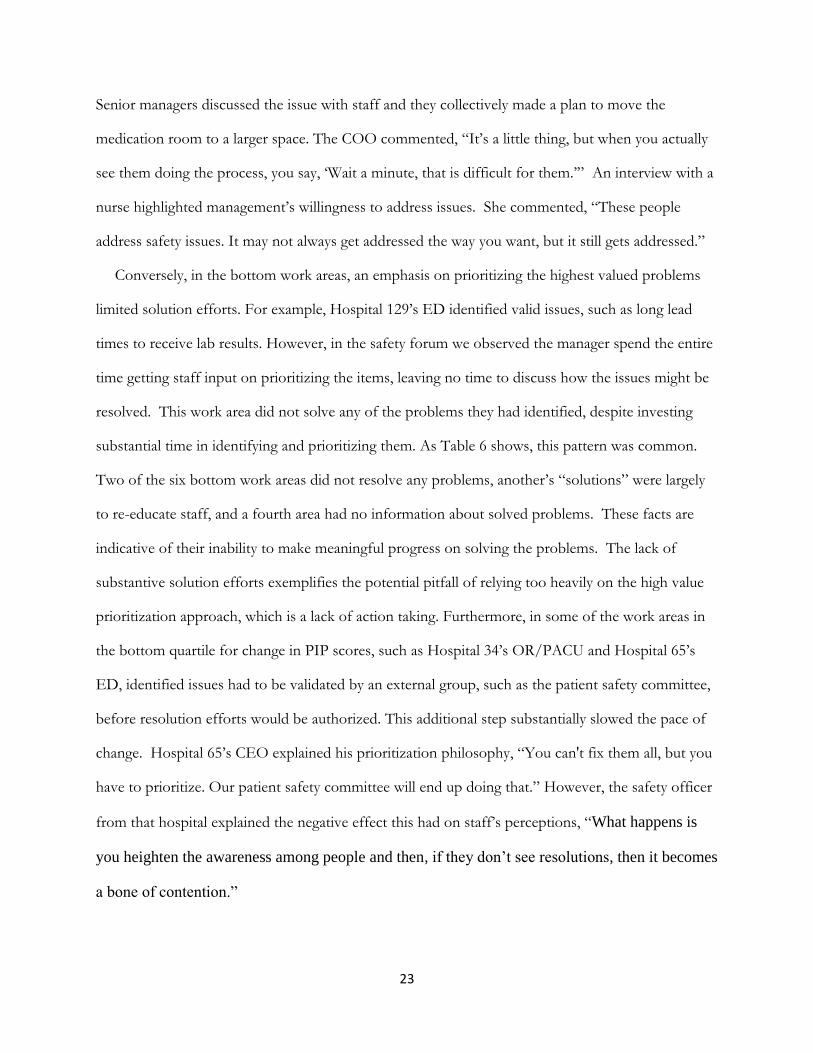
4.4. Qualitative Results
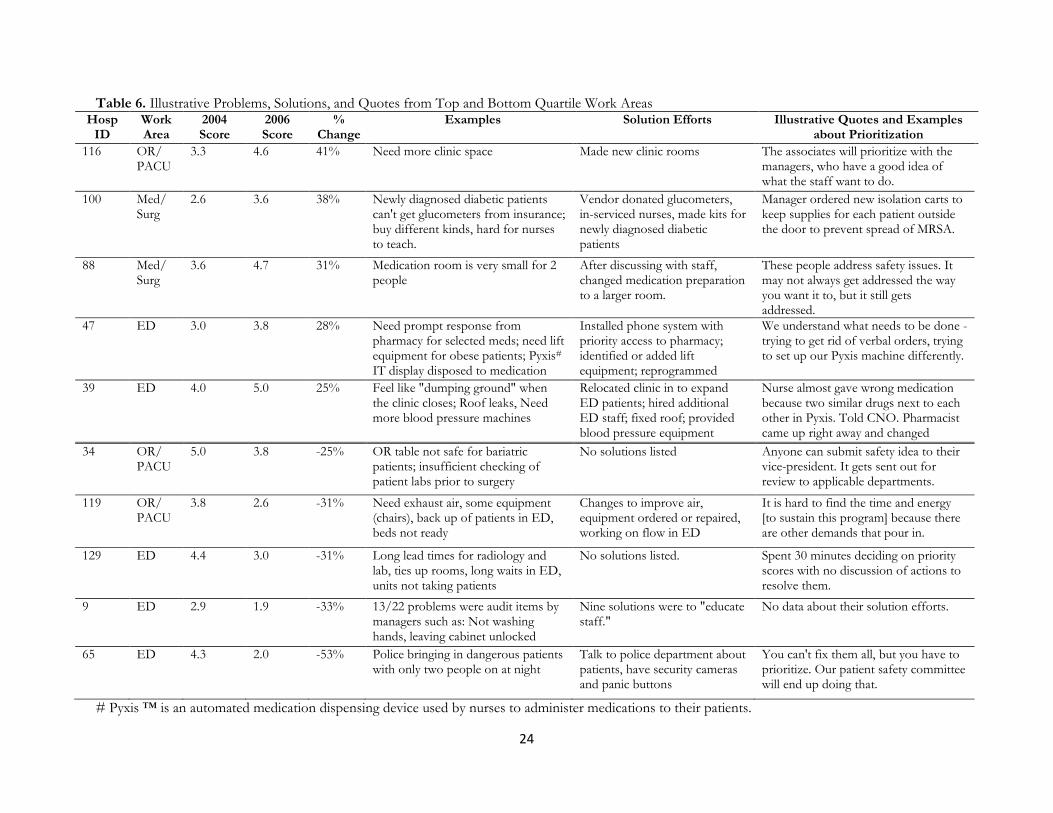
To provide insight into the nature of implementation of MBWA-based programs, Table 6 presents
qualitative data from the five work areas that improved the most and the five that decreased the
most. Between pre and post periods, on average PIP improved by .85 for the top five work areas
and decreased by 1.4 for the bottom five. Our examination of issues identified and actions taken
suggests that the top work areas identified meaningful problems and managers took these problems
seriously. For example, Hospital 88’s Med/Surg unit was one of the most improved work areas.
One of the identified issues was that the small size of the medication room prevented two nurses
from preparing medications simultaneously, which was an inconvenience and delayed patient care.
23
Senior managers discussed the issue with staff and they collectively made a plan to move the
medication room to a larger space. The COO commented, “It’s a little thing, but when you actually
see them doing the process, you say, ‘Wait a minute, that is difficult for them.’” An interview with a
nurse highlighted management’s willingness to address issues. She commented, “These people
address safety issues. It may not always get addressed the way you want, but it still gets addressed.”
Conversely, in the bottom work areas, an emphasis on prioritizing the highest valued problems
limited solution efforts. For example, Hospital 129’s ED identified valid issues, such as long lead
times to receive lab results. However, in the safety forum we observed the manager spend the entire
time getting staff input on prioritizing the items, leaving no time to discuss how the issues might be
resolved. This work area did not solve any of the problems they had identified, despite investing
substantial time in identifying and prioritizing them. As Table 6 shows, this pattern was common.
Two of the six bottom work areas did not resolve any problems, another’s “solutions” were largely
to re-educate staff, and a fourth area had no information about solved problems. These facts are
indicative of their inability to make meaningful progress on solving the problems. The lack of
substantive solution efforts exemplifies the potential pitfall of relying too heavily on the high value
prioritization approach, which is a lack of action taking. Furthermore, in some of the work areas in
the bottom quartile for change in PIP scores, such as Hospital 34’s OR/PACU and Hospital 65’s
ED, identified issues had to be validated by an external group, such as the patient safety committee,
before resolution efforts would be authorized. This additional step substantially slowed the pace of
change. Hospital 65’s CEO explained his prioritization philosophy, “You can't fix them all, but you
have to prioritize. Our patient safety committee will end up doing that.” However, the safety officer
from that hospital explained the negative effect this had on staff’s perceptions, “What happens is
you heighten the awareness among people and then, if they don’t see resolutions, then it becomes
a bone of contention.”
24
Table 6. Illustrative Problems, Solutions, and Quotes from Top and Bottom Quartile Work Areas Hosp
ID Work Area
2004 Score
2006 Score
% Change
Examples Solution Efforts Illustrative Quotes and Examples about Prioritization
116 OR/ PACU
3.3 4.6 41% Need more clinic space Made new clinic rooms The associates will prioritize with the managers, who have a good idea of what the staff want to do.
100 Med/ Surg
2.6 3.6 38% Newly diagnosed diabetic patients can't get glucometers from insurance; buy different kinds, hard for nurses to teach.
Vendor donated glucometers, in-serviced nurses, made kits for newly diagnosed diabetic patients
Manager ordered new isolation carts to keep supplies for each patient outside the door to prevent spread of MRSA.
88 Med/ Surg
3.6 4.7 31% Medication room is very small for 2 people
After discussing with staff, changed medication preparation to a larger room.
These people address safety issues. It may not always get addressed the way you want it to, but it still gets addressed.
47 ED 3.0 3.8 28% Need prompt response from pharmacy for selected meds; need lift equipment for obese patients; Pyxis# IT display disposed to medication errors
Installed phone system with priority access to pharmacy; identified or added lift equipment; reprogrammed Pyxis IT display
We understand what needs to be done - trying to get rid of verbal orders, trying to set up our Pyxis machine differently.
39 ED 4.0 5.0 25% Feel like "dumping ground" when the clinic closes; Roof leaks, Need more blood pressure machines
Relocated clinic in to expand ED patients; hired additional ED staff; fixed roof; provided blood pressure equipment
Nurse almost gave wrong medication because two similar drugs next to each other in Pyxis. Told CNO. Pharmacist came up right away and changed drawer. 34 OR/
PACU 5.0 3.8 -25% OR table not safe for bariatric
patients; insufficient checking of patient labs prior to surgery
No solutions listed Anyone can submit safety idea to their vice-president. It gets sent out for review to applicable departments.
119 OR/ PACU
3.8 2.6 -31% Need exhaust air, some equipment (chairs), back up of patients in ED, beds not ready
Changes to improve air, equipment ordered or repaired, working on flow in ED
It is hard to find the time and energy [to sustain this program] because there are other demands that pour in.
129 ED 4.4 3.0 -31% Long lead times for radiology and lab, ties up rooms, long waits in ED, units not taking patients
No solutions listed. Spent 30 minutes deciding on priority scores with no discussion of actions to resolve them.
9 ED 2.9 1.9 -33% 13/22 problems were audit items by managers such as: Not washing hands, leaving cabinet unlocked
Nine solutions were to "educate staff."
No data about their solution efforts.
65 ED 4.3 2.0 -53% Police bringing in dangerous patients with only two people on at night
Talk to police department about patients, have security cameras and panic buttons
You can't fix them all, but you have to prioritize. Our patient safety committee will end up doing that.
# Pyxis ™ is an automated medication dispensing device used by nurses to administer medications to their patients.
25
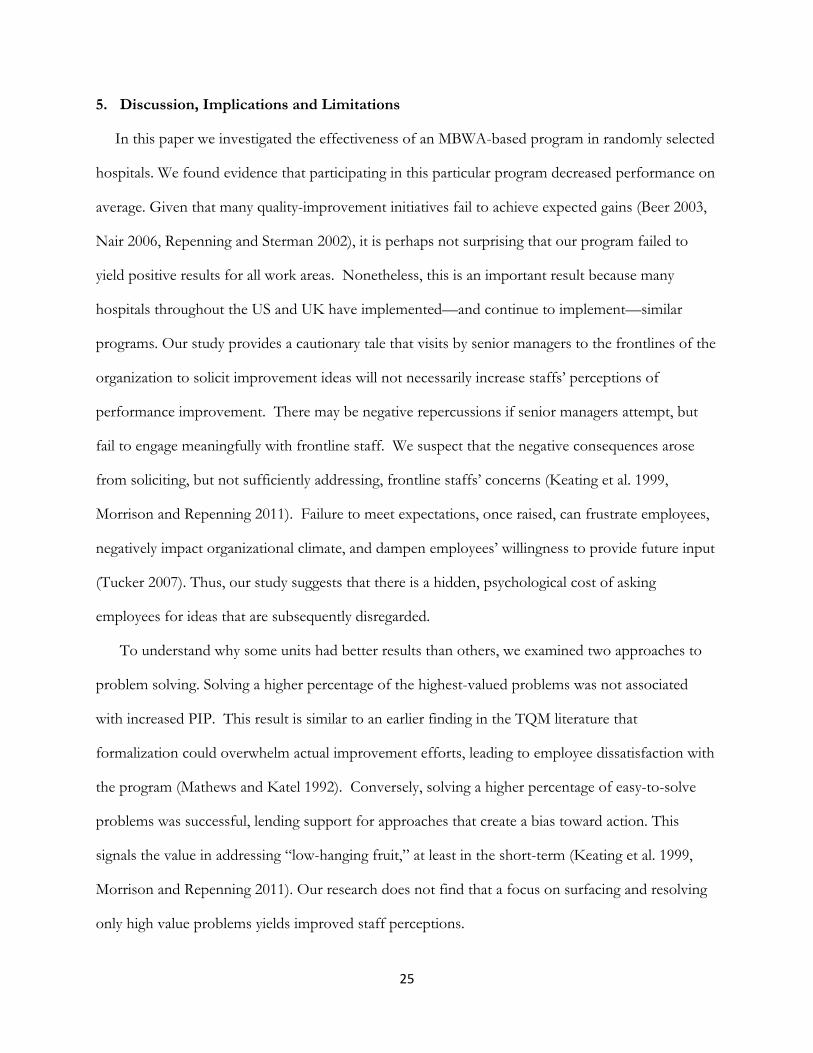
5. Discussion, Implications and Limitations
In this paper we investigated the effectiveness of an MBWA-based program in randomly selected
hospitals. We found evidence that participating in this particular program decreased performance on
average. Given that many quality-improvement initiatives fail to achieve expected gains (Beer 2003,
Nair 2006, Repenning and Sterman 2002), it is perhaps not surprising that our program failed to
yield positive results for all work areas. Nonetheless, this is an important result because many
hospitals throughout the US and UK have implemented—and continue to implement—similar
programs. Our study provides a cautionary tale that visits by senior managers to the frontlines of the
organization to solicit improvement ideas will not necessarily increase staffs’ perceptions of
performance improvement. There may be negative repercussions if senior managers attempt, but
fail to engage meaningfully with frontline staff. We suspect that the negative consequences arose
from soliciting, but not sufficiently addressing, frontline staffs’ concerns (Keating et al. 1999,
Morrison and Repenning 2011). Failure to meet expectations, once raised, can frustrate employees,
negatively impact organizational climate, and dampen employees’ willingness to provide future input
(Tucker 2007). Thus, our study suggests that there is a hidden, psychological cost of asking
employees for ideas that are subsequently disregarded.
To understand why some units had better results than others, we examined two approaches to
problem solving. Solving a higher percentage of the highest-valued problems was not associated
with increased PIP. This result is similar to an earlier finding in the TQM literature that
formalization could overwhelm actual improvement efforts, leading to employee dissatisfaction with
the program (Mathews and Katel 1992). Conversely, solving a higher percentage of easy-to-solve
problems was successful, lending support for approaches that create a bias toward action. This
signals the value in addressing “low-hanging fruit,” at least in the short-term (Keating et al. 1999,
Morrison and Repenning 2011). Our research does not find that a focus on surfacing and resolving
only high value problems yields improved staff perceptions.
26
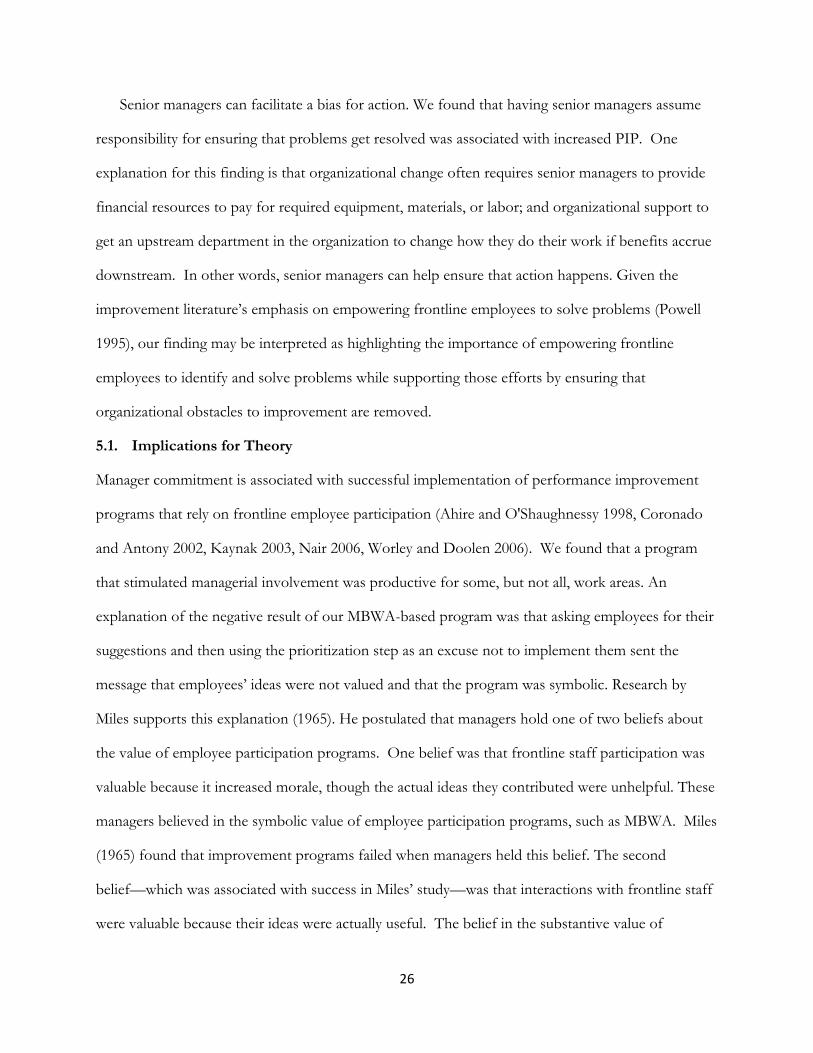
Senior managers can facilitate a bias for action. We found that having senior managers assume
responsibility for ensuring that problems get resolved was associated with increased PIP. One
explanation for this finding is that organizational change often requires senior managers to provide
financial resources to pay for required equipment, materials, or labor; and organizational support to
get an upstream department in the organization to change how they do their work if benefits accrue
downstream. In other words, senior managers can help ensure that action happens. Given the
improvement literature’s emphasis on empowering frontline employees to solve problems (Powell
1995), our finding may be interpreted as highlighting the importance of empowering frontline
employees to identify and solve problems while supporting those efforts by ensuring that
organizational obstacles to improvement are removed.
5.1. Implications for Theory
Manager commitment is associated with successful implementation of performance improvement
programs that rely on frontline employee participation (Ahire and O'Shaughnessy 1998, Coronado
and Antony 2002, Kaynak 2003, Nair 2006, Worley and Doolen 2006). We found that a program
that stimulated managerial involvement was productive for some, but not all, work areas. An
explanation of the negative result of our MBWA-based program was that asking employees for their
suggestions and then using the prioritization step as an excuse not to implement them sent the
message that employees’ ideas were not valued and that the program was symbolic. Research by
Miles supports this explanation (1965). He postulated that managers hold one of two beliefs about
the value of employee participation programs. One belief was that frontline staff participation was
valuable because it increased morale, though the actual ideas they contributed were unhelpful. These
managers believed in the symbolic value of employee participation programs, such as MBWA. Miles
(1965) found that improvement programs failed when managers held this belief. The second
belief—which was associated with success in Miles’ study—was that interactions with frontline staff
were valuable because their ideas were actually useful. The belief in the substantive value of
27
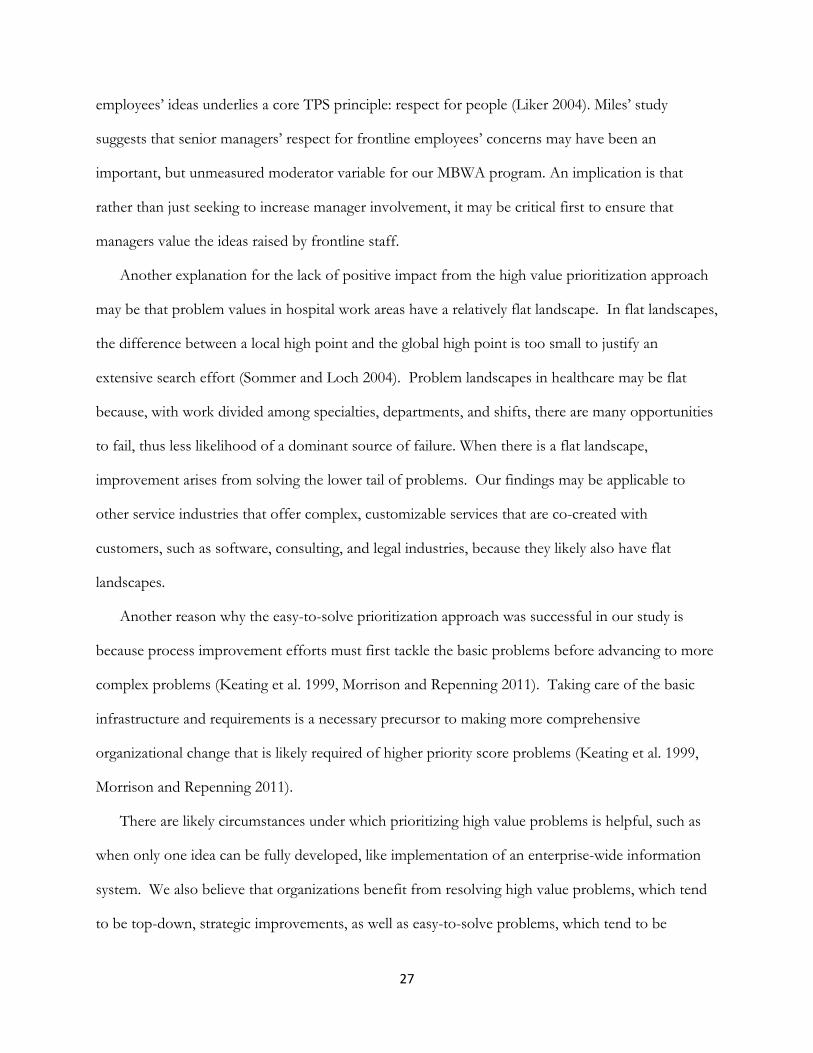
employees’ ideas underlies a core TPS principle: respect for people (Liker 2004). Miles’ study
suggests that senior managers’ respect for frontline employees’ concerns may have been an
important, but unmeasured moderator variable for our MBWA program. An implication is that
rather than just seeking to increase manager involvement, it may be critical first to ensure that
managers value the ideas raised by frontline staff.
Another explanation for the lack of positive impact from the high value prioritization approach
may be that problem values in hospital work areas have a relatively flat landscape. In flat landscapes,
the difference between a local high point and the global high point is too small to justify an
extensive search effort (Sommer and Loch 2004). Problem landscapes in healthcare may be flat
because, with work divided among specialties, departments, and shifts, there are many opportunities
to fail, thus less likelihood of a dominant source of failure. When there is a flat landscape,
improvement arises from solving the lower tail of problems. Our findings may be applicable to
other service industries that offer complex, customizable services that are co-created with
customers, such as software, consulting, and legal industries, because they likely also have flat
landscapes.
Another reason why the easy-to-solve prioritization approach was successful in our study is
because process improvement efforts must first tackle the basic problems before advancing to more
complex problems (Keating et al. 1999, Morrison and Repenning 2011). Taking care of the basic
infrastructure and requirements is a necessary precursor to making more comprehensive
organizational change that is likely required of higher priority score problems (Keating et al. 1999,
Morrison and Repenning 2011).
There are likely circumstances under which prioritizing high value problems is helpful, such as
when only one idea can be fully developed, like implementation of an enterprise-wide information
system. We also believe that organizations benefit from resolving high value problems, which tend
to be top-down, strategic improvements, as well as easy-to-solve problems, which tend to be
28
bottom-up, tactical initiatives. Organizations should try to nurture both kinds of problem solving
capabilities. For example, organizations may have experts working on identifying and solving high
value problems through six sigma projects, while frontline employees simultaneously work on
resolving smaller-scale issues in their local work area through lean initiatives. Furthermore, it may be
that organizations begin their improvement journey by successfully resolving relatively easy
problems, but then need to develop new capabilities to resolve more complex problems (Keating et
al. 1999, Morrison and Repenning 2011). For example, reducing the time required to find vital sign
monitor equipment on a nursing unit likely requires different problem solving skills than reducing
patients’ lengths of stay in the hospital.
5.2. Implications for Policy
Policymakers can play an important role in encouraging organizations to build problem-solving
capacity. Rather than requiring participation in change programs that have not yet been fully
validated, they could provide incentives for organizations to build the generic capacity to solve
frontline problems and engage in process improvement. Given regulatory and industry pressure to
implement multiple quality improvement initiatives at the same time, it is very likely that many
programs are being implemented superficially and in ways that lead to harmful results similar to
those we observed in this study. This could be contributing to the oft-reported failure to achieve
gains through improvement initiatives that frustrate the healthcare industry (Landrigan et al. 2010).
Our study provides a warning about mandating implementation of improvement programs before
fully understanding the conditions required for the programs to yield successful outcomes.
The financial incentives used to encourage adoption of electronic health records in the U.S.
may be instructive. Policy makers rewarded “meaningful use,” as demonstrated by the functionality
that was achieved, rather than rewarding implementation of a particular software (Blumenthal 2010).
Similarly, policy makers could provide incentives for building problem-solving capabilities that
improve patient-centered performance rather than advocate for a specific improvement program.
29
5.3. Implications for Practice
Many initiatives to improve safety begin by trying to increase employees’ reports of near misses,
errors, and incidents (Bagian et al. 2001, Evans et al. 2007). Implied assumptions are that increasing
the number of reports enables organizations to conduct trend analysis that illuminates high value
problems which can then be solved; and that many issues will be of sufficiently low value that they
can be ignored at low or no cost to the organization. In contrast, our study suggests that there may
be little benefit, and some potential harm, to this approach. Rather than increasing reporting,
organizations might be better served by addressing known problems, which builds problem-solving
capabilities, which in turn enables action-taking on more problems. Our finding corroborates prior
research that highlighted the importance of problem-solving capacity for successful improvement
programs (Adler et al. 2003, Keating et al. 1999, Morrison and Repenning 2011). This advice is
consistent with the vision for a continuously learning health care system articulated by the US
Institute of Medicine, requirements for which include systematic problem solving. Our study also
resembles Kaizen, a structured problem-solving approach involving managers and frontline workers.
However, important differences that may make Kaizen more successful than our program are that
Kaizen occurs after managers and frontline staff have been trained on a standardized problem
solving technique and that it emphasizes taking action to solve as many problems as possible within
the given time period (Imai 1986). Thus, it prevents resource depletion by limiting the time spent
identifying and solving problems rather than by selecting among them.
5.4. Limitations
Our findings must be considered in light of study limitations. First, our small sample size limited our
analysis. Our sample was small for several reasons. The cost and time intensive nature of conducting
an experiment with hospitals over 18 months made it challenging to conduct our field-based,
interventional program with 24 organizations, and we would have struggled if there were more. In
addition, despite our providing a method of prioritizing problems, many organizations chose not to
30
assign prioritization values and therefore work-area coded data on problem value was not available
for all treatment work areas. Future research with larger sample sizes could test more nuanced
theory. For example, an easy-to-solving prioritization approach may be most successful for work
areas that start from a weak position and can benefit most from action, whereas a high value
prioritization approach may be most helpful for experienced work areas that can be more selective.
A second limitation is the perceptual measure of improvement. Hospitals were unwilling to
share actual safety incident measures with us. In addition, publicly available clinical measures, such
as mortality, readmissions, and process of care measures, started being reported publicly only after
the initiation of this study. Although we conducted analyses using these “post study” clinical
outcome data, the regressions were not significant in explaining variation. However, for reasons
detailed above, a perceptual measure is an important indicator of the impact of the intervention we
tested. Furthermore, prior research on an MBWA-based intervention that did have access to clinical
outcome data did not find links between multiple clinical outcomes and the intervention (Benning et
al. 2011), corroborating our study results.
Third, hospitals did not track resources spent on solutions efforts. Therefore estimation was the
only way of testing the alternate explanation that spending more money on process improvement
yielded better outcomes. Future research could contribute to improvement theory by examining the
cost of improvement efforts compared to benefits. A fourth limitation is that we did not randomize
an easy-to-solve prioritization approach versus a high value prioritization approach among work
areas. Instead those differences emerged naturally. A randomized assignment of these two
prioritization approaches would provide a stronger test of the hypotheses.
5.4 Conclusions
Understanding the impact of MBWA-based programs is helpful for organizations that may be
considering implementing them. In our study, organizations whose managers ensured that problems
were addressed achieved better results. This suggests that improvement programs are more likely to
31
change employees’ perceptions when they result in action being taken to resolve problems than
when they are a symbolic show of manager interest. Based on study findings, we recommend that
organizations focus on increasing their capacity to act on improvement suggestions rather than
expending further effort on generating more suggestions and prioritizing them.
References
Adler, P. S., P. Riley, S.-W. Kwon, J. Signer, B. Lee, R. Satrasala. 2003. Performance improvement capability: Keys to accelerating performance improvement in hospitals. California Management Review 45(2), 12-33.
Ahire, S. L., K. C. O'shaughnessy. 1998. The role of top management commitment in quality management: An empirical analysis of the auto parts industry. International Journal of Quality Science 3(1), 5-37.
Anderson, E. G., A. Chandrasekaran, A. Davis-Blake, G. G. Parker. 2013. Managing distributed product development projects: Integration strategies for language and geographic barriers. University of Texas at Austin, Austin, Texas.
Anderson, M. A., E. G. Anderson, G. G. Parker. 2013. Operations Management for Dummies. John Wiley and Sons, Inc., Hoboken, New Jersey.
Antonakis, J., Bendahan, S., Jacquart, P., & Lalive, R. 2010. On making causal claims: A review and recommendations. Leadership Quarterly 21(6), 1086–1120.
Atuahene-Gima, K. 2003. The effects of centrifugal and centripetal forces on product development speed and quality: How does problem solving matter? Acad. Manage. J. 46(3), 359-373.
Bagian, J. P., C. Lee, J. Gosbee, J. Derosier, E. Stalhandske, N. Eldridge, R. Williams, M. Burkhardt. 2001. Developing and deploying a patient safety program in a large health care delivery system: You can't fix what you don't know about. Joint Commission Journal on Quality and Patient Safety 27(10), 522-532.
Bardhan, I., V. V. Krishnan, S. Lin. 2012. Team Dispersion, Information Technology, and Project Performance. Prod. Oper. Manage.
Beer, M. 2003. Why total quality management programs do not persist: The role of management quality and implications for leading a TQM transformation. Dec. Sci. 34(4), 623-642.
Benning, A., M. Dixon-Woods, U. Nwulu, M. Ghaleb, J. Dawson, N. Barber, B. D. Franklin, A. Girling, K. Hemming, M. Carmalt, G. Rudge, T. Naicker, A. Kotecha, M. C. Derrington, R. Lilford. 2011. Multiple component patient safety intervention in English hospitals: Controlled evaluation of second phase. BMJ 342(d199.
Bergh, D. D., J. F. Fairbank. 2002. Measuring and testing change in strategic management research. Strategic Management Journal 23(4), 359-366.
Bliese, P. D. 2000. Within-group agreement, non-independence, and reliability: Implications for data aggregation and analysis. Klein, K. J., S. W. J. Kozlowski, eds. Multilevel theory, research, and methods in organizations. Jossey-Bass, San Francisco, CA,
Blumenthal, D. D. 2010. Launching HITECH. New England Journal of Medicine 362(5), 382-385. Bohn, R. 2000. Stop fighting fires. Harv. Bus. Rev. 78(4), 82-91. Carroll, J. S., S. Hatakenaka, J. W. Rudolph. 2006. Naturalistic decision making and organizational learning in
nuclear power plants: Negotiating meaning between managers and problem investigation teams. Organization Studies 27(7), 1037-1057.
Chandrasekaran, A., A. Mishra. 2012. Task design, team context, and psychological safety: An empirical analysis of R&D projects in high technology organizations. Prod. Oper. Manage. 21(6), 977-996.
Chatterjee, S., A. S. Hadi. 1986. Influential observations, high leverage points, and outliers in linear regression. Statistical Science 1(3), 379-416.
Cook, R., D. Woods. 1994. Operating at the sharp end: The complexity of human error. Bogner, M. S., eds. Human Error in Medicine. Lawrence Erlbaum Associates, Inc., Hillsdale, NJ, 255-310.
32
Coronado, R. B., J. Antony. 2002. Critical success factors for the successful implementation of six sigma projects in organizations. The TQM Magazine 14(2), 92-99.
Dow, D., D. Samson, S. Ford. 1999. Exploding the myth: Do all quality management practices contribute to superior quality performance? Prod. Oper. Manage. 8(1), 1-27.
Evans, J. R., W. M. Lindsay. 2005. The Management and Control of Quality. Thompson, South-Western, Mason, Ohio.
Evans, S., B. Smith, A. Esterman, W. Runciman, G. Maddern, K. Stead, P. Selim, J. O'shaughnessy, S. Muecke, S. Jones. 2007. Evaluation of an intervention aimed at improving voluntary incident reporting in hospitals Quality and Safety in Health Care 16(3), 169-175.
Fine, C. H. 1986. Quality improvement and learning in productive systems. Manage. Sci. 32(10), 1301-1315. Fine, C. H., E. L. Porteus. 1989. Dynamic process improvement. Oper. Res. 37(4), 580-591. Fitzmaurice, G. 2001. A conundrum in the analysis of change. Nutrition 17(4), 360-361. Flynn, B. B., R. G. Schroeder, S. Sakakibara. 1995. The impact of quality management practices on
performance and competitive advantage. Dec. Sci. 26(5), 659-691. Frankel, A., E. Graydon-Baker, C. Neppl, T. Simmonds, M. Gustafson, T. Gandhi. 2003. Patient safety
leadership walkrounds. Joint Commission Journal on Quality and Safety 29(1), 16-26. Frankel, A., S. P. Grillo, E. G. Baker, C. N. Huber, S. Abookire, M. Grenham, P. Console, M. O'quinn, G.
Thibault, T. K. Gandhi. 2005. Patient safety leadership walkrounds at Partners Health Care: Learning from implementation. Joint Commission Journal on Quality and Patient Safety 31(8), 423-437.
Frankel, A., S. Pratt Grillo, M. Pittman, E. J. Thomas, L. Horowitz, M. Page, B. Sexton. 2008. Revealing and resolving patient safety defects: The impact of leadership walkrounds on frontline caregiver assessments of patient safety. Health Services Research 43(6), 2050-2066.
Girotra, K., C. Terwiesch, K. T. Ulrich. 2010. Idea generation and the quality of the best idea. Manage. Sci. 56(4), 591-605.
Hansen, L., M. Williams, S. J. Singer. 2010. Perceptions of hospital safety climate and incidence of readmission. Health Services Research 42(2), 596-616.
Hofmann, D. A., B. Mark. 2006. An investigation of the relationship between safety climate and medication errors as well as other nurse and patient outcomes. Personnel Psychology 59(4), 847-869.
Huang, D. T., G. Clermont, L. Kong, L. A. Weissfeld, J. B. Sexton, K. M. Rowan, D. C. Angus. 2010. Intensive care unit safety culture and outcomes: a US multicenter study. International Journal for Quality in Health Care 22(3), 151-161.
Imai, M. 1986. Kaizen: The key to Japan's competitive success. Random House Business Division, New York. Institute for Healthcare Improvement. 2004. Patient Safety Leadership Walkrounds. Boston, MA. Ittner, C. D., V. Nagar, M. V. Rajan. 2001. An empirical examination of dynamic quality-based learning
models. Manage. Sci. 47(4), 563. Jimmerson, C., D. Weber, D. K. Sobek. 2005. Reducing waste and errors: piloting lean principles at
Intermountain Healthcare. Joint Commission Journal on Quality and Patient Safety 31(5), 249-257. Johnson, C. W. 2003. How will we get the data and what will we do with it then? Issues in the reporting of
adverse healthcare events. Quality and Safety in Health Care 12(Suppl II), ii64-ii67. Juran, J. M., A. B. Godfrey, R. E. Hoogstoel, E. G. Schilling. 1999. Juran's Quality Handbook. McGraw Hill,
New York. Kaplan, H. C., L. P. Provost, C. M. Froehle, P. A. Margolis. 2012. The Model for Understanding Success in
Quality (MUSIQ): building a theory of context in healthcare quality improvement. BMJ Quality & Safety 21(1), 13-20.
Kaynak, H. 2003. The relationship between total quality management practices and their effects on firm performance. J. Oper. Manage. 21(4), 405-435.
Keating, E. K., R. Oliva, N. P. Repenning, S. Rockart, J. D. Sterman. 1999. Overcoming the Improvement Paradox. European Management Journal 17(2), 120-134.
Ketokivi, M. A., R. G. Schroeder. 2004. Perceptual measures of performance: fact or fiction? J. Oper. Manage. 22(3), 247-264.
Landis, J. R., G. G. Koch. 1977. The measurement of observer agreement for categorical data. Biometrics 33(1), 159-174.
33
Landrigan, C. P., G. J. Parry, C. B. Bones, A. D. Hackbarth, D. A. Goldmann, P. J. Sharek. 2010. Temporal trends in rates of patient harm resulting from medical care. New England Journal of Medicine 363(22), 2124–2134.
Liker, J. 2004. The Toyota Way. McGraw-Hill, New York, NY. Macduffie, J. P. 1997. The road to root cause: Shop-floor problem-solving at three auto assembly plants.
Manage. Sci. 43(4), 479-502. Mann, D. 2009. The missing link: Lean leadership. Frontiers in Health Services Management 26(1), 15-26. Mathews, J., P. Katel. 1992. The cost of quality. Newsweek, September 7, 1992, 48-49. Mcfadden, K. L., S. C. Henagan, C. R. Gowen Iii. 2009. The patient safety chain: Transformational
leadership's effect on patient safety culture, initiatives, and outcomes. J. Oper. Manage. 27(5), 390-404. Miles, M. B., A. M. Huberman. 1994. Qualitative data analysis: an expanded sourcebook. Sage, Thousand Oaks, CA. Morrison, J. B., N. P. Repenning. 2011. Sustaining employee participation: The challenge of tipping point
dynamics. Nair, A. 2006. Meta-analysis of the relationship between quality management practices and firm performance-
-implications for quality management theory development. J. Oper. Manage. 24(6), 948-975. National Patient Safety Agency. 2011. Patient Safety First: 2008-2010, The campaign review. National Patient
Safety Agency, London, UK. Nunnally, J. C. 1967. Psychometric Theory. McGraw-Hill, New York. Packard, D. 1995. The HP Way: How Bill Hewlett and I Built our Company. Harper Business, New York, NY. Perrow, C. 1984. Normal accidents: Living with high-risk technologies. Princeton University Press, Princeton, NJ. Powell, T. C. 1995. Total quality management as competitive advantage: A review and empirical study.
Strategic Management Journal 16(1), 15-37. Pronovost, P. J., B. Weast, K. Bishop, L. Paine, R. Griffith, B. L. Rosenstein, R. P. Kidwell, K. B. Haller, R.
Davis. 2004. Senior executive: Adopt-a-work unit: A model for safety improvement. Joint Commission Journal of Quality Improvement 30(2), 59-68.
Rabe-Hesketh, S., B. Everitt. 2004. A Handbook of Statistical Analysis using Stata. Chapman & Hall/ CRC Press, Boca Raton, FL.
Reason, J. 2000. Human error: Models and management. British Medical Journal 320(7237), 768-770. Repenning, N. P., J. D. Sterman. 2002. Capability traps and self-confirming attribution errors in the dynamics
of process improvement. Admin. Sci. Q. 47(2), 265-295. Royston, J. P. 1992. Approximating the Shapiro-Wilk W-test for non-normality. Statistics and Computing 2(3),
117-119. Samson, D., M. Terziovski. 1999. The relationship between total quality management practices and
operational performance. J. Oper. Manage. 17(4), 393-409. Shortell, S. M., J. L. O'brien, J. M. Carman, R. W. Foster. 1995. Assessing the impact of continuous quality
improvement/ total quality management: Concept versus implementation. Health Services Research 30(2), 377.
Singer, S. J., S. Lin, A. Falwell, D. Gaba, L. Baker. 2009. Relationship of safety climate and safety performance in hospitals. Health Services Research 44(2 (Part 1)), 399-421.
Singer, S. J., P. E. Rivard, J. E. Hayes, P. Shokeen, D. Gaba, A. Rosen. 2013. Improving patient care through leadership engagement with frontline staff: A department of Veterans Affairs case study. Joint Commission Journal of Quality and Patient Safety 39(8), 349-360.
Sobo, E. J., B. L. Sadler. 2002. Improving organizational communication and cohesion in a health care setting through employee-leadership exchange. Human Organization 61(3), 277-287.
Sommer, S. C., C. H. Loch. 2004. Selectionism and learning in projects with complexity and unforeseeable uncertainty. Manage. Sci. 50(10), 1334-1347.
Swink, M., S. Talluri, T. Pandejpong. 2006. Faster, better, cheaper: A study of NPD project efficiency and performance tradeoffs. J. Oper. Manage. 24(5), 542-562.
Thomas, E. J., J. B. Sexton, T. B. Neilands, A. Frankel, R. L. Helmreich. 2005. The effect of executive walk rounds on nurse safety climate attitudes: A randomized trial of clinical units. BMC Health Services Research 5(1), 28-36.
34
Toussaint, J., R. A. Gerard, E. Adams. 2010. On the Mend: Revolutionizing Healthcare to Save Lives and Transform the Industry. Lean Enterprise Institute, Cambridge, MA.
Tucker, A. L. 2007. An empirical study of system improvement by frontline employees in hospital units. Manuf. Serv. Oper. Manage. 9(4), 492-505.
Victor, B., A. Boynton, T. Stephens-Jahng. 2000. The effective design of work under total quality management. Organ. Sci. 11(1), 102-117.
Von Hippel, E. 1994. "Sticky information" and the locus of problem solving: Implications for innovation. Manage. Sci. 40(4), 429-440.
Womack, J. P. 2011. Gemba Walks. Lean Enterprise Institute, Cambridge, MA. Worley, J. M., T. L. Doolen. 2006. The role of communication and management support in a lean
manufacturing implementation. Management Decision 44(2), 228-245. Zellmer-Bruhn, M. E. 2003. Interruptive events and team knowledge acquisition. Manage. Sci. 49(4), 514-528. Zohar, D., G. Luria. 2003. The use of supervisory practices as leverage to improve safety behaviour: a cross-
level intervention model. Journal of Safety Research 34(5), 567-577.
Appendix 1. Survey Questions for Perceived Improvement in Performance
The quality of services I help provide is currently the best it has ever been.
We are getting fewer complaints about our work.
Overall, the level of patient safety at this facility is improving.
The overall quality of service at this facility is improving.
Appendix 2. Interview Questions
Front-Line Personnel Interview Protocol I wanted to ask you some questions about the patient safety culture at this hospital. We recognize that
most hospital personnel experience problems in the course of their work and that these are not a
reflection of their skill level or of the quality of care provided at their facility. My goal is to understand
differences in safety culture among organizations.
1. Do personnel on this unit talk openly about safety issues and errors? 2. Who (or what) provides impetus for patient safety at this hospital? How do they do it?
Reporting of near miss or safety-related incidents has received some attention lately. We would like to better
understand how healthcare professionals that actually provide direct care to patients think about reporting incidents
related to patient safety.
3. Have you ever reported something? What made you decide to report that incident? What happened as a result of reporting? Did you ever learn the outcome? Can you recall a specific adverse event that was caused by an error or series of errors? What happened? Can you describe the investigation process (i.e. what happened to people involved, what changes, if any, resulted from the investigation)?
My last question relates to a major change in a care process at your hospital.
35
4. Thinking about a recent major change related to patient care processes, can you describe how
this change introduced in your unit? Probe: What training did you receive? Has implementation
required any workarounds of the built-in features of the system?
Manager Interview Protocol I wanted to ask you some questions about the patient safety culture at this hospital. We recognize that
most hospital personnel experience problems in the course of their work and that these are not a
reflection of their skill level or of the quality of care provided at their facility. My goal is to understand
differences in safety culture among organizations.
1. Do you feel comfortable talking about safety issues and errors in your manager meetings with senior leadership?
2. Do you encourage your staff to speak up? How? 3. Who (or what) provides impetus for patient safety at this hospital? How do they do it?
Reporting of near miss or safety-related incidents has received some attention lately. We would like to better
understand how healthcare professionals that actually provide direct care to patients think about reporting incidents
related to patient safety.
4. Can you step through a recent “near-miss” safety report that you addressed? Briefly (don’t need details) what was the situation and what was the response, if any?
5. Can you recall a specific adverse event that was caused by an error or series of errors? Briefly, what happened? Can you describe the investigation process (i.e. what happened to people involved, what changes, if any, resulted from the investigation)?
My last question relates to a major change in a care process at your hospital.
6. Thinking about a recent major change related to patient care processes, can you describe how this change was introduced to a unit? Probe: What training was provided? Has implementation required any workarounds of the built-in features of the system?
Hospital Administrator Interview Protocol
I wanted to ask you some questions about your daily activities as a hospital executive and your views on
the patient safety culture at your hospital. We recognize that leadership styles and organizational
cultures are unique at every institution and none is necessarily better than any other. My goal is to
understand the full variation among organizations.
1. What are your primary priorities for the hospital? [Prompt if it isn’t mentioned] Where does patient safety fall in your list of priorities?
2. How do you see your role in patient safety? In what ways do you provide leadership in this area? 3. How would you describe the general attitude of healthcare professionals and employees within
the hospital towards patient safety?
36
4. It is well known that middle managers are a key to implementation, and these people are often extremely pressed due to budget constraints. What is the situation with middle managers in your hospital?
5. How do you obtain information about the hazards present at the front lines of your organization?
6. Thinking about the most recent major organizational change related to patient safety, can you describe the change, your decision-making process, and its implementation? Probe: Did some event or new piece of information prompt your decision to implement the change? Did you evaluate the business case before making the change?