Embed Size (px)
Citation preview

THE EFFECTS OF BUDGET CONTROL ON OPERATIONAL PERFORMANCE
OF
PUBLIC HOSPITALS IN KIAMBU COUNTY
GATHECHA ANTONY MWAURA
A RESEARCH PROJECT SUBMITTED IN PART FULFILLMENT OF THE
REQUIREMENTS FOR THE AWARD OF THE DEGREE OF MASTER BUSINESS
ADMINISTRATION IN FINANCE, SCHOOL OF BUSINESS, UNIVERSITY OF
NAIROBI
AUGUST 2017
ii
DECLARATION
I hereby declare that this is my original work and has not been submitted for a degree in any
other University
Signature: ………………………………. Date: ………………………………
Antony Mwaura Gathecha REG. NO: D61/79379/2015
Supervisor.
Signature: …………………………………. Date: ……………………………..
Supervisor: Mr. Joseph Barasa
Department of Finance and Accounting
School of Business, University of Nairobi

iii
DEDICATION
I dedicate this research work to my Loving Parents Mr. and Mrs. Gasper Gathecha, for their
unwavering love and support in educating me since my elementary level. It’s through their
investment in my education that I have reached this far, my Wife and children, my two
loving sisters and friends. Know that your words of encouragement were not in vain.

iv
ACKNOWLEDGEMENT
First and foremost, I wish to thank The Almighty God for life, good health and sustenance
He has given me to this far I have come. It is through His grace that I am able to complete
this research project.
My special appreciation to my Supervisor, Mr. Joseph Barasa, and other lecturers in the
department of finance and accounting, who took effort to guide and advise me during the
entire period of my project.
I am also indebted to my classmates, colleagues at work and my lecturers for all their
invaluable support and encouragement during my period of study. Finally, I wish to thank all
the Kiambu County hospitals who assisted me in conducting this research, for their time
which they spared to enable me collect data from their institutions.
v
ABSTRACT
This research examines the budgetary control in public hospitals and its effects on their
operational performance. The aim of this paper is to determine the effects of budget control
on operational performance of public hospitals in Kiambu County. The research target
population consisted of 364 health facilities as provided for in the Kiambu County
Government website. Twenty public health institutions were selected using convenience
judgmental sampling technique for this study, in Kiambu County.
A descriptive survey design was used in the data collection, questionnaires were designed
with closed ended questions and distributed to various public hospitals using the drop and
pick method. The statistical package for social sciences version 17.0 was used to analyze the
data using descriptive statistics, including means and standard deviation. The relationship
between budgetary controls and operational performance of the public hospitals was
analyzed using correlation and regression analysis methods.
The research findings established that there is a positive effect of budgetary control on
operational performance public hospitals in Kiambu County. The research recommends that
employees need to be sensitized on budgetary controls and the effect on operational
performance of the organization. It also recommends that other factors that influence
operational performance apart from budgetary controls should be investigated by these
institutions . It also suggests that further research should be done on the same area but a
larger sample should be used.
vi
LIST OF ABBREVIATIONS
KHPF - Kenya Health Policy Framework
COK – County Government of Kiambu
GOK – Government of Kenya
ROE – Relative Operational Efficiency
WHO –World Health Organization
OECD - Organisation for Economic Co-operation and Development
NSE – Nairobi Securities Exchange
vii
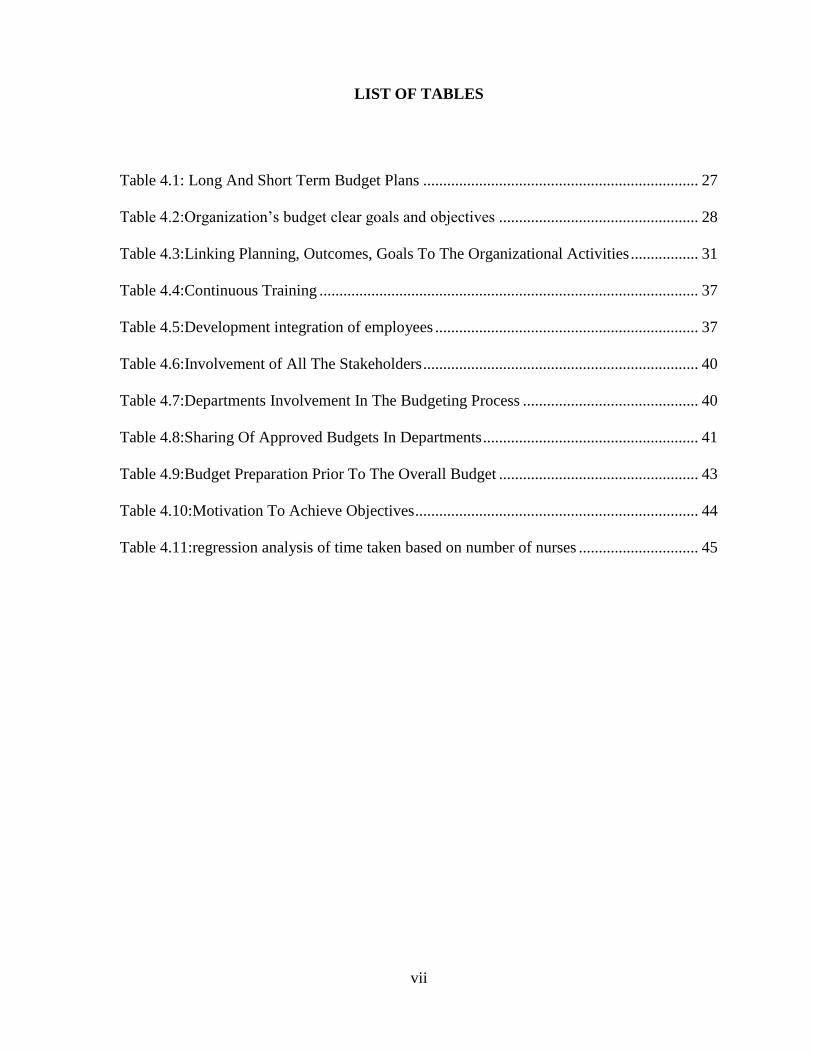
LIST OF TABLES
Table 4.1: Long And Short Term Budget Plans ..................................................................... 27
Table 4.2:Organization’s budget clear goals and objectives .................................................. 28
Table 4.3:Linking Planning, Outcomes, Goals To The Organizational Activities ................. 31
Table 4.4:Continuous Training ............................................................................................... 37
Table 4.5:Development integration of employees .................................................................. 37
Table 4.6:Involvement of All The Stakeholders ..................................................................... 40
Table 4.7:Departments Involvement In The Budgeting Process ............................................ 40
Table 4.8:Sharing Of Approved Budgets In Departments ...................................................... 41
Table 4.9:Budget Preparation Prior To The Overall Budget .................................................. 43
Table 4.10:Motivation To Achieve Objectives ....................................................................... 44
Table 4.11:regression analysis of time taken based on number of nurses .............................. 45
viii
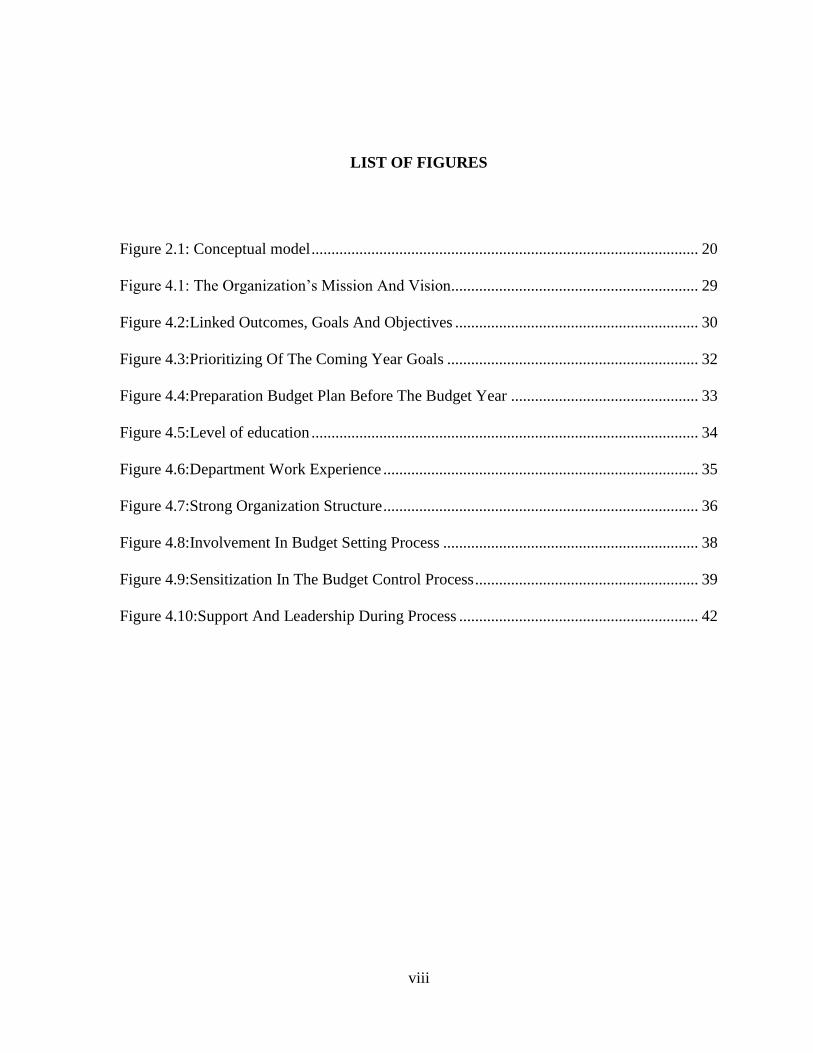
LIST OF FIGURES
Figure 2.1: Conceptual model ................................................................................................. 20
Figure 4.1: The Organization’s Mission And Vision.............................................................. 29
Figure 4.2:Linked Outcomes, Goals And Objectives ............................................................. 30
Figure 4.3:Prioritizing Of The Coming Year Goals ............................................................... 32
Figure 4.4:Preparation Budget Plan Before The Budget Year ............................................... 33
Figure 4.5:Level of education ................................................................................................. 34
Figure 4.6:Department Work Experience ............................................................................... 35
Figure 4.7:Strong Organization Structure ............................................................................... 36
Figure 4.8:Involvement In Budget Setting Process ................................................................ 38
Figure 4.9:Sensitization In The Budget Control Process ........................................................ 39
Figure 4.10:Support And Leadership During Process ............................................................ 42
ix
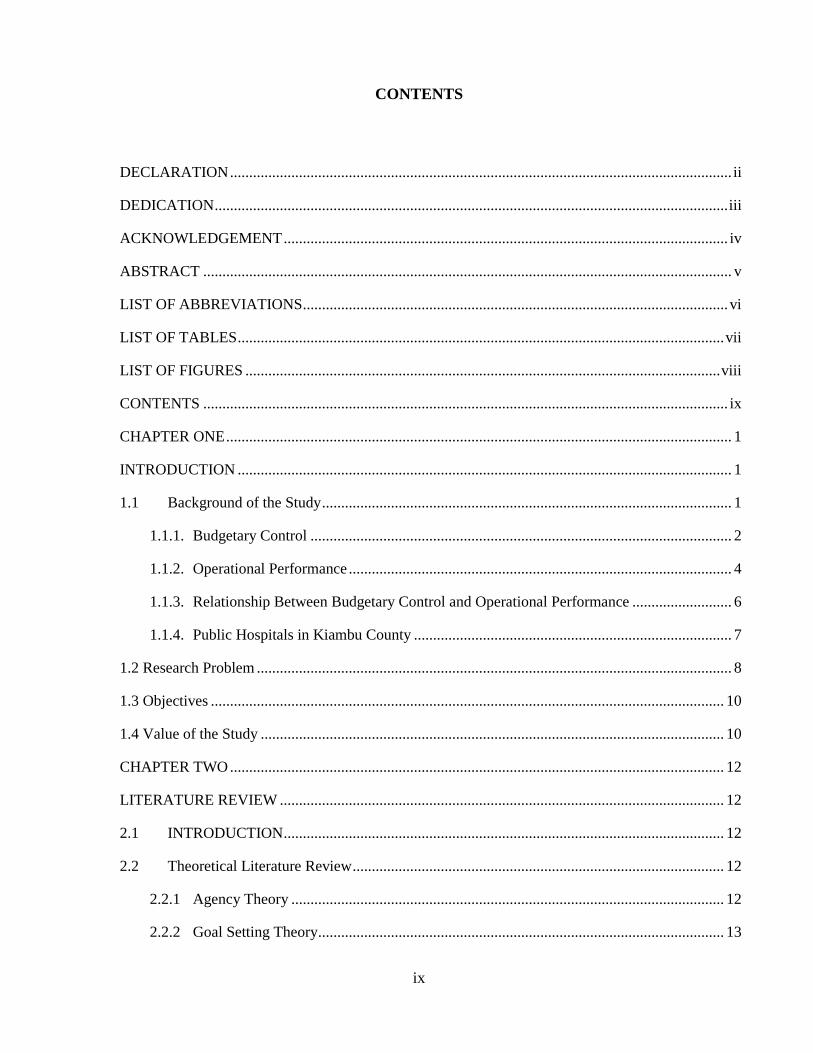
CONTENTS
DECLARATION ................................................................................................................................... ii
DEDICATION ...................................................................................................................................... iii
ACKNOWLEDGEMENT .................................................................................................................... iv
ABSTRACT .......................................................................................................................................... v
LIST OF ABBREVIATIONS ............................................................................................................... vi
LIST OF TABLES ............................................................................................................................... vii
LIST OF FIGURES ............................................................................................................................ viii
CONTENTS ......................................................................................................................................... ix
CHAPTER ONE .................................................................................................................................... 1
INTRODUCTION ................................................................................................................................. 1
1.1 Background of the Study ........................................................................................................... 1
1.1.1. Budgetary Control .............................................................................................................. 2
1.1.2. Operational Performance .................................................................................................... 4
1.1.3. Relationship Between Budgetary Control and Operational Performance .......................... 6
1.1.4. Public Hospitals in Kiambu County ................................................................................... 7
1.2 Research Problem ............................................................................................................................ 8
1.3 Objectives ...................................................................................................................................... 10
1.4 Value of the Study ......................................................................................................................... 10
CHAPTER TWO ................................................................................................................................. 12
LITERATURE REVIEW .................................................................................................................... 12
2.1 INTRODUCTION ................................................................................................................... 12
2.2 Theoretical Literature Review ................................................................................................. 12
2.2.1 Agency Theory ................................................................................................................. 12
2.2.2 Goal Setting Theory .......................................................................................................... 13
x
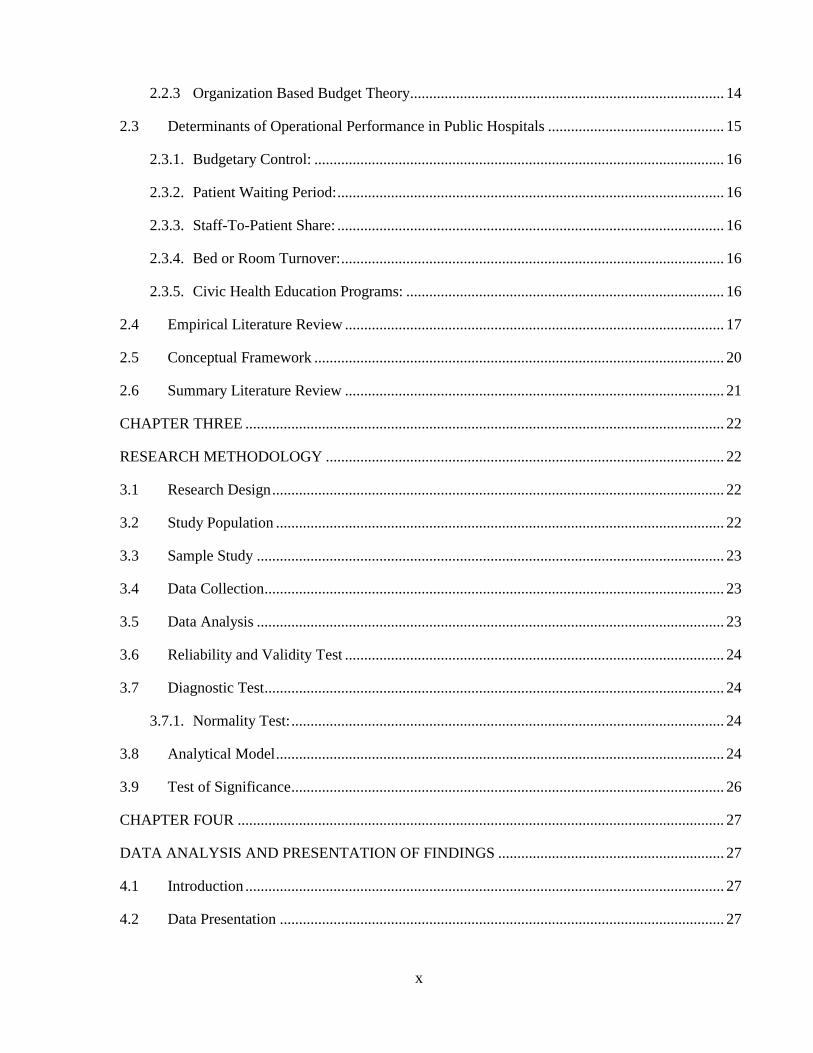
2.2.3 Organization Based Budget Theory.................................................................................. 14
2.3 Determinants of Operational Performance in Public Hospitals .............................................. 15
2.3.1. Budgetary Control: ........................................................................................................... 16
2.3.2. Patient Waiting Period: ..................................................................................................... 16
2.3.3. Staff-To-Patient Share: ..................................................................................................... 16
2.3.4. Bed or Room Turnover: .................................................................................................... 16
2.3.5. Civic Health Education Programs: ................................................................................... 16
2.4 Empirical Literature Review ................................................................................................... 17
2.5 Conceptual Framework ........................................................................................................... 20
2.6 Summary Literature Review ................................................................................................... 21
CHAPTER THREE ............................................................................................................................. 22
RESEARCH METHODOLOGY ........................................................................................................ 22
3.1 Research Design ...................................................................................................................... 22
3.2 Study Population ..................................................................................................................... 22
3.3 Sample Study .......................................................................................................................... 23
3.4 Data Collection ........................................................................................................................ 23
3.5 Data Analysis .......................................................................................................................... 23
3.6 Reliability and Validity Test ................................................................................................... 24
3.7 Diagnostic Test ........................................................................................................................ 24
3.7.1. Normality Test: ................................................................................................................. 24
3.8 Analytical Model ..................................................................................................................... 24
3.9 Test of Significance ................................................................................................................. 26
CHAPTER FOUR ............................................................................................................................... 27
DATA ANALYSIS AND PRESENTATION OF FINDINGS ........................................................... 27
4.1 Introduction ............................................................................................................................. 27
4.2 Data Presentation .................................................................................................................... 27
xi
4.2.1 Long And Short Term Budget Plans ............................................................................. 27
4.2.2 Organization’s Budget Clear Goals And Objectives .................................................... 28
4.2.3 The Organization’s Mission And Vision ...................................................................... 29
4.2.4 Linked Outcomes, Goals And Objectives ..................................................................... 30
4.2.5 Linking Planning, Outcomes, Goals To The Organizational Activities ....................... 31
4.2.6 Prioritizing Of The Coming Year Goals ....................................................................... 32
4.2.7 Preparation of Budget Plan Before The Budget Year ................................................... 33
4.2.8 Level Of Education ....................................................................................................... 34
4.2.9 Department Work Experience ...................................................................................... 35
4.2.10 Strong Organization Structure ...................................................................................... 36
4.2.11 Continuous Training ..................................................................................................... 37
4.2.13 Involvement In Budget Setting Process ........................................................................ 38
4.2.14 Sensitization In The Budget Control Process ............................................................... 39
4.2.15 Involvement of All The Stakeholders ........................................................................... 40
4.2.16 Departments Involvement In The Budgeting Process .................................................. 40
4.2.17 Sharing Of Approved Budgets In Departments ............................................................ 41
4.2.18 Support And Leadership During Process ...................................................................... 42
4.2.19 Budget Preparation Prior To The Overall Budget ........................................................ 43
4.2.20 Motivation To Achieve Objectives ............................................................................... 44
4.2.21 Operational Efficiency .................................................................................................. 45
4.3 Summary and Interpretation of Findings ................................................................................ 49
xii
CHAPTER FIVE ................................................................................................................................. 50
SUMMARY, CONCLUSION AND RECOMMENDATIONS .......................................................... 50
5.1 Summary ................................................................................................................................. 50
5.1.1 Effect of proper planning .................................................................................................. 51
5.1.2 Effect of human resource capacity ................................................................................... 51
5.1.3 Employees stakeholder participation ................................................................................ 52
5.2 Policy Recommendations ........................................................................................................ 52
5.3 Limitations of the Study .......................................................................................................... 53
5.4 Suggestions for future Studies................................................................................................. 54
REFERENCES .................................................................................................................................... 55
QUESTIONNAIRES AND TABLES ................................................................................................. 61
PART A: PROPER PLANNING. ........................................................................................... 62
PART B: HUMAN RESOURCE CAPACITY ....................................................................... 63
PART C: EMPLOYEE AND STAKEHOLDERS PARTICIPATION .................................. 64
PART D: OPERATIONAL EFFECIENCY DATA COLLECTION FORM ......................... 65
1
CHAPTER ONE
INTRODUCTION
1.1 Background of the Study
Brownell (1982) established that submissions that comprise budgetary controls do not have
straight influence on performance directly but in situations where budgetary control is great
there is progressive association amongst performance and budgetary control involvement.
Budget control has both merits and demerits which mostly reflected in performance of the
institutions operations. In operations is considered as integral in many institutions because
resources must be successfully and efficiently utilized. Minute attention has been rewarded to
budgetary controls even though it is largely known as the focal tool for distributing funds to
specific recurring and growth undertakings which have a direct impact on operational
performance of any institution especially in the public sector. The need for efficiency in
operations on service provision in communal organizations through Africa and Kenya puts
communal institutions at the front in formation of control structures. Nevertheless,
sometimes important resources are mismanaged by those that are responsible and put in
charge (Rosen & Gayer, 2010).
Operational performance and budgetary control have been put in good relation by the theory
of Constraints by Eliyahu (1984) stating how managing throughput is challenging especially
with inadequate resources. The theory of Budget control as explained by
Howard and Brown (2015) now comes in giving light on how this challenges revolving
around inadequate resources to improve on efficiency comes in stating that financial
2
resources must be successfully and efficiently accomplished to anticipate results. Apart from
the inadequate resources affecting performance, some other factors under budget control
come about which are well highlighted by the Agency theory on the Principal agent
relationship, agents working for the best interest of the institutions, the Goal setting theory
whereby there has to be purpose and motivation to achieving goals with the most cost
effective way to progress efficiency and the organization based budget theory to have precise
resource allocation and proper planning for performance in any institution.
Public hospitals in Kenya are under more pressure, due to the increasing population and
standards of living, there has been increased pressure on proper facilities, service delivery
and facilitation in these institutions to the citizens. This has been a challenge to the local
immediate public health providers in the community. For any institution, officers in charge of
budget control mostly determine the allocations of resources that each department is
authorized to spend. Therefore, budget controls establish institution performance for every
unit in terms of income and spending. Premchand (2000) argues that if institutions provide
impartially precise forecasts and controls in capital and operations allocations, then there’s
no doubt on the institutional performance. This study intends to show the effects of financial
controls on operational performance in these institutions.
1.1.1. Budgetary Control
Scarllett (2008) refers to budgetary controls as the procedures and values of practice of
reaching given aims by use of budgets. The budgetary control objective helps in allocating
goals for the institution and collective efforts for its achievements. Batty (1979) well-defined
budgetary control to be a system which practices budgets as a way of planning and
controlling all characteristics of producing and or selling supplies or services. Budget control
3
can be determined through proper planning, adequate availability of financial resources,
human resource capacity, involving all stakeholders and staff, Evaluation and control of
budget process not to forget motivation (Srinivasan, 2005). Budgetary control is simply to
regulate foreseen expenditures in an organization all through a specified time or purpose with
proposed procedures of funding the budget goals (Karue, 2013). Apart from providing limits,
budgetary controls will portray the guarantee that the critical requirements of the institutions
are first met in order with the least important dealt with at the end until there are enough
funds to deal with ( Hill & Matthew, 2003).
Budget control can be well viewed through variables as, Proper Planning; a key to
implementation of the programs set out is to have a realistic and accurate planning of
finances. Abdulla and Joshi (1996) argues that planning has to be in agreement with the
continuing projects approach using short term to achieve the targets set out. Hence before
coming up with budget controls, policies backed by planning have to be established (Dunk &
Hopwood, 2001). Budgets should be coordinated with one another to make sure that
implementation is effective to save costs and time (Horngren & Dater, 2005). Another
variable is Human Resource Capacity, to prepare an effective budget and budget controls.
According to Silva and Jayamaha (2012) employees play an integral role in monitoring the
expenditures, setting up revenue resources and evaluating performance of the said allocations
to enable effective production of the institutions. Administrators in charge must have the
needed capacity in preparation and implementation of budgetary controls. Involving of staff
and stake holders, as a budgetary control variable, Stakeholders are of keen interest on the
positive performance of the business enterprise they have interest in (Obigbemi, 2013). There
4
is attachment to the budgetary controls and allocations leading to motivate to achieve their
goals using the budget allocations impacting performance.
One of the advantages of the budgetary control being profit maximization highlighted by
Preetabh (2010) the purpose of the budgetary control through planning and critical control
over expenditure and using then resources in the best use is to maximize profits. Secondly
Coordination, this is achieved through coordination of different departments. It was noted
that in any institution departments have a bearing on each other therefor making it necessary
for the coordination of this departments to achieve the targets set by the budget. Preetabh
(2010) also noted that budgetary controls also help achieve specific time aims. All efforts are
normally put together to help achieve these goals by giving departments targets that they
need to achieve. These efforts are targeted to specific goals. Budgetary controls will also
provide a platform of comparing the actual budgets to the budget targets thus showing where
there is deviation at an early stage. Performance is evaluated by each department heads
which in turn enables management by exception.
1.1.2. Operational Performance
Performance refers to the degree to which an organization’s goals and purposes are achieved
effectively and efficiently while financial performance is overall degree of a business’s
general monetary status in certain period. Performance in public sector can be examined on
different levels of aggregation (Pollitt & Bouckaer, 2004). There will be analyzing of
incentives in performance of the managers involved. Extraordinary performance mirrors
management value and efficiency in use of resources. According to Gavrea et al (2011) one
of the most critical factors and arguably the most significant gauge in management research
is organizational performance. Unceasing performance is the objective of any institution
5
since only through performance, these institutions are able to develop and progress. Public
Health sector performance signs are categorized to three parts which aare Quality-
Effectiveness, Efficiency- Financing and Accessibility–Equity. Signs like the percentage of
clinic regular duration of stay based on diverse diagnosis and the mean rate of inpatient
period of waiting are considered with utmost priority performance signs of communal
hospitals (Gholamzadeh, Beyrami, Jannati, & Jaafarabadi, 2013).
Performance measurement recommends a procedure where main emphasis is on the
processes that tell the efficiency and efficiency of certain set actions (Neely, Gregory, &
Platts, 1995). These measures and signs act as substitutes or representations for institutions
activities (Ijiri, 1975). Measurement of performance characterizes administration and control
systems that give information to be used by all users. Customarily, the accomplishment of an
institution has been calculated through monetary measures. The performance scrutiny detects
the business strengths and weaknesses by appropriately establishing associations between
items of the financial statements and balance sheet Indian electronic thesis and dissertations.
Efficiency can be measured through benchmarking by comparing service providers and their
services, individually or collectively, and also through economic assessment through
comparing alternative hospital programs on cost–effectiveness, and measuring program
outcomes based on physical unit of health status, such as the number of lives saved and
disease reductions. Minimization of cost compares costs in programs where clinical evidence
portrays the same outcomes for alternative health programs (Peacock, Chan, Mangolini, &
Johnsen, 2001).
6
1.1.3. Relationship Between Budgetary Control and Operational Performance
According to Hope and Fraser (2003) budgetary control is not greatly as a fiscal planning but
as a performance controlling process that leads to and achieves that plan. This procedure is
about assenting upon and managing goals, rewards, strategies, and funds for the year in the
future, and then measuring and Control performance in contradiction of that agreement. It
can be said to talk about the situations regarding how certain services are handled,
effectiveness in provision of services and performance and using the expertise and awareness
efficiently. Therefore there is need for the administrators to look at factors which define
performance in hospitals such as budget controls ( Muliro, Nambuswa, & Namusonge, 2016).
The need for efficiency and accountability of service delivery across positions institutions at
the front line in establishing of control structures. Most public hospitals reform programs that
have been in the emerging countries were made known as part of the SAP – Structural
Adjustment Programs by the World Bank in the 1980’s.
An arguemement by John and Ngoason (2008) that the practices of integrating strategic
management and budgeting which enables it to be competitive and increase organizational
performance. Budgetary control structures, at the middle of improving institutions
proficiency and regulatory costs, then the necessity to scrutinize the role of the structure in
the hospitals monetary and operational performance is of top importance. According to
Jagongo and Oduor (2013) budgetary control in Kenyan public hospitals can well
Productivity and efficiency: this is well portrayed as important funds in the institutions
development; hence, they have to be reviewed and constantly scrutinized in the hospitals.
Identifying operational efficiency and acknowledgment of aspects touching hospital
efficiency are corresponding measures for size and value enhancements. Removal of factors
7
involved in hospital ineffectiveness can, bring about escalating efficiency, improve service
delivery and in making more realistic, efficient and better decisions. Even though Otley and
Pollanen (2000) make known that budgetary involvement, control and task uncertainty
openly affect performance adversely. This research as a result anticipates further
investigating the association between budgetary controls and the progressive effects on
performance of public hospitals.
1.1.4. Public Hospitals in Kiambu County
World Health Organization (WHO) defines health systems as consisting of all organizations,
people and actions whose primary intent is to promote, restore or maintain health (Musyoka,
2015). Budget control has been difficult to achieve in public hospitals as a number of factors
including, adequate funds from the primary source, the government is never sufficient as the
needs always outgrow the resources. Most public hospitals in Kenya are managed by
administrators who are mostly do not have the needed capacity in running the institutions
eventually affecting performance.
The government of Kenya in 1994 approved the (KHPF) Kenya Health Policy Framework to
be used as a blue print in the management and development of the health sector. The
Ministry of health, Kenya, developed an implementation and action plan whereby they
established the (HSRS) Health Sector Reform Secretariat, in the year 1996, under a
committee to lead and oversee the implementation process. This policy’s initiative focused
on responding to constraints such as inefficient funds utilization, expenditure, inadequate
management skills among others (Muga, kizito, Gakuruh, & Mbayah, 2004).
8
Kiambu County in totality has 364 health facilities range. The county public facilities, are as
follows Thika District Hospital as the only level-five hospital, 3 level-4 hospitals and 4 level-
three hospitals. There are also 20 Health Centres level-two and 54 dispensaries, level-one all
over the county. The rest are private hospitals and clinics (County Government Of Kiambu,
2017). It has been noted that in Kenya the growth of the facilities and fixed assets since
attaining independence has not related with the growth of the recurrent budget allocations.
This in turn has caused shortage of most important inputs in service delivery. Using the first
report on poverty in Kenya, Kenyan Report (1998) some citizens in about 9% found that the
public health care was too costly and 13% said that some of the facilities were too far, 54%
said that there was scarcity of drugs or non-availability.
1.2 Research Problem
According to Howard and Brown (2002) budgetary control as a system of controlling costs
includes comparing actual performance by acting upon results to achieve maximum
operational efficiency in performance. Budget control in any institution has advantages and
disadvantages which are mostly reflected on performance. The World Bank (2004) has
however demonstrated to be virtually difficult to establish operational effective institutions
and endure them over time especially due to perceived low financial resource management
and standing of the public sector. An organization OECD (2008) urgues that budgetary
control on expenditure, improving allocation and efficient use of funds improves public
sector performance. According to Dixon, (2011) the need for accountability, proper
management and efficiency in operations has been faced by financial challenges among
which is controls on expenditure.
9
A research by Bloom et al (2009) quantified performance in health institutions is poor related
to other organizations they say that it’s even of poorer quality in public than private hospitals.
In the 2012/2013 financial year, operational performance of health institutions in general
emerged as an subject of worry. In Kenya, introduction of Performance contracting by the
government in 2004 was aimed to improve service delivery. It aimed to reform the mindset
of the public service operations away from a culture of inward looking towards a business-
like, focused on the customer and results. The introduction of the Result-based Management
(RBM) strategy, in 2004, was also directed at improving operational performance, service
delivery, and governance (John, Shedrack, & Douglus, 2015). The people of Kenya can
benefit from an improved operational performance evidently having quality, accessible, and
safe health services as a key obligation from the government institution.
A journal by Bingham University (2015) revealed that a compulsory and necessary condition
for realizing an effective budgetary control is the contribution of all relevant interested party
in the making of the budget, proper planning and Human resource capacity. Research
conducted on the health sector has indicated that most challenges affecting the global health
sector are attributed to human resource management; Performance management is an aspect
of HRM (John, Shedrack, & Douglus, 2015). A study on the budgetary control in NGO’s and
its effects on their performance by Nyambura (2014) where her findings recommended that
workers ought to be informed on budgetary controls and effects on performance to the
institutions clearly demonstrating that there is a gap on the relationship on performance and
budgetary control. A study on budgeting and budgetary control and performance evaluation
by Gershon (2012) findings were that the key participants are not working with the budgetary
10
controls because no proper training and planning and role they were obligated potrying an
opening between operations and budgetary controll.
The writings studied disclose that there should be efforts to implement budgetary controls
seeking to disclose resource constraints, and operational proficiency, a gap remains on the
impact of the financial controls on performance of public administrations. This research
therefore sought to examine the effects of budget control on the operational performance of
public hospitals in Kiambu County.
1.3 Objectives
The objective of this study is to evaluate the effects of budget control on the operational
performance of public hospitals Kiambu County. This research seeks to show the relationship
with the effects of the budgetary control and operational performance.
1.4 Value of the Study
This report highlights the effects of budget control on the operational performance of public
hospitals in Kiambu County. This report gives the necessary recommendations to all
stakeholders involved in public health in operations management the importance of proper
and adequate budget controls for better operational performance of hospitals. This study
seeks to show how operational functions have to support cost-containment efforts through
proper planning and good human resource capacity and participation. The main beneficiaries
of this writing shall be the public health care as they will be well advised on making the best
financial management decisions for well-organized and operational output in terms of service

11
delivery and enhance accountability. The Patients / Clients of the public health sector as they
will receive proper, efficient and effective services as they are the main contributors to the
service though taxes. This study will also be of benefit to other researchers by gaining an
insight of operational efficiency through budget control performance and also form a base for
their research.
12
CHAPTER TWO
LITERATURE REVIEW
2.1 INTRODUCTION
Chapter two covers the effects which can be resulted by usage of budgets controls gets
control and operation performance, the observed studies on the matters relating to financial
plan control and operation performance and the part summary.
2.2 Theoretical Literature Review
The theoretical literature review will revolve around the subjects involved in the budget
control some of its effects and the players involved with an implication to the operational
performance.
2.2.1 Agency Theory
Two of the theory’s’ scholars Jensen and Meckling (1976) define agency theory as a form
which the principal appoints the agent to do services on their behalf that comprises decision
making authority. There is always reason that the employee will not perform in the best
interest of the principal. In turn there are limits that the principal can put in which include
enticing the agent by incurring observing costs made to limit the abnormal activities of the
agent. An important component of any principal-agent relationship is to stipulate an indicator
that will be the main component of the bond. When the agent is heading the department,
performance measure should preferably be based on a set of signs including output, outcome,
and impact (Leruth & Paul, 2007) .
13
Budgetary control can only be effective if the agents have the capacity and motivation to
come up with good controls and also work to the best interest of the principal who is the
government by cost effectively using resources in achieving the desired results. Proper
planning, right human resource capacity and participation are among the variables that can be
undertaken through participation evident in this theory. The agency theory applies in this
research where hospitals must engage on a proper principal agent relationship that is based
on performance individually and through the line departments under which they are
entrusted. Budgetary controls will provide a gauge for performance for the agents where the
principal can follow the institutions performance.
2.2.2 Goal Setting Theory
An argument by Latham and Locke (1990), states that goal setting theory is based on the
purposeful behavior of the human nature. Goal directedness shows the actions of all
institutions or human being and organisms as plans thus the theory fall on both conscious and
non-conscious action. In this theory, Locke and Latham urge that there is higher
performance when people simply do their best. Such goals make impact on the performance
of institution units and individuals over long periods. Goals in relations to performance can
be put into content, intensity and specificity (Locke & Latham, 1990). Goals can impact
motivation and presentation by influencing persons to focus on detailed objectives and make
them escalate their effort, be persistent when faced with setbacks and plan strategies that will
propel them to reaching these goals. By enduring the setbacks and challenges one attains
recognition, promotions and other rewards.
Performance in operations can be measured mainly of there is achievement of goals set for
the participants to achieve. Budgetary control measures have to be in a way that the
14
employees feel challenged. Public hospitals in Kiambu County can adopt the goal setting
theory by setting targets that are directed through the budget on, patient lives saved,
appropriate efficient medical care, number of patients attended too, response time, etc. This
in turn motivates the staff to overcome the challenges and the need to achieve through the
setbacks. Making tough challenges provokes individuals and departments to attain self-
satisfaction and recognition promoting efficiency, effectiveness and self-satisfaction.
Through this, the goal setting theory continually invokes raising standards by different
departments and individuals and in overall the whole institution perfuming with great vision
and mission to accomplish their goals.
2.2.3 Organization Based Budget Theory
According to Gianakis and McCue (2002) among many purposes of the budget, one of them
is to boost the institutions management in making the précises resource allocation decisions.
In search of this, the process of allocation of resource should work as a balance to the factors
generated by characteristics of the many services provided in public institutions. The formats
and processes of budgets should be scrutinized for their specific utility and considering the
capacity of the management staff. The basic function of the professionals in charge of these
public institutions is to maintain the institutions flow of resources. Public institutions’
resource allocation process serves as a developing role for both the internal structure of the
institution and its relationship with the external environment in regards to development. This
approach provides a structure to inform and to guide the actions of the professionals in public
institutions.
Budgetary control through proper planning in setting budgets, public hospitals can be able to
allocate the scarce resources by either having formed strategies based on needs and historical
15
data from the public hospitals. The role of the finance official in the institution is to ensure
there is future financial viability of the firm (Khan & Hildreth, 2002). Operations are bound
to be efficient as there is known and precise allocation of resources to support these
operations. The institution based approach to the budget allows normative theorist put
importance on the public institutions, role of the finance, distinctive competencies of the
professional. Therefore one suggestion of a normative theory for the institution in the public
sector budgeting is that the finance officials should endeavor to protect the future finance
viability of the public hospitals.
2.3 Determinants of Operational Performance in Public Hospitals
Operational performance of heath care institutions has not had harmony between researchers.
Provan (1985) has defined health care institutions performance in relations of bed occupancy,
mortality rate among others. He on the other hand acknowledges that these processes lack
generalizability. Generalizability may be affected mainly due to the type / Level of hospital
in question, the size of the institution in terms of resources available for the hospital. Bloom
et al. (2009) argue that administration in health care institutions is not similar with that of
industrial firms. He says that public hospitals have worse practices than private ones.
Healthcare bodies have unique complications for supervision since industrial choice makers
have to contemplate fundamentals such as patient right to services, dependability and
importance of care. These components distinguish health care providers from different kinds
of customer related establishments since failures in these sectors, even at a small scale level,
could result in death (Ray, Plowman, & McDaniel, 2010). Some of the operational measures
are as below (Dylan, 2016):
16
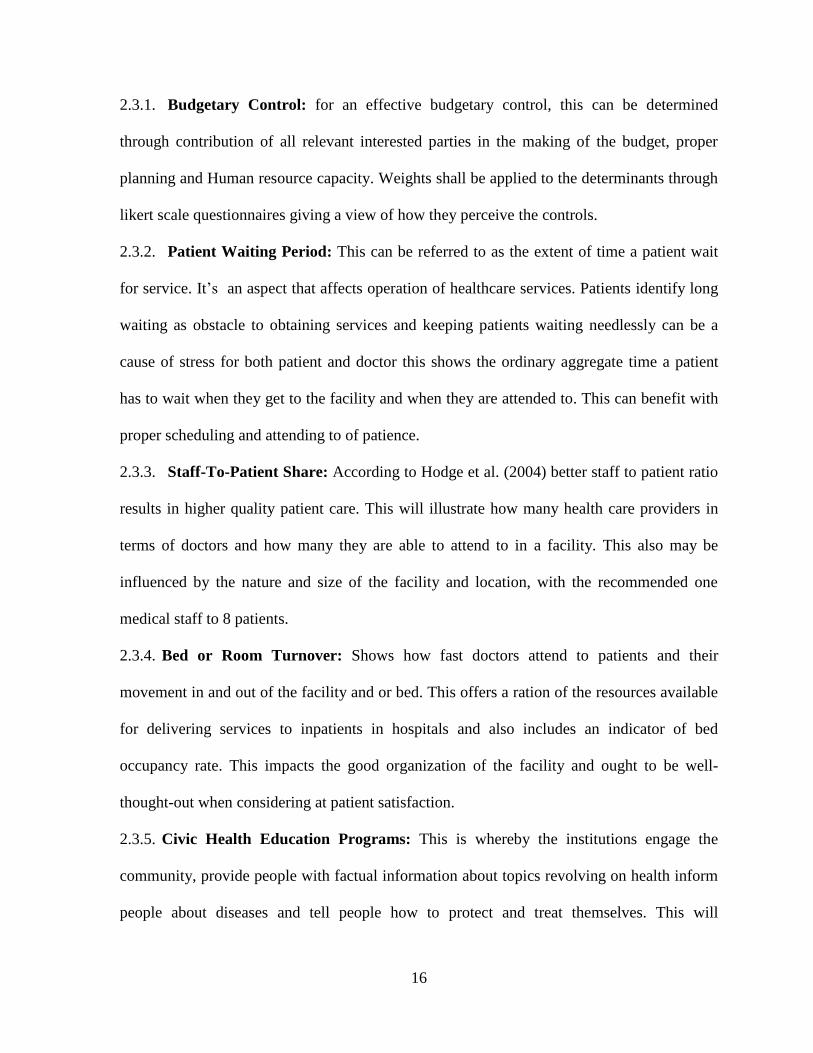
2.3.1. Budgetary Control: for an effective budgetary control, this can be determined
through contribution of all relevant interested parties in the making of the budget, proper
planning and Human resource capacity. Weights shall be applied to the determinants through
likert scale questionnaires giving a view of how they perceive the controls.
2.3.2. Patient Waiting Period: This can be referred to as the extent of time a patient wait
for service. It’s an aspect that affects operation of healthcare services. Patients identify long
waiting as obstacle to obtaining services and keeping patients waiting needlessly can be a
cause of stress for both patient and doctor this shows the ordinary aggregate time a patient
has to wait when they get to the facility and when they are attended to. This can benefit with
proper scheduling and attending to of patience.
2.3.3. Staff-To-Patient Share: According to Hodge et al. (2004) better staff to patient ratio
results in higher quality patient care. This will illustrate how many health care providers in
terms of doctors and how many they are able to attend to in a facility. This also may be
influenced by the nature and size of the facility and location, with the recommended one
medical staff to 8 patients.
2.3.4. Bed or Room Turnover: Shows how fast doctors attend to patients and their
movement in and out of the facility and or bed. This offers a ration of the resources available
for delivering services to inpatients in hospitals and also includes an indicator of bed
occupancy rate. This impacts the good organization of the facility and ought to be well-
thought-out when considering at patient satisfaction.
2.3.5. Civic Health Education Programs: This is whereby the institutions engage the
community, provide people with factual information about topics revolving on health inform
people about diseases and tell people how to protect and treat themselves. This will
17
determine how frequently various programs have been done to increase awareness and
prevent contracting diseases.
2.4 Empirical Literature Review
A study by Amalokwu and Ngoasong (2008) in their paper Budgetary and management
control practices, in Guinness Nigerian. The study objective was to suggest the most
appropriate management control tool (focus being on the budget) in Guinness Nigeria Plc.
Based on their findings through qualitative approach and data collected being primary data,
he used a sample of 50 respondents. His conclusion financial planning could assist the
creating and supporting of competitive benefits and that budgetary control were an effective
tool which enhances competitiveness which in turn affected high performance in the
organization. Adapting this research to the public hospitals is bound to reveal lack of
budgetary control in Kenyan public hospitals, the results from the above study do not
replicate our public institutions. This identifies the gap which this study seeks to determine.
A study by Onduso (2013) on effects of budgets on fiscal performance of manufacturing
companies in Kenya’s Capital city Nairobi, his main objective was to determine how effects
on the performance financially of Nairobi county manufacturing companies budgets. His
methodology was cross sectional enquiries technique with eighteen respondent companies
listed in the NSE employing a census survey. He used both primary and secondary data. His
findings were that there’s a great progressive effect of budgets on financial performance
measured through ROA Return on Assets. He recommended that proper carrying out of the
budget has to be recommended through capacity building and observing for evaluation.
Public hospitals in Kiambu need to adapt his findings which are focused on capacity building
18
to improve on performance in the institutions and also through proper budget implementation
as a control measure. This reveals the two as gaps in public operational performance as
effects from budgetary control that need to be reviewed.
A case study with the title challenges of budgeting at national social security fund was
conducted by Wamae (2008) with an objective to establishing the challenges faced when
making the budget to be used determine how to effectively face these challenges. He used the
descriptive methodology to analyses his data from 15 people top management and BOD. His
findings were the biggest challenges comprised; commitment by the management to the
budget, limited time in preparation of the budget, poor management of expenditures. In
relations to this study, public hospitals undergo similar challenges which this study seeks to
reveal the gap in regards to budgetary control and operational performance. Public
institutions have not embraced budgetary control which in turn has affected their
performance. Highlighting the variables involved will give light in resolving the issues on
performance in the public hospitals and other public institutions.
A study on budgeting and budgetary control and performance evaluation: All terrain Service
Group (ATS) by (Gershon, 2012). In his objective was to ascertain the role budgets played in
the studied company and the key factors that contribute to the daily operations of the
company. This research was work conducted with special. He collected data from 44 workers
in different departments and tiers of management through questionnaires using both
quantitative and qualitative methods in analyzing the data. His data was primary and
secondary. His findings were that the key participants are not working with the budgetary
control because no proper training and planning, were obligated. This has been replicated in
this study as proper training and capacity have been highlight as one of the main variables

19
that affect performance. Gershons study was more in a private company showing the gap in
relations to budgetary controls and performance giving path to this study in public hospitals
in Kiambu County.
20
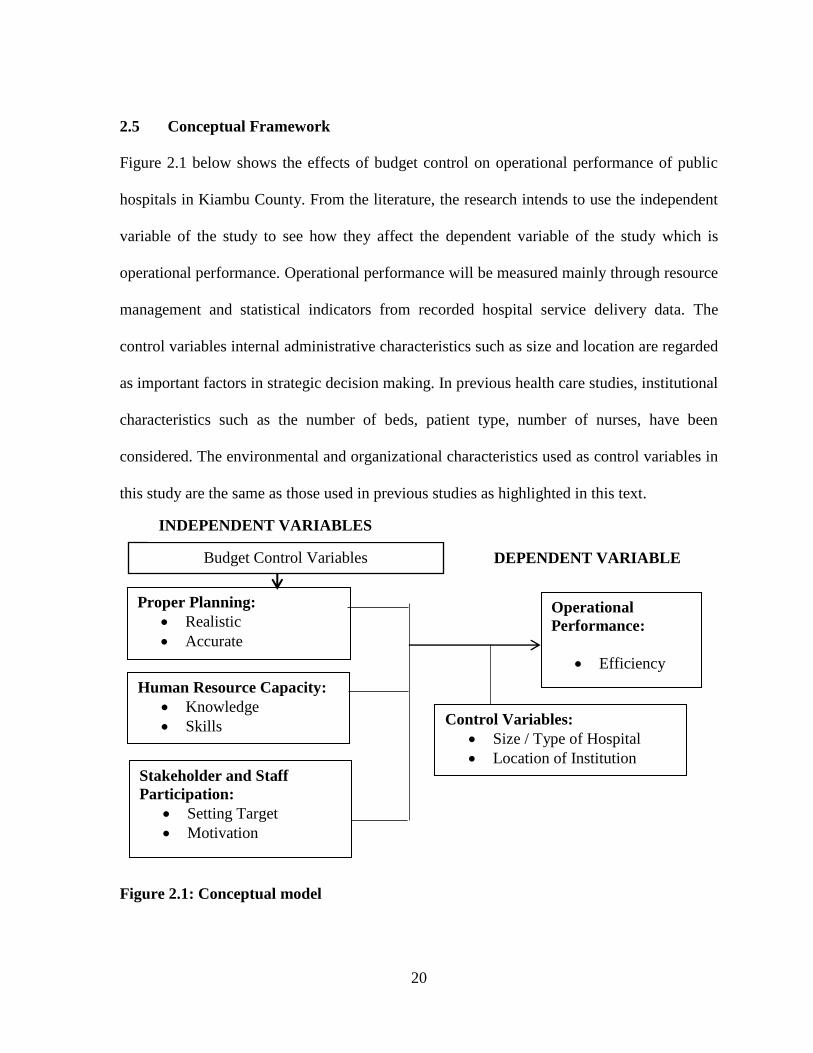
2.5 Conceptual Framework
Figure 2.1 below shows the effects of budget control on operational performance of public
hospitals in Kiambu County. From the literature, the research intends to use the independent
variable of the study to see how they affect the dependent variable of the study which is
operational performance. Operational performance will be measured mainly through resource
management and statistical indicators from recorded hospital service delivery data. The
control variables internal administrative characteristics such as size and location are regarded
as important factors in strategic decision making. In previous health care studies, institutional
characteristics such as the number of beds, patient type, number of nurses, have been
considered. The environmental and organizational characteristics used as control variables in
this study are the same as those used in previous studies as highlighted in this text.
Figure 2.1: Conceptual model
Proper Planning:
Realistic
Accurate
Human Resource Capacity:
Knowledge
Skills
Stakeholder and Staff
Participation:
Setting Target
Motivation
Operational
Performance:
Efficiency
Budget Control Variables DEPENDENT VARIABLE
INDEPENDENT VARIABLES
Control Variables:
Size / Type of Hospital
Location of Institution
21
2.6 Summary Literature Review
The review of literature has focused largely on empirical opinions of performance centered
on the effects of budgetary control. At a broad view from the local studies, the budgetary
control variables not practiced in the right manner give limitations on the reactions or
performance occurring in the different firms with positive effects vice versa. At the macro
level, budgetary control variables on operational performance have been well thought-out in
terms of variables such as Proper planning, The right human capacity and stakeholder
participation.
General budgetary control as an executive technique must be given sufficient consideration it
deserves in any institution, it is certain that proper planning deprived of an effective control
for the purpose of computing performance will result in sub optimality and inefficiency,
Bingham University (2015). The theories reviewed support the importance of budgetary
control measures giving impact such as in motivation, preparedness and attachment in
achieving set goals leading to improved performance of our public hospitals. All budgetary
control and performance theories are centered to support their importance. Thus this Chapter
provides a basis for the next in which the development of budgetary control variables are
outlined, and various design calculations are critically analyzed.

22
CHAPTER THREE
RESEARCH METHODOLOGY
3.1 Research Design
In this study, the research process will be utilized so that the conclusions of the study can be
thoroughly recognized. The first part refers to the methodology portion. The second part
illustrates the strategies that can be used in interpreting the results of the findings.
This study will adapt descriptive research method practices. Descriptive method of research
is to bring together information about the contemporary existing condition. This is kind of
research is opted considering the desire of the scholar to obtain firsthand data from the
respondents so as to formulate rational and sound conclusions and recommendations for the
study.
3.2 Study Population
Kiambu County in totality has 364 health facilities range. The county public facilities, are as
follows Thika District Hospital as the only level-five hospital, 3 level-4 hospitals and 4 level-
three hospitals. There are also 20 Health Centres level-two and 54 dispensaries, level-one all
over the county. The rest are private hospitals and clinics. (County Government Of Kiambu,
2017)
23
3.3 Sample Study
The study area Kiambu County public hospitals, its constituents and its environs the target
population being the 2 institution administrators of the public health hospitals from the Thika
level 5 District Hospital, three level-4 in Gatundu South, Kiambaa and Kikuyu
Constituencies, four level-three in Gatundu North, Juja, Kiambaa and Limuru Constituencies.
There are 12 level-two (Health Centres) giving a total of 20 public health insitutions and a
total of 40 respondents.
3.4 Data Collection
Data collected shall be in the form of both Primary and secondary data. The primary source
of data shall be from the questionnaires and interview questions constructed by the
researcher. The primary data will give the detailed statistical units used in the study further
broken down into detailed classifications. The secondary sources of data will come already
collected data from the hospital data bases and the management. Secondary data is more
convenient to use because it is already condensed and organized. Furthermore, analysis and
interpretation will be more easily done.
3.5 Data Analysis
Data analysis is described by Marshall and Rossman (1999) the process of getting order,
configuration and sense to the bulk of collected data. The coding and analyses of this study
will follow the methods and guidelines of commonly used by other researchers for ease of
understanding the information.
24
3.6 Reliability and Validity Test
When planning a questionnaire for the primary data, the researcher ought to make sure it is
valid, reliable and instantly recognizable (Richards & Schmidt, 2002). The Validity of the
data collection tools was done with the help of an expert (the research supervisor). The
reliability will be tested using the Cronbach’s Alpha value whereby each variable
understudy should not be less than 0.6 for them to be deemed reliable.
3.7 Diagnostic Test
In diagnostic tests, an evaluation should be made of the reproducibility, accuracy, validity of
the study, expression of the results, and assessment of the generalizability of the results.
3.7.1. Normality Test:
For each mean and standard deviation combination a theoretical normal distribution can be
determined. The method of assessing whether data are normally distributed or not fall into
two broad categories graphical through that histogram and statistical through chi square
normality test (statistics How To, 2017).
3.8 Analytical Model
To measure budget control, top administrators will be given questions that look to determine
how set budgets controls affect their daily operations and how significant they consider
meeting budget objectives affects the way their top managers gauge their performance.
Measuring of the variables shall be by use of a five point likert scale will be used to interpret
the level of classification. Questions used to measure variables such as Proper Planning,
Human resource Capacity, Staff and Stakeholder Participation and Adequate resources
25
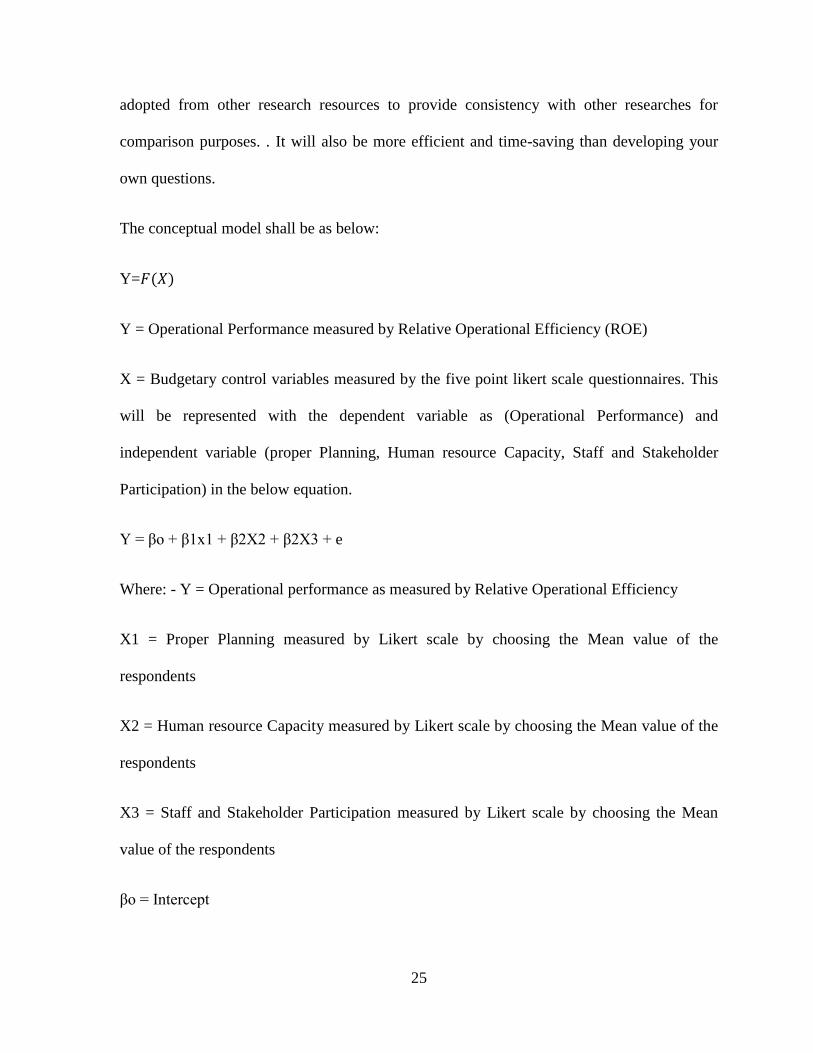
adopted from other research resources to provide consistency with other researches for
comparison purposes. . It will also be more efficient and time-saving than developing your
own questions.
The conceptual model shall be as below:
Y=
Y = Operational Performance measured by Relative Operational Efficiency (ROE)
X = Budgetary control variables measured by the five point likert scale questionnaires. This
will be represented with the dependent variable as (Operational Performance) and
independent variable (proper Planning, Human resource Capacity, Staff and Stakeholder
Participation) in the below equation.
Y = βo + β1x1 + β2X2 + β2X3 + e
Where: - Y = Operational performance as measured by Relative Operational Efficiency
X1 = Proper Planning measured by Likert scale by choosing the Mean value of the
respondents
X2 = Human resource Capacity measured by Likert scale by choosing the Mean value of the
respondents
X3 = Staff and Stakeholder Participation measured by Likert scale by choosing the Mean
value of the respondents
βo = Intercept
26
β = Coefficient of independent variables
e = error term
The study will use secondary data to quantify the operational performance the key type of
measure was efficiency measure. The independent variables X1 to X3 are variables of
Budget control used for this study which was dignified using the several queries asked the
respondents in the questionnaire.
3.9 Test of Significance
This research hypothesis seeks to show the relationship between budgetary control and
operational performance. Whereby operational performance is being affected by how budget
controls are implemented. Research hypothesis: budgetary controls affect the operational
performance in public hospitals in Kiambu county. Null hypothesis: budgetary controls do
not affect the operational performance in public hospitals in Kiambu county.
27
CHAPTER FOUR
DATA ANALYSIS AND PRESENTATION OF FINDINGS
4.1 Introduction
This chapter covers the data presentation of the collected data on planning, monitoring and
control, participative Budgeting and performance including summary and interpretation of
the findings of the research. It also discusses the major findings and compares with previous
studies to understand how they conflict or similar.
4.2 Data Presentation
4.2.1 Long And Short Term Budget Plans
Data showing the response on presence of long and short terms plans in the organization
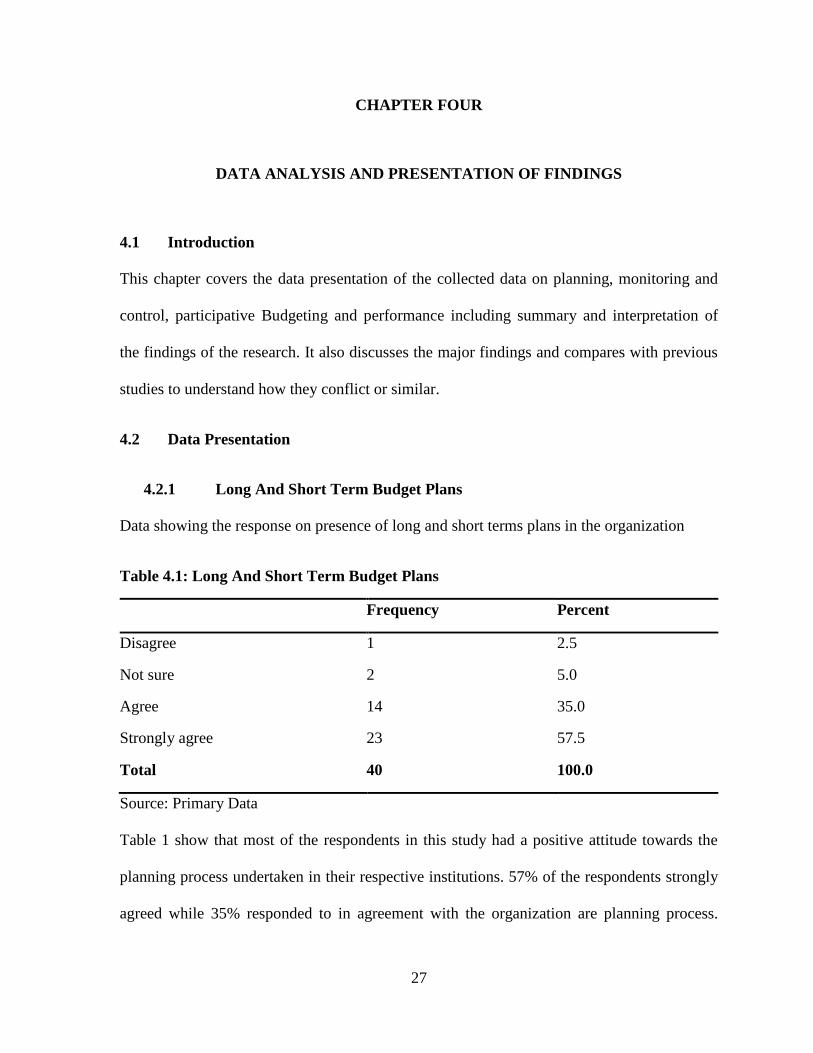
Table 4.1: Long And Short Term Budget Plans
Frequency Percent
Disagree 1 2.5
Not sure 2 5.0
Agree 14 35.0
Strongly agree 23 57.5
Total 40 100.0
Source: Primary Data
Table 1 show that most of the respondents in this study had a positive attitude towards the
planning process undertaken in their respective institutions. 57% of the respondents strongly
agreed while 35% responded to in agreement with the organization are planning process.
28
This is an indicator that the employees were involved in decision making and planning of
healthcare institutions in Kiambu County.
4.2.2 Organization’s Budget Clear Goals And Objectives
Distribution table showing responses on whether the organization has clear goals and
objectives
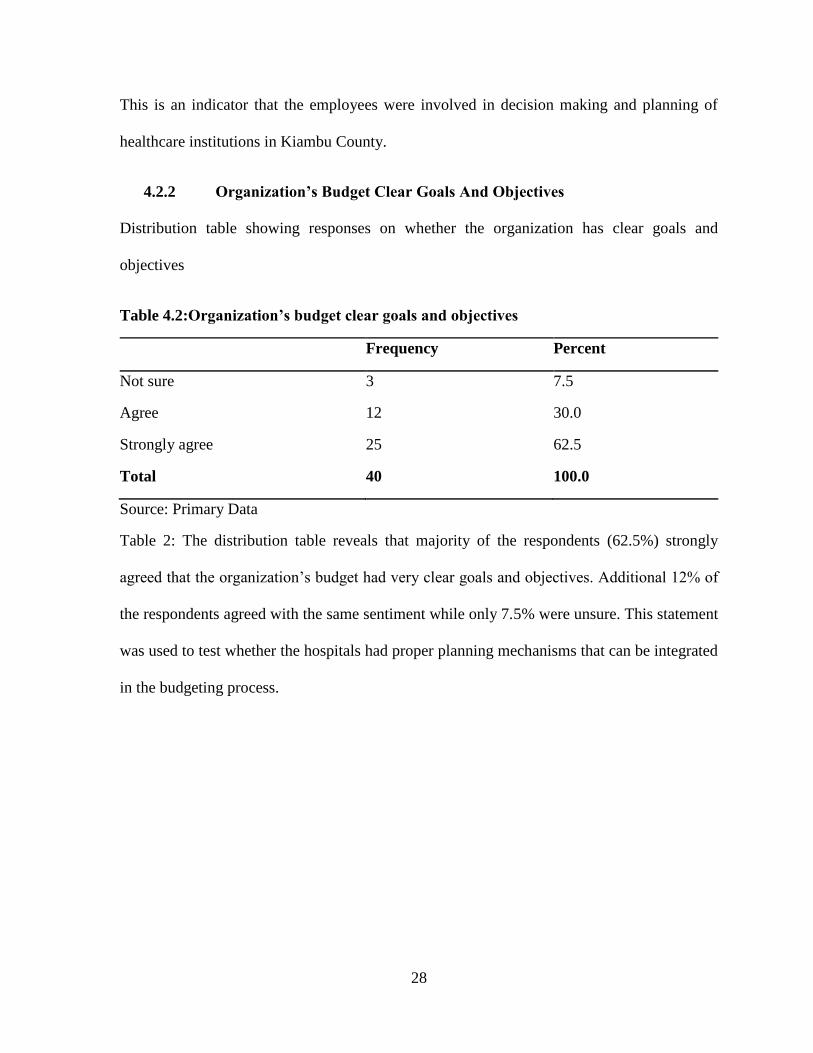
Table 4.2:Organization’s budget clear goals and objectives
Frequency Percent
Not sure 3 7.5
Agree 12 30.0
Strongly agree 25 62.5
Total 40 100.0
Source: Primary Data
Table 2: The distribution table reveals that majority of the respondents (62.5%) strongly
agreed that the organization’s budget had very clear goals and objectives. Additional 12% of
the respondents agreed with the same sentiment while only 7.5% were unsure. This statement
was used to test whether the hospitals had proper planning mechanisms that can be integrated
in the budgeting process.
29
4.2.3 The Organization’s Mission And Vision
Histogram showing data distribution of the respondents in regards to budgets covering the
organization’s mission and vision.
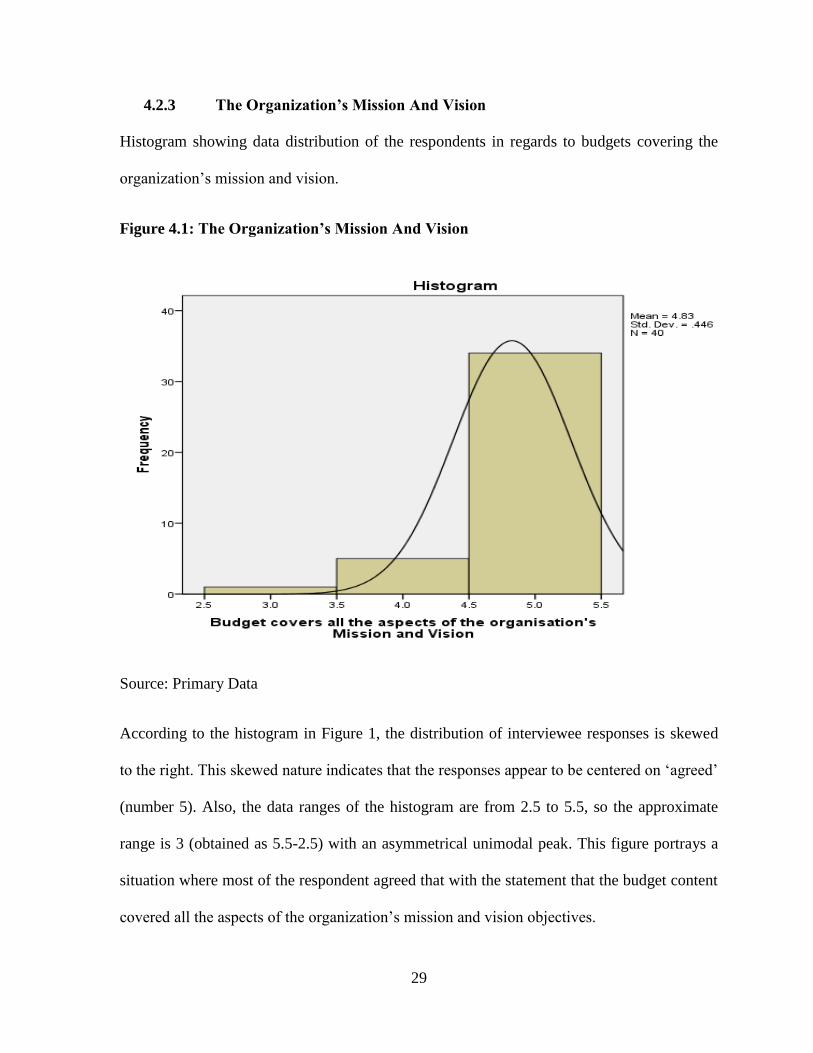
Figure 4.1: The Organization’s Mission And Vision
Source: Primary Data
According to the histogram in Figure 1, the distribution of interviewee responses is skewed
to the right. This skewed nature indicates that the responses appear to be centered on ‘agreed’
(number 5). Also, the data ranges of the histogram are from 2.5 to 5.5, so the approximate
range is 3 (obtained as 5.5-2.5) with an asymmetrical unimodal peak. This figure portrays a
situation where most of the respondent agreed that with the statement that the budget content
covered all the aspects of the organization’s mission and vision objectives.
30
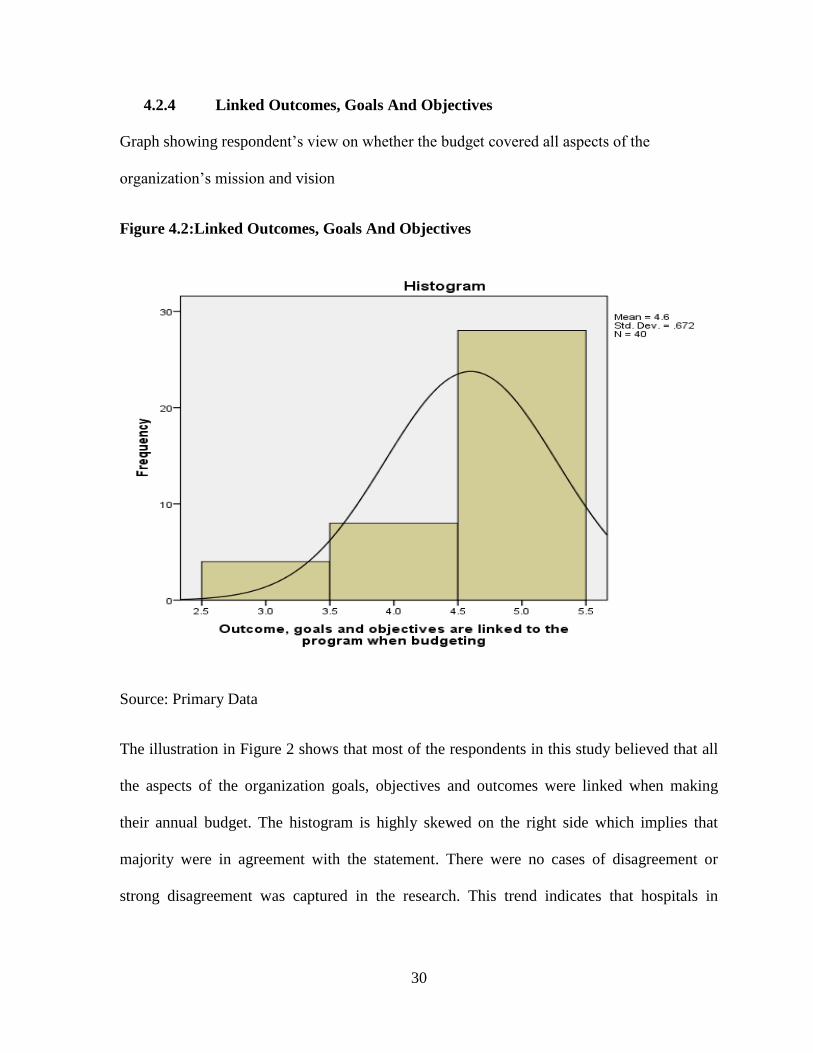
4.2.4 Linked Outcomes, Goals And Objectives
Graph showing respondent’s view on whether the budget covered all aspects of the
organization’s mission and vision
Figure 4.2:Linked Outcomes, Goals And Objectives
Source: Primary Data
The illustration in Figure 2 shows that most of the respondents in this study believed that all
the aspects of the organization goals, objectives and outcomes were linked when making
their annual budget. The histogram is highly skewed on the right side which implies that
majority were in agreement with the statement. There were no cases of disagreement or
strong disagreement was captured in the research. This trend indicates that hospitals in
31
Kiambu County set vision and mission statements that were within the scope of the
respective institution to accomplish.
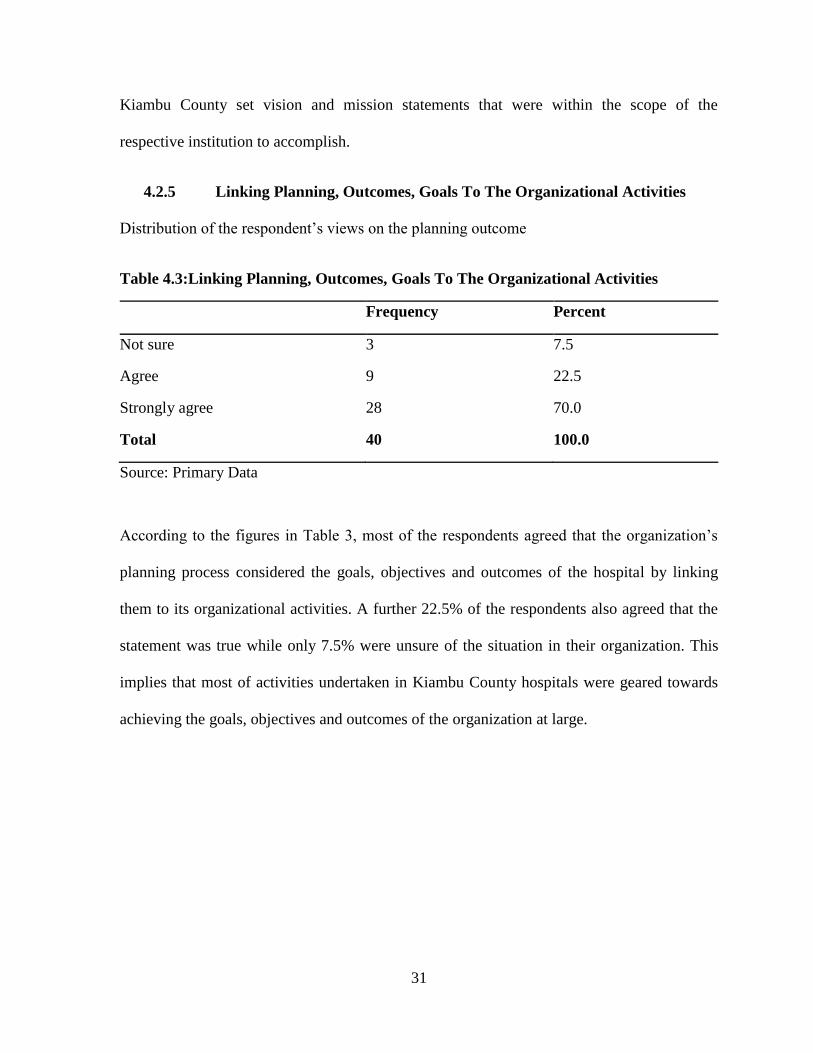
4.2.5 Linking Planning, Outcomes, Goals To The Organizational Activities
Distribution of the respondent’s views on the planning outcome
Table 4.3:Linking Planning, Outcomes, Goals To The Organizational Activities
Frequency Percent
Not sure 3 7.5
Agree 9 22.5
Strongly agree 28 70.0
Total 40 100.0
Source: Primary Data
According to the figures in Table 3, most of the respondents agreed that the organization’s
planning process considered the goals, objectives and outcomes of the hospital by linking
them to its organizational activities. A further 22.5% of the respondents also agreed that the
statement was true while only 7.5% were unsure of the situation in their organization. This
implies that most of activities undertaken in Kiambu County hospitals were geared towards
achieving the goals, objectives and outcomes of the organization at large.
32
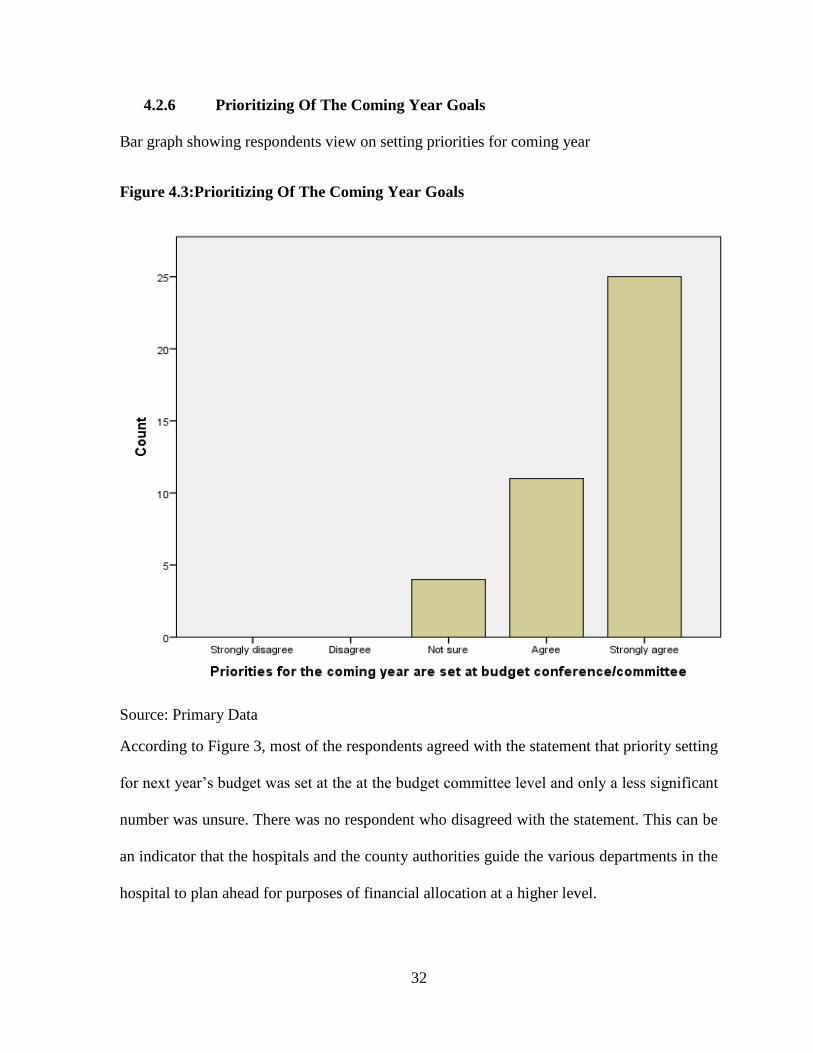
4.2.6 Prioritizing Of The Coming Year Goals
Bar graph showing respondents view on setting priorities for coming year
Figure 4.3:Prioritizing Of The Coming Year Goals
Source: Primary Data
According to Figure 3, most of the respondents agreed with the statement that priority setting
for next year’s budget was set at the at the budget committee level and only a less significant
number was unsure. There was no respondent who disagreed with the statement. This can be
an indicator that the hospitals and the county authorities guide the various departments in the
hospital to plan ahead for purposes of financial allocation at a higher level.
33
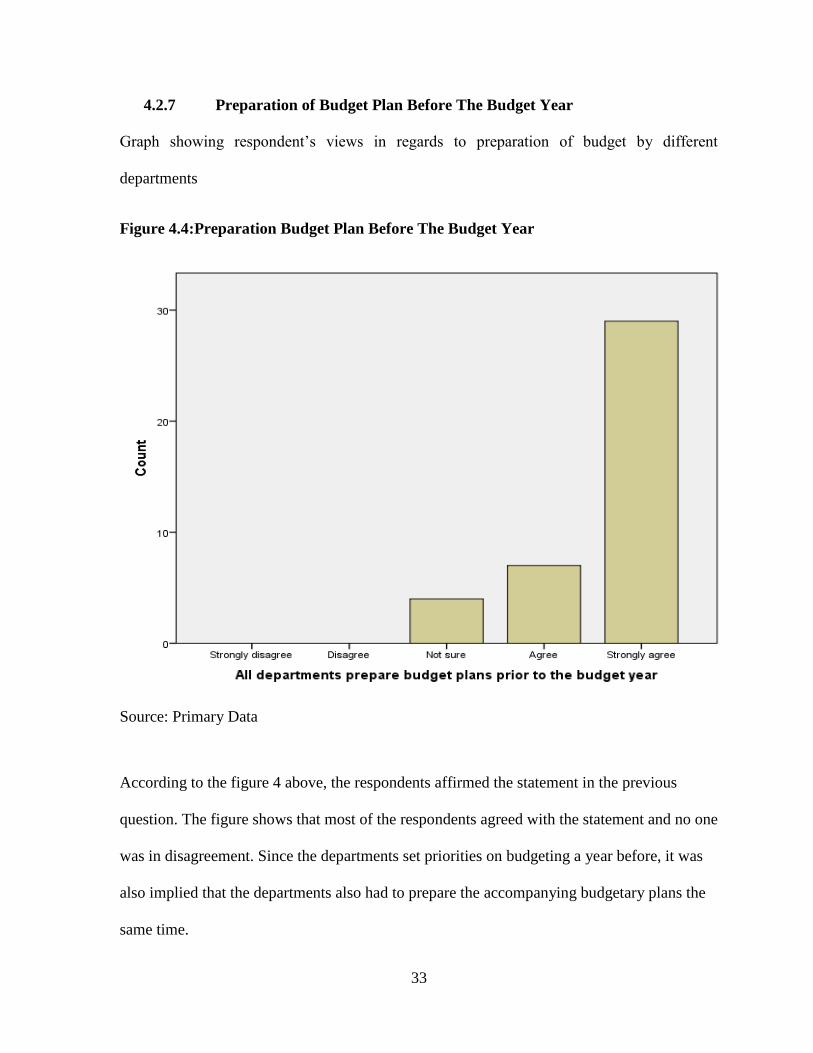
4.2.7 Preparation of Budget Plan Before The Budget Year
Graph showing respondent’s views in regards to preparation of budget by different
departments
Figure 4.4:Preparation Budget Plan Before The Budget Year
Source: Primary Data
According to the figure 4 above, the respondents affirmed the statement in the previous
question. The figure shows that most of the respondents agreed with the statement and no one
was in disagreement. Since the departments set priorities on budgeting a year before, it was
also implied that the departments also had to prepare the accompanying budgetary plans the
same time.
34
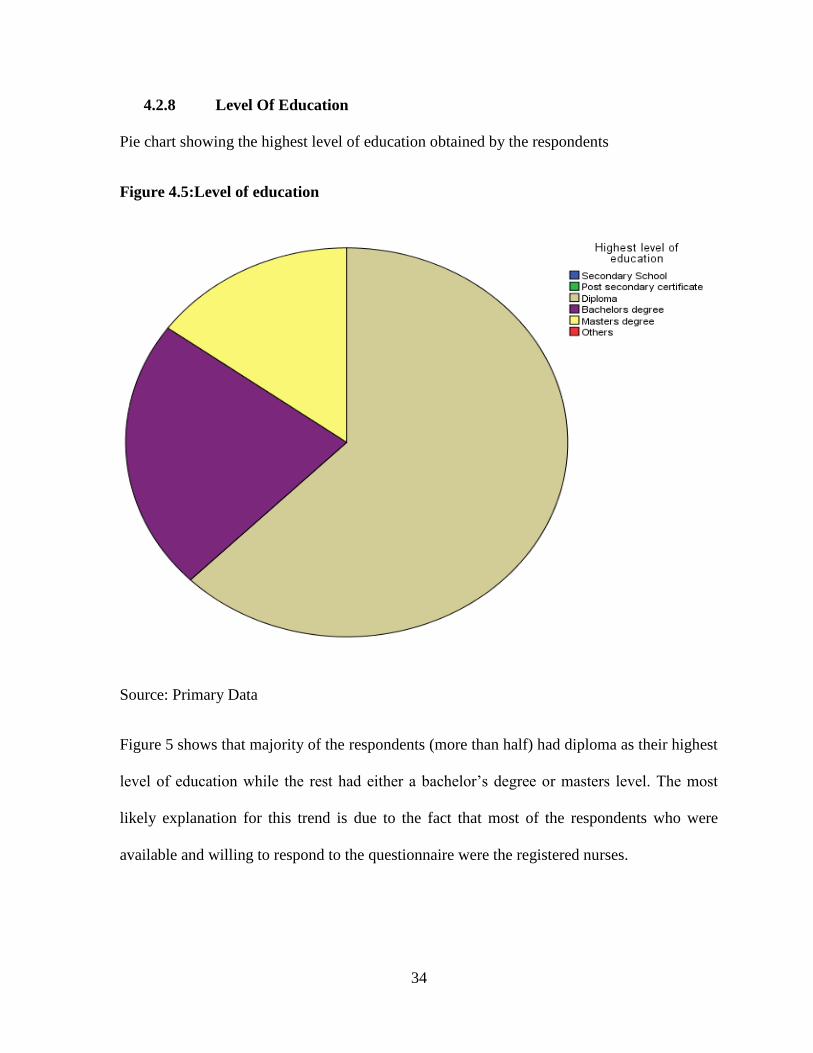
4.2.8 Level Of Education
Pie chart showing the highest level of education obtained by the respondents
Figure 4.5:Level of education
Source: Primary Data
Figure 5 shows that majority of the respondents (more than half) had diploma as their highest
level of education while the rest had either a bachelor’s degree or masters level. The most
likely explanation for this trend is due to the fact that most of the respondents who were
available and willing to respond to the questionnaire were the registered nurses.
35
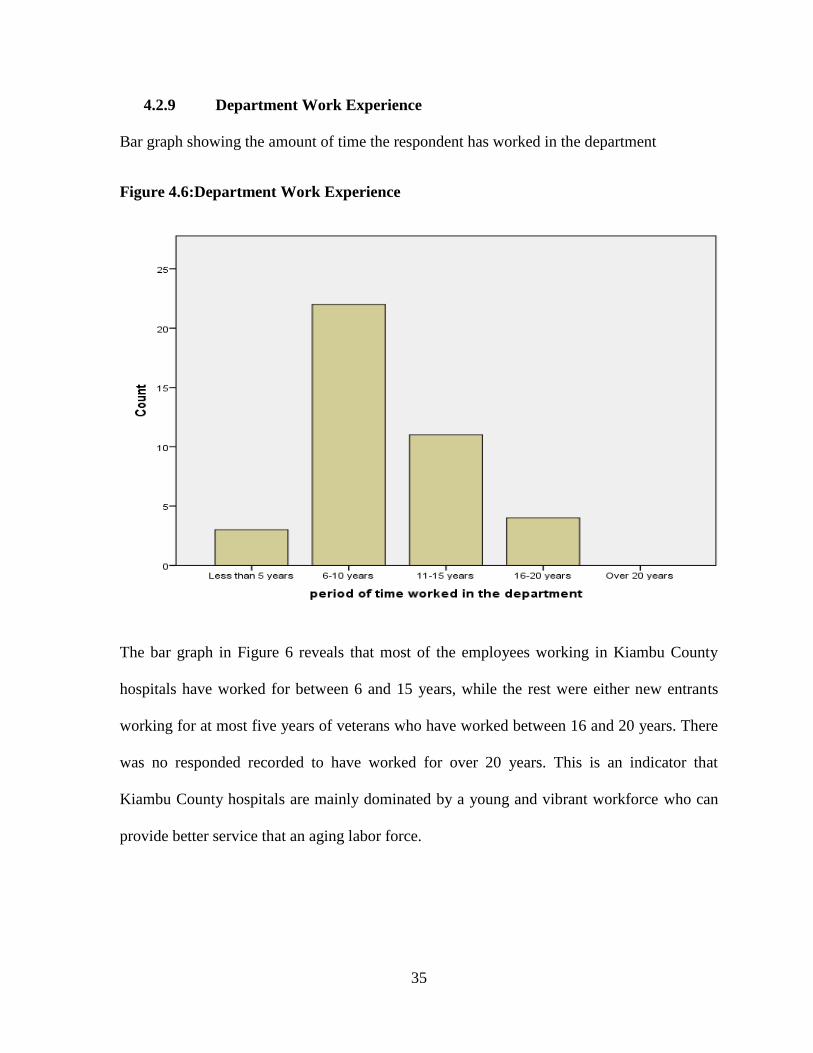
4.2.9 Department Work Experience
Bar graph showing the amount of time the respondent has worked in the department
Figure 4.6:Department Work Experience
The bar graph in Figure 6 reveals that most of the employees working in Kiambu County
hospitals have worked for between 6 and 15 years, while the rest were either new entrants
working for at most five years of veterans who have worked between 16 and 20 years. There
was no responded recorded to have worked for over 20 years. This is an indicator that
Kiambu County hospitals are mainly dominated by a young and vibrant workforce who can
provide better service that an aging labor force.
36
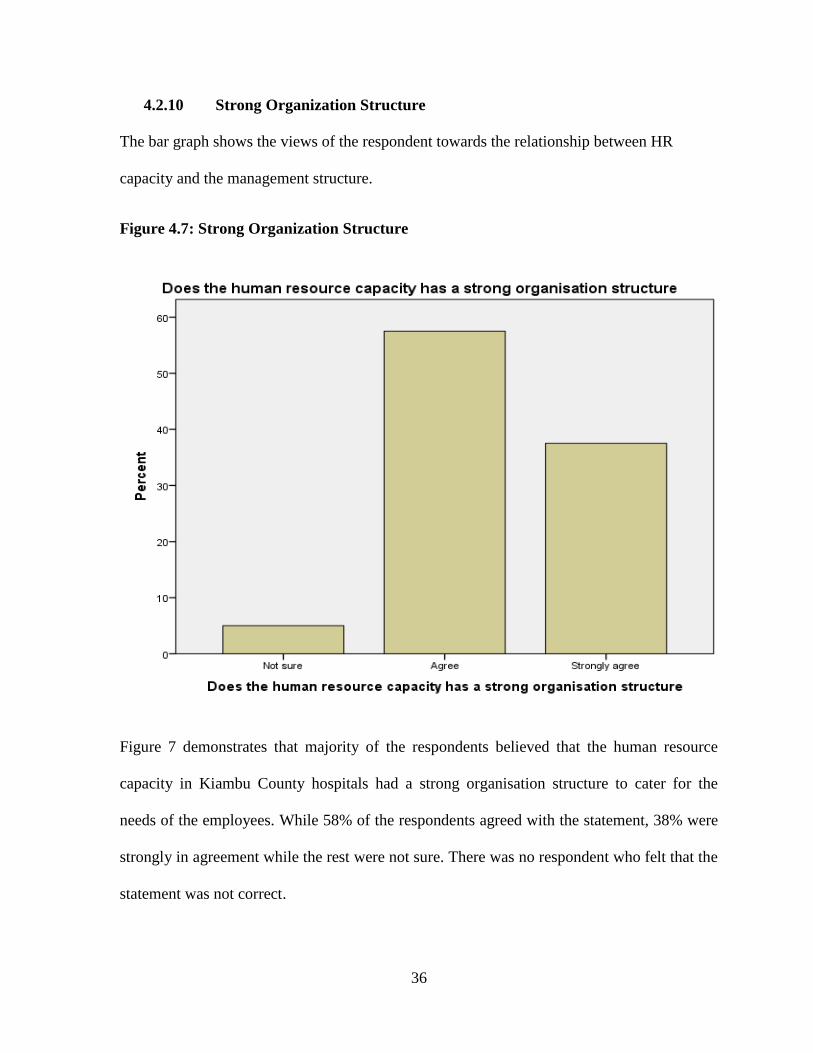
4.2.10 Strong Organization Structure
The bar graph shows the views of the respondent towards the relationship between HR
capacity and the management structure.
Figure 4.7: Strong Organization Structure
Figure 7 demonstrates that majority of the respondents believed that the human resource
capacity in Kiambu County hospitals had a strong organisation structure to cater for the
needs of the employees. While 58% of the respondents agreed with the statement, 38% were
strongly in agreement while the rest were not sure. There was no respondent who felt that the
statement was not correct.
37
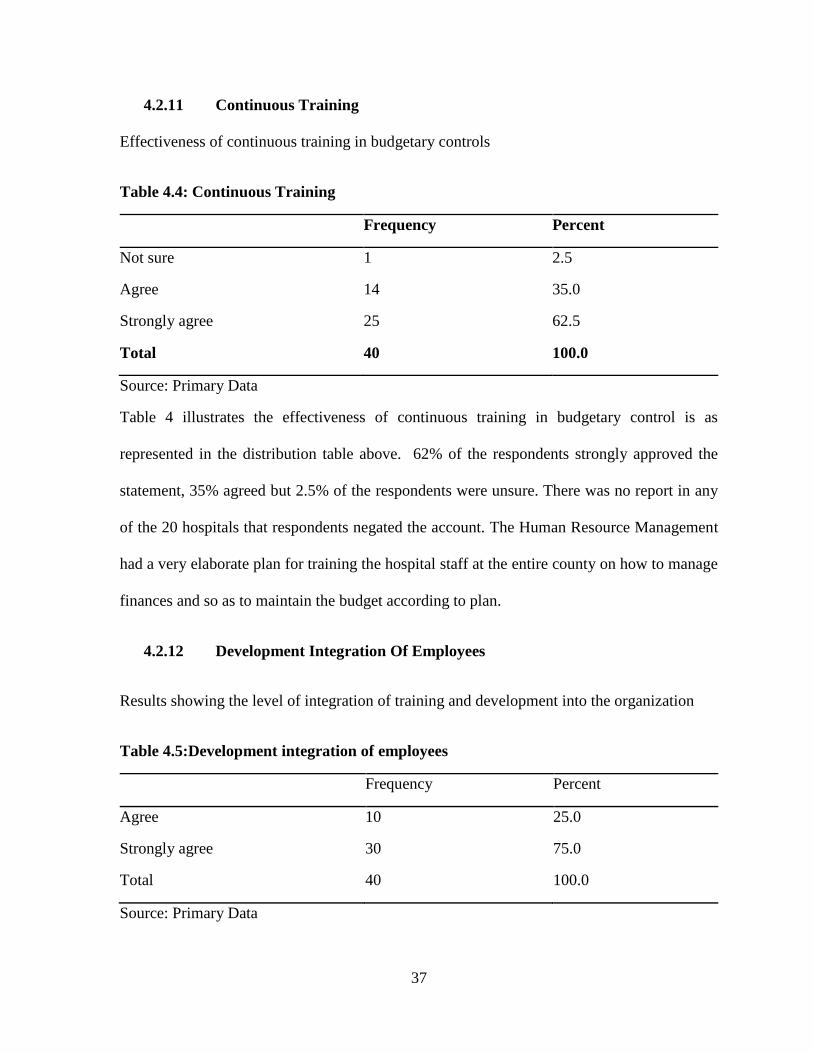
4.2.11 Continuous Training
Effectiveness of continuous training in budgetary controls
Table 4.4: Continuous Training
Frequency Percent
Not sure 1 2.5
Agree 14 35.0
Strongly agree 25 62.5
Total 40 100.0
Source: Primary Data
Table 4 illustrates the effectiveness of continuous training in budgetary control is as
represented in the distribution table above. 62% of the respondents strongly approved the
statement, 35% agreed but 2.5% of the respondents were unsure. There was no report in any
of the 20 hospitals that respondents negated the account. The Human Resource Management
had a very elaborate plan for training the hospital staff at the entire county on how to manage
finances and so as to maintain the budget according to plan.
4.2.12 Development Integration Of Employees
Results showing the level of integration of training and development into the organization
Table 4.5:Development integration of employees
Frequency Percent
Agree 10 25.0
Strongly agree 30 75.0
Total 40 100.0
Source: Primary Data
38
According to the table 5 above, the figures represent an illustration that shows a near total
agreement that training and development has been integrated in the organisation to facilitate
development. There is zero disagreement with the statement. This implies that training and
development is conducted almost in all county hospitals with the aim of developing the
enhancing development and service delivery amongst the staff members.
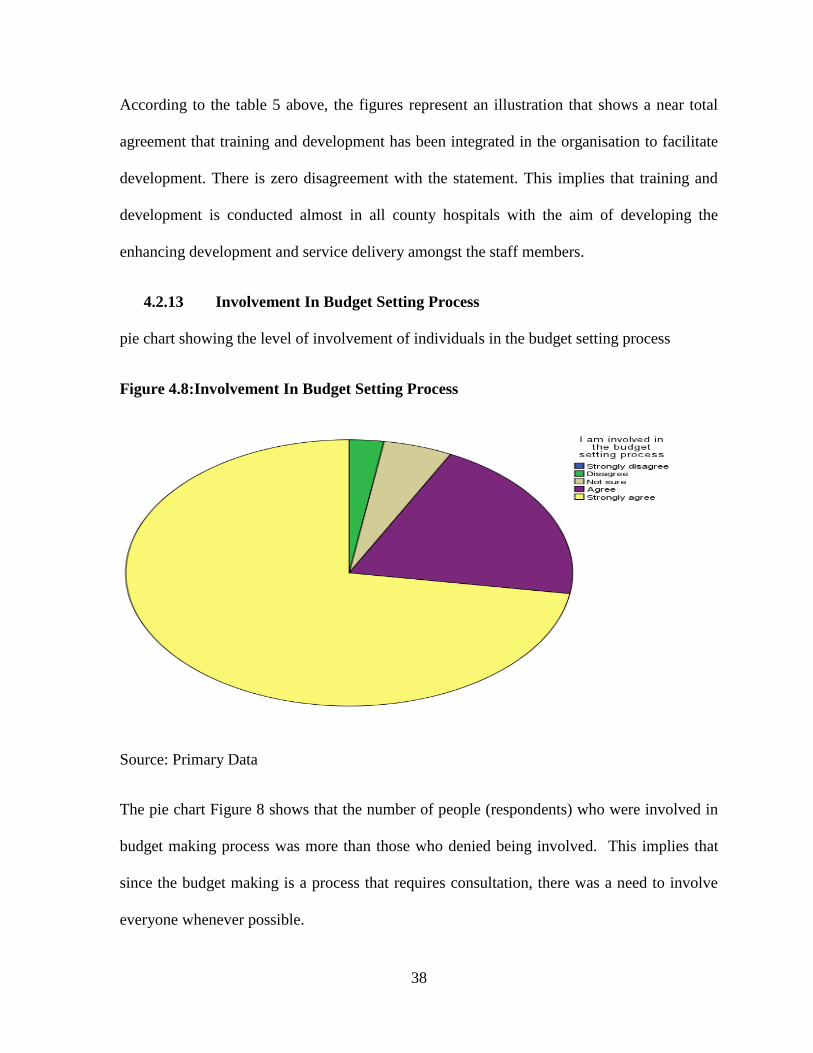
4.2.13 Involvement In Budget Setting Process
pie chart showing the level of involvement of individuals in the budget setting process
Figure 4.8:Involvement In Budget Setting Process
Source: Primary Data
The pie chart Figure 8 shows that the number of people (respondents) who were involved in
budget making process was more than those who denied being involved. This implies that
since the budget making is a process that requires consultation, there was a need to involve
everyone whenever possible.
39
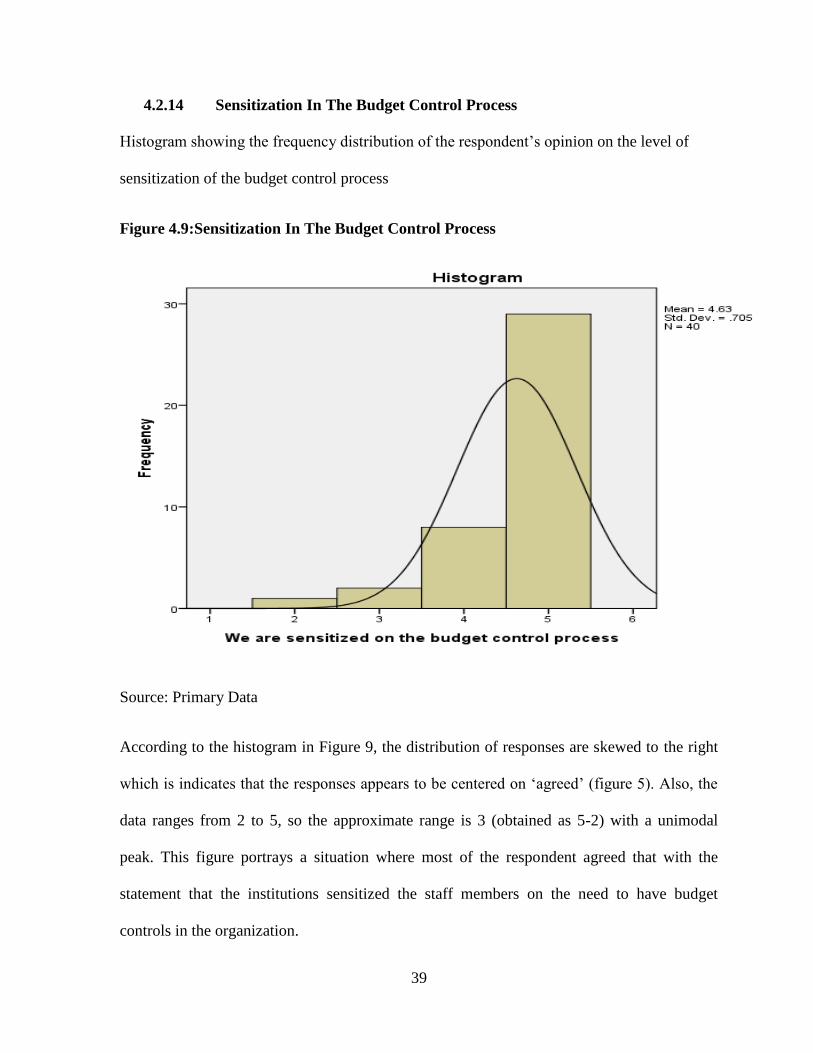
4.2.14 Sensitization In The Budget Control Process
Histogram showing the frequency distribution of the respondent’s opinion on the level of
sensitization of the budget control process
Figure 4.9:Sensitization In The Budget Control Process
Source: Primary Data
According to the histogram in Figure 9, the distribution of responses are skewed to the right
which is indicates that the responses appears to be centered on ‘agreed’ (figure 5). Also, the
data ranges from 2 to 5, so the approximate range is 3 (obtained as 5-2) with a unimodal
peak. This figure portrays a situation where most of the respondent agreed that with the
statement that the institutions sensitized the staff members on the need to have budget
controls in the organization.
40
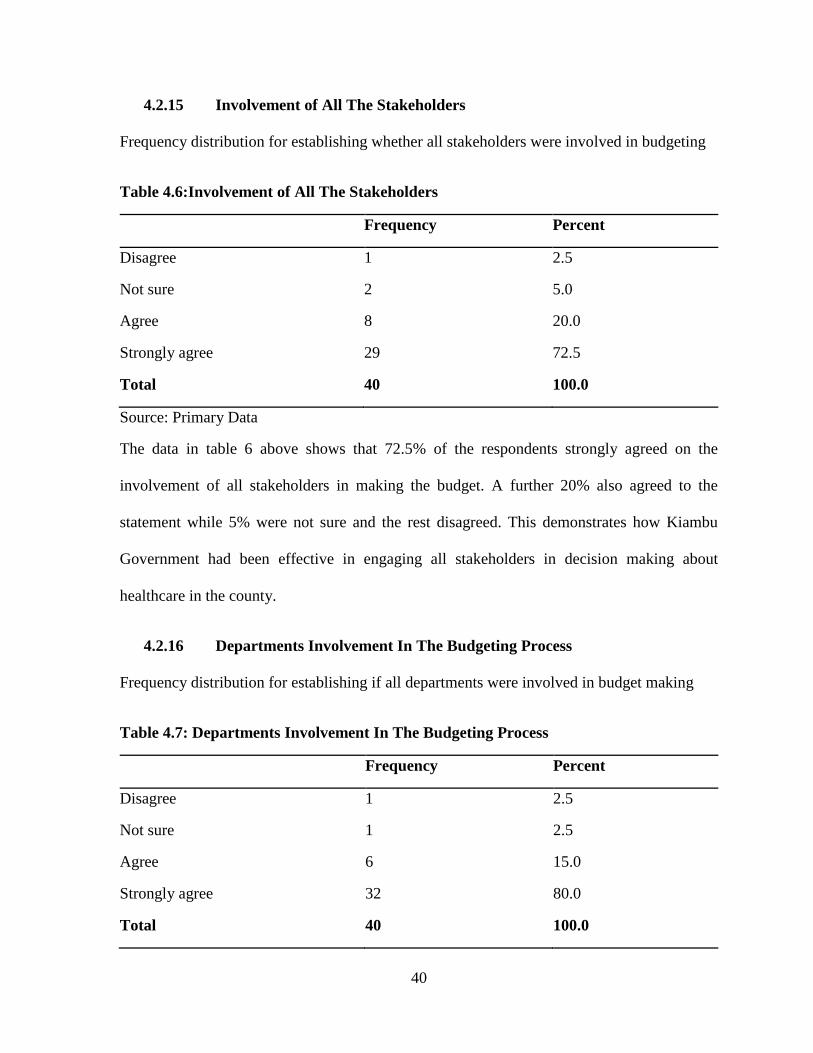
4.2.15 Involvement of All The Stakeholders
Frequency distribution for establishing whether all stakeholders were involved in budgeting
Table 4.6:Involvement of All The Stakeholders
Frequency Percent
Disagree 1 2.5
Not sure 2 5.0
Agree 8 20.0
Strongly agree 29 72.5
Total 40 100.0
Source: Primary Data
The data in table 6 above shows that 72.5% of the respondents strongly agreed on the
involvement of all stakeholders in making the budget. A further 20% also agreed to the
statement while 5% were not sure and the rest disagreed. This demonstrates how Kiambu
Government had been effective in engaging all stakeholders in decision making about
healthcare in the county.
4.2.16 Departments Involvement In The Budgeting Process
Frequency distribution for establishing if all departments were involved in budget making
Table 4.7: Departments Involvement In The Budgeting Process
Frequency Percent
Disagree 1 2.5
Not sure 1 2.5
Agree 6 15.0
Strongly agree 32 80.0
Total 40 100.0
41
Source: Primary Data
The data in Table 7 shows that 80% of the respondents strongly agreed on the involvement of
all departments in making the budget. A further 15% also agreed to the statement while 5%
were not sure and the rest disagreed. This question supports the results in the previous
question demonstrating how Kiambu Government had been effective in engaging all
stakeholders in decision making about healthcare in the county.
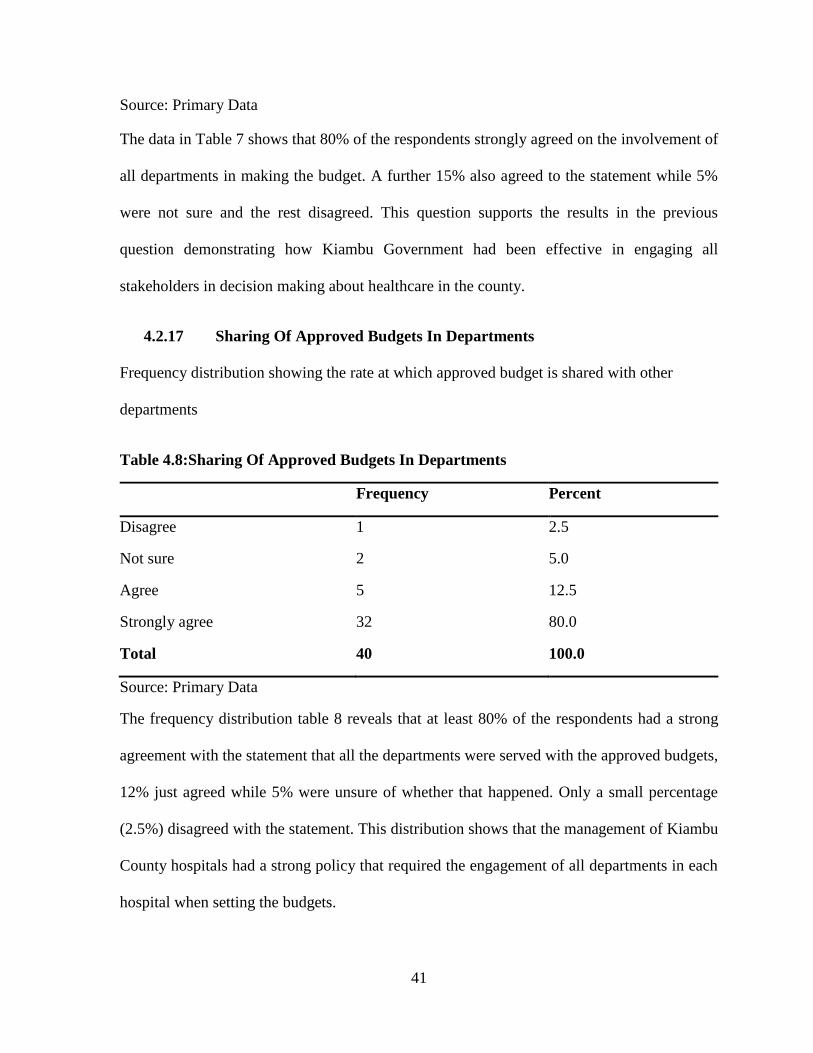
4.2.17 Sharing Of Approved Budgets In Departments
Frequency distribution showing the rate at which approved budget is shared with other
departments
Table 4.8:Sharing Of Approved Budgets In Departments
Frequency Percent
Disagree 1 2.5
Not sure 2 5.0
Agree 5 12.5
Strongly agree 32 80.0
Total 40 100.0
Source: Primary Data
The frequency distribution table 8 reveals that at least 80% of the respondents had a strong
agreement with the statement that all the departments were served with the approved budgets,
12% just agreed while 5% were unsure of whether that happened. Only a small percentage
(2.5%) disagreed with the statement. This distribution shows that the management of Kiambu
County hospitals had a strong policy that required the engagement of all departments in each
hospital when setting the budgets.
42
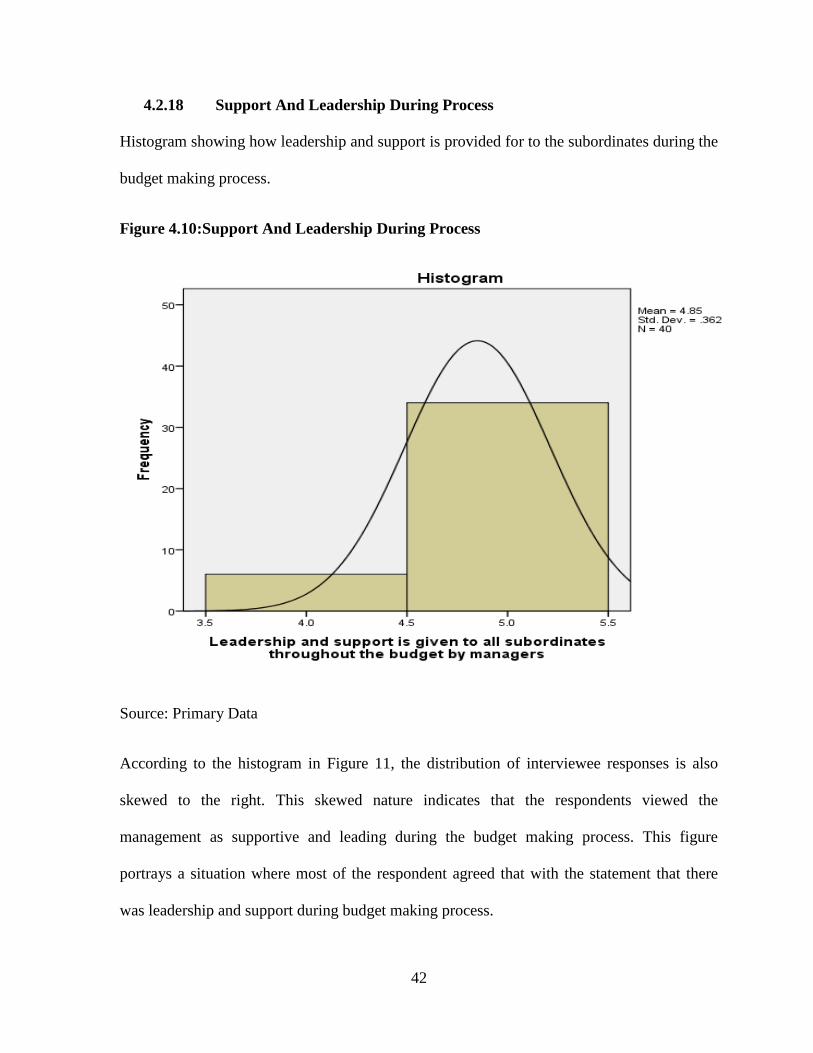
4.2.18 Support And Leadership During Process
Histogram showing how leadership and support is provided for to the subordinates during the
budget making process.
Figure 4.10:Support And Leadership During Process
Source: Primary Data
According to the histogram in Figure 11, the distribution of interviewee responses is also
skewed to the right. This skewed nature indicates that the respondents viewed the
management as supportive and leading during the budget making process. This figure
portrays a situation where most of the respondent agreed that with the statement that there
was leadership and support during budget making process.
43
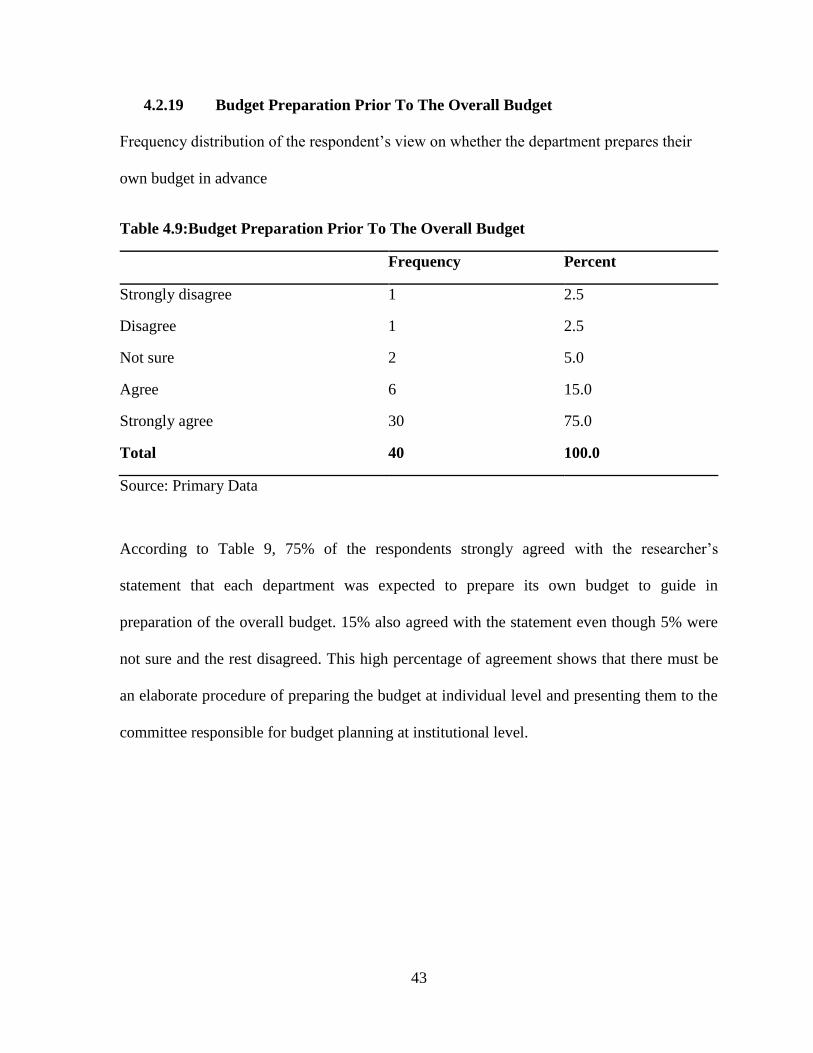
4.2.19 Budget Preparation Prior To The Overall Budget
Frequency distribution of the respondent’s view on whether the department prepares their
own budget in advance
Table 4.9:Budget Preparation Prior To The Overall Budget
Frequency Percent
Strongly disagree 1 2.5
Disagree 1 2.5
Not sure 2 5.0
Agree 6 15.0
Strongly agree 30 75.0
Total 40 100.0
Source: Primary Data
According to Table 9, 75% of the respondents strongly agreed with the researcher’s
statement that each department was expected to prepare its own budget to guide in
preparation of the overall budget. 15% also agreed with the statement even though 5% were
not sure and the rest disagreed. This high percentage of agreement shows that there must be
an elaborate procedure of preparing the budget at individual level and presenting them to the
committee responsible for budget planning at institutional level.
44
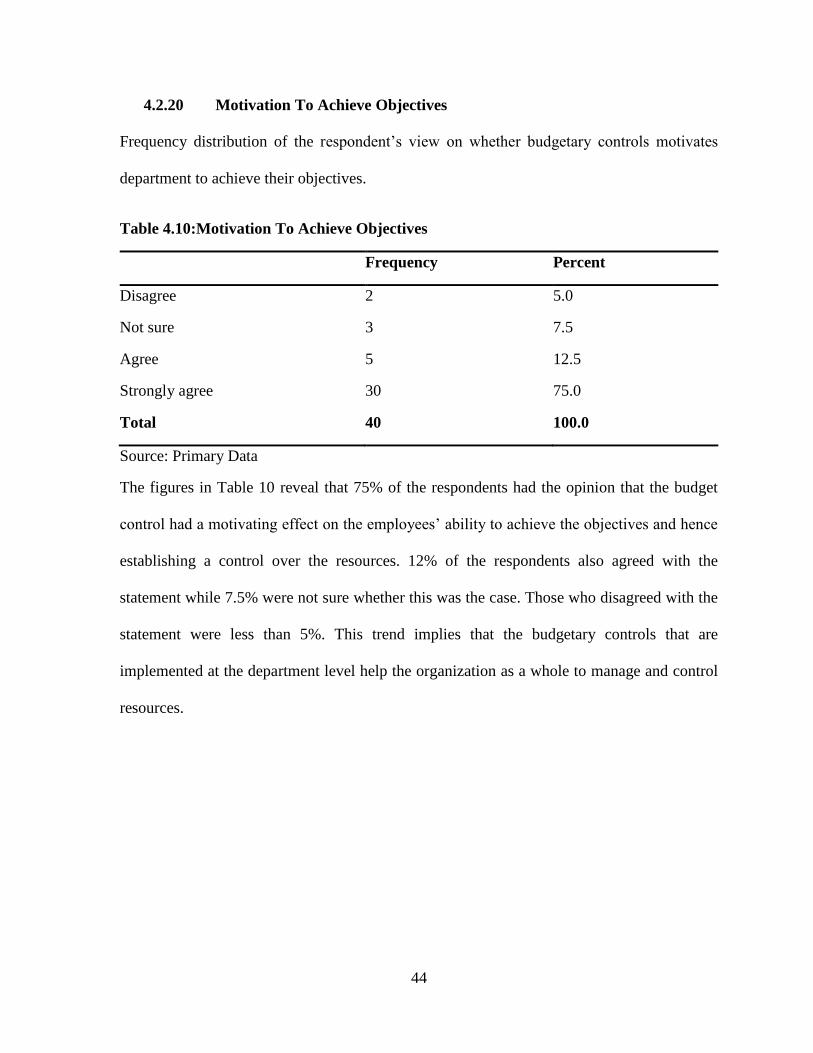
4.2.20 Motivation To Achieve Objectives
Frequency distribution of the respondent’s view on whether budgetary controls motivates
department to achieve their objectives.
Table 4.10:Motivation To Achieve Objectives
Frequency Percent
Disagree 2 5.0
Not sure 3 7.5
Agree 5 12.5
Strongly agree 30 75.0
Total 40 100.0
Source: Primary Data
The figures in Table 10 reveal that 75% of the respondents had the opinion that the budget
control had a motivating effect on the employees’ ability to achieve the objectives and hence
establishing a control over the resources. 12% of the respondents also agreed with the
statement while 7.5% were not sure whether this was the case. Those who disagreed with the
statement were less than 5%. This trend implies that the budgetary controls that are
implemented at the department level help the organization as a whole to manage and control
resources.
45
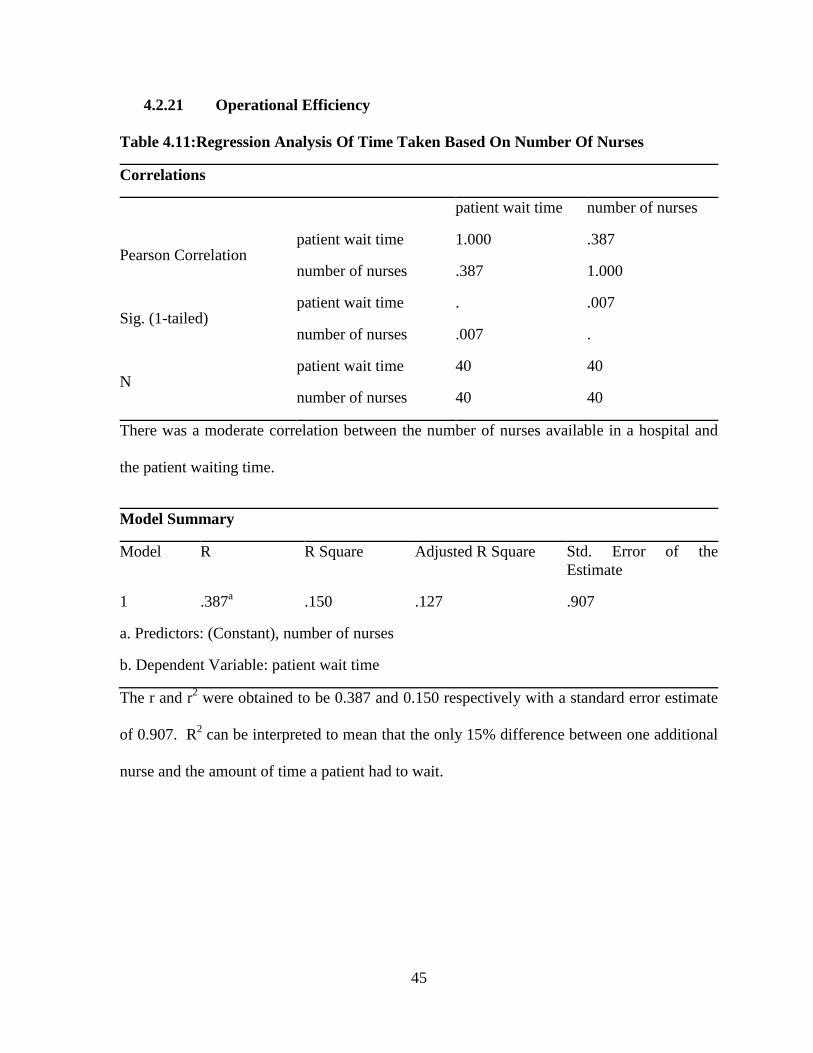
4.2.21 Operational Efficiency
Table 4.11:Regression Analysis Of Time Taken Based On Number Of Nurses
Correlations
patient wait time number of nurses
Pearson Correlation patient wait time 1.000 .387
number of nurses .387 1.000
Sig. (1-tailed) patient wait time . .007
number of nurses .007 .
N patient wait time 40 40
number of nurses 40 40
There was a moderate correlation between the number of nurses available in a hospital and
the patient waiting time.
Model Summary
Model R R Square Adjusted R Square Std. Error of the
Estimate
1 .387a .150 .127 .907
a. Predictors: (Constant), number of nurses
b. Dependent Variable: patient wait time
The r and r2 were obtained to be 0.387 and 0.150 respectively with a standard error estimate
of 0.907. R2 can be interpreted to mean that the only 15% difference between one additional
nurse and the amount of time a patient had to wait.
46
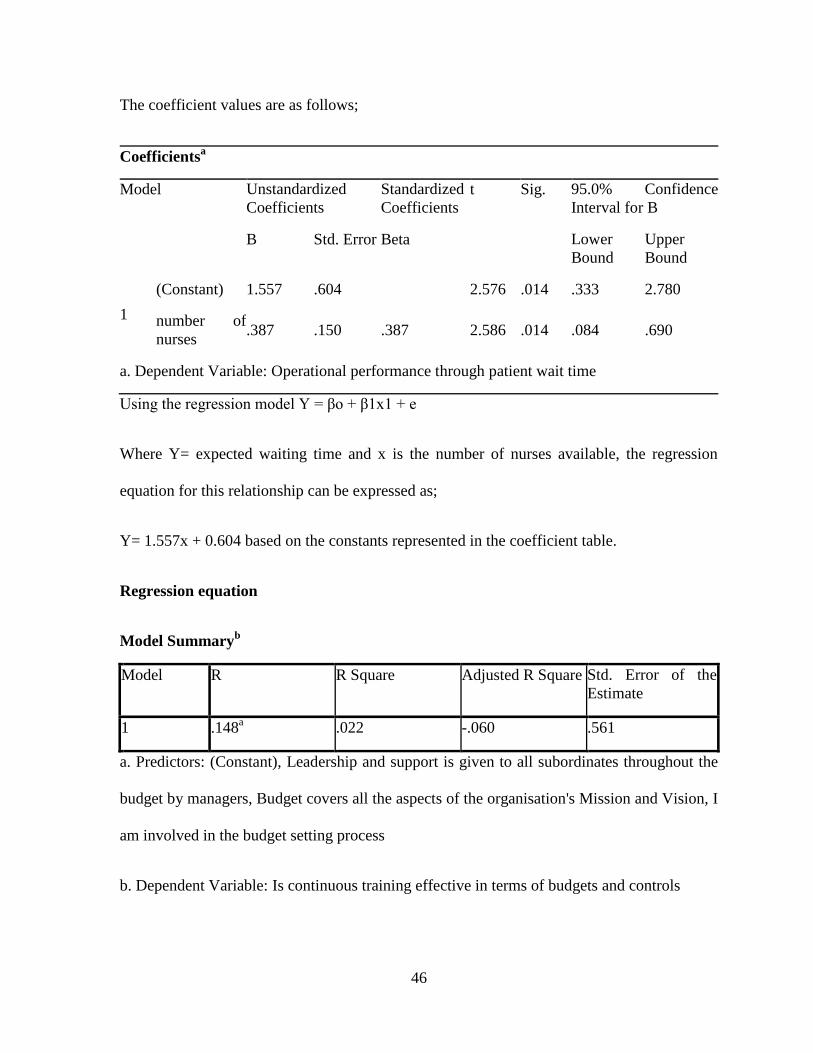
The coefficient values are as follows;
Coefficientsa
Model Unstandardized
Coefficients
Standardized
Coefficients
t Sig. 95.0% Confidence
Interval for B
B Std. Error Beta Lower
Bound
Upper
Bound
1
(Constant) 1.557 .604 2.576 .014 .333 2.780
number of
nurses .387 .150 .387 2.586 .014 .084 .690
a. Dependent Variable: Operational performance through patient wait time
Using the regression model Y = βo + β1x1 + e
Where Y= expected waiting time and x is the number of nurses available, the regression
equation for this relationship can be expressed as;
Y= 1.557x + 0.604 based on the constants represented in the coefficient table.
Regression equation
Model Summaryb
Model R R Square Adjusted R Square Std. Error of the
Estimate
1 .148a .022 -.060 .561
a. Predictors: (Constant), Leadership and support is given to all subordinates throughout the
budget by managers, Budget covers all the aspects of the organisation's Mission and Vision, I
am involved in the budget setting process
b. Dependent Variable: Is continuous training effective in terms of budgets and controls
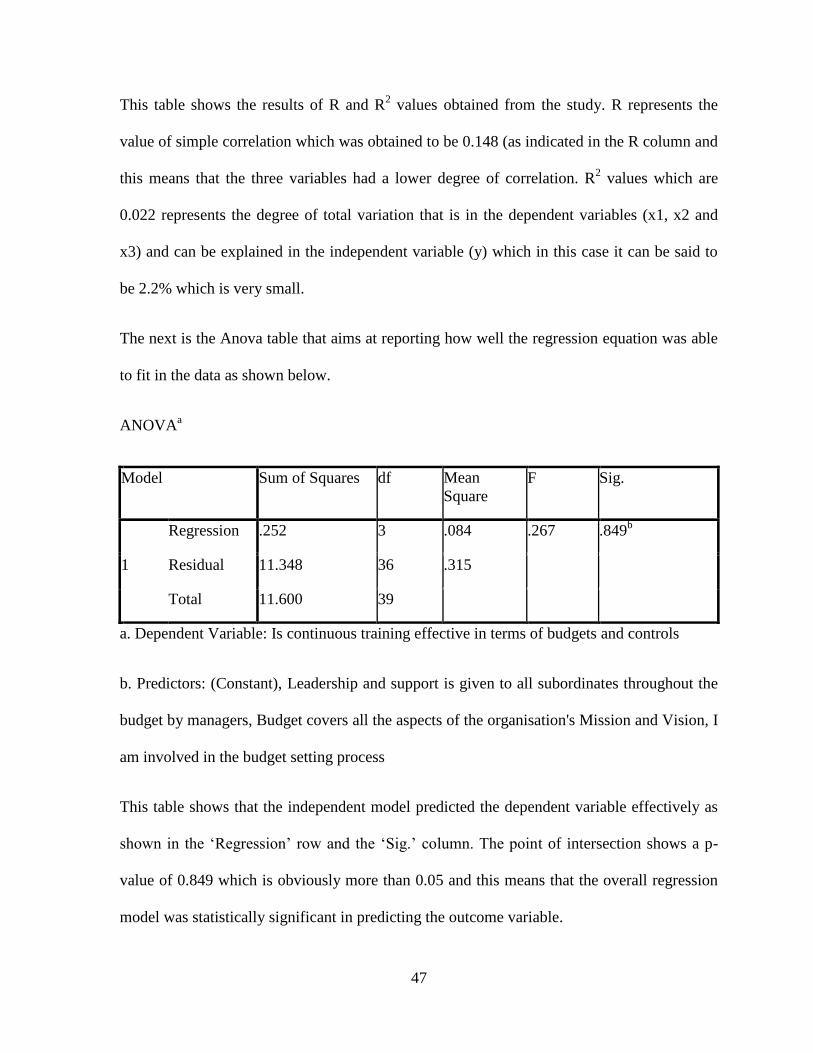
47
This table shows the results of R and R2 values obtained from the study. R represents the
value of simple correlation which was obtained to be 0.148 (as indicated in the R column and
this means that the three variables had a lower degree of correlation. R2 values which are
0.022 represents the degree of total variation that is in the dependent variables (x1, x2 and
x3) and can be explained in the independent variable (y) which in this case it can be said to
be 2.2% which is very small.
The next is the Anova table that aims at reporting how well the regression equation was able
to fit in the data as shown below.
ANOVAa
Model Sum of Squares df Mean
Square
F Sig.
1
Regression .252 3 .084 .267 .849b
Residual 11.348 36 .315
Total 11.600 39
a. Dependent Variable: Is continuous training effective in terms of budgets and controls
b. Predictors: (Constant), Leadership and support is given to all subordinates throughout the
budget by managers, Budget covers all the aspects of the organisation's Mission and Vision, I
am involved in the budget setting process
This table shows that the independent model predicted the dependent variable effectively as
shown in the ‘Regression’ row and the ‘Sig.’ column. The point of intersection shows a p-
value of 0.849 which is obviously more than 0.05 and this means that the overall regression
model was statistically significant in predicting the outcome variable.
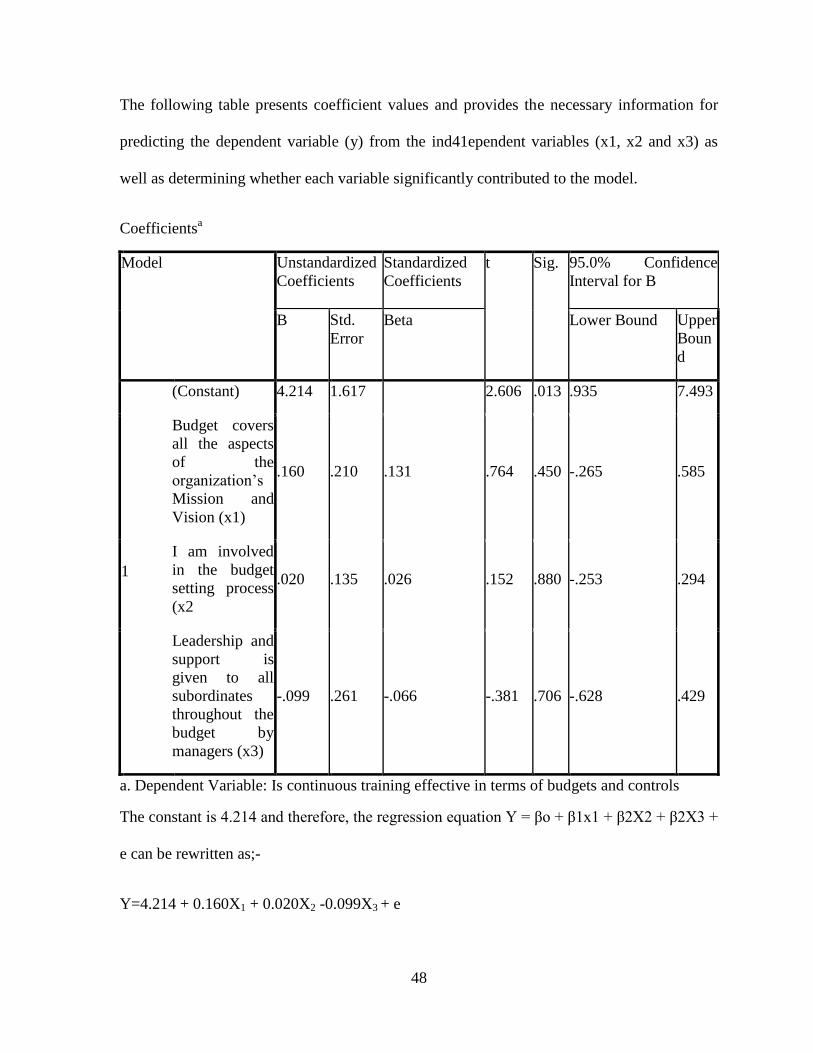
48
The following table presents coefficient values and provides the necessary information for
predicting the dependent variable (y) from the ind41ependent variables (x1, x2 and x3) as
well as determining whether each variable significantly contributed to the model.
Coefficientsa
Model Unstandardized
Coefficients
Standardized
Coefficients
t Sig. 95.0% Confidence
Interval for B
B Std.
Error
Beta Lower Bound Upper
Boun
d
1
(Constant) 4.214 1.617 2.606 .013 .935 7.493
Budget covers
all the aspects
of the
organization’s
Mission and
Vision (x1)
.160 .210 .131 .764 .450 -.265 .585
I am involved
in the budget
setting process
(x2
.020 .135 .026 .152 .880 -.253 .294
Leadership and
support is
given to all
subordinates
throughout the
budget by
managers (x3)
-.099 .261 -.066 -.381 .706 -.628 .429
a. Dependent Variable: Is continuous training effective in terms of budgets and controls
The constant is 4.214 and therefore, the regression equation Y = βo + β1x1 + β2X2 + β2X3 +
e can be rewritten as;-
Y=4.214 + 0.160X1 + 0.020X2 -0.099X3 + e
49
4.3 Summary and Interpretation of Findings
The above show that most of the respondents in this study had a positive attitude towards the
planning, Human resource capacity and Stake holder involvement. Where budgetary control
is high, there is a meaningful positive relation between performance and budgetary
participation. This is an indicator that the employees were involved in budgetary control in
Kiambu County Hospitals.
50
CHAPTER FIVE
SUMMARY, CONCLUSION AND RECOMMENDATIONS
5.1 Summary
This research established the existence of budgetary controls in hospitals, there performance
and also determine the effects of budgetary controls on their performance. This research
examined how budgetary controls affect performance in hospitals in Kiambu County in
Kenya, 20 organizations were sampled using convenience judgmental sampling.
Planning in healthcare sector is an important aspect of service delivery. This is one of the
steps that need to be taken into consideration and done right for the first time to ensure that
the entire process of healthcare management is done in an effective and efficient way. Since,
the objective of this study was to assess the effects of budget control on the operational
performance of public hospitals in Kiambu County. This research also sought to show the
relationship with the effects of the budgetary control and operational performance. The study
was conducted through descriptive design with a target of 40 respondents from 20 hospitals
in Kiambu County. The data was collected using a structured questionnaire where 50
questionnaires were issued and 40 were filled by the respondents. The response rate was 80%
and such a high response rate is helpful in ensuring that the results from the sample selected
are representative of the population.
51
From the findings, the respondents indicated that budget controls was a very efficient way of
maintaining operational costs in public hospitals in Kiambu. Proper planning was a major
determinant of the organization’s ability to meet its objectives as it allowed the hospital to
have the most adequate human resource capacity to allow the employees and the
stakeholder’s participation in budgeting thus improving the efficiency of the operations.
5.1.1 Effect of proper planning
The questions asked in this section were aimed at assessing whether hospitals in Kiambu
County made proper plans in relation to budgeting. More than 75% of the respondents agreed
that their organizations had short and long term goals, 62% agreed that the budget had clear
goals and objectives, over 50% agreed that the budget covers all aspects of the organization
and that the budgets were linked to the goals, and objectives. It was also established that over
60% of the hospitals had budgets planned over one year before presentation. This level of
preparedness allowed the hospitals plan for normal activities and any eventualities that may
arise.
5.1.2 Effect of human resource capacity
Majority of the staff in Kiambu County hospitals had the highest level of education as
Diploma and had worked for a period ranging from 6 to 15 years in the same institution.
This experienced provided them with the capacity to understand whether the organization
had a strong human resource capacity and majority agreed with the statement. Continuous
training was found to be more effective in enhancing budget controls as it was able to
integrate employees into the organization to facilitate the growth and development of the
hospital.
52
5.1.3 Employees stakeholder participation
The data obtained from the research showed a strong relationship between the hospital
management, employees and other stakeholders in the process of setting the budget. The
employees and the stakeholders were also sensitized on the budget control process through
the support and leadership of the managers in before arriving at the requirements of the
overall budget.
Therefore, this paper concludes that budget control was found to be a motivational factor to
achieve the objectives of the organization and the entire healthcare system. This means that
budget control process is essential as it reduces conflicts of interest between various
stakeholders and allows productivity and effectiveness in the hospitals.
5.2 Policy Recommendations
Budgetary controls are important in influencing performance therefore more efforts should
be made by management of organizations both profit and non-profit to sensitize the
employees on its importance so as to enhance performance. It also recommends that
organizations should develop more formal practice in the development of budgetary controls,
that is, Planning, Monitoring and Control and budget participation. Most organizations have
minimal formal budget controls in their organizations hence the need to develop a clear
policy on budget control processes.
Based on the findings ,organizations need to investigate other factors that contribute to better
performance apart from budgetary controls, like employees motivation and invest more in
staff development in order to enhance their performance. Monitoring and Controls shows the
53
highest contribution towards performance hence more training should be done to the
managers on how to conduct more efficient controls and monitoring.
5.3 Limitations of the Study
The researcher experienced various limitations in the course of the study; financial
constraints, one of the major problems that the researcher encountered is inadequate financial
support which consequently slowed down the process of data collection and production of
the final report of the study in time.
Time constraints was a limitation as the research involved distributing questionnaires to
different institutions most of whom were busy to spare enough time to respond. The duration
within which the research was undertaken was also short leading to so much strain in time
management and that’s why the research focus on Kiambu area only.
Lack of corporation, the researcher experienced a lot of unwillingness to cooperate among
most of the respondent organization, some never even responded and others even delayed in
responding to the questionnaires. It was difficult to have face to face communication as most
of the respondents preferred use of emails and this was the main challenge during the whole
research period.
The likert scale that was used might have produced some bias as it is possible that the
respondents provided non-committal answers by responding to neutral range of scale. Some
respondents were biased while giving information due to reasons such as privacy and busy
Schedules at their work place.
54
5.4 Suggestions for future Studies
The sample size used may have been quite small to enable get an overall picture of the total
hospitals in Kiambu. Therefore more research in this area should focus on increasing the
sample size and cover a larger number of organizations both in Nairobi and outside so as to
enhance better generalization of the results. More research has to be done on the individual
aspects of budget controls such as planning, participative budgeting, monitoring and control
and relationship with organizational performance.
This study dwelt on hospitals and measures on performance were difficult to measure
especially because they involve non-financial indicators. Hence more research should also be
done in other sectors like the parastatals and private sectors. This research concluded that
there is a high positive relationship between budgetary controls and performance hence other
factors may have influence on performance apart from budgetary controls. Therefore more
research need to be done on factors that influence performance on hospitals.
55
REFERENCES
Abdulla, M., & Joshi, J. (1996). Budgetary control and performance evaluation systems in
corporations in bahrain. Asian Review of Accounting, 125 –144.
Adwuor, K., & Jagongo, A. (2013). Budgetary control as a measure of financial performance
of state corporations in kenya. International Journal of Accounting and Taxation, 39.
Batty, J. (1979). Accounting for Managers. Heinemann Publishers.
Bingham University. (2015). A Systematic Review of Budgeting and Budgetary Control in
Government Owned Organizations . Research Journal of Finance and Accounting .
Blakeman Hodge, M., Romano, P.S., Harvey, D., Samuels, S.J., Olson, V.A., Sauve, M.J., &
Kravitz, R.L. (2004). Licensed caregiver characteristics and staffing in California acute care
hospital units. Journal of Nursing Administration, 34(3), 125-133.
Bloom, N., Propper, C., Seiler, J., & Reenen, J. V. (2009). Health Econometrics and Data
Group. Management practices in Hospitals.
County Government Of Kiambu. (n.d.). County Government Of Kiambu. Retrieved August
25, 2017, from County Government Of Kiambu: http://www.kiambu.go.ke/about/health-
access-and-nutrition
Dixon, N. S. (2011). Doctors on Strike in Kenya Seek Higher Pay and Better conditions.
Retrieved September 14, 2017
Dunk, A. S., & Hopwood, A. G. (2001). Role of budgeting and budget process. Journal of
Management Accounting, 1-8.
56
Dylan, M. (2016, 05 26). 25 healthcare metrics kpis. Retrieved 09 26, 2017, from clear point
strategy: https://www.clearpointstrategy.com/25-healthcare-metrics-kpis/
Gavrea, C., Ilies, L., & Stegerean, R. (2011). Determinants of organizational performance.
Management & Marketing Challenges for the Knowledge Society, 285-300.
Gershon, K. (2012). Budgeting, budgetary control and performance evaluation: A case study
of allterrain service group (ats). Ghana: Kwame Nkrumah University of Science and
Technology.
Gholamzadeh, R. N., Beyrami, H. J., Jannati, A., & Jaafarabadi, M. A. (2013). Selecting
Hospital's Key Performance Indicators, Using Analytic Hierarchy Process Technique.
Journal of Community Health Research., 30-38.
GoK. (1998). First report on poverty in kenya: Poverty and social indicators. Nairobi:
Government Printer.
Gianakis, G., & McCue, C. (2002). Budget theory for public administration and public
administrators. In A. Khan, & W. Hildreth.
Hill, H., & Matthew, A. (2003). The impact of traditional budgeting systems on the
effectiveness of performance-based budgeting. International Journal of Public
Administration, 135–155.
Hope, J., & Fraser, R. (2003). how managers can break free from the annual performance
trap. In Beyond Budgeting. USA: Harvard Business.
Horngren, C., & Dater, D. (2005). Cost accounting: A managerial emphasis. San Francisco,:
Simon and Schuster co.
57
Howard, L., & Brown, J. (2002). Principles and practice of management Accountancy.
London.: Macdonald and Evans ltd.
Howard, L., & Brown, J. (2015). Budget & Budget Control. Retrieved 10 2, 2017, from
linkedin: https://www.linkedin.com/pulse/budget-control-engr-johnson-e-duru
Ijiri, Y. (1975). Theory of accounting measurement. Studies in Accounting Research , 10.
Indian electronic thesis and dissertations. (n.d.). Retrieved from Shodhganga:
http://shodhganga.inflibnet.ac.in/bitstream/10603/705/11/12_chapter3.pdf
Jagongo, A., & Oduor, K. (2013). Budgetary control as a measure of financial performance
of state corporations in kenya. International Journal of Accounting and Taxation, 39.
Jensen, M., & Meckling, W. (1976). Theory of the firm: Managerial behavior,agency costs
and ownership structure. Harvard University Press.
John, A. O., & Ngoason, L. (2008). Budgetary and Management control Process in a
Manufacturing Case of Guinness Nigerian PLC. Malardalen University.
John, C., Shedrack, M., & Douglus, M. (2015). Role of Performance Management System on
Service Delivery, Case Study of Kakamega County General Hospital, Kenya. International
Journal of Sciences Basic and Applied Research.
Karue, M. (2013). Finance. Retrieved from University Of Nairobi: http://finance.uonbi.ac.ke
Khan, A., & Hildreth, B. (2002). Budget theory in public sector. London.
58
Koske, N., Simiyu , R., & Machyo , R. (2015). An assessment of the effects of budget
interpretation on budgetary control: A case study of uasin gishu district hospital. European
Journal of Business and Management, Vol.7, No.5.
Lee, C.-Y., & Johnson, A. (n.d.). Operational efficiency. Retrieved July 20, 2017, from
http://polab.imis.ncku.edu.tw/Book%20Chapter/Operational%20Efficiency.pdf
Leruth , L., & Paul, E. (2007). A principal-agent theory approach to public expenditure
management systems. OECD Journal on Budgeting.
Locke, E., & Latham, G. (1990). A theory of goal setting & task performance. Maryland.
Lyaruu, M. J. (2014). An assessment of the budget and budgetary control in enhancing
financial performance of an organization a case of tanzania electric supply company limited.
Daresalam: Mzumbe University.
Marshall, & Rossman. (1999). Designing qualitative research. CA: Sage Publications.
Muga, R., kizito, P., Gakuruh, T., & Mbayah, M. (2004). Overview of the health system in
kenya. Nairobi: MOH.
Muliro, B., Nambuswa, E., & Namusonge, G. (2016). Effects of budgetary participation on
hospital performance: A survey of public hospitals in trans nzoia county. Nairobi: European
Journal of Business and Management.
Musyoka, F. N. (2015). Journal of global health care systems, 2.
Neely, A, M. Gregory, & K. Platts. (1995). "Performance measurement system design: a.
International Journal of Operations & Production Management, 80-116.

59
Nyambura, R. K. (2014). The effect of budgetary control on effctiveness of non governmental
organisations in kenya. Nairobi: UON.
Obigbemi, I. (2013). Employee participation in Budgeting and budgetary control: A tool for
enhancing organizational performance. Tactful Management, Vol. 1, Issue 11.
OECD. (2008). Performance Budgeting Guide. Policy Brief.
Onduso, E. O. (2013). The effect of budgets on financial performance of manufacturing
companies in nairobi county. Nairobi: University of Nairobi.
Otley, D., & Pollanen , R. (2000). Budgetary Criteria in Performance Evaluation: A Critical
Appraisal Using New Evidence. Accounting, Organization &Society.
Peacock, S., Chan, C., Mangolini, M., & Johnsen, D. (2001). Techniques for measuring
efficiency in health services. Australia: Productivity Commission.
Pollitt, C., & Bouckaer, G. (2004). Public management reform: a comparative analysis.
Oxford: Oxford University Press.
Preetabh. (2010). Advantages of budgetary control. Retrieved July 18th, 2017, from
http://expertscolumn.com/content/advantages-budgetary-control.
Premchand, A. (2000). Planning and budgeting in control of public money. The Fiscal
Machinery In Developing Countries, pp.230-239.
Provan, K. (1985). Implementation of Effective Management policies in Non for profit
Hospitals. Academy of Management proceedings, 309 – 323.
60
Ray, J. L., Plowman, D., & McDaniel, R. R. (2010). Participation in decision making one
more time: A look at hospital decision making and performance. Academy of Management
Proceedings.
Richards, J. C. (2002). Longman dictionary of language teaching and applied linguistics.
London: Longman.
Rosen, H. S., & Gayer, T. (2010). Public Finance. New York: Mc Graw Hill.
Silva, L., & Jayamaha, A. (2012). Budgetary process and organizational performance of
apparel industry in sri lanka,. Journal of Emerging Trends in Economics and
ManagementSciences, 354-360.
Srinivasan, U. (2005). Current budgeting practices in us industry. New York: Quorum
Books.
Statistics How To. (2017). Statistics for the rest of us! Retrieved September 23, 2017, from
statisticshowto: http://www.statisticshowto.com/assumption-of-normality-test/
The World Bank. (2004). Capital Integration in the East African Community . Washington
D.C: The World Bank.
The world health organization. (2007). The world health report. Geneva: WHO.
Vasilache, S. (2013). Cross-cultural training and teamwork in healthcare. New York.
Wamae, M. (2008). Challenges of budgeting at national social security fund. Nairobi:
University Of Nairobi.

61
QUESTIONNAIRES AND TABLES
August, 2017
The Human Resource Manager,
……………….……,
P.O Box…………….
Nairobi.
Dear Sir / Madam,
RE: REQUEST TO COLLECT DATA FOR MBA RESEARCH PROJECT
I am a student at the University of Nairobi pursuing a Masters of Business Administration
program specializing in finance.
Pursuant to the pre-requisite course work, I would like to conduct a research project on The
Effects Of Budget Control On Operational Performance Of Public Hospitals In Kiambu
County.
The focus of my research will be on the public hospitals and in Kenya and this will involve
use of questionnaires administered to members of the management team.
I kindly seek your authority to conduct the research in this company through questionnaires
and use of relevant documents. I have enclosed an introductory letter from the University.
Your assistance is highly valued. Thank you in advance.
Yours faithfully,

62
PART A: PROPER PLANNING.
Please respond to the following statements by indicating the extent to which you agree or
disagree with the activities. Tick your choice
Strongly disagree (1) / Disagree (2) / Not Sure (3) / Agree (4) / Strongly
Agree (5)
STATEMENTS ON PROPER PLANNING (1) (2) (3) (4) (5)
1 Our organization has Long term and short term Budget
Plans
2 Our budgets have clear goals and objectives
3 Our Budgets cover all the aspects of our Mission and
Vision
4 When budgeting, outcome goals and objectives are
linked to programs
5 During planning, outcomes, goals and objectives are
linked to programs and organizational activities
6 We set priorities for the coming year at budget
conference/Committees.
7 All departments prepare budget plans prior to the
budget year

63
PART B: HUMAN RESOURCE CAPACITY
Please respond to the following statements by indicating the extent to which you agree or
disagree with the activities.
1. Kindly indicate your highest level of education
Certificate [ ]
Diploma [ ]
Bachelor degree [ ]
Master’s degree [ ]
Other, please
specify……………………….
2. Indicate your job title …………………………………………………………………….
3. For how long have you worked in this department (Your Expertise)?
Less than 5 years [ ]
11-15 years [ ]
6-10 years [ ]
15 – 20 years [ ]
Over 20 years [ ]
Tick your choice Strongly disagree (1) / Disagree (2) / Not Sure (3) / Agree (4) /
Strongly Agree (5)
.STATEMENTS ON HUMAN RESOURCE CAPACITY (1) (2) (3) (4) (5)
1 Do you consider that the Human Resource Capacity has a
strong Organization Structure
2 Is the continuous Training effective in terms of Budgets
and its control?
3 Training and development integrate employees into the
organization and then to facilitate their development.
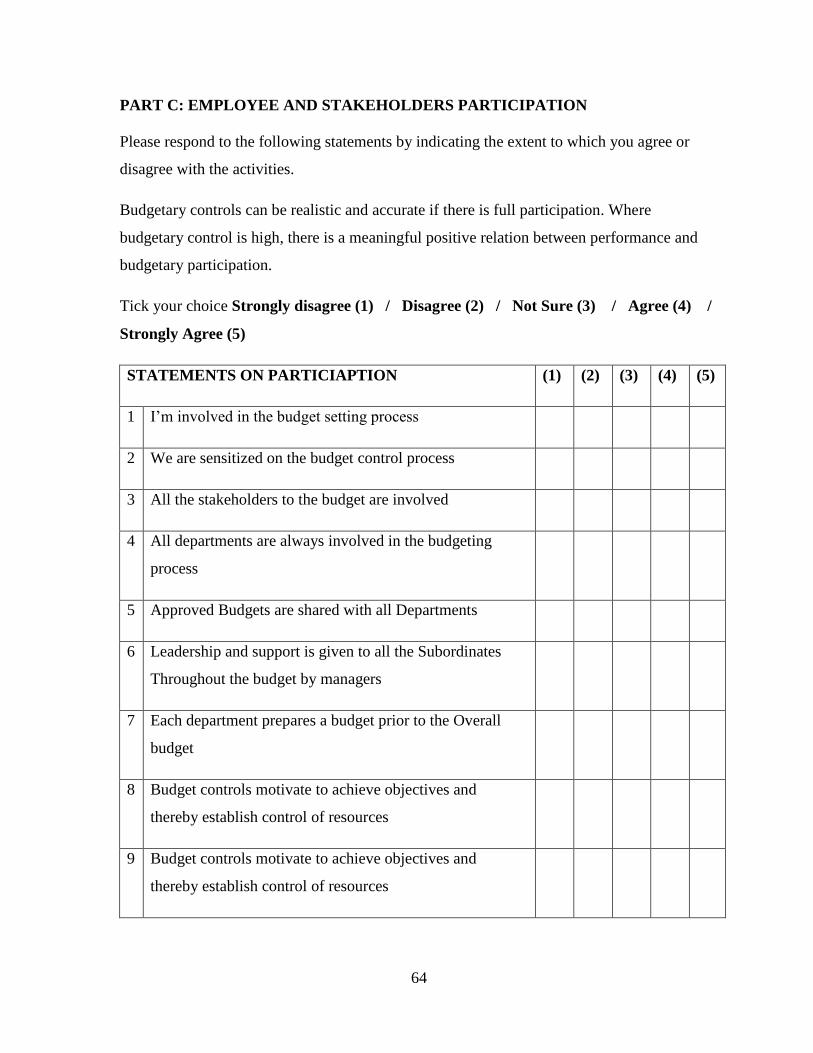
64
PART C: EMPLOYEE AND STAKEHOLDERS PARTICIPATION
Please respond to the following statements by indicating the extent to which you agree or
disagree with the activities.
Budgetary controls can be realistic and accurate if there is full participation. Where
budgetary control is high, there is a meaningful positive relation between performance and
budgetary participation.
Tick your choice Strongly disagree (1) / Disagree (2) / Not Sure (3) / Agree (4) /
Strongly Agree (5)
STATEMENTS ON PARTICIAPTION (1) (2) (3) (4) (5)
1 I’m involved in the budget setting process
2 We are sensitized on the budget control process
3 All the stakeholders to the budget are involved
4 All departments are always involved in the budgeting
process
5 Approved Budgets are shared with all Departments
6 Leadership and support is given to all the Subordinates
Throughout the budget by managers
7 Each department prepares a budget prior to the Overall
budget
8 Budget controls motivate to achieve objectives and
thereby establish control of resources
9 Budget controls motivate to achieve objectives and
thereby establish control of resources
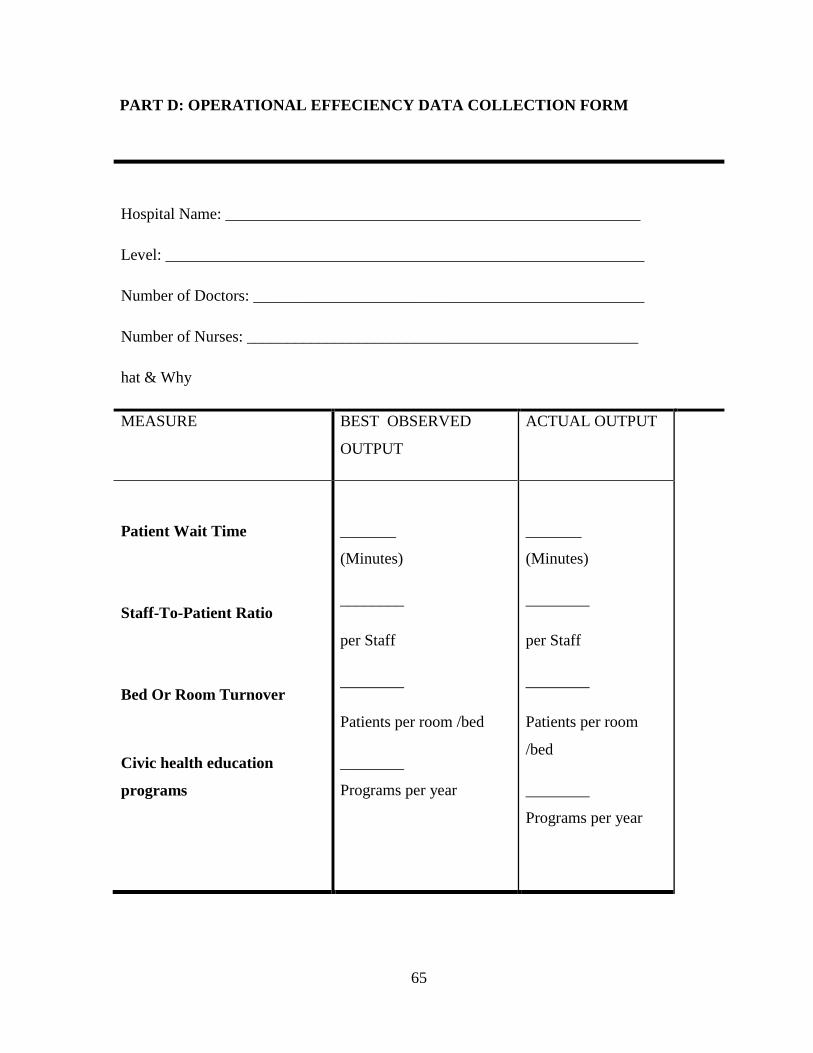
65
PART D: OPERATIONAL EFFECIENCY DATA COLLECTION FORM
Hospital Name: ____________________________________________________
Level: ____________________________________________________________
Number of Doctors: _________________________________________________
Number of Nurses: _________________________________________________
hat & Why
MEASURE BEST OBSERVED
OUTPUT
ACTUAL OUTPUT
Patient Wait Time
Staff-To-Patient Ratio
Bed Or Room Turnover
Civic health education
programs
_______
(Minutes)
________
per Staff
________
Patients per room /bed
________
Programs per year
_______
(Minutes)
________
per Staff
________
Patients per room
/bed
________
Programs per year