Embed Size (px)
Citation preview

THE MAGNITUDE AND PATTERN OF PRESBYOPIA
AMONG PATIENTS SEEN ON OUTREACH WITH LIONS
SIGHTFIRST EYE HOSPITAL. LORESHO
DR. MUK1RI MUKURIA2009
University of N A IR O B I Library UNIVERSITY OF NAIROBIMEDICAL LIBRARY
A DISSERTATION SUBMITTED IN PART FULFILMENT FOR THE DEGREE OF
MASTERS OF MEDICINE (OPHTHALMOLOGY), UNIVERSITY OF NAIROBI.

t h e m a g n it u d e a n d p a t t e r n o f p r e s b y o p ia
AMONG PATIENTS SEEN ON OUTREACH WITH LIONS
SIGHTFIRST EYE HOSPITAL. LORESHO
DR. MUK1R1 MUKUR1A2009
University of N A IR O B I Library
iiniiiiiwiii0537648 8
UNIVERSITY OF NAIROBIMEDICAL LIBRARY
A DISSERTATION SUBMITTED IN PART FULFILMENT FOR THE DEGREE OF
MASTERS OF MEDICINE (OPHTHALMOLOGY), UNIVERSITY OF NAIROBI.

DECLARATION
This dissertation is my original work and has not been presented for a degree in any other
University.
D r IMiikiri Mukuria
g*Am
a

APPROVAL
oiled with our approval as University supervisors.
Date ? Z / OC
Dr Martin Kollmann
MBChB, MD (GOETTINGEN), DTM Parasitol (Hamburg)
M.MED Ophthalmology (Munich), FEACO, MBA- Healthcare (Durban)
Senior Lecturer, Department of Ophthalmology
University o f Nairobi
Signed
Dr M. IM, Kariuki- Wanyoike
MBChB, M.MED Ophthalmology (Nairobi), FEACO
Lecturer, Department of Ophthalmology
University o f Nairobi
MBChB, M.MED Ophthalmology (Nairobi), FEACO
Senior Ophthalmologist, Cataract and Refractive Surgeon
Lions SightFirst Eye Hospital, Loresho, Nairobi.

DEDICATION
To my dear parents, for their dedication and all the sacrifices they have made throughout
my life, making me what I am today.
To my beloved wife Njeri, for helping me realise life has a sweet side to it.
And most importantly to Almighty God, through him all things are possible.
IV

ACKNOW LEDG EM ENTS
I wish to acknowledge the following persons for their tireless encouragement, advice and
support towards the eventual realisation of this dissertation:
1. My supervisors Dr. M. Kollmann, Dr. M. Kariuki and Dr. T. Jyotee for their
immeasurable contribution to this study.
2. Dr. F. Khan and the management board of Lions Sightfiret Eye Hospital for
allowing me to conduct the study under their institution.
3. The staff of Lions Sightfirst Eye Hospital for their immense support; and for
creating a favourable atmosphere for me to carry out the study successfully.
4. Mr Mwaniki for his valuable input in the analysis o f the results.
5. The Chairman and staff of Department of Ophthalmology, University o f Nairobi for
their advice, criticism and support throughout the period of the study.
v

TABLE OF CONTENTS
DECLARATION............................................................................................................................... ii
APPROVAL...................................................................................................................................... iii
DEDICATION...................................................................................................................................iv
ACKNOWLEDGEMENTS..............................................................................................................v
TABLE OF CONTENTS................................................................................................................. vi
LIST OF ABBREVIATIONS........................................................................................................ vii
LIST OF TABLES..........................................................................................................................viii
LIST OF FIGURES......................................................................................................................... ix
ABSTRACT....................................................................................................................................... x
LITERATURE REVIEW.................................................................................................................. i
RATIONALE................................................................................................................................... 12
STUDY OBJECTIVES................................................................................................................... 13
RESEARCH METHODOLOGY...................................................................................................14
RESULTS......................................................................................................................................... 23
DISCUSSION.................................................................................................................................. 34
CONCLUSION...............................................................................................................................39
RECOMMENDATIONS............................................................................................................... 40
REFERENCES................................................................................................................................ 41
APPENDIX A : PRESBYOPIA QUESTIONNAIRE................................................................ 44
APPENDIX B: CONSENT FORM...............................................................................................47
APPENDIX C: THE MAGNITUDE AND PATTERN OF PRESBYOPIA AMONG
PATIENTS SEEN ON OUTREACH WITH LIONS SIGHTFIRST EYE HOSPITAL,
LORESHO.......................................................................................................................................48
vi

LIST OF ABBREVIATIONS
1. BCVA - Best Corrected Visual Acuity
2. Cl - Confidence Interval
3. D - Dioptre
4. IOL - Intraocular lens
5. LE - Left Eye
6. N - Near (Vision)
7. OR - Odds Ratio
8. RE - Right Eye
9. SPSS - Statistical Package of Social Scientists
10. V - Visual acuity
11. WHO - World Health Organisation

LIST OF TABLES
Table 1: Choice o f presbyopia ADD correction used in clinical evaluation.............................. 6
Table 2: Comparison between Average accommodative amplitude and age............................. 7
Table 3: Onset of Presbyopia in different regions........................................................................ 9
Table 4: Distribution by age and sex ..........................................................................................25
Table 5: Association of presbyopia by se x .................................................................................. 27
Table 6: Early onset of presbyopia (age 35-39years): Association by sex .............................. 28
Table 7: Association of presbyopia correction by education level............................................29
Table 8: Association of spectacle coverage by sex in presbyopic patients...............................30
Table 9: Association of spectacle coverage by education level ................................................ 30
Table 10: Association of spectacle coverage by distance from the centre............................... 31
VUl

LIST OF FIGURESFigure 1 Map o f Kenya identifying some towns visited on outreach programs by Lions
Sightfirst eye Hospital.................................................................................................... 15
Figure 2: Summary flowchart.........................................................................................................23
Figure 3: Area o f Residence........................................................................................................... 24
Figure 4: Distribution by Age.........................................................................................................24
Figure 5: Distribution by level of education ............................................................................... 25
Figure 6: Distance travelled to the camp to seek eye serv ices.................................................. 26
Figure 7: Pre-exiting refractive erro rs.......................................................................................... 26
Figure 8: Association of presbyopia by age..................................................................................27
Figure 9: Mean presbyopic correction by age g ro u p .................................................................. 28
Figure 10: Association between presbyopia correction and education level ........................... 29
Figure 11: Reasons given for not wearing spectacles in patients with presbyopia .................31
Figure 12: Choice of place to buy their spectacles.......................................................................32
Figure 13: Reasons for choice of place to buy spectacles.......................................................... 33
Figure 14: Reasons for choosing outreach centre to buy spectacles..........................................33
Figure 15: Presbyopia correction: Proposed normogram for Kenyan African Population..... 36
Lx

ABSTRACT
Objective: To determine the magnitude and pattern o f presbyopia among patients aged
35 years and above as seen on outreach with Lions Sightfiist Eye Hospital.
Method: Cross sectional outreach camp based study o f presbyopia at various centres
visited by Lions sightfirst eye hospital was carried out on patients 35 years old above.
Those with pnor intraocular surgery, unclear ocular media or BCVA for distance of less
than 6/60 were excluded. The BCVA for distance was determined after refracting using
appropriate plus or minus lenses and illiterate E distance chart at 6m before assessing
presence and seventy o f presbyopia with an illiterate E near chart and plus lenses. Data
was collected using a questionnaire and input and analysed using SPSS version 11.5 and
Epi info version 3.4.1.
A case was a patient aged 35 years and above found to improve by at least 1 line on the
near chart with addition with plus lenses.
Results: A total of 442 patients were examined of which 177 (40%) were male and 265
(60%) female Males were found to be older than females p<0.001. Refractive errors
were found in 16.1% of those examined. Presbyopia was found in 388(87.8%) of those
examined, males= 151(85.3%) and females= 237(89.4%). No significant difference in
frequency of presbyopia by sex p=0.195 but males required a higher presbyopia
correction p=0.001. Females had significant earlier presentation of presbyopia p=0.008.
Those with less education were found to have more severe presbyopia by age p=0.004.
Overall presbyopia was found to start at an earlier age and have a more gradual incline in
x

seventy then plateau at a later age (65 years) compared to studies carried out in
Caucasians. The power used to correct the presbyopia was also less for age-matched
individuals compared to Caucasians.
Spectacle coverage was found to be 33%. 44% of those with presbyopia were not aware
their condition could be corrected with spectacles. 20% of spectacles made available and
examined during the study were found to be o f incorrect power. Males were more likely
to have spectacle correction p=0.01. Spectacle uptake was not significantly influenced by
education status or distance travelled to the outreach centre.
Conclusion: Prevalence of presbyopia was found in 87.8% in patients aged 35 years and
above attending outreach camps. Females had an earlier presentation while less education
and increasing age were associated with more severe presbyopia Spectacle coverage was
33% while 20% of spectacles examined had incorrect power.
Recommendation: Awareness needs to be done in the communities about presbyopia
showing that it can easily be corrected with spectacles. Health workers need heightened
awareness to detect and treat those patients in their mid-thirties who are not symptomatic.
Follow-up o f previously treated patients is essential for change of prescription. Policy
makers should incorporate presbyopia detection and management in the national eye
health care plan More studies to support above findings as well as design a protocol for
presbyopia correction appropriate for our setup.
xi

1. LITERATURE REVIEW
1.1 Introduction
The human eye is an optical system which is able to focus on objects at different distances
within the visual field1 The ability to change focus from a far object to a near one is achieved
mainly by increasing the curvature and thickness of the crystalline lens in a process called
accommodation* However accommodation reduces with advancing age due to decreasing
elasticity o f the crystalline lens, effectively causing blurring of near vision and eyestrain with
near work, a phenomenon known as presbyopia2 4’\
1.2 Historical Background
Speculation has been rife for centuries on how accommodation comes about. Scientists and
philosophers alike have postulated and theorized on likely mechanisms but till this day no
single theory explains all the findings associated with accommodation and by extension
presbyopia.
Kepler in 1611 postulated that the lens moves forwards and backwards to focus images while
Scheiner, a Jesuit priest, in 1619, proved experimentally that accommodation was achieved
by change in the optical power of the eye and obeyed the laws of optics. Another philosopher
Descartes (1677) suggested that the lens changes shape while in 1742 Lobe postulated it is
the shape o f the cornea that changed to bring about accommodation. Others like Sturm and
Listing believed the eye elongated
In 1801, Thomas Young disputed the earlier belief of accommodation was due to change in
the shape o f the cornea or elongation of the eyeball and proved experimentally that it was
actually due to the change in shape or position o f the crystalline lens. He also demonstrated
1

that accommodation did not occur in aphakic individuals. He went on to demonstrate that
spherical aberrations reduced with accommodation and concluded that change in the shape of
the lens is induced by a muscular mechanism within the lens. Purkinje (1823) noted reflected
images from the anterior and posterior crystalline lens surfaces (purkinje images).
Langenback in 1849 observed the purkinje images, under magnification, on the anterior lens
surface become smaller on accommodation and concluded that the anterior lens surface
becomes more convex during accommodation and this is due to ciliary muscle squeezing the
crystalline lens. In 1851, Cramer improved on Langenback discovery and incorporated a
telescopic device to make accurate observations during accommodations and noticed the
anterior surface becomes more convex while posterior surface did not change.
In 1855 Helmholtz incorporated crossed plates between patients7 eyes and the telescope so as
to double the images. This helped him observe both the anterior and posterior surfaces o f the
lens become more convex and the lens thicker. He postulated that the ciliary muscle relaxes
during accommodation with the lens becoming more spherical due to its own elasticity.
Finally he postulated presbyopia is due to lens sclerosis. Donders (1864) studied change in
amplitude o f accommodation and noted it declined in a linear fashion with age. This decline
is universal and predictable. He also noted that presbyopia was associated with hyperopia. In
1901, Tschering studied the anterior surface o f the lens using the purkinje images of four
candles - two peripheral and two central - and observed the changes during accommodation.
He noticed the two central ones moved closer while the peripheral one moved further apart
and concluded that the central part becomes more convex while there is peripheral flattening -
consistent with Young’s observation that aberrations reduced during accommodation.
Gullstrand (1911) and Fincham (1937) extended Helmholtz theory o f zonule relaxation for
accommodation and further added ciliary muscle atrophy and stiffening of lens attachments
2

Optical Coherence Tomography (OCT), where on-screen contraction and relaxation of the
ciliary muscle as well as changes in the size and shape o f the crystalline lens can be observed
with accommodation.
1.3 Pathophysiology of presby opia
Presbyopia (literally, old eye) is the most common ocular affliction in the world. It comes
about due to the progressive decline in the accommodative amplitude hence effectively
pushing away the near point towards the far point. The rate of decline occurs with very little
inter-individual variability even in different populations and is considered a reliable
biomarker for human age.
The pathophysiology of presbyopia is poorly understood and alterations o f every component
of the accommodative mechanism have been proposed.
1.3.1 LENS: Most researchers attribute presbyopia to changes occurring in the crystalline
lens. One theory suggests that despite lenticular rounding and thickening there is associated
reduced refractive index with accompanied aggregation o f insoluble proteins. This translates
to reduced number of lens proteins contributing to refractive power o f the lens. Ageing is also
associated with reduced curvature o f the lens surface and therefore reduced convergence of
light rays. Lenticular sclerosis is another theory where reduced elasticity o f lens capsule and
hardening of lens substance leads to ineffective action o f accommodative action.
1.3.2 CILIARY MUSCLE: Researchers have dismissed the unlikelihood o f ciliary muscle
contributing much to presbyopia. Reduced accommodative amplitude is noted to start as early
3

as second decade yet the ciliary muscle is still at its peak both physiologically and
histologically at this age4.
1.4 C'linical presentation
The most common symptom of uncorrected presbyopia is difficulty reading at near. Early
presbyopia is characterized by patient complaining of requiring more light to read or being
able to read better in the morning hours compared to night, difficulty reading fine print and
their eyes taking too long to focus on near point This is accompanied by aesthenopia because
of straining to accommodate the whole day The onset o f presbyopia is approximately
between 40 and 45 years o f age however there is some inter-individual variation. Presbyopia
may present younger in under-corrected hyperopes and older in under-corrected myopes2"
1.5 Management
Spectacles are the simplest and most inexpensive way to correct refractive errors1’
Emmetropic presbyopic patients will require readers to enable clear near vision. However,
those with refractive error [myopia, hypermetropia or astigmatism] in addition to presbyopia
will need bifocals or trifocals the design o f which will depend on the nature o f his/her work.
Surgical methods are also used but not as popular as spectacles. The methods used include
the use o f multi-focal IOLs (for those undergoing cataract surgery) Laser surgery o f the
cornea and lately a new technique called ‘surgical reversal o f presbyopia’.
Surgical management of presbyopia has been attempted but is still considered to be in the
experimental stages. In the 1980’s surgical reversal o f presbyopia was introduced. This
entailed making linear sclerotomies above the ciliary muscle. The theory behind this is that
accommodation is due to ciliary muscle contraction causing increased zonular tension onto
the equatorial zone of the crystalline lens.
4

However with increasing age the equatorial diameter o f the lens also increases therefore the
distance between the lens equator and the ciliary muscle reduces The zonules become lax
and can no longer apply tension onto the lens, effectively reducing accommodation in the
same linear manner Sclerotomies cause areas o f weakness in the wall of the globe causing
expansion This effectively causes extra leverage for the zonules to pull on the lens equator
during ciliary muscle contraction. A modification o f sclerotomies was introduced in the
I990’s and popularised by Schachar by using a scleral band to expand the sclera The band is
sutured into the sclera. Preliminary studies have shown increased accommodation of between
1 3 and 7 Dioptres (mean 3.8D)
Refractive surgery is an evolving technique introduced in the 1990’s now being applied to the
management o f presbyopia It has allowed a lot o f creativity and flexibility to the
ophthalmologist in managing refractive errors and presbyopia. One technique is the use of
LASIK (laser-assisted insitu keratomileusis) where a flap is created from the cornea surface
unveiling the cornea stroma Laser is used to ablate micrometers o f the stroma in a process
called remodelling then the flap is returned. Differential application of laser to both eyes
whereby one eye is ‘refracted’ for near and the other for far is called monovision. Other
variations o f this are conductive keratoplasty and laser thermal keratoplasty where ablation of
collagen in the peripheral cornea steepens the cornea centrally thereby improving near vision.
Multifocal LASIK similar to the multifocal IOLs or multifocal lenses is also applied to the
cornea to create different refractive surfaces for far and near.
The latest treatment for presbyopia involves the insertion o f cornea outlays (subepethelial)
and inlays (stromal) It was introduced in 2006 and is still undergoing trials. It entails
insertion o f a biocompatible collagen device within the cornea which remodels its shape. Any
additional refractive changes are done to the inlay or outlay therefore sparing the cornea from
additional manipulation.
5

Table I: Choice of presbyopia ADD correction used in clinical evaluation22
Age(Years)
Typical Add (power o f convex lens to assist near vision)
45 +1 OODto+1 25 D
50 +1 50 D t o +1.75 D
55 +2.00 D to +2.25 D
60 +2 50 D to +3.00 D
The power o f the presbyopic correction is generally related to the person’s age. This is
because there is a fairly uniform age-related decline in accommodative amplitude.
6

Table 2: Comparison between Average accommodative amplitude and age2
Age Average accommodative amplitude
8 14.0(+/-2D)
12 13 0(+/-2D)
16 12.0(+/-2D)
20 11 0(+/-2D)
24 10.0(+/-2D)
28 9.0(+/-2D)
32 8.0(+/-2D)
36 7.0(+/-2D)
40 6.0(+/-2D)
44 4.5(+/-1.5D)
48 3.0(+/-1.5D)
52 2.5(+/-1.5D)
56 2.0(+/-1.0D)
60 1.5(+/-1.0D)
64 1 0(+/-0 5D)
68 0.5(+/-0.5D)
Based on this, it is possible within a certain range to predict the average presbyopic
correction a person will require given his/her age.20
1.6 Prevalence
Globally, hundreds of millions o f people suffer from severe near vision impairment due to
uncorrected presbyopia0. No definite data is available from WHO, partly because there is no
7

universally accepted definition of presbyopia and no standard technique to measure it e g. the
near point and distance at which near vision is tested
In population based studies, the prevalence of presbyopia in people aged 30 years and above
was found to be 55.3% by Nirmalan et al in South India7 while in Brazil, Duarte et al found
the prevalence to be 54.7% in the same age group. Another study done in rural Tanzania by
Patel et al found the prevalence to be 61.7% among those 40 years and above.9 In Rift Valley
Province, Kenya, Sherwin et al found the prevalence to be 85.4% among those 50 years and
older 1 In an outreach clinic based study by Kamali et al, the prevalence o f presbyopia was
found to be 48%.25
No hospital based studies on presbyopia have recorded in literature
1.7 Variables
Various variables are associated with either earlier onset or increased severity of presbyopia.
Higher prevalence of presbyopia is associated with increasing age, female sex, higher
educational background and residence in town9. O f the above factors, female sex is associated
with more severe presbyopia while education background is less likely to affect the severity
of presbyopia Other factors include alcohol consumption, lens nuclear opacities and
hyperopia.7
8

Table 3: ONSET OF PRESBYOPIA IN DIFFERENT REGIONS
Age
(years)
Place Latitude Author Year
published
47 England 51-54 Ayrshire 1964
43 England 51-54 Turner 1958
45 New York 41-45 Duane 1912
50 Cleveland 38-42 Allen 1961
45 Japan 36-44 Kajiura 1965
43 Japan 36-44 Fukuda 1965
42 Japan 36-44 Ishihara 1919
43 California 32-44 Hamasaki 1956
45 Texas 26-36 Fitch 1971
41 Israel 32 Raphael 1961
40 South Africa 26-29 Coates 1955
37 India 10-30 Rambo 1960
39 Puerto Rico 18-18.5 Miranda 1977
Geographical variations, specifically latitude, have also been noted to influence onset of
presbyopia Residents of areas closer to the equator experience earlier onset o f presbyopia."
Another variable is average annual ambient temperature whereby those residents of warmer
and usually tropical areas experience earlier onset of presbyopia, some as early as mid-30s
rather than in their 40s 11
Also related to temperature is the faster decline in accommodative power even when the age
of the onset is the same ' 1
9

1.8 Impact of presbyopia
Presbyopia greatly affects the quality of life In highly literate societies where reading and
writing are main tasks this appears straight forward. However, in low income populations
with lower educational levels, presbyopia may matter equally much as essential and vital near
vision tasks such as winnowing grain, sorting rice, weeding, cooking food, dressing children
and lighting and adjusting lamps become increasingly affected/'
Among the elderly (>55years), uncorrected refractive errors, including presbyopia, is
associated with poorer quality o f life, more depressive symptoms12 and unnecessary
dependency on other family members or society/'
1.9 Interventions
Spectacles represent an effective and economic option to correct refractive errors particularly
for low and middle income countries6 Despite this there is a high unmet need for spectacles
among these populations. In Tehran, Fotouhi et al found spectacle coverage o f 66% (for all
refractive errors) with increasing unmet need with increasing age17. In Tanzania, Patel et al
found 94% o f presbyopes did not have spectacle correction6 In India, Nirmalan et al found
that two-thirds of presbyopes did not wear spectacle correction with over 95% having
moderate to severe difficulty of reading fine print or recognizing small objects.7
Dandona et allx found in south India increased spectacle uptake associated with higher
educational status, residence in town and in those who are aphakic or pseudophakic. Reasons
for not buying or wearing spectacles include feeling the prescription is wrong, uncomfortable
spectacles and cost. Another study done in Cambodia showed that willingness to pay for
spectacle correction was less in those less than 60 years, not income earner in the household
or those with low monthly income. However willingness did not depend on occupation, lack
of transport or previous spectacle wear 21
10

Globally, it is estimated that US S 1500 million would be needed to give 300 million people
access to an eye exam and a pair o f spectacles, so as to eliminate direct loss o f opportunity
and productivity due to uncorrected refractive error.6
1.10 Future of presbyopia
Presbyopia poses a serious public health challenge. With more people getting older the
numbers are expected to increase in an ageing population 6 This has been recognized by
WHO and specific aims, objectives and strategies under "Refractive Errors’ have been
incorporated into the ‘VISION 2020: global initiative for the elimination of avoidable
blindness, action plan 2006-2011.19
11

2. RATIONALE
Few studies have been done and therefore gaps in information exist regarding the prevalence
and pattern of presbyopia in Kenya. Studies done in developing countries have shown a high
prevalence of presbyopia as well as a high unmet need for presbyopic spectacle correction
With an ageing population and increasing urbanisation, the demand for presbyopia services
will increase hence baseline data is essential to establish the need and plan for future services.
12

3.0 STUDY OBJECTIVES
3.1 Main objective
To study the magnitude and pattern o f presbyopia in patients aged 35 years and above as seen
on outreach camps with Lions Sightfirst eye hospital
3.2 Specific objectives
1 To determine the prevalence o f presbyopia in patients aged 35 years and above
2. To determine how:-
2.1. increasing age;
2.2. literacy levels;
2.3. sex distribution;
affects presbyopia in patients aged 35 years and above.
3. To determine spectacle coverage and reasons for not using spectacle correction for those
with presbyopia.
13

4. RESEARCH METHODOLOGY
4.1 Research design
Cross-sectional outreach camp based study.
4.2 Study Area
Various areas visited on outreach by Lions chib Loresho through regular Lions Sight First
Eye Hospital outreach.
Lions Sightfirst Eye Hospital organises in regular outreach programs visiting particular areas
on a monthly basis. These are areas both within and outside Nairobi, the furthest being about
300km away. The areas visited on monthly basis are Kangundo, Njambini, Nyahururu,
Rumuruti, Matuu, Kerugoya, Murang’a, Gachika, Naivasha, Kandara, Sultan Hamud,
Kinamba, Tawa, Runyenjes, Kitui and Makuyu. Other areas are visited on request or on a
two- to three monthly basis such as Marigat, Matiri, Kiserian, and Nyeri.
14

hgure I: Map of Kenya identifying some towns visited on outreach programs by Lions
Sightfirst eve Hospital24
KEY
= some of the towns visited on outreach
= approximate area under which the outreach visits cover
15

4.3 Study population
Patients who attended the various camps aged 35 years and above
4.4 Study period
19th February 2009 to 23rd March 2009
4.5 Sample size
The sample size was determined by using of the following formulae to achieve an adequate
sample to accurately estimate the prevalence of presbyopia in the study population.
n = Z2̂ * P (1 -P )
D2
Where n = required sample size
P = prevalence o f (61.7%), based on the estimated prevalence from a similar study by Patel et
all7.
D = Precision with which to measure prevalence o f the study, set at plus or minus 5%.
The Zo/2 was the cut off points along the x-axis o f the standard normal probability distribution
that represents probability matching the 95% confidence interval (1.96).
Substituting the above in the formulae we got;
n = 363.12 = 363 patients
Presbyopia is a condition o f the aged and therefore the higher the cut-off age the higher the
prevalence of the condition. This entailed a higher or larger sample size (as per the above
formula). A lowered cut-off age from 40 years to 35 years has a reduced prevalence and
hence a smaller sample size was required The above sample size was calculated based on
16

results from a study using 40 years as the cut-off age Therefore the sample size was
considered adequate for our own cut-off age of 35 years.
4.6 Case definition
A person was defined as having presbyopia if addition o f plus lenses to his/her best corrected
distance correction, improved near vision by at least one line on the near visual acuity chart.
4.7 Sampling method
Systematic sampling method was used All patients arriving at the site o f the camp were
registered. This is the norm at every outreach done by Lions Sight First Eye Hospital
Loresho. From this registration list, all patients aged 35 years and above were identified
Consecutive patients were examined until sample size was obtained provided they met the
inclusion criteria and were not excluded.
4.8 Inclusion criteria
All patients aged 35 years and above, who agreed to be examined by signing consent, and
showed none o f the below exclusion criteria (Appendix B)
4.9 Exclusion criteria
Those patients below 35 years old, refused to sign consent, had unclear ocular media, have
history o f intraocular surgery or presbyopia that could not be corrected due to other
pathologies were excluded from the eligible participants Those with prior history of
intraocular surgery or best corrected distance vision worse than 6/60 were also excluded
17

4.10 Study limitations
1 The study population was biased because the participants in the study were self-referred
and most may already have ocular morbidity.
2 Many patients did not carry their spectacles to the outreach for assessment
3. Conclusions from the study can not be extrapolated to the general population and the
whole country.
4.11 Examination Technique
Before the actual examination took place the patients’ personal data was recorded as
elaborated in the data collection form such as date o f birth, residence, education status, use of
spectacles. This data was used in evaluation and data analysis.
Examination o f the patients was done in two phases The first was to examine and to correct,
if necessary, for distance vision. For presbyopia to be effectively assessed the patient must be
rendered emmetropic for distance. The second step was to examine for presbyopia and if
present it was also determined and recorded.
i) Distance vision examination
The patient was seated on a chair and a tumbling E chart was placed or hanged on a wall 6
meters away opposite him/her in a well lit room. The patient was asked to cover the left eye
first and read with the right eye. The patient was then taken through the chart from the top up
to the point he or she could not read any further This visual acuity was recorded in the data
collection form (Appendix A). The right eye was covered and he/she was asked to read with
left eye and the value recorded likewise
18

If the patient was unable to read up to the 6/9 line with either eye, he/she was given a trial
frame to put on. The left eye was occluded and corrective lenses were inserted into the most
posterior slot o f the trial frame in front o f the right eye. Different lenses were tried until the
best corrected visual acuity was obtained. Next the right eye was occluded and same
procedure was followed for the left eye. The value of the final corrective lenses used and the
best distance visual acuity obtained with them for each eye was also recorded in the data
collection form.
In the eventuality that a distance vision did not improve to the minimum desired level of 6/9,
a detailed examination was done. This entailed examination o f the anterior segment with a
direct ophthalmoscope and use of fluoresceine strips if necessary to determine any pathology.
The intraocular pressure was measured next This was done by instilling topical lignocaine
onto the cornea to anaesthetise it then a schiotz tonometer was placed directly on to the
cornea. The value was read off and converted using the tables provided with the instrument.
The eye was then dilated with tropicacyi eye drops and the ocular media, the lens and fundus
were examined for any pathology with a direct ophthalmoscope. For good visualisation
during fundoscopy, a dark room was improvised with a curtain over the window. Appropriate
management or referral was initiated depending on the pathology obtained
ii) Presbyopia examination
After the best corrected distance visual acuity was obtained, the lenses were retained within
the trial frame and he/she was examined for presbyopia However, if no correction was
required for the distance correction none was present at the start o f this examination With
corrective lenses for distance insitu where applicable, an occluder was placed in front of the
lenses of the left eye in the outermost slot A near vision chart was held in front o f the patient
19

at 33cm or one ruler-length away. An overhead lamp was not available for this exercise so
good illumination by sitting next to the window was used as the next best available option.
The patient was taken through the chart reading from the bigger letters to the smaller ones up
to the point where he/ she could not read any further. The last line read by the patient was
recorded in the data collection form. If he/she could not read up to the N87' 10 line then
possibility of presbyopia was entertained. Different corrective concave lenses in increasing
order o f power were added to the outermost slot in front o f those used to correct for distance
vision until near vision of N6 or better was obtained. However, if a patient improved by one
line or more but not up to the desired N6 or better they were still considered to have
presbyopia. The best near vision was determined by adjusting the power o f lenses and
recorded together with the power o f the plus lenses used to obtain it. Next, the right eye was
occluded and the same procedure is repeated for the left eye.
A focimeter could not be used to determine the power o f the patients’ spectacles due to lack
of electricity so neutralisation technique was used instead This was recorded in the data
collection form. The patients’ vision with his/her own correction if available was taken and
recorded in the form.
4.12 Data collection
Data was collected and filled in a questionnaire (Appendix A)
4.13 Data management and Analysis
The collected data was kept in safe place for data entry process. Questionnaires were checked
for any missing or wrong entries A data base was designed for input o f data Data was
20

analysed and inferential statistics were obtained using statistical packages (SPSS version 12.0
and Epi Info version 3.4.1.).
The data is presented in tables and figures where applicable. Parametric tests were used to
examine any significant association between presbyopia and sex, age and education status.
A logistic regression was used to explore the significant variable in the modelling of the
presence of presbyopia coverage. The Dependent/outcome variable was taken as the presence
of presbyopia.
Odds Ratios (OR) and its associated 95% Confidence Interval (Cl) were employed to
determine the factors more likely to explain the explanatory/outcome variable.
P-value of less the 0.05% was considered statistically significant.
i) Further analysis
Data collected was further analysed into categories so as to meet the desired objectives.
Objective 1 - Magnitude of presbyopia
From the data collected, the total number people found to have presbyopia compared to the
total number patients examined, was calculated so as to give us the magnitude o f presbyopia.
This was sub-classified as per each centre or region that was visited for data analysis.
Objective 2- Pattern o f presbyopia
Different categories were assigned to the patients depending on the bio-data obtained from
them and recorded in the data collection sheet These were the category of age or age groups:
35-39 years, 40-44years, 45-49years, 50-54years, 55-59years, 60-64years, 65-69years and
70years old and above Another category was the level o f education the patient has so far
received This was categorised into no education, primary school education, secondary
education, and tertiary education. Another category was sex: male or female All areas visited
21

were categorised as rural as per the Kenya demographic survey frame Using these categories
mentioned above, the magnitude and pattern o f presbyopia was analysed and enabled
conclusions to be obtained and compared with previous studies done on the same subject.
Objective 3- Spectacle coverage and reasons for not wearing spectacle correction
The reason(s) for not wearing spectacles were obtained directly from the patient. Various
reasons were enumerated in the data collection form to capture this. With this information,
reasons were determined why people with presbyopia did not obtain spectacles and for some
of those who had spectacles, why they opted against using them. This can be used as a
reference to identify areas to be addressed.
4.14 M aterials
The materials used in conducting the study were Questionnaires, a torch, a refraction set with
trial frames, illiterate E and near vision charts Others included direct and indirect
ophthalmoscopes, 20D loupe, topical mydriacyl, topial lignocaine and a schiotz tonometer
5. ETHICAL CONSIDERATIONS
Prior to examination, informed consent was obtained Additional explanation o f each step
was given concurrently with the examination Standard non-invasive techniques were utilized
in the examination o f each patient After completion o f examination, appropriate prescription
for spectacle correction was given. If any other pathology was found appropriate treatment
was initiated If the problem could not be handled at the site o f the camp, then these patients
were referred to the nearest appropriate eye care centre or to Kenyatta National Hospital eye
clinic All information obtained in the whole exercise is kept confidential All eyedrops used
are registered in Kenya.
22

5. RESULTS
Figure 2: Summary flowchart
( T o ta l p a tie n ts seen
n=442
W ith p re sb yo p ia n=388
I
W ith spectacl co rre ctio n
n=128___________ ______
K T~-------- *■----1 ~1N U S > p C C lc tX - lC
c o rre c tio n
NSpectacles
f 'NS pectacles not
available availablen=45 n=83
J L J
In c o rre c t p ow er n=9
v_
23

I. STUDY POPULATION
figure 3: Area of Residence (n = 442)
A total o f 442 participants were recruited from 13 different towns visited. An average of 34
patients was seen per visit. Nyahururu town posted the highest turnout with 74 participants
while Mwea had the least with 13 participants.
Figure 4: Distribution by Age (n = 442)
90
80 ■
7 0 -i
_ 6 0 , 52 (118%)
35 - 39 40 - 44
70(15 8%)
37 (8 4%)
* ' ' I * * 'I * ............ | '■ '■ |........... —45 - 49 50 - 54 55 - 59 60 - 64 65 - 69
Age (in years)
87 (19 7%)
70 +
The age range was from 35 to 85 years The smallest sized age group was the 40-45 age
group (7.9%) while the largest was the 70+ age group (19.7%)
24

Table 4: Distribution by age and sex (n=442)
Number (%) Mean Age (years)
Male 177(40) 59.8
Female 265 (60) 53.1
Total/average 442(100) 55.8
The mean age o f males 59.8 years were significantly higher than the mean age of females
53.1 years (p<0.001). The mode, median and age range for both male and female were equal.
Figure 5: Distribution by level of education (n=442)
250
200
g 150
ISI 100c
50
0Nil Primary Secondary Tertiary
level of education
Most of participants have received primary level of education (53.6%) while the smallest
group were those who had attained tertiary level o f education (4 8%). 13.3% had no formal
education.
There was no significant difference in education levels between males and females OR=1.21
(95%CI =0.79-1 85); p=0.349.
25

Figure 6: Distance travelled to the camp to seek eye services (n = 442)
1 6 0 -
140-| 120 J100^1
4 0 -»
20-0
153 (34 6 % )f ---
< 5
154 (34 8% )
35 (7 .9 % )
■” ■■ i ” i i5 - 1 0 1 1 - 1 5 1 6 - 2 0
Distance Travelled ( in K M 's )
64 ( 14 .5 )
I20 +
Majority of participants lived within a 10 km radius of an outreach centre (79.4%); 16% lived
between 10 and 20km away while 14.5% lived more than 20 km away from the outreach
centre. The range o f distance travelled is between less than 1 km and 150 km.
There was no sex difference between those who travelled over 20 km to attend the outreach
camp p=0.138
Figure 7: Pre-exiting refractive errors (n=68)
hypermetropia myopiaType of refractive error
There were 68 (15.4%) participants with pre-existing refractive errors out of which those with
myopia were 34 and hypermetropia were 34. There was no significant difference in refractive
error between males and females p=0.069; OR =1.62 (95%CI= 0.93-2.80)
26

H. ANALYSIS OF PRESBYOPIA
Table 5: Association of presbyopia by sex (n=388)
Patients Presbyopic OR P=value Mean P=value
seen patients (%) correction
(D)
Male 177 151(38.9) 0.69(95%CI 0.195 +2.18 0.001
Female 265 237(61.1) 0.37-1.26) +1.97
TOTAL 442 388(100.0) +2.05
388 out of 442 (87.8%) patients were found to have presbyopia. There was no significant
difference in frequency of presbyopia by sex (p-value = 0.195), but males required a
significantly higher near correction compared to women p=0.001.
Figure 8: Association of presbyopia by age (n = 388)
AGE GROUP (YEARS)
The near correction diopteric power increases with age and plateaus at 65 years.
27

Figure 9: Mean presbyopic correction by age group (n = 388)
There is an almost linear progression in the required near correction by age. It commences at
an average o f 1.3D in the 35 to 39 year age group and plateaus at 2.4D at 65 years and above.
Table 6: Early onset of presbyopia (age 35-39years): Association by sex (n=52)
Sex No presbyopia,
n (% )
W ith presbyopia,
n (% )
O R (95% Cl) P=value
Male 12(23.1) 2(3.8) 0.13 (0.02-0.78) 0.008
Female 17(32.7) 21 (40 4)
TOTAL 29 (55.8) 23 (44.2) 52(100)
Significantly more females than males presented with presbyopia in this age group (p=0.008).
28

Figure 10: Association between presbyopia correction and education level (n=388)
4 . 0
3 . 5
3 . 0 «
2 . 5
g - 2 .005Q .OQ
1 .5 ■
1.0 ■
.5 ■
0.0N •
--------------
56
Nil212
R 'im a ry106
Secondary
15
Tertiary
Education L e ve l
The trend shows that those with lower education level generally used a higher diopteric
power for near correction
Table 7: Association of presbyopia correction by education level (n=388)
Education level (n=388) Mean presbyopic correction in P-value
Diopters(D)
Secondary & Above ( l 20) + l.9 l (0.57)
Primary & Below (268) +2. II (0.63) 0.004
Those who have attained secondary education and above were associated whth a lower mean
presbyopia correction (p=0.004).
29

III. SPECTACLE COVERAGE
Only 45 patients brought with them their spectacles to be examined. O f these, 9 had incorrect
power o f spectacle correction.
Table 8: Association of spectacle coverage by sex in presbyopic patients (n=388)
Sex Correction (% ) No correction
(% )
O R (95%CI) P=value
Male 61 (15.7) 90 (23.2) 1.72(1.09-2.71) P=0.01
Female 67(17.3) 170 (43.8)
TOTAL 128 (33.0) 260 (67.0) 388(100.0)
Males were more likely to have spectacle correction p-value= 0.01.
Table 9: Association of spectacle coverage by education level (n=388)
Education
level
Correction
n (% )
No correction n
(% )
OR(95% Cl) P=value
Secondary 46(11.9) 74(19.1) 1.41 (0.88-2.27) P=0.134
and above
Primary and 82 (21.1) 186 (47.9)
below
TOTAL 128(33.0) 260 (67.0) 388(100)
33% of participants with presbyopia had spectacle correction however there was no
significant difference in presbyopic spectacle uptake with respect to education level attained
(p=0 134)
30

Table 10: Association of spectacle coverage by distance from the centre (n=388)
Distance from
centre (km)
Correction
n (% )
No correction
n(% )
O R (95% C l) P=value
<10 93 (24.0) 181 (46.6) 1.16(0.71-1.91) P=0.536
! >10 35 (9.0) 79 (20.4)
TOTAL 128 (33.0) 260 (67.0) 388(100)
Distance o f the participants residence from the outreach centre did not influence significantly
the uptake of spectacle p=0.536.
Figure 11: Reasons given for not wearing spectacles in patients with presbyopia (n=260)
44% o f presbyopia participants were not aware that their condition can be corrected by
spectacles; 39% were comfortable with their presbyopia and did not see the need to seek help
Only 17% cited cost as the main inhibiting factor from buying spectacles. Another 10% were
not aware they were presbyopic.
31

Figure 12: Choice of place to buy their spectacles (n=128)
place of purchase
46.9% o f patients with spectacle correction bought them from outreach camp; 31.1% bought
theirs from hospital. 2.3% were given spectacles by relatives or shared with their spouses.
32

Figure 13: Reasons for choice of place to buy spectacles (n=128)
r e a s o n s
The convenience o f the place (41.4%) and recommendation by someone else (32.8%) were
the most common reasons for choosing a particular place for buying their spectacles.
Figure 14: Reasons for choosing outreach centre to buy spectacles (n=60)
34(56.7)
35
30
_ 25
E 153
c 10
5
0consent cheap recommended
reasons for choosing outreach camp
Outreach camps were chosen for obtaining their spectacles mainly because it was convenient
(56.7%). Other reasons were cost (23.3%) and recommendation by others (20%).
33

6. DISCUSSION
Study population
A total of 442 patients were eligible to participate in the study after visiting 13 different
towns (figure 3). They were distributed over 12 districts (Mwea and Kerugoya are in
Kirinyaga district) and 3 provinces (Central, Rift valley and Eastern). 265 (60%) of the
patients examined were female while 177 (40%) were male. This was contrary to what was
expected. Women generally have a worse health seeking behaviour than men mainly because
they are economically disadvantaged more so in rural areas. This finding therefore, could be
explained by the fact that most services rendered at the eye camp are free. This includes
consultation at the camp site, transport to and from hospital and any surgeries carried out at
Lions SightFirst Eye Hospital. Food and their hospital stay are catered for without any
additional cost to the patient. The elimination of cost reduces the barriers to access the eye
services by women and thereby increase their turnout.
Their ages ranged from 35 years to 85 years for both males and females. The mean age for
males was 59.8 years and for females was 53.1 years. Males were significantly older than
females p<0.001 (Table 4). Males being older could be because the younger ones are the
bread winners of the family and fewer were able to attend the camps.
Prevalence of presbyopia
Evidence of presbyopia was found in 388 (87.8%) of the patients examined (table 5). This
was higher than what Patel ei a t found in the same age group (61.7%) and closer to what
Sherwin et a t 0 found (85.4%) in an older age group.
34

This high prevalence could be explained by the fact that the study was done in a camp setting
where subjects were patients who were seeking an eye service o f one kind or another
therefore the probability of capturing those with presbyopia was higher
Association between presbyopia and sex
The prevalence o f presbyopia was found to be higher among females 89.4% than in males
85.3%. This was not found to be statistically significant p=0.195(Table 5). This was similar
to findings in the studies by Patel et al, Nirmalan el a l and Duarte et al. 7’ * 9
However the mean correction for males (+2.18D) was higher compared to females (+1.97D)
and this was statistically significant p=0.001 (table 2). This could be explained by the fact
that males were significantly older than females. The median and mode presbyopia correction
was equal for both sexes, +2.00D.
Association between presbyopia and age
The average age o f presbyopic males was 62.3 years while that of females was 54.2 years.
Patients who were examined were grouped into clusters o f 5 years each for ease of analysis.
There was an increase in degree of presbyopia with increasing age in almost a linear pattern
which levelled off at 65 years o f age (figure 8, 9). This was different from that found by Patel
et al whose study showed it plateaus earlier at 50 years.
Those below the age of 40 years represented 11.8% (52) of the total patients examined.
Presbyopia was found to be more prevalent in females compared to males in this category
(p=0.008) (table 6). This correlated with studies done by Duarte el a i1 and Pointer J.S et al23.
This could be due to a better health seeking behaviour among females in this age group or
purely be an indication that there was an earlier onset of presbyopia in females.
UM'VERsrry of m,„P0B( medical librarv 35

Figure 15: Presbyopia correction: Proposed normogram for Kenyan African
Population
3 -I
S 2 5a
♦
Q.5 2
4 -------- - ♦---------- ---------- ♦
QT3
. w. s '
*
a.? * S '
*
2c
n r5
035-39 40-44 45-49 50-54
A g e G ro u
55-59
p s (y e a rs )
60-64 65-69 70+
— * _ A F R IC A N W E S T E R N
(Western values adapted from Principles and Practice o f Ophthalmology)
Further studies may need to be conducted on larger scale i.e. population based, to get a more
refined picture of the best values.
Association between presbyopia and education level
At least 53.6% (237) of patients had received primary education. Also included in this
category were those who had attended adult literacy education classes. Only 4.8% had
received tertiary education (figure 10).
There was no significant difference in education levels between males and females p= 0.349.
Those who had less education were associated with significantly more severe presbyopia
p=0.004 (table 7). This was contrary to the finding in the study done by Patel el a t who
found higher education was associated with more severe presbyopia. This could be due to
incorrect interpretation o f clarity of near chart patterns when excessive power was used and
the near chart symbols appeared darker or bigger in the non-educated group of patients.
36

The correlation between education status and severity o f presbyopia has not been clearly
elucidated in literature. It is thought that the more educated one is (and therefore the
categories used above) the more time they spend reading and this prolonged strain on the
ciliary muscles may accelerate the aging process and therefore they are prone to earlier and
more severe presbyopia, however this was not found to so in this study.
Spectacle coverage
Of the patients found to have presbyopia, 67% did not have spectacle correction (table 8).
This was similar to that found by Nirmalan et a f who found unmet presbyonia correction of
70%. J.Ramke15 et al found an unmet spectacle correction o f 73.8% while Sherwin et al 10
and Patel el a t also found unmet spectacle need of 80% and 94% respectively.
Males were more likely to have spectacle correction than females; (p= 0.01; OR 1.72, (95%
Cl 1 09-2.71)) (Table 8). This could be because the male participants in the study were
significantly older and more economically endowed so as to acquire the spectacles when
prescribed.
Spectacle coverage was not affected by education status (p=0.134) (table 9) nor by distance
from the outreach centre (p=0.536) (table 10) contrary to Dandona et a / lx who found
increased spectacle uptake with increased education status.
Various reasons were given by participants as to they why stayed without correction (figure
11) The most common were not being aware that their condition could be corrected (44%)
and not seeing the need to have spectacle correction (39%; figure9). 20% o f patients were
found to have incorrect presbyopia correction; however this was based on the few patients,
37

(35%) who came with their spectacles. This incorrect power could be due to lack of renewal
of the prescription as the presbyopia progresses.
Out reach camps were the most popular site patients chose to buy their spectacle correction
from (46.9%) followed by hospitals (31.3%) while the 3% either were given or shared
spectacles with someone else (figure 12). The choice o f place mainly depended on the
convenience to the patient (41.4%) and it being recommended by others (32.8%) (figure 13).
Outreach camps were chosen mainly because they were convenient (56.7%) to the patient in
terms of proximity to their home and comprehensive care they would get there, low cost of
the spectacles (23.3%) and also because previous patients who attended them recommended
them to others (20%) (figure 14).
Distance from the centre
69 4% o f the participants lived within 10km radius o f the centre used for the outreach while
14 5% lived outside a 20km radius, the furthest being 150km away (figure 6). Majority of
patients attended to at the camp did not have a consistent alternative centre for eye care.
Distance from the outreach centre did not influence significantly the uptake o f spectacles
p=0.536 This is contrary to what was expected probably because there are other outlets
providing spectacles for example optical shops, local health institutions or at the market
place.
38

7. CONCLUSION
1 There was 87 8% prevalence o f presbyopia in patients attending outreach camps in the
age group 35 years and above.
2. Increasing age and lower education status were associated with more severe presbyopia
Females had an earlier presentation o f presbyopia.
3 Spectacle coverage was 33% but 20% o f those who brought their spectacles had the
incorrect spectacle power.
4 69.4% of patients resided within a 10km radius o f an outreach camp. Distance from the
outreach camp did not influence the uptake of spectacles in patients with presbyopia.
39

i. RECOMMENDATIONS
1 Increase awareness to communities that presbyopia is a condition that can occur as early
as mid 30’s and can easily be corrected with spectacles These spectacles can be used in
all types of near work and not just reading and are therefore appropriate for illiterate
individuals.
2. Health care workers in the eye unit should be aware o f presbyopia occurring as early as
mid 30’s and patients should be examined for it whether or not they are symptomatic.
Increased detection is through liaising with other units in the hospital for appropriate
referral to the eye unit either from out-patient unit or in-patients on discharge. Presbyopia
detection and management should also be incorporated in outreach programmes to
capture those in the community who are unable to attend to an eye unit for one reason or
another. Those found not to be presbyopic at first visit will be advised they may get it
later on while those found to be presbyopic will be given a prescription and provided with
appropriate spectacles. They will be advised on to change them, if need be, later on
because presbyopia is a progressive condition
3 Policy makers should incorporate the detection and management o f presbyopia in the
national eye care plan This has to be coupled with provision o f appropriate and
affordable spectacles at every eye unit This will make presbyopic services accessible,
affordable and available and reduce the morbidity and increased dependence associated
with uncorrected presbyopia.
4 Population based studies need to be conducted in the African setting to develop our own
protocol of presbyopia correction because the age adjusted presbyopic correction differs
from that in western countries.
40

10. REFERENCES
I Andrew R Elkington: Clinical Optics 3rd Ed, Blackwell Publishers
2. American Academy of Ophthalmology, Basic and clinical science course 2003-2004
section 3 (CD-ROM)
3. Schachar A.R.: Presbyopia: cause and Treatment. (website:
emedicine/emedicinespecialities/ophthalmology/presbyopia)
4. Paul Kauffmann, Adler’s Physiology o f the Eye 9th Ed Mosby Publishers pg 402-408;
5. Myron Yanoff, Jay S. Duker, Ophthalmology 2nd Ed 2004 Mosby-Elsevier Publishers
6 Patel llesh , Andrew Burke, Beatriz Munoz, Andrew Kayongoya, West S.K. Presbyopia:
Prevalence, impact and interventions; Community Eye Health Journal September 2007;
20 (63)37-41
7. Nirmalan Praveen, Sannapaneni Krishnaiah, Gullapalii N. Rao, Ravi Thomas; A
Population based assessment o f Presbyopia in the state o f Andhra Pradesh, South India:
The Andhra Pradesh eye disease study; Investigative Ophthalmology and visual science
journal 2006; 47: 2324-2328
8 Duarte et al, Barros A.S., Dias-da-Costa J.S. Cattan J.M.; Prevalence o f near vision
deficiency and related factors- A population based study; Cad Saude Publica Mar-Apr;
19(2): 551-559
9. Patel llesh., Andrew Burke, Beatriz Munoz, Andrew Kayongoya, West S.K. Presbyopia
et al; Population based study of presbyopia in rural Tanzania, Ophthalmology 2006
May; 113 (5): 723-727
10. Sherwin J.C. Keeffe J.E. Kuper H , Islam F.M. Muller A. Mathenge W.; Functional
presbyopia in a rural Kenyan population: The unmet presbyopic need.; Clinical
Experiment Ophthalmology 2008 Apr 36 (3): 245-251
41
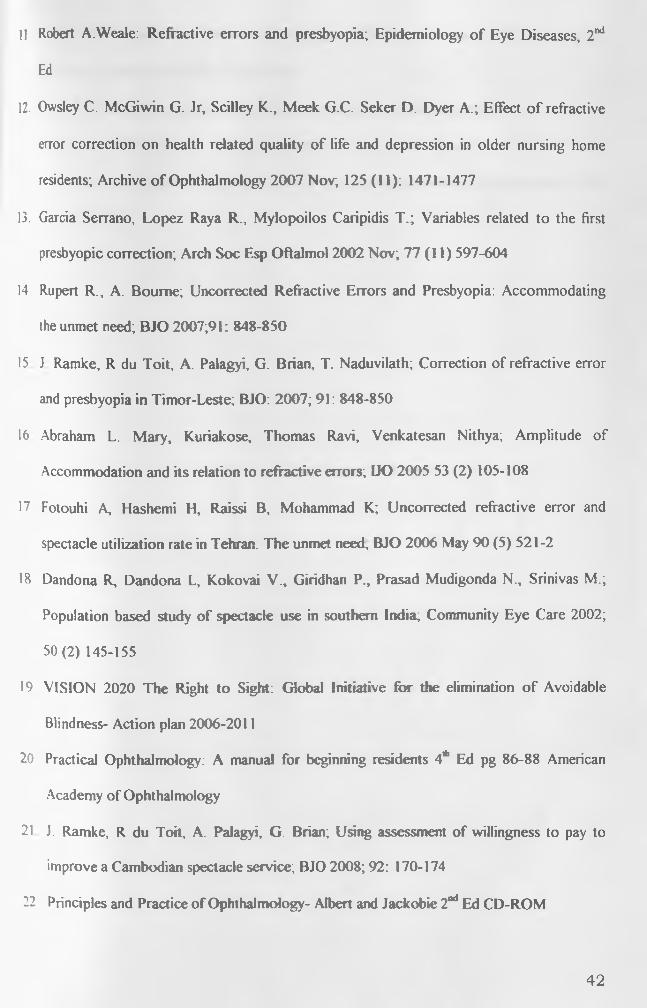
11 Robert A.Weale: Refractive errors and presbyopia; Epidemiology o f Eye Diseases, 2nd
Ed
12. Owsley C. McGiwin G. Jr, Scilley K., Meek G.C. Seker D. Dyer A.; Effect o f refractive
error correction on health related quality o f life and depression in older nursing home
residents; Archive o f Ophthalmology 2007 Nov, 125 (11); 1471-1477
13. Garcia Serrano, Lopez Raya R., Mylopoilos Caripidis T.; Variables related to the first
presbyopic correction; Arch Soc Esp Oftalmol 2002 Nov; 77 (11) 597-604
14 Rupert R., A. Boume; Uncorrected Refractive Errors and Presbyopia: Accommodating
the unmet need; BJO 2007;91: 848-850
15 J Ramke, R du Toit, A. Palagyi, G. Brian, T. Naduvilath; Correction of refractive error
and presbyopia in Timor-Leste; BJO: 2007; 91: 848-850
16 Abraham L. Mary, Kuriakose, Thomas Ravi, Venkatesan Nithya; Amplitude of
Accommodation and its relation to refractive errors; IJO 2005 53 (2) 105-108
17. Fotouhi A, Hashemi H, Raissi B, Mohammad K; Uncorrected refractive error and
spectacle utilization rate in Tehran: The unmet need, BJO 2006 May 90 (5) 521-2
18 Dandona R, Dandona L, Kokovai V., Giridhan P., Prasad Mudigonda N., Srinivas M.;
Population based study o f spectacle use in southern India; Community Eye Care 2002;
50 (2) 145-155
19 VISION 2020 The Right to Sight: Global Initiative for the elimination o f Avoidable
Blindness- Action plan 2006-2011
20 Practical Ophthalmology: A manual for beginning residents 4lh Ed pg 86-88 American
Academy of Ophthalmology
21 J. Ramke, R du Toit, A. Palagyi, G. Brian; Using assessment o f willingness to pay to
improve a Cambodian spectacle service; BJO 2008; 92: 170-174
22 Principles and Practice o f Ophthalmology- Albert and Jackobie 2nd Ed CD-ROM
42

23. Pointer J.S.; Optometric Research, Highgram Ferrers, Nothants UK; Ophthalmic
Physiology Optometry 2002; 22(2): 126-9
24. Map of Kenya fwww.un ore/Depts/Cartographic/map/profile/kenya pdf)
25. Jamali A, Whitworth JA, Ruberantawari A; Causes and prevalence o f non vision
impairing ocular conditions in rural north-west Uganda; Ophthalmic Epidemiology 1999
Mar; 6(1)41-8
43

APPENDIX A : PRESBYOPIA QUESTIONNAIRE
PART 1 Date______________
1. Date of birth: / / Age:__________years
2. Residence: ________________ _ (SUBLOCATION)
3. Distance travelled from home to this centre for eye service: _______ km
4. Sex: l~ M l” F
5. Education: l~ Nil Primary I” Secondary Tertiary
P.ART2
6. Do you have difficulty in reading [e g. Bible/Newspaper], focusing near objects or
doing near work? I” Yes C~ No
7. If yes above (Q6), do you normally wear spectacles while reading?
[ j Yes r No
8. If No above (Q7), why not? I” Don’t see the need
CD I look ugly in them r Broken/lost
r Too expensive L they don’t help
Did not know service is available
□ others_____________________________ ______
9. Where did you buy your spectacles from? CD Outreach camp
D Optical shop □ hospital CD clinic CDmarket/roadside CD given to
me/ sent by relative CDothers____________
44

10 Why did you buy them from there? CD Cheap C l convenient C l wide variety
D good service HU recommended to me C l others
11. How much did the spectacles cost you? Ksh______________
(Which y ear?________________ )
PART 3 (examine if available)
12. Type o f spectacles I Nil T Readers C Bifocal
r Progressives
13. The status o f the spectacles. Clclean HU scratched
14 Power o f spectacles
Bifocals/progressives Distance
Near add
Readers only
C l broken C] others
RE LE
1________b 1____ D
1_______D 1 D
1 D 1_______D
P ART 4
15 DISTANT VISION of the Patient: - ( if worse than 6/9, refract subjectively)
Without correction Patients own correction
45

Without correction Best corrected
16 NEAR VISION: With the above correction still in the trial frame, do near vision. (If
worse than N6 refract with plus lenses)
With distance correction Patients own correction
N 1
--------¥ N 1
-------------------------- ---1------------ ! i _ .....
With distance correction Elest corrected
N N
46

APPENDIX B: CONSENT FORM
l _______________________ hereby agree to participate in a study on eye assessment as
explained to me by Dr Mukiri Mukuria o f University of Nairobi (UoN).
I have understood the study is non-invasive and it will pose no risk to me.
Signature___________________ Date_______________________________________
Dr Mukiri Mukuria
Cheti cha Kibali
Mimi ___ _______ __ nakubali kupimwa macho na Dkt Mukiri Mukuria kutoka
chuo kikuu ya Nairobi (UoN) baada ya kuelezwa na kuelewa kuwa kipimo hiki hakihitaji
upasuaji wala hakitanidhuru
Sahihi Tarehe
Dkt Mukiri Mukuria
47

APPENDIX C: TH E MAGNITUDE AND PATTERN O F PRESBYOPIA AMONG PATIENTS SEEN ON OUTREACH W ITH LIONS SIGHTFIRST EYE HOSPITAL, LORESHOMinimum sample size= 363; target number =450 Proposal= 35 pages; expected final book size = 70 pages
MMED THESIS PROPOSED BUDGET - DR MUKIR1 MUKURIA
ITEMS Unit Cost (Ksh) Quantity Total (ksh)1. Proposal preparationTyping & printing draft
40x35 1 1,400
Copies to supervisor 3x35 3 315
Revision/correction o f drafts3x35
3 315
Printing final draft 40x35 1 1,400
Copies to ethical committee:Photocopies 3x35 3 315Binding 100 3 300
Ethical committee fees 1500 1 1,500
Subtotal 5,545
2.Data collection:Stationery & equipments e.g.Questionnaires (3 pages each) 3x3 450 4,050Torches, 200 1 200Pens, 20 5 100Folders 250 1 250Flash disk 1500 1 1500CD 200 2 200Consumables & Lab lx egBatteries, 100/pair 5 pairs 500Lignocaine 150 3 450Mydriacyl 150 3 450Contracted services e gStastician 20,000 1 20,000Research assistant 12,000 1 12,000
Transport 400per return trip 24trips 9,600
Communication: Airtime 1,000
Sub total
150,300
48

3.Data management & Reporting |
Typing & printing o f preliminaryResults
40x70 1 2,800
Copies to supervisors: 3x70 3 630
Revision o f Results: 3x70 3 630
Photocopies:- Black and White 3x70 8 1,680Coloured 40x10 8 3,200Binding of books 200 8 1,600
Sub total 10,540
5. Contingencies (1 0 % ) 6,640
GRAND TOTAL 73,025
IWfvtffjrrry
u ^ a h y : i
49