Embed Size (px)
Citation preview

The multiple scales of uncertainty: an engineer's perspective
E. Belia, Ph.D., P.Eng.Primodal Inc.
Quantifying Uncertainty in Integrated Catchment Studies (QUICS)
Final Dissemination Event, Amsterdam International Water Week
Thursday 2nd November 2017
Overview
• Current practice
• Drivers moving us to a new analysis framework
• Example
• The big picture – a complex system
• Things to think about
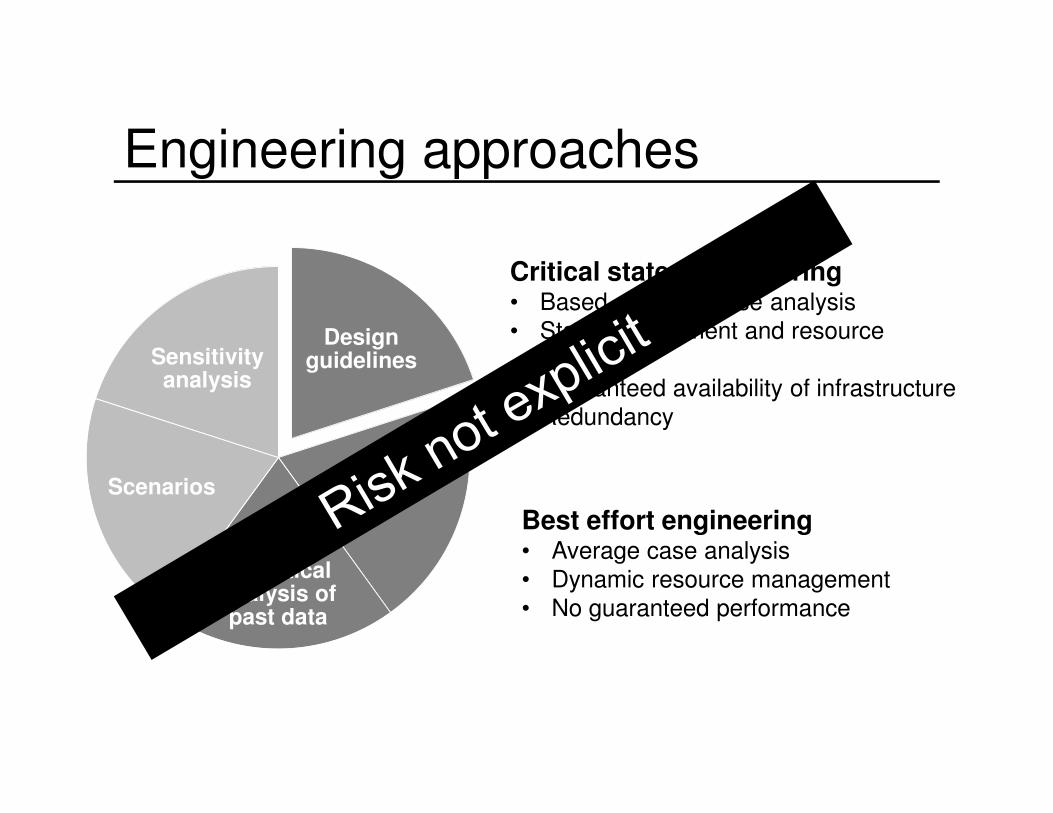
Engineering approaches
Critical states engineering• Based on worst-case analysis
• Static environment and resource
allocation
• Guaranteed availability of infrastructure
• Redundancy
Best effort engineering• Average case analysis
• Dynamic resource management
• No guaranteed performance
Design guidelines
Models
Statistical analysis of past data
Scenarios
Sensitivity analysis
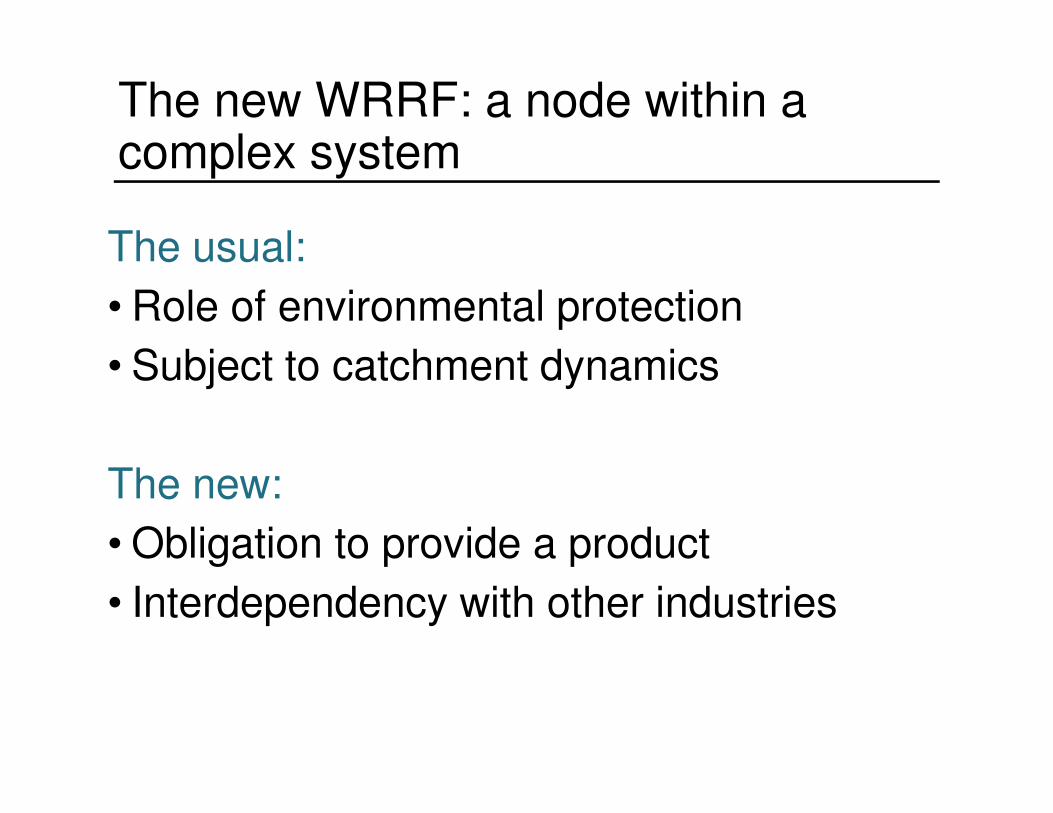
The new WRRF: a node within a complex system
The usual:
• Role of environmental protection
• Subject to catchment dynamics
The new:
• Obligation to provide a product
• Interdependency with other industries
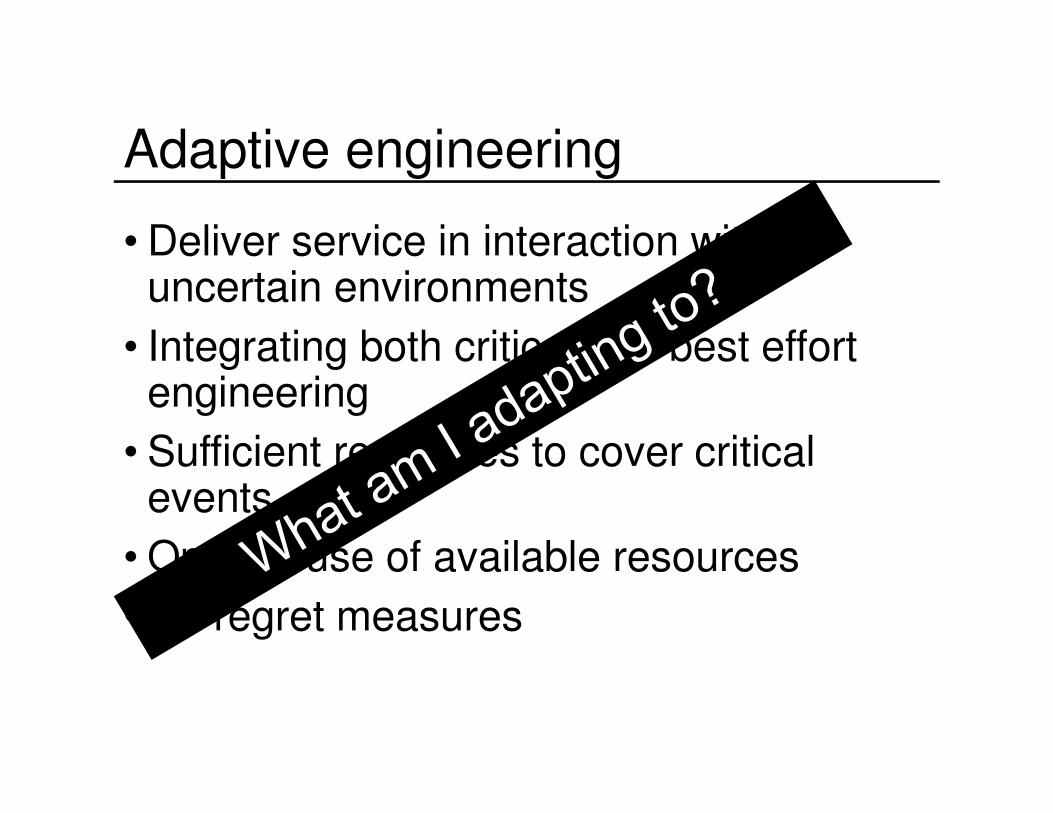
Adaptive engineering
• Deliver service in interaction with uncertain environments
• Integrating both critical and best effort engineering
• Sufficient resources to cover critical events
• Optimal use of available resources
• No regret measures
Example: achieving reclaimed water qualityJ. Weiss, LACD Senior Engineer, Rtd.E. Belia, Primodal Inc.
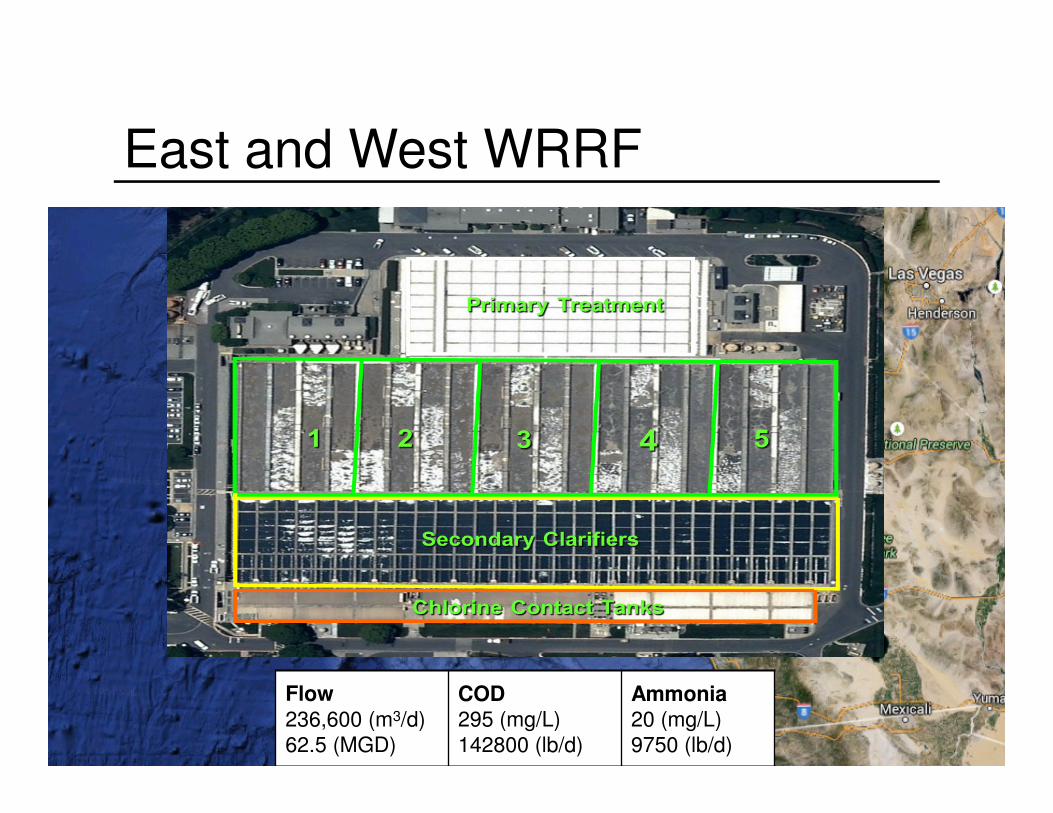
East and West WRRF
Flow
236,600 (m3/d)
62.5 (MGD)
COD
295 (mg/L)
142800 (lb/d)
Ammonia
20 (mg/L)
9750 (lb/d)
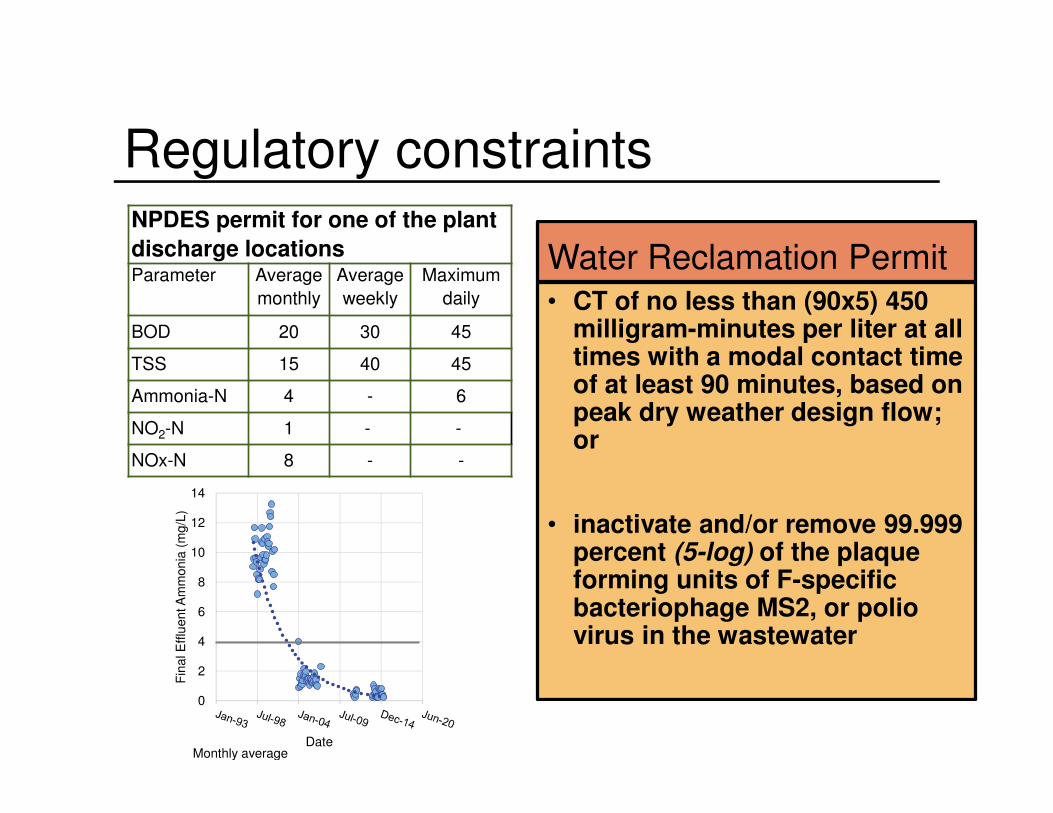
Regulatory constraints
Water Reclamation Permit• CT of no less than (90x5) 450
milligram-minutes per liter at all times with a modal contact time of at least 90 minutes, based on peak dry weather design flow; or
• inactivate and/or remove 99.999 percent (5-log) of the plaque forming units of F-specific bacteriophage MS2, or polio virus in the wastewater
0
2
4
6
8
10
12
14
Fin
al E
fflu
ent A
mm
onia
(m
g/L
)
DateMonthly average
NPDES permit for one of the plant
discharge locationsParameter Average
monthly
Average
weekly
Maximum
daily
BOD 20 30 45
TSS 15 40 45
Ammonia-N 4 - 6
NO2-N 1 - -
NOx-N 8 - -
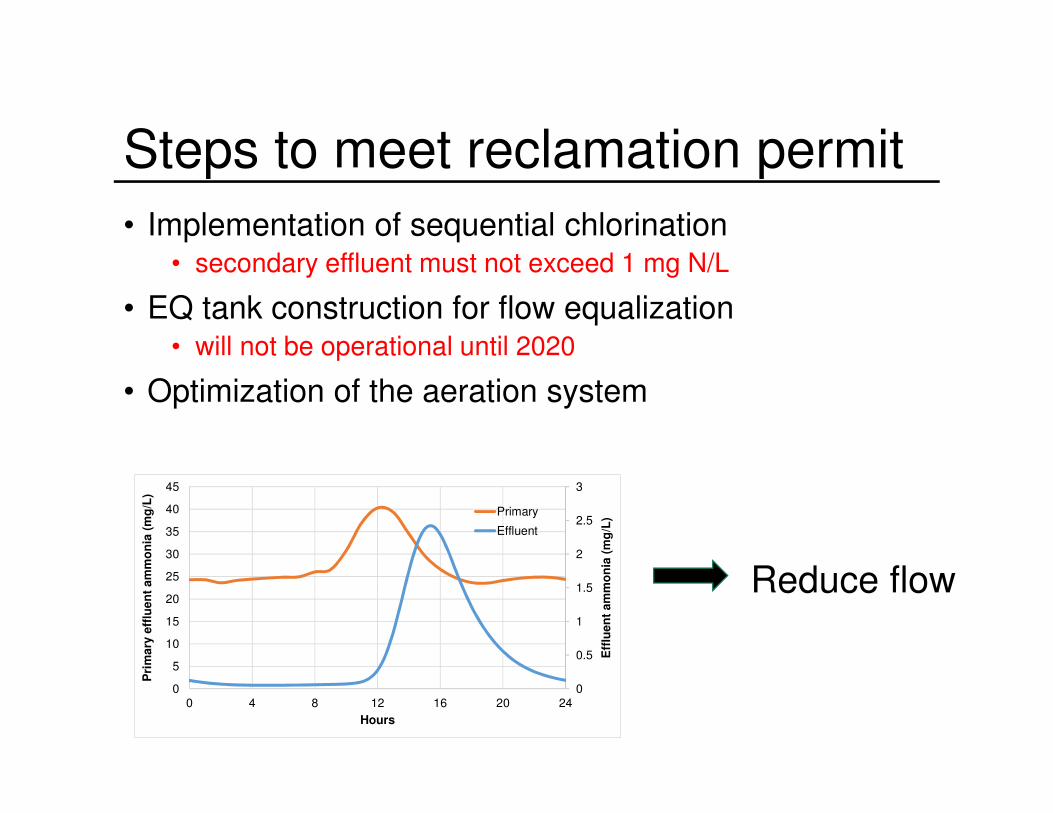
Steps to meet reclamation permit
• Implementation of sequential chlorination• secondary effluent must not exceed 1 mg N/L
• EQ tank construction for flow equalization• will not be operational until 2020
• Optimization of the aeration system
0
0.5
1
1.5
2
2.5
3
0
5
10
15
20
25
30
35
40
45
0 4 8 12 16 20 24
Eff
lue
nt
am
mo
nia
(m
g/L
)
Pri
ma
ry e
fflu
en
t a
mm
on
ia (
mg
/L)
Hours
Primary
Effluent
Reduce flow

Adaptive approach
‘What is the risk of a disinfection failure caused by excessive secondary effluent ammonia bleed through?’
Environmental - Social - Economic
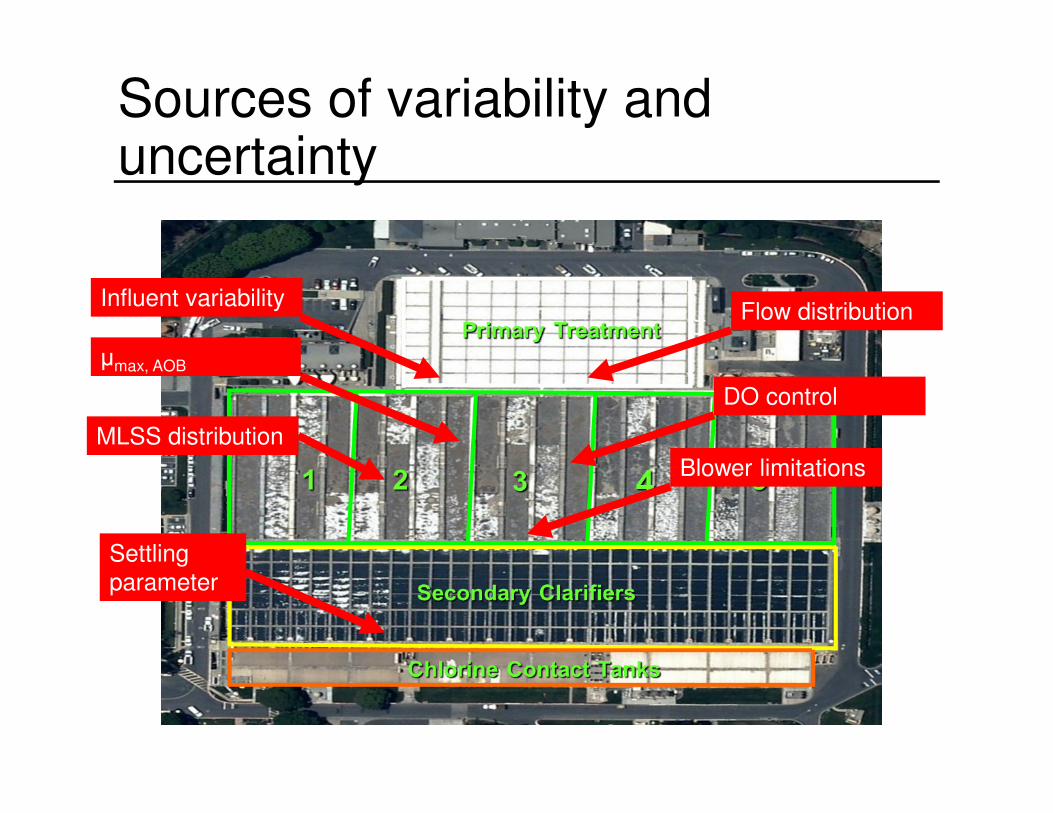
Sources of variability and uncertainty
Influent variability
μmax, AOB
Flow distribution
DO control
Blower limitations
Settling
parameter
MLSS distribution

Process model
Histogram Burr
qmax0.120.1150.110.1050.10.0950.090.0850.080.0750.070.065
Parametric uncertainty
Jeffrey Weiss, LACD Senior Engineer, Rtd.
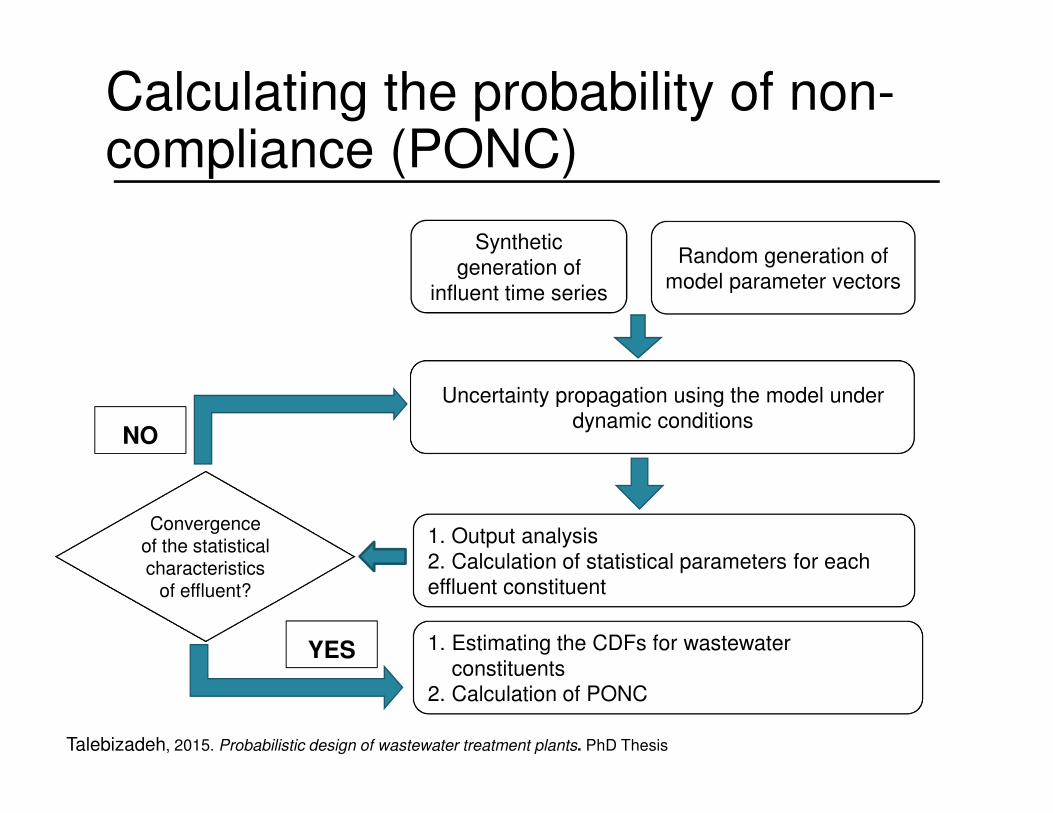
Calculating the probability of non-compliance (PONC)
1. Estimating the CDFs for wastewater
constituents 2. Calculation of PONC
1. Output analysis
2. Calculation of statistical parameters for each effluent constituent
Convergence of the statistical characteristics
of effluent?
Uncertainty propagation using the model under dynamic conditions
Random generation of
model parameter vectors
Synthetic
generation of
influent time series
YES
Talebizadeh, 2015. Probabilistic design of wastewater treatment plants. PhD Thesis
NO
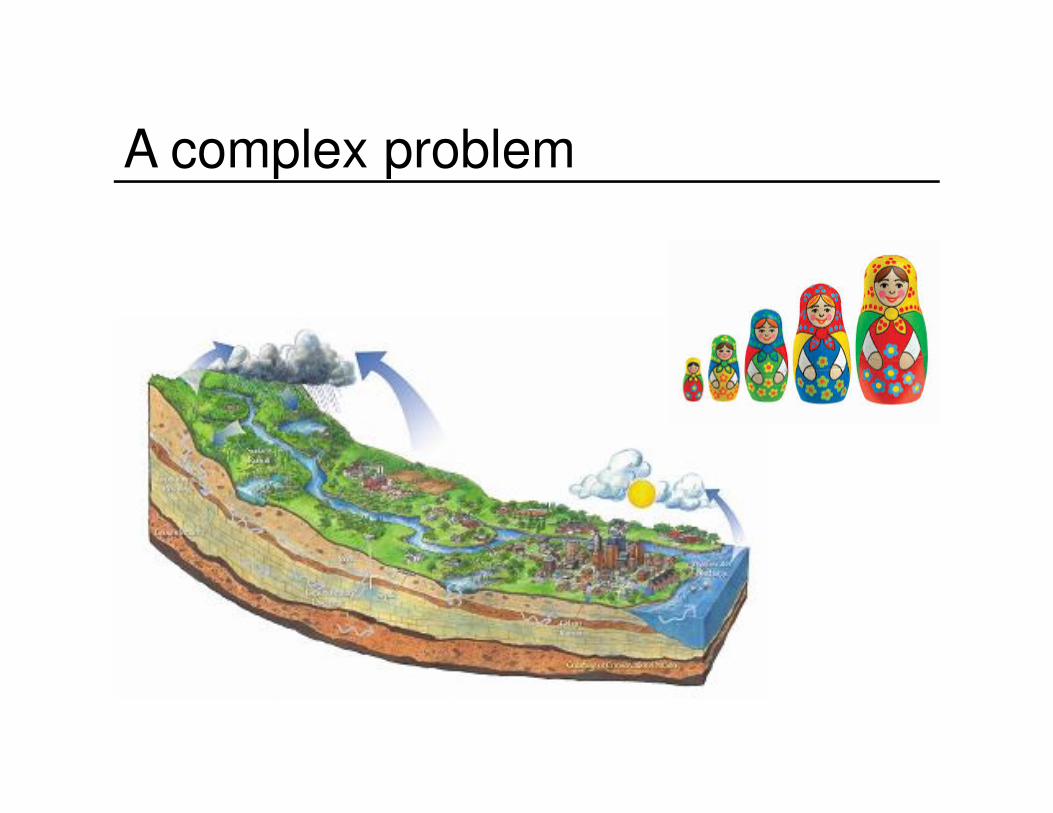
A complex problem
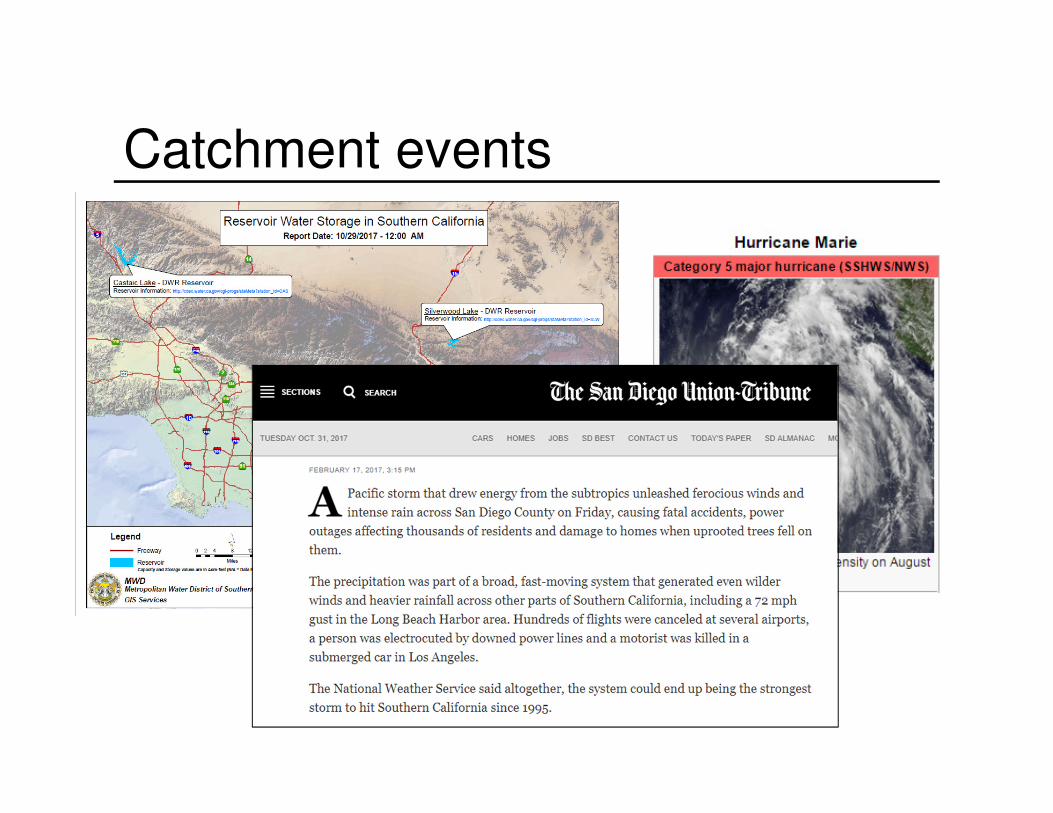
Catchment events
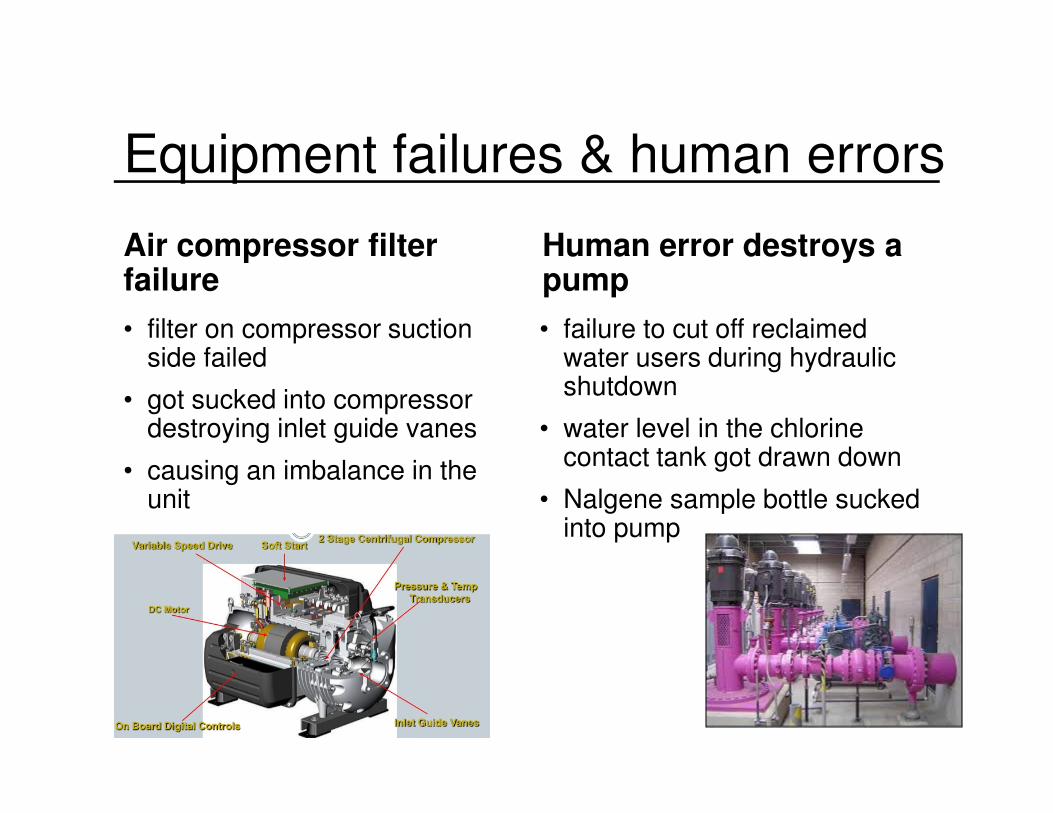
Equipment failures & human errors
Air compressor filter failure
• filter on compressor suction side failed
• got sucked into compressor destroying inlet guide vanes
• causing an imbalance in the unit
Human error destroys a pump
• failure to cut off reclaimed water users during hydraulic shutdown
• water level in the chlorine contact tank got drawn down
• Nalgene sample bottle sucked into pump

A tragedy
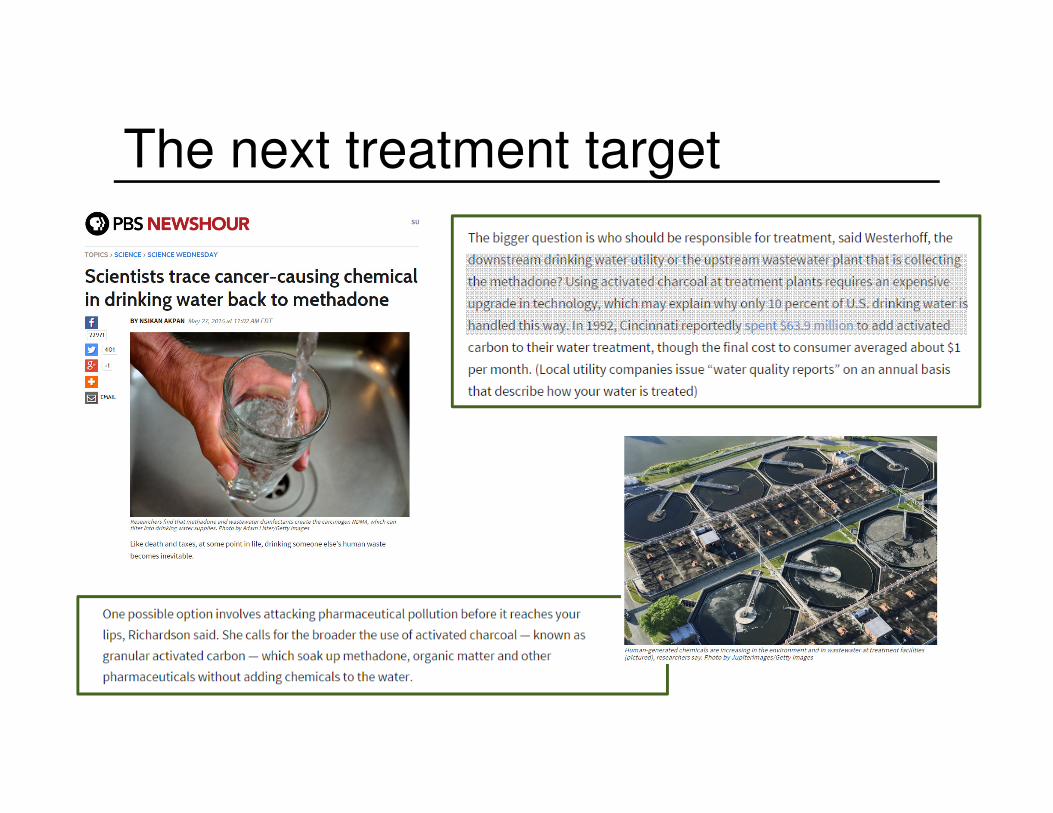
The next treatment target
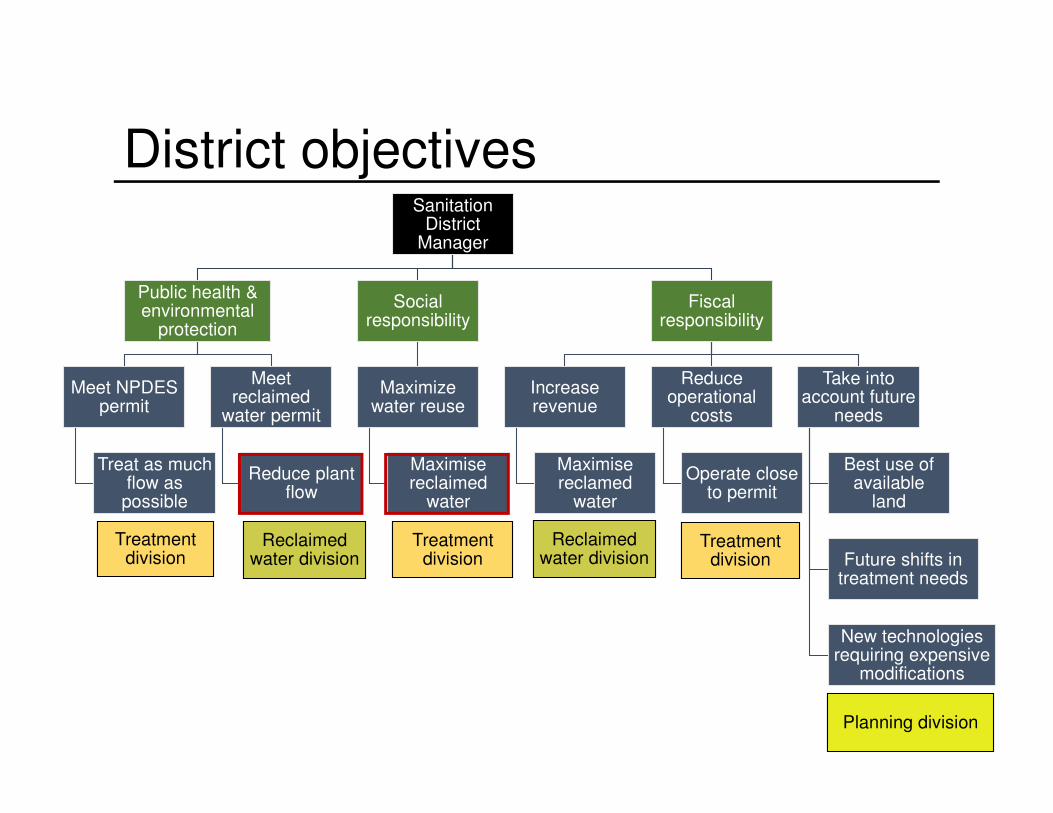
District objectivesSanitation
District Manager
Public health & environmental
protection
Meet NPDES permit
Treat as much flow as
possible
Meet reclaimed
water permit
Reduce plant flow
Social responsibility
Maximize water reuse
Maximise reclaimed
water
Fiscal responsibility
Increase revenue
Maximise reclamed
water
Reduce operational
costs
Operate close to permit
Take into account future
needs
Best use of available
land
Future shifts in treatment needs
New technologies requiring expensive
modifications
Treatment division
Reclaimed water division
Planning division
Treatment division
Treatment division
Reclaimed water division
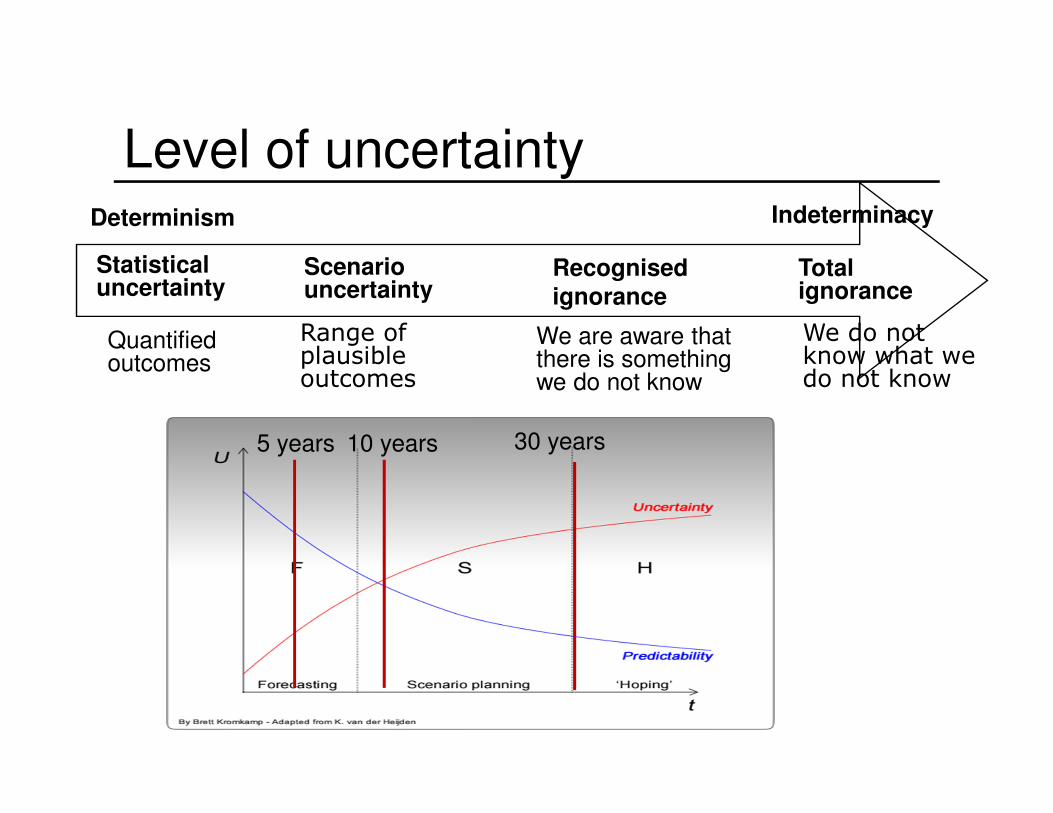
Level of uncertaintyDeterminism Indeterminacy
Statistical uncertainty
Scenario uncertainty
Recognised
ignorance
Total ignorance
Quantified outcomes
Range of plausible outcomes
We are aware that there is something we do not know
We do not know what we do not know
5 years 10 years 30 years
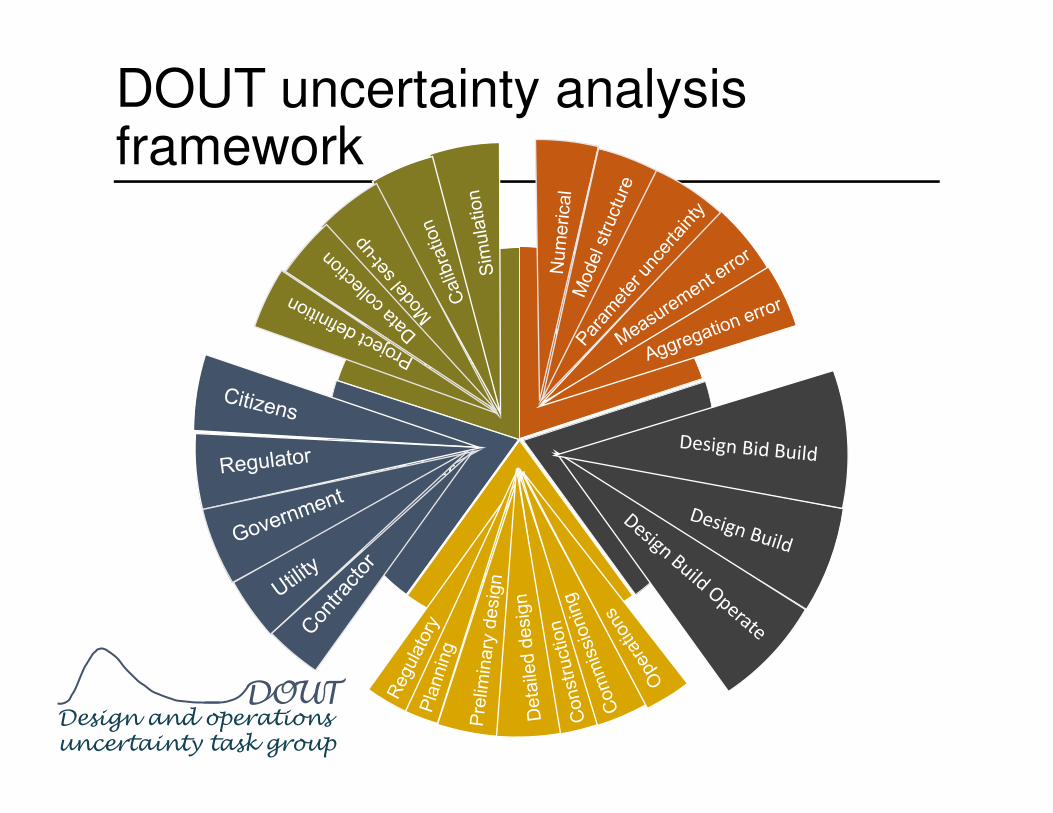
DOUT uncertainty analysis framework
Systems
analysis
Contract
type
Project stage
Stakeholder
Modeling
phase
DOUTDesign and operations uncertainty task group
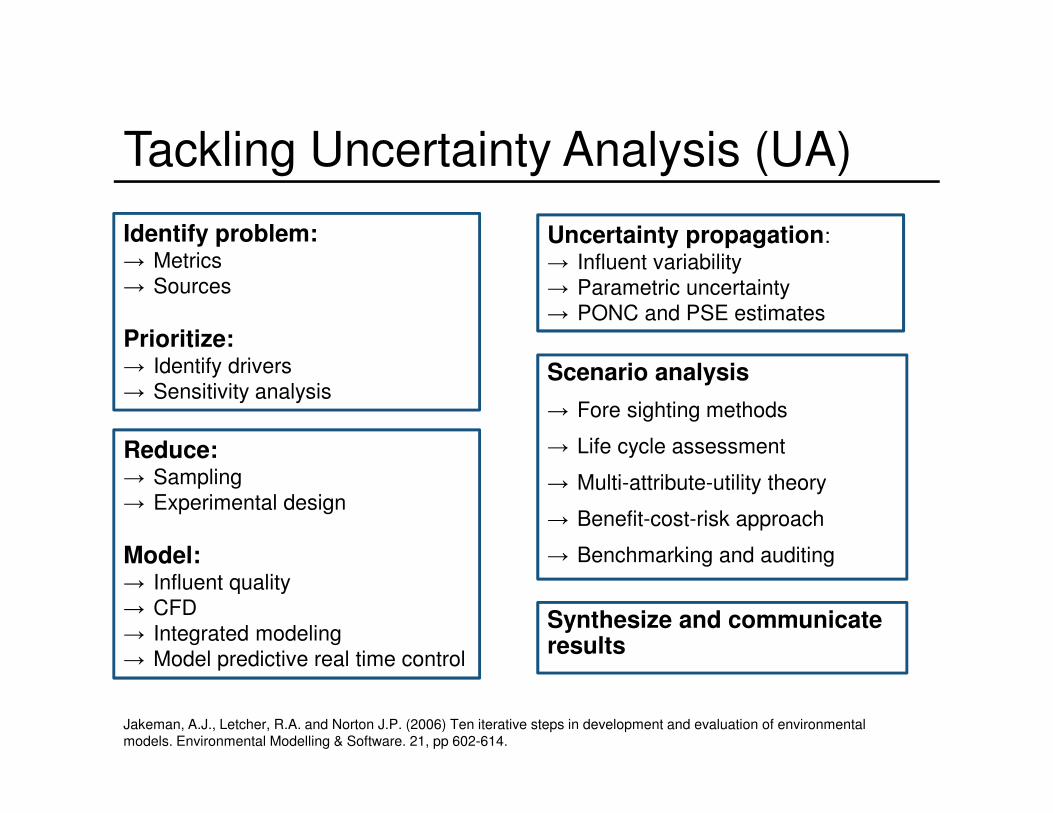
Tackling Uncertainty Analysis (UA)
Reduce:→ Sampling
→ Experimental design
Model:→ Influent quality
→ CFD
→ Integrated modeling
→ Model predictive real time control
Scenario analysis
→ Fore sighting methods
→ Life cycle assessment
→ Multi-attribute-utility theory
→ Benefit-cost-risk approach
→ Benchmarking and auditing
Synthesize and communicate results
Uncertainty propagation:
→ Influent variability
→ Parametric uncertainty
→ PONC and PSE estimates
Jakeman, A.J., Letcher, R.A. and Norton J.P. (2006) Ten iterative steps in development and evaluation of environmental models. Environmental Modelling & Software. 21, pp 602-614.
Identify problem:→ Metrics
→ Sources
Prioritize:→ Identify drivers
→ Sensitivity analysis
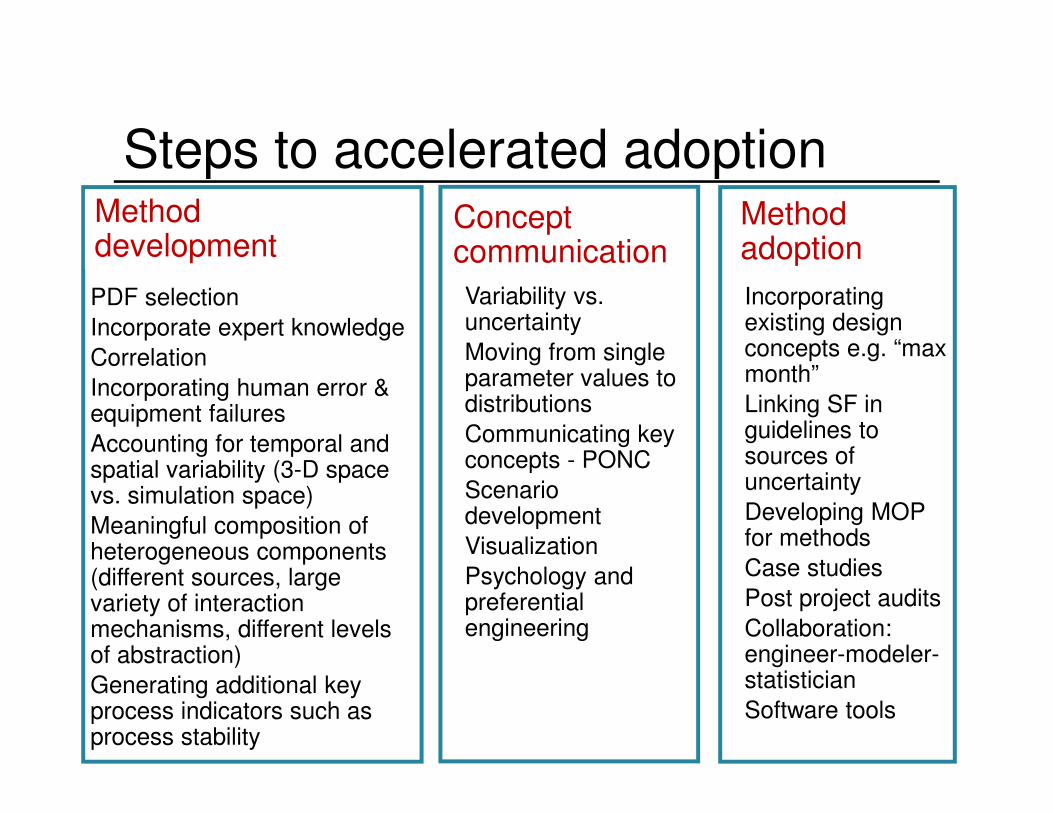
Steps to accelerated adoption
PDF selection
Incorporate expert knowledge
Correlation
Incorporating human error & equipment failures
Accounting for temporal and spatial variability (3-D space vs. simulation space)
Meaningful composition of heterogeneous components (different sources, large variety of interaction mechanisms, different levels of abstraction)
Generating additional key process indicators such as process stability
Method development
Variability vs. uncertainty
Moving from single parameter values to distributions
Communicating key concepts - PONC
Scenario development
Visualization
Psychology and preferential engineering
Concept communication
Incorporating existing design concepts e.g. “max month”
Linking SF in guidelines to sources of uncertainty
Developing MOP for methods
Case studies
Post project audits
Collaboration: engineer-modeler-statistician
Software tools
Method adoption
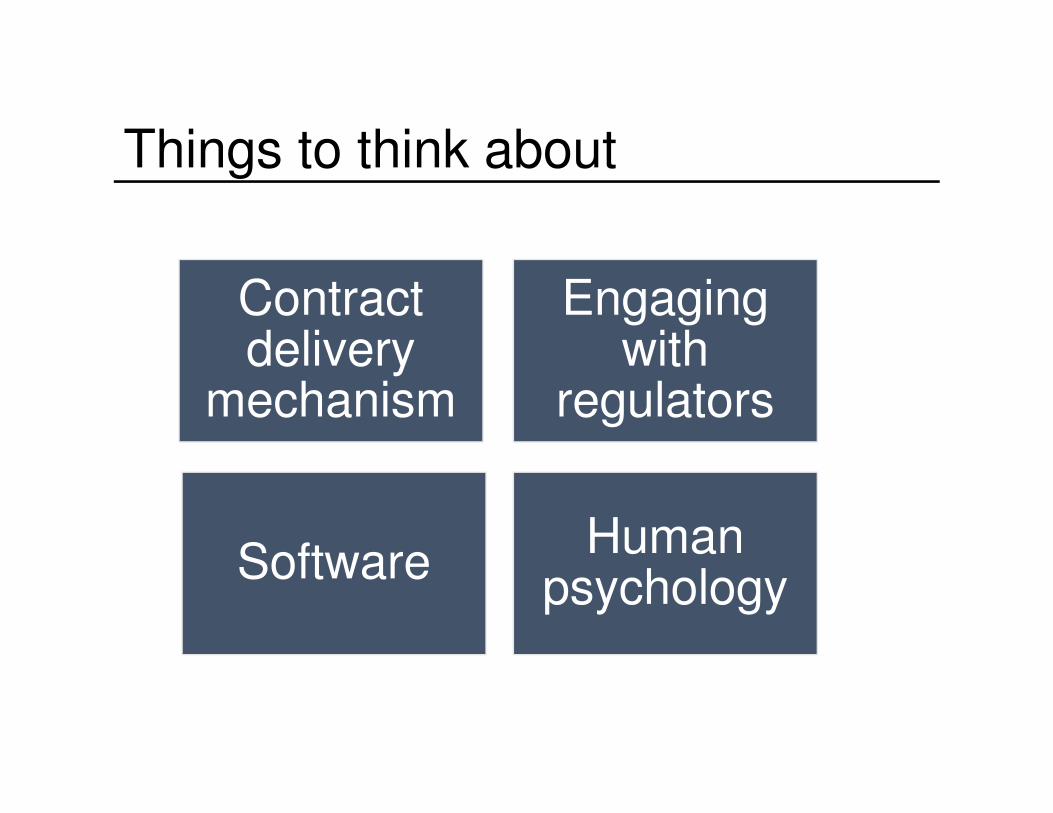
Things to think about
Contract delivery
mechanism
Engaging with
regulators
SoftwareHuman
psychology

Evangelina Belia
Primodal Inc.USA&Canadacell: (269) 873-0243
[email protected]://www.primodal.com
Presenter contact information