Embed Size (px)
Citation preview
REVIEWEndocrine-Related Cancer (2007) 14 587–599
The optimal imaging of adrenal tumours: acomparison of different methods
Ioannis Ilias, Anju Sahdev1, Rodney H Reznek1, Ashley B Grossman2
and Karel Pacak 3
Department of Endocrinology, Elena Venizelou Hospital, Athens GR-11521, Greece
Departments of 1Radiology and 2Endocrinology, St Bartholomew’s Hospital, West Smithfield, London EC1A 7BE, UK3Section on Medical Neuroendocrinology, Reproductive Biology and Medicine Branch, National Institute of Child Health and Human
Development, National Institutes of Health, Building 10, CRC, 1 East, Room 1-3140, 10 Center Drive, MSC-1109, Bethesda,
Maryland 20892-1109, USA
(Correspondence should be addressed to K Pacak; Email: [email protected])
Abstract
Computed tomography (CT; unenhanced, followed by contrast-enhanced examinations) is thecornerstone of imaging of adrenal tumours. Attenuation values of !10 Hounsfield units on anunenhanced CT are practically diagnostic for adenomas. When lesions cannot be characterisedadequately with CT, magnetic resonance imaging (MRI) evaluation (with T1- and T2-weightedsequences and chemical shift and fat-suppression refinements) is sought. Functional nuclearmedicine imaging is useful for adrenal lesions that are not adequately characterised with CT andMRI. Scintigraphy with [131I]-6-iodomethyl norcholesterol (a labelled cholesterol analogue) candifferentiate adrenal cortical adenomas from carcinomas. Phaeochromocytomas appear as areasof abnormal and/or increased uptake of [123I]- and [131I]-meta-iodobenzylguanidine (a labellednoradrenaline analogue). The specific and useful roles of adrenal imaging include thecharacterisation of tumours, assessment of true tumour size, differentiation of adenomas fromcarcinomas and metastases, and differentiation of hyperfunctioning from non-functioning lesions.Adrenal imaging complements and assists the clinical and hormonal evaluation of adrenal tumours.
Endocrine-Related Cancer (2007) 14 587–599
Introduction
The endocrine oncologist frequently has to assess adrenal
tumours, and many problems may arise in defining
whether lesions are primary to the adrenal or represent
other tissue, they are benign or malignant and they are
functioning or not. Improvements in imaging modalities
and their interpretation have increased dramatically over
the past few years, and can now offer a considerable
amount of material to help inform clinical decision
making. The purpose of this review is to summarise the
use of various imaging modalities in the assessment of
adrenal tumours in order to allow the clinician to make a
precise diagnosis and customise treatment accordingly.
The normal adrenals have an inverted Y-shape, are
located supero-medial to the kidneys and each weigh
4–5 g (Mayo-Smith et al. 2001). On computed
tomography (CT), the maximum width of the right
adrenal limb is 0.28 cm and the left adrenal limb is
0.33 cm (Vincent et al. 1994). In neonates and young
Endocrine-Related Cancer (2007) 14 587–599
1351–0088/07/014–587 q 2007 Society for Endocrinology Printed in Great
children, the glands are proportionately much larger than
in the adult. By conventional cross-sectional imaging, the
adrenal cortex and medulla cannot be distinguished.
There are three cortical zones, glomerular, fascicular and
reticular, producing aldosterone, cortisol and androgens
respectively. The glands’ medulla produces adrenaline
and noradrenaline. Tumours in the adrenals are common
in humans, being present in 3%of autopsies performed in
persons older than 50 years (Grumbach et al. 2003).
Primary tumours in the adrenals can be hyperfunctioning
(producing excess hormones from the cortex or the
medulla and accompanied by clinical symptoms) or non-
functioning (Ilias et al. 2004). Often adrenal tumours are
incidentally detected with abdominal ultrasound (sensi-
tivity is reported at 96 and 100% for tumours smaller and
larger than 2 cm respectively; Trojan et al. 2002).
Thorough imaging of such tumours is performed by
anatomical imaging modalities (such as CT or magnetic
resonance imaging (MRI) and functional imaging
modalities (i.e. nuclear scintigraphy).
Britain
DOI:10.1677/ERC-07-0045
Online version via http://www.endocrinology-journals.org
I Ilias et al.: Imaging of adrenal tumours
Computed tomography
The cornerstone of adrenal imaging is CT, performed
before and after i.v. injection of contrast medium and
acquired as 3–5 mmscans through the adrenal glands.The
advent of multi-detector CT (MDCT) has allowed post-
processing of the acquired data to narrow slice intervals
and provides detailed reformatted images in any plane.On
CT scanning the normal adrenals appear homogeneous
and symmetric, with a density approximately equal to that
of the kidney (Lockhart et al. 2002). Unenhanced CT is
important to provide densitymeasurements of lesions; it is
usually followed by a, preferably delayed, contrast-
enhanced study that can quantify the percentage of
absolute or relative contrast enhancement washout and
shows the vessels in the region of the adrenal glands
(Lockhart etal.2002,Slatteryetal.2006,Heinz-Peeret al.
2007). Visual assessment of the vascularity of a lesion and
the homogeneity of its enhancement can also be helpful in
characterising a lesion. The combination of unenhanced
CT and contrast washout values of adrenal masses can
assist in characterisation and distinguishing adenomas
from other adrenal tumours with 98% sensitivity and 92%
specificity (Korobkin et al. 1998, Caoili et al. 2002,
Sahdev & Reznek 2004).
Magnetic resonance imaging
MRI of the adrenal glands should include T1- and T2-
weighted images, plus chemical shift imaging (CSI)
which consists of in-phase and out-of-phase imaging. T1-
fat-suppressed imaging before and after i.v. gadolinium
administration is optional. Multi-planar MRI allows
precise localisation and separation of adrenal masses
from the surrounding structures, particularly the liver,
spleen, stomach, pancreas and kidneys. Normal adrenal
glands have T1 and T2 signal intensity equal or slightly
lower than that of the normal liver (Lockhart et al. 2002).
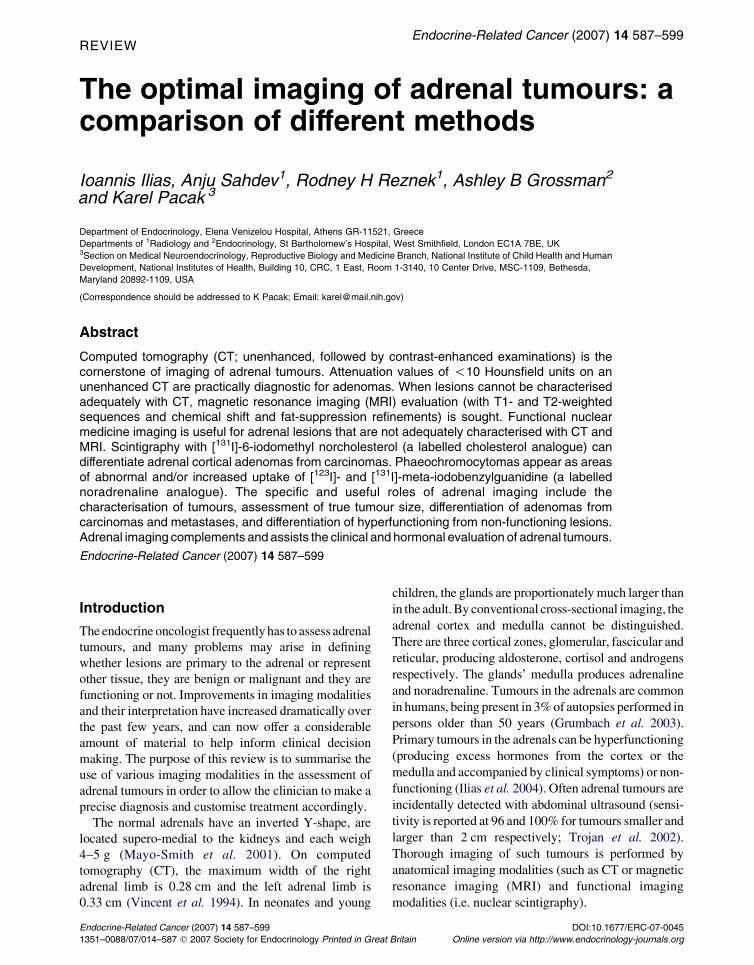
Figure 1 Lipid-rich adenoma. (A) Unenhanced CT of theabdomen showing a left adrenal mass with a HU measurementof K6 HU (arrow). (B) Contrast-enhanced CT acquired 60 safter administration of i.v. contrast shows enhancement of theadrenal mass to 50 HU. (C) On delayed CT, acquired 15 minafter administration of i.v. contrast, the mass measures 15 HU.These measurements provide an absolute contrast enhance-ment washout of 63% and a relative contrast washout of 70%proving a lipid-rich adenoma.
Adrenal adenomas
CT can detect adrenal masses O5 mm in diameter. Of
these, non-functioning adrenocortical adenomas are
the most common. They are usually homogeneous,
round and small, have smooth borders and well-
delineated margins that separate them from adjacent
structures (Thompson & Young 2003). Larger adeno-
mas may distort the body, medial or lateral limbs of the
adrenal. Lipid-rich adenomas have an unenhanced CT
attenuation !10 Hounsfield units (HU; Thompson &
Young 2003; Fig. 1). However, some 25–30% of
adenomas are lipid poor and have unenhanced CT
attenuation values O10 HU (Fig. 2).
www.endocrinology-journals.org588
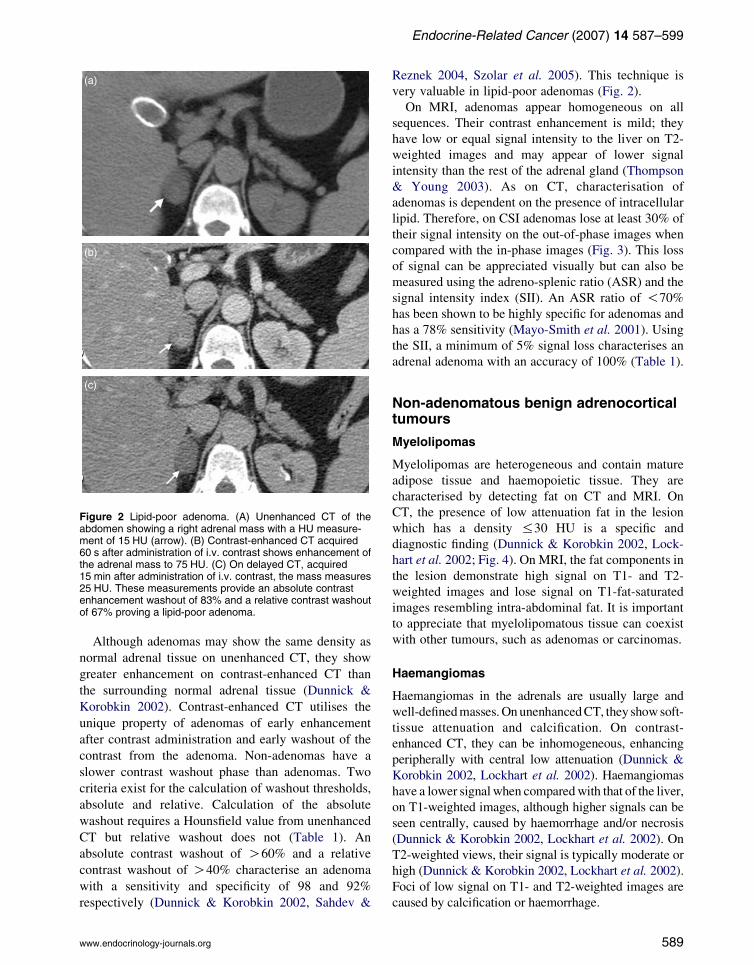
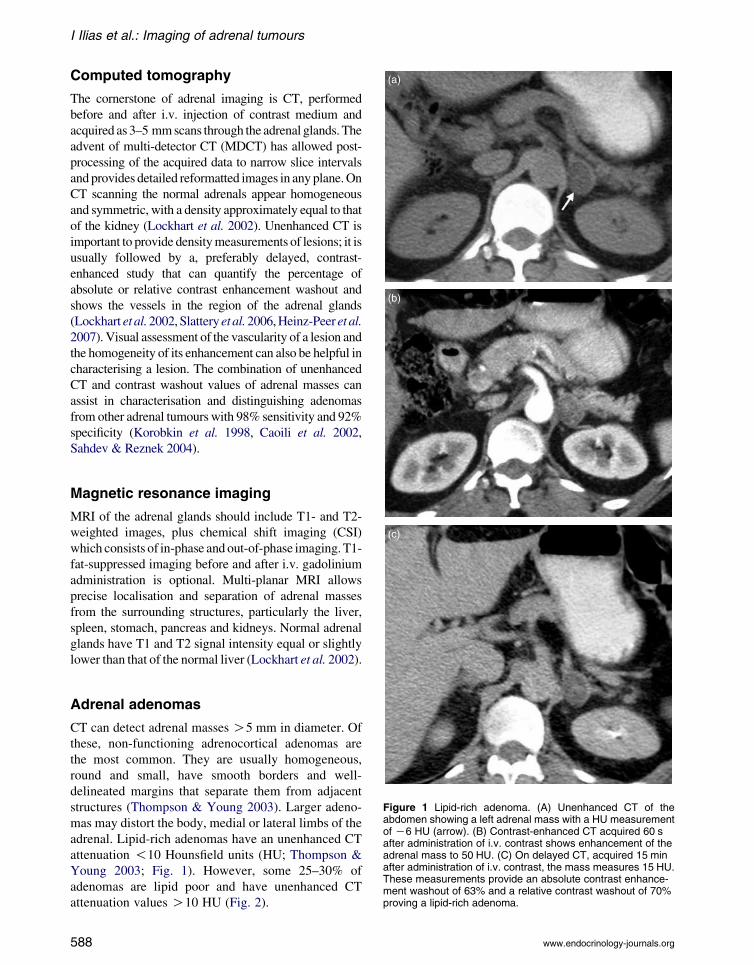
Figure 2 Lipid-poor adenoma. (A) Unenhanced CT of theabdomen showing a right adrenal mass with a HU measure-ment of 15 HU (arrow). (B) Contrast-enhanced CT acquired60 s after administration of i.v. contrast shows enhancement ofthe adrenal mass to 75 HU. (C) On delayed CT, acquired15 min after administration of i.v. contrast, the mass measures25 HU. These measurements provide an absolute contrastenhancement washout of 83% and a relative contrast washoutof 67% proving a lipid-poor adenoma.
Endocrine-Related Cancer (2007) 14 587–599
Although adenomas may show the same density as
normal adrenal tissue on unenhanced CT, they show
greater enhancement on contrast-enhanced CT than
the surrounding normal adrenal tissue (Dunnick &
Korobkin 2002). Contrast-enhanced CT utilises the
unique property of adenomas of early enhancement
after contrast administration and early washout of the
contrast from the adenoma. Non-adenomas have a
slower contrast washout phase than adenomas. Two
criteria exist for the calculation of washout thresholds,
absolute and relative. Calculation of the absolute
washout requires a Hounsfield value from unenhanced
CT but relative washout does not (Table 1). An
absolute contrast washout of O60% and a relative
contrast washout of O40% characterise an adenoma
with a sensitivity and specificity of 98 and 92%
respectively (Dunnick & Korobkin 2002, Sahdev &
www.endocrinology-journals.org
Reznek 2004, Szolar et al. 2005). This technique is
very valuable in lipid-poor adenomas (Fig. 2).
On MRI, adenomas appear homogeneous on all
sequences. Their contrast enhancement is mild; they
have low or equal signal intensity to the liver on T2-
weighted images and may appear of lower signal
intensity than the rest of the adrenal gland (Thompson
& Young 2003). As on CT, characterisation of
adenomas is dependent on the presence of intracellular
lipid. Therefore, on CSI adenomas lose at least 30% of
their signal intensity on the out-of-phase images when
compared with the in-phase images (Fig. 3). This loss
of signal can be appreciated visually but can also be
measured using the adreno-splenic ratio (ASR) and the
signal intensity index (SII). An ASR ratio of !70%
has been shown to be highly specific for adenomas and
has a 78% sensitivity (Mayo-Smith et al. 2001). Using
the SII, a minimum of 5% signal loss characterises an
adrenal adenoma with an accuracy of 100% (Table 1).
Non-adenomatous benign adrenocorticaltumours
Myelolipomas
Myelolipomas are heterogeneous and contain mature
adipose tissue and haemopoietic tissue. They are
characterised by detecting fat on CT and MRI. On
CT, the presence of low attenuation fat in the lesion
which has a density %30 HU is a specific and
diagnostic finding (Dunnick & Korobkin 2002, Lock-
hart et al. 2002; Fig. 4). On MRI, the fat components in
the lesion demonstrate high signal on T1- and T2-
weighted images and lose signal on T1-fat-saturated
images resembling intra-abdominal fat. It is important
to appreciate that myelolipomatous tissue can coexist
with other tumours, such as adenomas or carcinomas.
Haemangiomas
Haemangiomas in the adrenals are usually large and
well-definedmasses.OnunenhancedCT, they showsoft-
tissue attenuation and calcification. On contrast-
enhanced CT, they can be inhomogeneous, enhancing
peripherally with central low attenuation (Dunnick &
Korobkin 2002, Lockhart et al. 2002). Haemangiomas
have a lower signal when comparedwith that of the liver,
on T1-weighted images, although higher signals can be
seen centrally, caused by haemorrhage and/or necrosis
(Dunnick & Korobkin 2002, Lockhart et al. 2002). On
T2-weighted views, their signal is typically moderate or
high (Dunnick & Korobkin 2002, Lockhart et al. 2002).
Foci of low signal on T1- and T2-weighted images are
caused by calcification or haemorrhage.
589
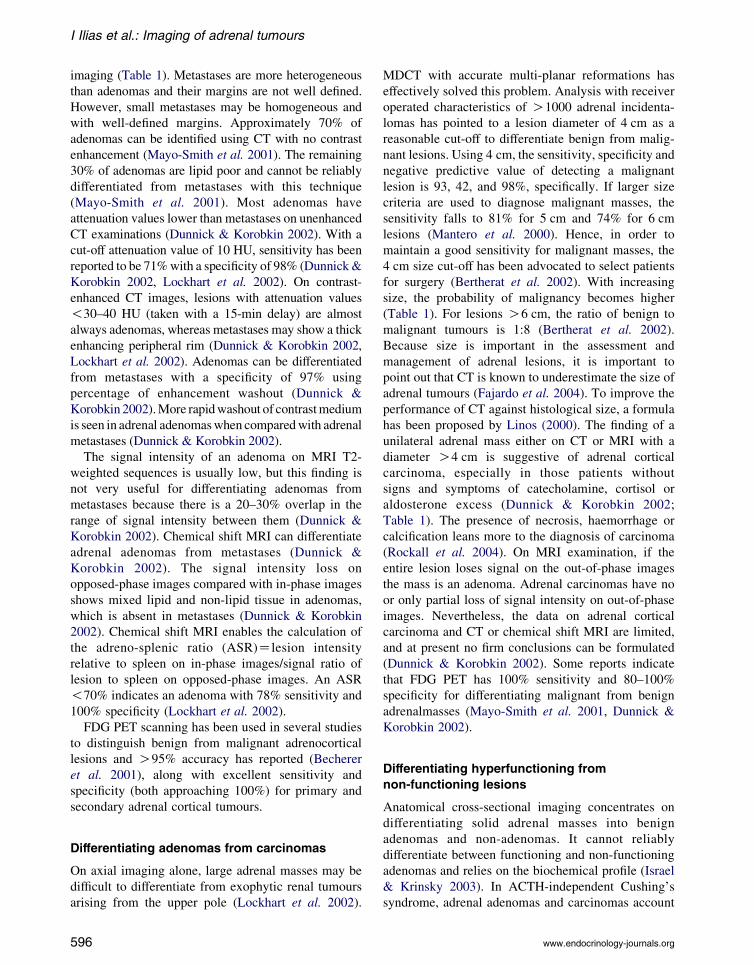
Table 1 Non-specific findings of anatomical imaging that may help in differentiating benign from malignant adrenal masses
(modified in part from Ilias et al. 2004)
Benign mass
Malignant tumour (primary adrenal
carcinoma or metastasis)
Size !4 cm O4 cm
Shape/margins Round/smooth Thick/irregular
Homogeneity CT or MRI Homogeneous Heterogenous
Lipid content High (except lipid-poor adenomas) Low
Growth rate Slow Rapid
CT density !10 HU (lipid-rich adenomas) O10 HU
O10 HU (lipid-poor adenomas)
CT enhancement after contrast administration Early enhancement and early washout Variable enhancement with slow washout
% Absolute enhancement washout (AEW)a O60% !60%
% Relative enhancement washout (REW)b O40% !40%
MRI signal on T2-weighted sequences Low High
CSI signal loss on out-of-phase O30% !30%
Adreno-splenic ratio (ASR)c !70% O70%
Signal intensity index (SII) signal lossd O5% !5%
a% AEWZ100!enhanced attenuation valueKdelayed attenuation value=enhanced attenuation valueKunenhanced attenuationvalue; (Sahdev & Reznek 2004).b% REWZ100!enhanced attenuation valueKdelayed attenuation value=enhanced attenuation value. Enhanced attenuationvalue (HU)Zattenuation value of the mass 60 s post-contrast administration. Delayed attenuation value (HU)Zattenuation value ofthe mass, 15 min post-contrast administration (Sahdev & Reznek 2004).cASRZ100!ðSA=SSÞout � of � phase=ðSA=SSÞin � phase. SAZsignal intensity of the adrenal mass. SSZsignal intensity of thespleen.dSIIZ100!ðSIP adrenalKSOP adrenalÞ=SIP adrenal. SIP adrenalZsignal intensity of adrenal mass on in-phase images. SOP adrenalZsignalintensity of adrenal mass on out-of-phase images.
I Ilias et al.: Imaging of adrenal tumours
Ganglioneuromas
Adrenal ganglioneuromas are benign solid masses that
may be of considerable size (range 4–22 cm). They
have a soft-tissue density less than that of muscle on
unenhanced CT. Contrast-enhanced views can show
them to be homogeneous or mildly heterogeneous
(Dunnick & Korobkin 2002). Ganglioneuromas are
homogeneous and have a lower T1 signal intensity than
liver (Dunnick & Korobkin 2002). On T2-weighted
images, ganglioneuromas show non-specific hetero-
geneity, depending on their content of myxoid stroma;
the more stroma there is the higher is the T2 signal,
while cellular and fibrous components lower the T2
signal intensity (Rha et al. 2003).
Malignant adrenocortical tumours
Adrenal carcinomas
At the time of discovery, the majority of primary adrenal
carcinomas tend to be larger than adenomas, usually
5–10 cm in diameter. Approximately 50% are hyper-
functioning (Lockhart et al. 2002, Thompson & Young
2003). Inmany of these, themargins are irregular and the
contents inhomogeneous with areas of necrosis, haemor-
rhage and calcification (Fig. 5). Nevertheless, smaller
lesions may be homogeneous on unenhanced CT
590
(Lockhart et al. 2002). For carcinomas, the attenuation
on unenhanced studies is higher than 10 HU (Young
2007). On contrast-enhanced studies, carcinomas
enhance avidly due to their vascularity. The pattern of
enhancement canbehomogeneous, unless there is central
necrosis (Dunnick & Korobkin 2002, Lockhart et al.
2002, Young 2007). The relative percentage washout of
carcinomas is !40% (Slattery et al. 2006). On MRI,
adrenal carcinomas are noted for heterogeneity, with
intermediate to high signal intensity, on T1-weighted
images. Heterogeneity is also noted on T2-weighted
images due to haemorrhage and/or necrosis. As with CT,
contrast-enhanced studies enable the assessment of
retroperitoneal lymph nodes, vascular extension and
thrombosis, and encroachment of adrenal and renal veins
or the inferior vena cava (Dunnick & Korobkin 2002).
Angiosarcomas and leiomyosarcomas
Adrenal angiosarcomas and leiomyosarcomas are very
rare tumours. On CT, they have irregular margins and
are inhomogeneous, and calcification may also be
prominent (Pasqual et al. 2002). Leiomyosarcomas and
their imaging characteristics are indistinguishable from
those of adrenal cortical carcinomas or metastatic
cancers (Lee et al. 2006). Leiomyosarcomas show low
intensity on T1-weighted images, high intensity on
www.endocrinology-journals.org
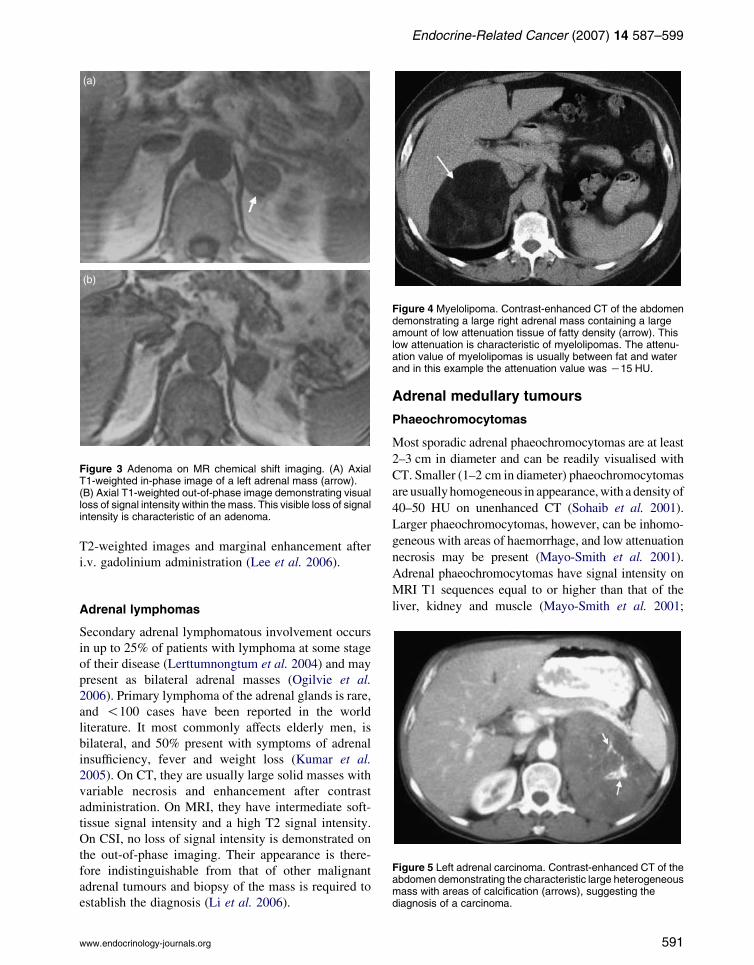
Figure 3 Adenoma on MR chemical shift imaging. (A) AxialT1-weighted in-phase image of a left adrenal mass (arrow).(B) Axial T1-weighted out-of-phase image demonstrating visualloss of signal intensity within the mass. This visible loss of signalintensity is characteristic of an adenoma.
Figure 4 Myelolipoma. Contrast-enhanced CT of the abdomendemonstrating a large right adrenal mass containing a largeamount of low attenuation tissue of fatty density (arrow). Thislow attenuation is characteristic of myelolipomas. The attenu-ation value of myelolipomas is usually between fat and waterand in this example the attenuation value was K15 HU.
Endocrine-Related Cancer (2007) 14 587–599
T2-weighted images and marginal enhancement after
i.v. gadolinium administration (Lee et al. 2006).
Figure 5 Left adrenal carcinoma. Contrast-enhanced CT of theabdomen demonstrating the characteristic large heterogeneousmass with areas of calcification (arrows), suggesting thediagnosis of a carcinoma.
Adrenal lymphomas
Secondary adrenal lymphomatous involvement occurs
in up to 25% of patients with lymphoma at some stage
of their disease (Lerttumnongtum et al. 2004) and may
present as bilateral adrenal masses (Ogilvie et al.
2006). Primary lymphoma of the adrenal glands is rare,
and !100 cases have been reported in the world
literature. It most commonly affects elderly men, is
bilateral, and 50% present with symptoms of adrenal
insufficiency, fever and weight loss (Kumar et al.
2005). On CT, they are usually large solid masses with
variable necrosis and enhancement after contrast
administration. On MRI, they have intermediate soft-
tissue signal intensity and a high T2 signal intensity.
On CSI, no loss of signal intensity is demonstrated on
the out-of-phase imaging. Their appearance is there-
fore indistinguishable from that of other malignant
adrenal tumours and biopsy of the mass is required to
establish the diagnosis (Li et al. 2006).
www.endocrinology-journals.org
Adrenal medullary tumours
Phaeochromocytomas
Most sporadic adrenal phaeochromocytomas are at least
2–3 cm in diameter and can be readily visualised with
CT. Smaller (1–2 cm in diameter) phaeochromocytomas
are usuallyhomogeneous in appearance,with a density of
40–50 HU on unenhanced CT (Sohaib et al. 2001).
Larger phaeochromocytomas, however, can be inhomo-
geneous with areas of haemorrhage, and low attenuation
necrosis may be present (Mayo-Smith et al. 2001).
Adrenal phaeochromocytomas have signal intensity on
MRI T1 sequences equal to or higher than that of the
liver, kidney and muscle (Mayo-Smith et al. 2001;
591
I Ilias et al.: Imaging of adrenal tumours
Fig. 6). Phaeochromocytomas have a higher signal
intensity than that of fat on T2-weighted sequences.
This characteristic finding is due to the hypervascularity
of the tumours. On CSI, there is no signal loss on
opposed-phase images (Mayo-Smith et al. 2001; Fig. 4).
After contrast administration, phaeochromocytomas
enhance avidly and have a prolonged contrast washout
phase. In heterogeneous tumours, the viable areas of the
tumour enhance whilst necrotic areas do not.
Neuroblastomas
Two-thirds of neuroblastomas arise from the adrenals
and occur in infants and children. Most are of irregular
shape, lobulated and are usually unencapsulated with
variable amounts of amorphous or mottled calcification
(Rha et al. 2003). Extension to the liver, adjacent
lymph nodes and vessels is not uncommon. Necrosis
and/or haemorrhage within the tumour leads to an
inhomogeneous appearance on CT. Neuroblastomas in
the adrenals give a heterogeneous low-intensity signal
on T1-weighted sequences and high signal on T2-
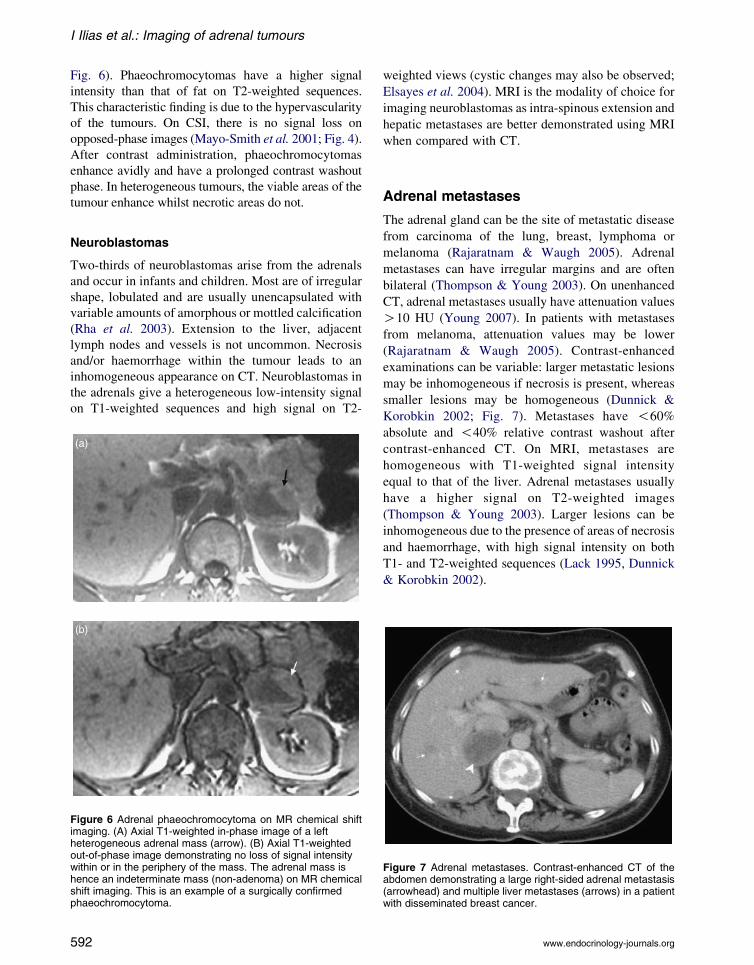
Figure 6 Adrenal phaeochromocytoma on MR chemical shiftimaging. (A) Axial T1-weighted in-phase image of a leftheterogeneous adrenal mass (arrow). (B) Axial T1-weightedout-of-phase image demonstrating no loss of signal intensitywithin or in the periphery of the mass. The adrenal mass ishence an indeterminate mass (non-adenoma) on MR chemicalshift imaging. This is an example of a surgically confirmedphaeochromocytoma.
592
weighted views (cystic changes may also be observed;
Elsayes et al. 2004). MRI is the modality of choice for
imaging neuroblastomas as intra-spinous extension and
hepatic metastases are better demonstrated using MRI
when compared with CT.
Adrenal metastases
The adrenal gland can be the site of metastatic disease
from carcinoma of the lung, breast, lymphoma or
melanoma (Rajaratnam & Waugh 2005). Adrenal
metastases can have irregular margins and are often
bilateral (Thompson & Young 2003). On unenhanced
CT, adrenal metastases usually have attenuation values
O10 HU (Young 2007). In patients with metastases
from melanoma, attenuation values may be lower
(Rajaratnam & Waugh 2005). Contrast-enhanced
examinations can be variable: larger metastatic lesions
may be inhomogeneous if necrosis is present, whereas
smaller lesions may be homogeneous (Dunnick &
Korobkin 2002; Fig. 7). Metastases have !60%
absolute and !40% relative contrast washout after
contrast-enhanced CT. On MRI, metastases are
homogeneous with T1-weighted signal intensity
equal to that of the liver. Adrenal metastases usually
have a higher signal on T2-weighted images
(Thompson & Young 2003). Larger lesions can be
inhomogeneous due to the presence of areas of necrosis
and haemorrhage, with high signal intensity on both
T1- and T2-weighted sequences (Lack 1995, Dunnick
& Korobkin 2002).
Figure 7 Adrenal metastases. Contrast-enhanced CT of theabdomen demonstrating a large right-sided adrenal metastasis(arrowhead) and multiple liver metastases (arrows) in a patientwith disseminated breast cancer.
www.endocrinology-journals.org
Endocrine-Related Cancer (2007) 14 587–599
Functional imaging
Patients that harbour adrenal masses, which are not
adequately characterised with CT orMRI, can be further
evaluated with functional nuclear medicine modalities.
These modalities are based on physiological and
pathophysiological processes (cellular metabolism,
tissue perfusion and local synthesis, uptake and storage
of hormones and their receptors) and assist the
preoperative staging of tumours. Furthermore, they can
be of use in the evaluation of suspicious lesions and the
identification of metastatic or recurrent tumours.
Nuclear medicine modalities that are available for the
study of adrenal disease include conventional planar or
single photon emission computed tomographic (SPECT)
scintigraphy with various radionuclide tracers, and
positron emission tomographic (PET) scintigraphy with
various short-lived radionuclides. With PET, higher
doses of radionuclides can be administered for a similar
radiation exposure to SPECT. Imaging with PET has
higher spatial resolution than conventional SPECT.
Hyperfunctioning adrenal tumours
Functional imaging modalities specific for
cortical tumours
Cholesterol is the basicmolecule for steroid biosynthesis.
[131I]-6-iodomethyl norcholesterol (NP-59) is a radio-
pharmaceutical that resembles cholesterol, binds speci-
fically to low-density lipoproteins, and after receptor-
mediated uptake is stored in the adrenocortical
intracellular lipid droplets. Conventional NP-59 exami-
nations are planar, although recently SPECTwith NP-59
has been assessed (Imperiale et al. 2005). Normal
adrenals are visualised at R5 days after injection of
NP-59 (Mayo-Smith et al. 2001). Unilateral adrenal
uptake seen before day 5 suggests a functioning steroid-
synthesising adenoma (Mayo-Smith et al. 2001), inclu-
ding aldosteronomas (Thompson & Young 2003). The
minimum size of the adrenal mass to be evaluated with
NP-59 isO2 cm. Its practical use is further hampered by
limited availability (Ruffini et al. 1992). [11C]-metomi-
date is a PET ligand with inhibitor properties for the
synthesis of adrenocortical steroids. It has been assessed
in small series of adrenal masses, showing indiscrimi-
nately high uptake in adenomas and carcinomas (the
latter with irregular uptake; Eriksson et al. 2005).
Functional imaging modalities specific for
medullary tumours
Most phaeochromocytomas express the noradrenaline
transport system (NET; Schulz et al. 2004). This
system is responsible for the uptake of noradrenaline
www.endocrinology-journals.org
and adrenaline from the synaptic cleft into sympathetic
presynaptic neurons, terminating neural transmission.
This uptake process also enables specific functional
imaging with various radioligands that depend upon
NET for transport into phaeochromocytoma cells.
The alkylguanidine meta-iodobenzylguanidine
(MIBG) is a noradrenaline analogue that is taken up
by phaeochromocytoma cells. Initially, MIBG was
labelled with [131I] but [123I]-MIBG has become more
common because it permits better quality SPECT
imaging with low radiation exposure. The half-life of
[123I] is much shorter, though, compared with that of
[131I] (13.2 h vs 8 days). Phaeochromocytomas appear
as areas of abnormal increased [131I]- or [123I]-MIBG
uptake (Fujita et al. 2000). For phaeochromocytomas,
scintigraphy with [131I]-MIBG has 77–90% sensitivity
and 95–100% specificity (Bravo & Tagle 2003), while
with [123I]-MIBG it has 83–100% sensitivity and
95–100% specificity (van der Harst et al. 2001).
False-negative MIBG examinations may be caused
by non-compliance not only with instructions to stop
medications that interfere with MIBG uptake but also
occurs with phaeochromocytomas that have undergone
necrosis or dedifferentiation (Figs 8 and 9).
[11C]-metahydroxyephedrine is a positron-emitter-
labelled PET ligand that resembles noradrenaline but is
not susceptible to intracellular degradation by mono-
amine oxidase (MAO). Excellent PET imaging studies
of phaeochromocytomas (better than with [123I]-
MIBG) have been obtained with it (Mann et al.
2006); however, the 20-min half-life of [11C] precludes
widespread application. [11C]-labelled adrenaline is a
PET radioligand that is a substrate for the catechol-
amine catabolic enzymes catechol-O-methyl-
transferase and MAO. PET with [11C]-adrenaline
localises fewer phaeochromocytomas than MIBG
scintigraphy and the very short half-life of [11C] is
again a deterrent to widespread use (Shulkin et al.
1995). Dopamine (DA) labelled with [18F] is substrate
specific for the NET and is an excellent PET agent
(better than [131I]-MIBG) to localise adrenal and extra-
adrenal phaeochromocytoma (Pacak et al. 2001,
Ilias et al. 2003). Dihydroxyphenylalanine (an amino
acid that is converted by aromatic amino acid
decarboxylase to DA) labelled with [18F] has also
been evaluated with success in imaging mainly adrenal
phaeochromocytomas (Hoegerle et al. 2002).
Non-specific functional imaging modalities
[18F]-fluorodeoxyglucose (FDG) is a PET glucose
analogue. It shows the metabolic activity of glucose in
tumours. [18F]-FDG PET studies have not shown
593
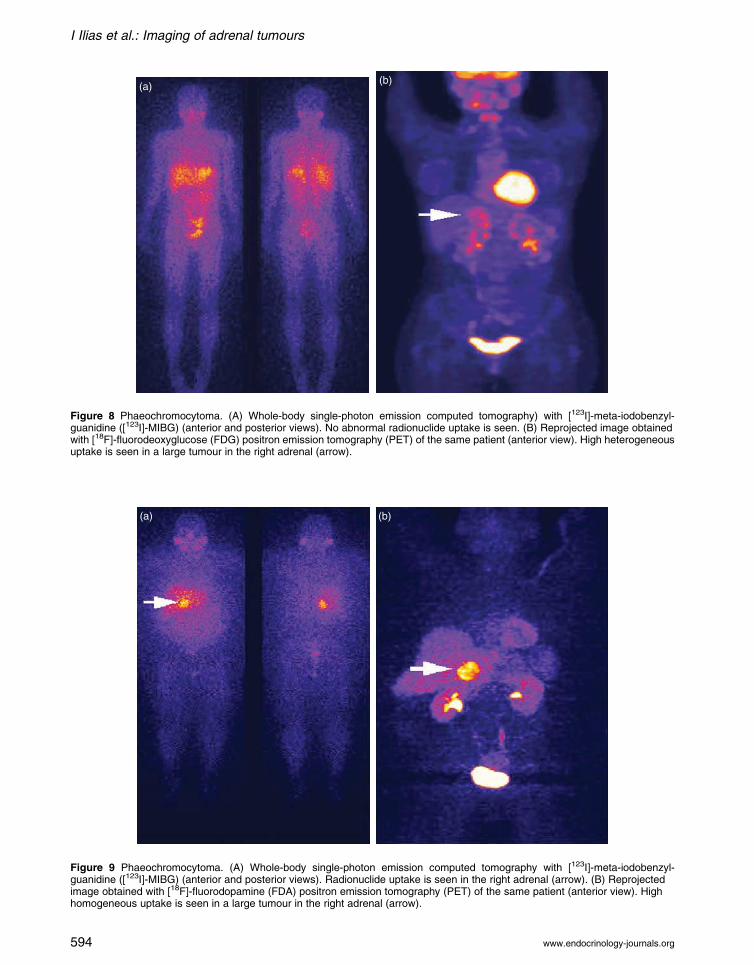
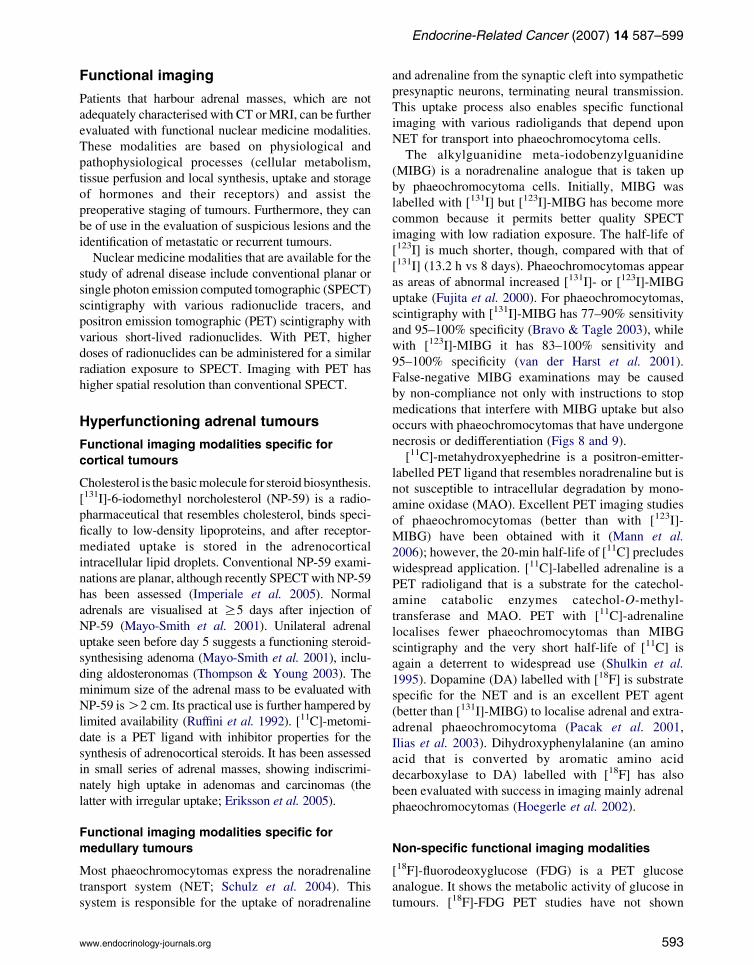
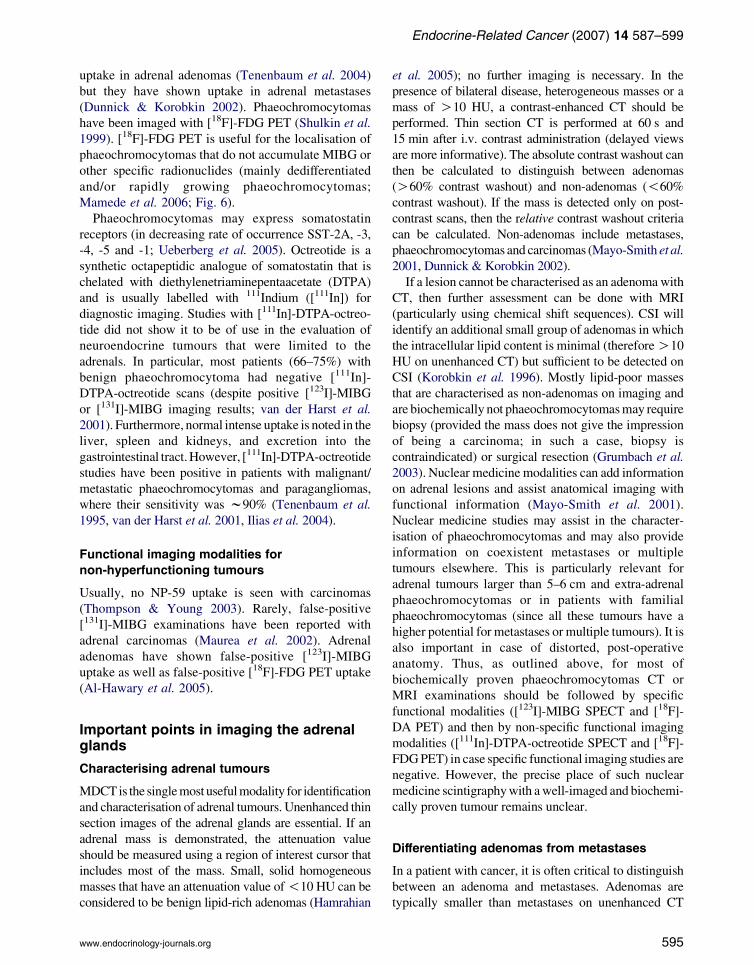
Figure 9 Phaeochromocytoma. (A) Whole-body single-photon emission computed tomography with [123I]-meta-iodobenzyl-guanidine ([123I]-MIBG) (anterior and posterior views). Radionuclide uptake is seen in the right adrenal (arrow). (B) Reprojectedimage obtained with [18F]-fluorodopamine (FDA) positron emission tomography (PET) of the same patient (anterior view). Highhomogeneous uptake is seen in a large tumour in the right adrenal (arrow).
Figure 8 Phaeochromocytoma. (A) Whole-body single-photon emission computed tomography) with [123I]-meta-iodobenzyl-guanidine ([123I]-MIBG) (anterior and posterior views). No abnormal radionuclide uptake is seen. (B) Reprojected image obtainedwith [18F]-fluorodeoxyglucose (FDG) positron emission tomography (PET) of the same patient (anterior view). High heterogeneousuptake is seen in a large tumour in the right adrenal (arrow).
I Ilias et al.: Imaging of adrenal tumours
www.endocrinology-journals.org594
Endocrine-Related Cancer (2007) 14 587–599
uptake in adrenal adenomas (Tenenbaum et al. 2004)
but they have shown uptake in adrenal metastases
(Dunnick & Korobkin 2002). Phaeochromocytomas
have been imaged with [18F]-FDG PET (Shulkin et al.
1999). [18F]-FDG PET is useful for the localisation of
phaeochromocytomas that do not accumulate MIBG or
other specific radionuclides (mainly dedifferentiated
and/or rapidly growing phaeochromocytomas;
Mamede et al. 2006; Fig. 6).
Phaeochromocytomas may express somatostatin
receptors (in decreasing rate of occurrence SST-2A, -3,
-4, -5 and -1; Ueberberg et al. 2005). Octreotide is a
synthetic octapeptidic analogue of somatostatin that is
chelated with diethylenetriaminepentaacetate (DTPA)
and is usually labelled with 111Indium ([111In]) for
diagnostic imaging. Studies with [111In]-DTPA-octreo-
tide did not show it to be of use in the evaluation of
neuroendocrine tumours that were limited to the
adrenals. In particular, most patients (66–75%) with
benign phaeochromocytoma had negative [111In]-
DTPA-octreotide scans (despite positive [123I]-MIBG
or [131I]-MIBG imaging results; van der Harst et al.
2001). Furthermore, normal intense uptake is noted in the
liver, spleen and kidneys, and excretion into the
gastrointestinal tract.However, [111In]-DTPA-octreotide
studies have been positive in patients with malignant/
metastatic phaeochromocytomas and paragangliomas,
where their sensitivity was w90% (Tenenbaum et al.
1995, van der Harst et al. 2001, Ilias et al. 2004).
Functional imaging modalities for
non-hyperfunctioning tumours
Usually, no NP-59 uptake is seen with carcinomas
(Thompson & Young 2003). Rarely, false-positive
[131I]-MIBG examinations have been reported with
adrenal carcinomas (Maurea et al. 2002). Adrenal
adenomas have shown false-positive [123I]-MIBG
uptake as well as false-positive [18F]-FDG PET uptake
(Al-Hawary et al. 2005).
Important points in imaging the adrenalglands
Characterising adrenal tumours
MDCTis the singlemost usefulmodality for identification
and characterisation of adrenal tumours. Unenhanced thin
section images of the adrenal glands are essential. If an
adrenal mass is demonstrated, the attenuation value
should be measured using a region of interest cursor that
includes most of the mass. Small, solid homogeneous
masses that have an attenuation value of!10 HU can be
considered to be benign lipid-rich adenomas (Hamrahian
www.endocrinology-journals.org
et al. 2005); no further imaging is necessary. In the
presence of bilateral disease, heterogeneous masses or a
mass of O10 HU, a contrast-enhanced CT should be
performed. Thin section CT is performed at 60 s and
15 min after i.v. contrast administration (delayed views
are more informative). The absolute contrast washout can
then be calculated to distinguish between adenomas
(O60% contrast washout) and non-adenomas (!60%
contrast washout). If the mass is detected only on post-
contrast scans, then the relative contrast washout criteria
can be calculated. Non-adenomas include metastases,
phaeochromocytomas and carcinomas (Mayo-Smith et al.
2001, Dunnick & Korobkin 2002).
If a lesion cannot be characterised as an adenomawith
CT, then further assessment can be done with MRI
(particularly using chemical shift sequences). CSI will
identify an additional small group of adenomas in which
the intracellular lipid content is minimal (thereforeO10
HU on unenhanced CT) but sufficient to be detected on
CSI (Korobkin et al. 1996). Mostly lipid-poor masses
that are characterised as non-adenomas on imaging and
are biochemically not phaeochromocytomasmay require
biopsy (provided the mass does not give the impression
of being a carcinoma; in such a case, biopsy is
contraindicated) or surgical resection (Grumbach et al.
2003). Nuclear medicine modalities can add information
on adrenal lesions and assist anatomical imaging with
functional information (Mayo-Smith et al. 2001).
Nuclear medicine studies may assist in the character-
isation of phaeochromocytomas and may also provide
information on coexistent metastases or multiple
tumours elsewhere. This is particularly relevant for
adrenal tumours larger than 5–6 cm and extra-adrenal
phaeochromocytomas or in patients with familial
phaeochromocytomas (since all these tumours have a
higher potential for metastases or multiple tumours). It is
also important in case of distorted, post-operative
anatomy. Thus, as outlined above, for most of
biochemically proven phaeochromocytomas CT or
MRI examinations should be followed by specific
functional modalities ([123I]-MIBG SPECT and [18F]-
DA PET) and then by non-specific functional imaging
modalities ([111In]-DTPA-octreotide SPECT and [18F]-
FDGPET) in case specific functional imaging studies are
negative. However, the precise place of such nuclear
medicine scintigraphywith awell-imaged and biochemi-
cally proven tumour remains unclear.
Differentiating adenomas from metastases
In a patient with cancer, it is often critical to distinguish
between an adenoma and metastases. Adenomas are
typically smaller than metastases on unenhanced CT
595
I Ilias et al.: Imaging of adrenal tumours
imaging (Table 1). Metastases are more heterogeneous
than adenomas and their margins are not well defined.
However, small metastases may be homogeneous and
with well-defined margins. Approximately 70% of
adenomas can be identified using CT with no contrast
enhancement (Mayo-Smith et al. 2001). The remaining
30% of adenomas are lipid poor and cannot be reliably
differentiated from metastases with this technique
(Mayo-Smith et al. 2001). Most adenomas have
attenuation values lower than metastases on unenhanced
CT examinations (Dunnick & Korobkin 2002). With a
cut-off attenuation value of 10 HU, sensitivity has been
reported to be 71%with a specificity of 98% (Dunnick&
Korobkin 2002, Lockhart et al. 2002). On contrast-
enhanced CT images, lesions with attenuation values
!30–40 HU (taken with a 15-min delay) are almost
always adenomas, whereas metastases may show a thick
enhancing peripheral rim (Dunnick & Korobkin 2002,
Lockhart et al. 2002). Adenomas can be differentiated
from metastases with a specificity of 97% using
percentage of enhancement washout (Dunnick &
Korobkin2002).More rapidwashout of contrastmedium
is seen in adrenal adenomaswhen comparedwith adrenal
metastases (Dunnick & Korobkin 2002).
The signal intensity of an adenoma on MRI T2-
weighted sequences is usually low, but this finding is
not very useful for differentiating adenomas from
metastases because there is a 20–30% overlap in the
range of signal intensity between them (Dunnick &
Korobkin 2002). Chemical shift MRI can differentiate
adrenal adenomas from metastases (Dunnick &
Korobkin 2002). The signal intensity loss on
opposed-phase images compared with in-phase images
shows mixed lipid and non-lipid tissue in adenomas,
which is absent in metastases (Dunnick & Korobkin
2002). Chemical shift MRI enables the calculation of
the adreno-splenic ratio (ASR)Zlesion intensity
relative to spleen on in-phase images/signal ratio of
lesion to spleen on opposed-phase images. An ASR
!70% indicates an adenoma with 78% sensitivity and
100% specificity (Lockhart et al. 2002).
FDG PET scanning has been used in several studies
to distinguish benign from malignant adrenocortical
lesions and O95% accuracy has reported (Becherer
et al. 2001), along with excellent sensitivity and
specificity (both approaching 100%) for primary and
secondary adrenal cortical tumours.
Differentiating adenomas from carcinomas
On axial imaging alone, large adrenal masses may be
difficult to differentiate from exophytic renal tumours
arising from the upper pole (Lockhart et al. 2002).
596
MDCT with accurate multi-planar reformations has
effectively solved this problem. Analysis with receiver
operated characteristics of O1000 adrenal incidenta-
lomas has pointed to a lesion diameter of 4 cm as a
reasonable cut-off to differentiate benign from malig-
nant lesions. Using 4 cm, the sensitivity, specificity and
negative predictive value of detecting a malignant
lesion is 93, 42, and 98%, specifically. If larger size
criteria are used to diagnose malignant masses, the
sensitivity falls to 81% for 5 cm and 74% for 6 cm
lesions (Mantero et al. 2000). Hence, in order to
maintain a good sensitivity for malignant masses, the
4 cm size cut-off has been advocated to select patients
for surgery (Bertherat et al. 2002). With increasing
size, the probability of malignancy becomes higher
(Table 1). For lesions O6 cm, the ratio of benign to
malignant tumours is 1:8 (Bertherat et al. 2002).
Because size is important in the assessment and
management of adrenal lesions, it is important to
point out that CT is known to underestimate the size of
adrenal tumours (Fajardo et al. 2004). To improve the
performance of CT against histological size, a formula
has been proposed by Linos (2000). The finding of a
unilateral adrenal mass either on CT or MRI with a
diameter O4 cm is suggestive of adrenal cortical
carcinoma, especially in those patients without
signs and symptoms of catecholamine, cortisol or
aldosterone excess (Dunnick & Korobkin 2002;
Table 1). The presence of necrosis, haemorrhage or
calcification leans more to the diagnosis of carcinoma
(Rockall et al. 2004). On MRI examination, if the
entire lesion loses signal on the out-of-phase images
the mass is an adenoma. Adrenal carcinomas have no
or only partial loss of signal intensity on out-of-phase
images. Nevertheless, the data on adrenal cortical
carcinoma and CT or chemical shift MRI are limited,
and at present no firm conclusions can be formulated
(Dunnick & Korobkin 2002). Some reports indicate
that FDG PET has 100% sensitivity and 80–100%
specificity for differentiating malignant from benign
adrenalmasses (Mayo-Smith et al. 2001, Dunnick &
Korobkin 2002).
Differentiating hyperfunctioning from
non-functioning lesions
Anatomical cross-sectional imaging concentrates on
differentiating solid adrenal masses into benign
adenomas and non-adenomas. It cannot reliably
differentiate between functioning and non-functioning
adenomas and relies on the biochemical profile (Israel
& Krinsky 2003). In ACTH-independent Cushing’s
syndrome, adrenal adenomas and carcinomas account
www.endocrinology-journals.org
Endocrine-Related Cancer (2007) 14 587–599
for 92% of the cases. Other rare causes included
collision tumours with adenomas and primary
pigmented nodular adrenal dysplasia (PPNAD). In
PPNAD, uni- or bilateral small (2–5 mm) adrenal
nodules have been reported (Rockall et al. 2004).
There have also been reports of normal CT scans and a
report of myeloid metaplasia of the nodules (with very
high lipid content; Courcoutsakis et al. 2004). Older
subjects with PPNADmay have macronodulesO1 cm.
In 70% of patients with ACTH-dependent Cushing’s
disease, the adrenal glands are enlarged bilaterally. The
adrenal glands are larger in patients with ectopic
ACTH source when compared with pituitary-depen-
dent disease (Sohaib et al. 1999). Cortical hyperplasia
can be distinguished from focal tumours with
sensitivity O95% using CT. In a study of 34 patients
with primary hyperaldosteronism (17 due to bilateral
adrenal hyperplasia and 17 due to adenomas), CT was
shown to detect aldosteronomas with a sensitivity and
specificity of 87 and 93% respectively (Lingam et al.
2004). In patients with aldosteronomas, the adrenal
glands may be normal, show minimal unilateral
adrenal thickening, uni- or bilateral solitary or multiple
adenomas (ranging in size from !1 to O1 cm; Young
2003). Nevertheless, most aldosteronomas are uni-
lateral and small (with a median size!2 cm). Usually,
they are encapsulated and the remaining adrenal cortex
does not show any atrophy. However, some have
recommended that, regardless of CT/MRI findings,
when localisation of a putative aldosteronoma is
attempted all patients should undergo selective adrenal
venous sampling (pre- and post-corticotrophin infu-
sion) to precisely locate the tumour (Rossi 2007).
Non-hyperfunctioning adenomas of the adrenal cortex
synthesise and secrete hormones like normal adrenal
cortical tissue. These lesions show uptake of NP-59, but
so does the surrounding normal adrenal tissue (Dunnick
& Korobkin 2002). NP-59 scintigraphy can complement
biochemical and radiological imaging results to identify
abnormal adrenal function in an adenoma (Maurea et al.
2004). It has a high specificity (100%) and reasonable
sensitivity (about 70% for tumours O2 cm in diameter)
for distinguishing benign functioning adrenal adenomas
from other space-occupying adrenal lesions (Maurea et
al. 2004).The positive predictive value ofNP-59 is 100%
for lesions R2 cm in diameter. Nevertheless, well-
differentiated adrenal cancer may show NP-59 uptake
(Gross et al. 2007). Moreover, the scarcity of NP-59, its
limited spatial resolution and the prolonged necessary
examination time, in light of the results obtained with
other modalities, may lead to its eventual abandonment.
Because 40–50% of primary adrenal carcinomas are
hyperfunctioning and 50–60% are not, it is apparent that
www.endocrinology-journals.org
further biochemical diagnostic work-up is necessary in
cases of doubtful diagnosis (Lockhart et al. 2002).
Acknowledgements
The authors declare that there is no conflict of interest
that would prejudice the impartiality of this scientific
work.
References
Al-Hawary MM, Francis IR & Korobkin M 2005 Non-
invasive evaluation of the incidentally detected indeter-
minate adrenal mass. Tumour Biology 19 277–292.
Becherer A, Vierhapper H, Potzi C, Karanikas G, Kurtaran A,
Schmaljohann J, Staudenherz A, Dudczak R & Kletter K
2001 FDG-PET in adrenocortical carcinoma. Cancer
Biotherapy and Radiopharmaceuticals 16 289–295.
Bertherat J, Mosnier-Pudar H & Bertagna X 2002 Adrenal
incidentalomas. Current Opinion in Oncology 14 58–63.
Bravo EL & Tagle R 2003 Pheochromocytoma: state-of-the-
art and future prospects. Endocrine Reviews 24 539–553.
Caoili EM, Korobkin M, Francis IR, Cohan RH, Platt JF,
Dunnick NR & Raghupathi KI 2002 Adrenal masses:
characterization with combined unenhanced and delayed
enhanced CT. Radiology 222 629–633.
CourcoutsakisNA,PatronasNJ,CassarinoD,GriffinK,KeilM,
Ross JL, Carney JA & Stratakis CA 2004 Hypodense
nodularity on computed tomography: novel imaging and
pathology of micronodular adrenocortical hyperplasia
associated with myelolipomatous changes. Journal of
Clinical Endocrinology and Metabolism 89 3737–3738.
Dunnick NR & Korobkin M 2002 Imaging of adrenal
incidentalomas: current status. American Journal of
Roentgenology 179 559–568.
Elsayes KM, Mukundan G, Narra VR, Lewis JS, Shirkhoda A,
Farooki A & Brown JJ 2004 Adrenal masses: MR imaging
features with pathologic correlation. Radiographics 24
S73–S86.
Eriksson B, Orlefors H, Oberg K, Sundin A, Bergstrom M &
Langstrom B 2005 Developments in PET for the detection
of endocrine tumours. Tumour Biology 19 311–324.
Fajardo R, Montalvo J, Velazquez D, Arch J, Bezaury P,
Gamino R & Herrera MF 2004 Correlation between
radiologic and pathologic dimensions of adrenal masses.
World Journal of Surgery 28 494–497.
Fujita A, Hyodoh H, Kawamura Y, Kanegae K, Furuse M &
Kanazawa K 2000 Use of fusion images of I-131
metaiodobenzylguanidine, SPECT and magnetic reso-
nance studies to identify a malignant pheochromocytoma.
Clinical Nuclear Medicine 25 440–442.
Gross MD, Avram A, Fig LM & Rubello D 2007
Contemporary adrenal scintigraphy. European Journal of
Nuclear Medicine and Molecular Imaging 34 547–557.
Grumbach MM, Biller BM, Braunstein GD, Campbell KK,
Carney JA, Godley PA, Harris EL, Lee JK, Oertel YC,
597
I Ilias et al.: Imaging of adrenal tumours
Posner MC et al. 2003 Management of the clinically
inapparent adrenal mass (‘incidentaloma’). Annals of
Internal Medicine 138 424–429.
Hamrahian AH, Ioachimescu AG, Remer EM, Motta-
Ramirez G, Bogabathina H, Levin HS, Reddy S, Gill IS,
Siperstein A & Bravo EL 2005 Clinical utility of
noncontrast computed tomography attenuation value
(hounsfield units) to differentiate adrenal adenomas/
hyperplasias from nonadenomas: cleveland clinic
experience. Journal of Clinical Endocrinology and
Metabolism 90 871–877.
van der Harst E, de Herder WW, Bruining HA, Bonjer HJ, de
Krijger RR, Lamberts SW, van de Meiracker AH,
Boomsma F, Stijnen T, Krenning EP et al. 2001
[(123)I]metaiodobenzylguanidine and [(111)In]octreotide
uptake in begnign and malignant pheochromocytomas.
Journal of Clinical Endocrinology and Metabolism 86
685–693.
Heinz-Peer G, Memarsadeghi M & Niederle B 2007 Imaging
of adrenal masses. Current Opinion in Urology 17 32–38.
Hoegerle S, Nitzsche E, Altehoefer C, Ghanem N, Manz T,
Brink I, Reincke M, Moser E & Neumann HP 2002
Pheochromocytomas: detection with 18F DOPA whole
body PET – initial results. Radiology 222 507–512.
Ilias I, Yu J, Carrasquillo J, Chen C, Eisenhofer G, Whatley
M, McElroy M & Pacak K 2003 Superiority of 6-[18F]-
fluorodopamine positron emission tomography versus
[131I]-metaiodobenzylguanidine scintigraphy in the
localization of metastatic pheochromocytoma. Journal of
Clinical Endocrinology and Metabolism 88 4083–4087.
Ilias I, Alesci A & Pacak K 2004 Current views on imaging of
adrenal tumours. Hormone and Metabolic Research 36
430–435.
Imperiale A, Olianti C, Mannelli M, La Cava G & Pupi A
2005 Tomographic evaluation of [131I] 6beta-iodo-
methyl-norcholesterol standardised uptake trend in clini-
cally silent monolateral and bilateral adrenocortical
incidentalomas. Quarterly Journal of Nuclear Medicine
and Molecular Imaging 49 287–296.
Israel GM & Krinsky GA 2003 MR imaging of the kidneys
and adrenal glands. Endocrinology and Metabolism
Clinics of North America 41 145–159.
Korobkin M, Giordano TJ, Brodeur FJ, Francis IR, Siegel-
man ES, Quint LE, Dunnick NR, Heiken JP & Wang HH
1996 Adrenal adenomas: relationship between histologic
lipid and CT and MR findings. Radiology 200 743–747.
Korobkin M, Brodeur FJ, Francis IR, Quint LE, Dunnick NR
& Londy F 1998 CT time-attenuation washout curves of
adrenal adenomas and nonadenomas. American
Journal of Roentgenology 170 747–752.
Kumar R, Xiu Y, Mavi A, El-Haddad G, Zhuang H & Alavi
A 2005 FDG-PET imaging in primary bilateral adrenal
lymphoma: a case report and review of the literature.
Clinical Nuclear Medicine 30 222–230.
Lack EE 1995 Tumours metastatic to adrenal glands Tumours
of the Adrenal Gland and Extra-adrenal Paraganglia.
Washington, DC: Armed Forces Institute of Pathology.
598
Lee CW, Tsang YM & Liu KL 2006 Primary adrenal
leiomyosarcoma. Abdominal Imaging 31 123–124.
Lerttumnongtum P, Muttarak M, Visrutaratna P & Ya-In C
2004 Imaging features of unusual adrenal masses.
Australasian Radiology 48 107–113.
Li Y, Sun H, Gao S & Bai R 2006 Primary bilateral adrenal
lymphoma: 2 case reports. Journal of Computer Assisted
Tomography 30 791–793.
Lingam RK, Sohaib SA, Rockall AG, Isidori AM, Chew S,
Monson JP, Grossman A, Besser GM & Reznek RH 2004
Diagnostic performance of CT versus MR in detecting
aldosterone-producing adenoma in primary hyperaldos-
teronism (Conn’s syndrome). European Radiology 14
1787–1792.
Linos DA 2000 Management approaches to adrenal
incidentalomas (adrenalomas) a view from Athens,
Greece. Endocrinology and Metabolism Clinics of North
America 29 141–157.
Lockhart ME, Smith JK&Kenney PJ 2002 Imaging of adrenal
masses. European Journal of Radiology 41 95–112.
Mamede M, Carrasquillo JA, Chen CC, Del Corral P,
Whatley M, Ilias I, Ayala A & Pacak K 2006 Discordant
localization of 2-[18F]-fluoro-2-deoxy-D-glucose in 6-
[18F]-fluorodopamine- and [(123)I]-metaiodobenzylgua-
nidine-negative metastatic pheochromocytoma sites.
Nuclear Medicine Communications 27 31–36.
Mann GN, Link JM, Pham P, Pickett CA, Byrd DR, Kinahan
PE, Krohn KA & Mankoff DA 2006 [(11)C]metahy-
droxyephedrine and [(18)f]fluorodeoxyglucose positron
emission tomography improve clinical decision making in
suspected pheochromocytoma. Annals of Surgical
Oncology 13 187–197.
Mantero F, TerzoloM,Arnaldi G,OsellaG,Masini AM,Ali A,
Giovagnetti M, Opocher G & Angeli A 2000 A survey on
adrenal incidentaloma in Italy Study Group on Adrenal
Tumours of the Italian Society of Endocrinology. Journal of
Clinical Endocrinology and Metabolism 85 637–644.
Maurea S, Klain M, Caraco C, Ziviello M& Salvatore M 2002
Diagnostic accuracy of radionuclide imaging using 131I
nor-cholesterol or meta-iodobenzylguanidine in patients
with hypersecreting or non-hypersecreting adrenal tumours.
Nuclear Medicine Communications 23 951–960.
Maurea S, Caraco C, Klain M, Mainolfi C & Salvatore M
2004 Imaging characterization of non-hypersecreting
adrenal masses comparison between MR and radionuclide
techniques. Quarterly Journal of Nuclear Medicine and
Molecular Imaging 48 188–197.
Mayo-SmithWW,BolandGW,NotoRB&LeeMJ2001State-
of-the-art adrenal imaging. Radiographics 21 995–1012.
Ogilvie CM, Payne S, Evanson J, Lister TA & Grossman AB
2006 Lymphoma metastasizing to the pituitary: an
unusual presentation of a treatable disease. Pituitary 8
139–146.
Pacak K, Eisenhofer G, Carrasquillo JA, Chen CC, Li ST &
Goldstein DS 2001 6-[18F]fluorodopamine positron
emission tomographic (PET) scanning for diagnostic
localization of pheochromocytoma. Hypertension 38 6–8.
www.endocrinology-journals.org
Endocrine-Related Cancer (2007) 14 587–599
Pasqual E, Bertolissi F, Grimaldi F, Beltrami CA, Scott
CA, Bacchetti S, Waclaw BU & Cagol PP 2002
Adrenal angiosarcoma: report of a case. Surgery
Today 32 563–565.
Rajaratnam A & Waugh J 2005 Adrenal metastases of
malignant melanoma: characteristic computed
tomography appearances. Australasian Radiology 49
325–329.
Rha SE, Byun JY, Jung SE, Chun HJ, Lee HG & Lee
JM 2003 Neurogenic tumours in the abdomen: tumour
types and imaging characteristics. Radiographics 23
29–43.
Rockall AG, Babar SA, Sohaib SA, Isidori AM, Diaz-Cano S,
Monson JP, Grossman AB & Reznek RH 2004 CT and
MR imaging of the adrenal glands in ACTH-independent
Cushing syndrome. Radiographics 24 435–452.
Rossi GP 2007 New concepts in adrenal vein sampling for
aldosterone in the diagnosis of primary aldosteronism.
Current Hypertension Reports 9 90–97.
Ruffini V, Saletnich I & Troncone L 1992 Radiocholesterol
scintigraphy in Cushing’s syndrome. Rays 17 40–48.
Sahdev A & Reznek RH 2004 Imaging evaluation of the non-
functioning indeterminate adrenal mass. Trends in
Endocrinology and Metabolism 15 271–276.
Schulz C, Eisenhofer G & Lehnert H 2004 Principles of
Catecholamine Biosynthesis, Metabolism and Release.
Frontiers of Hormone Research 31 1–2.
Shulkin BL, Wienland DM, Shapiro B & Sisson JC 1995 PET
epinephrine studies of pheochromocytoma. Journal of
Nuclear Medicine 36 229P.
Shulkin BL, Thompson NW, Shapiro B, Francis IR &
Sisson JC 1999 Pheochromocytomas: imaging with 2-
[fluorine-18]fluoro-2-deoxy-D-glucose PET. Radiology
212 35–41.
Slattery JM, Blake MA, Kalra MK, Misdraji J, Sweeney AT,
Copeland PM, Mueller PR & Boland GW 2006
Adrenocortical carcinoma: contrast washout charac-
teristics on CT. American Journal of Roentgenology 187
W21–W24.
Sohaib SA, Hanson JA, Newell-Price JD, Trainer PJ, Monson
JP, Grossman AB, Besser GM & Reznek RH 1999 CT
Appearance of the adrenal glands in adrenocorticotrophic
hormone-dependent Cushing’s syndrome. American
Journal of Roentgenology 172 997–1002.
www.endocrinology-journals.org
Sohaib SAA, Bomanji J, Evanson J & Reznek RH 2001
Imaging of the endocrine system. Grainger & Allison’s
Diagnostic Radiology – A Textbook of Medical Imaging,
pp 1367–1399. Eds RG Grainger, DJ Allison, A Adam &
AK Dixon., 5 London: Churchill Livingstone.
Szolar DH, Korobkin M, Reittner P, Berghold A, Bauern-
hofer T, Trummer H, Schoellnast H, Preidler KW &
Samonigg H 2005 Adrenocortical carcinomas and adrenal
pheochromocytomas: mass and enhancement loss evalu-
ation at delayed contrast-enhanced CT. Radiology 234
479–485.
Tenenbaum F, Lumbroso J, Schlumberger M, Mure A, Plouin
PF, Caillou B & Parmentier C 1995 Comparison of
radiolabeled octreotide and meta-iodobenzylguanidine
(MIBG) scintigraphy in malignant pheochromocytoma.
Journal of Nuclear Medicine 36 1–6.
Tenenbaum F, Groussin L, Foehrenbach H, Tissier F,
Gouya H, Bertherat J, Dousset B, Legmann P,
Richard B & Bertagna X 2004 18F-fluorodeoxyglu-
cose positron emission tomography as a diagnostic
tool for malignancy of adrenocortical tumours?
Preliminary results in 13 consecutive patients
European Journal of Endocrinology 150 789–792.
Thompson GB & Young WF Jr 2003 Adrenal incidentaloma.
Current Opinion in Oncology 15 84–90.
Trojan J, Schwarz W, Sarrazin C, Thalhammer A, Vogl TJ &
Dietrich CF 2002 Role of ultrasonography in the detection
of small adrenal masses. Ultraschall in der Medizin 23
96–100.
Ueberberg B, Tourne H, Redman A, Walz MK, Schmid
KW, Mann K & Petersenn S 2005 Differential
expression of the human somatostatin receptor
subtypes sst1 to sst5 in various adrenal tumours and
normal adrenal gland. Hormone and Metabolic
Research 37 722–728.
Vincent JM, Morrison ID, Armstrong P & Reznek RH 1994
The size of normal adrenal glands on computed
tomography. Clinical Radiology 49 453–455 (Erratum
Clin Radiol Vol. 50 (1995) 202).
Young WF Jr 2003 Primary aldosteronism–changing con-
cepts in diagnosis and treatment. Endocrinology 144
2208–2213.
YoungWF Jr 2007 The incidentally discovered adrenal mass.
New England Journal of Medicine 356 601–610.
599