Embed Size (px)
Citation preview
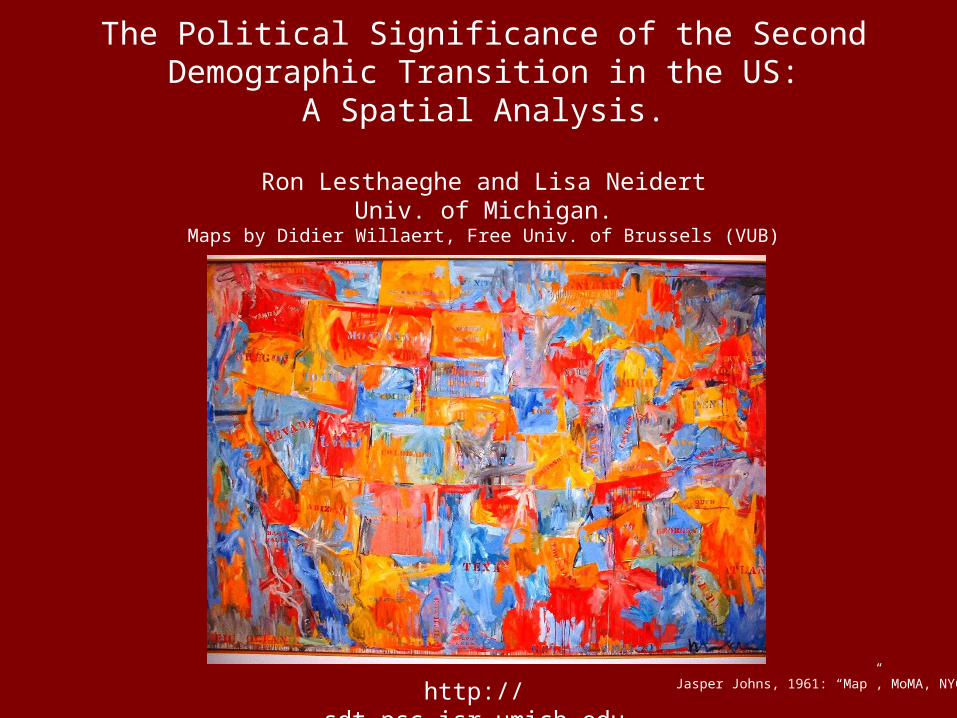
The Political Significance of the Second Demographic Transition in the US:A Spatial Analysis.
Ron Lesthaeghe and Lisa NeidertUniv. of Michigan.
Maps by Didier Willaert, Free Univ. of Brussels (VUB)
http://sdt.psc.isr.umich.edu Jasper Johns, 1961: “Map”, MoMA, NYC.
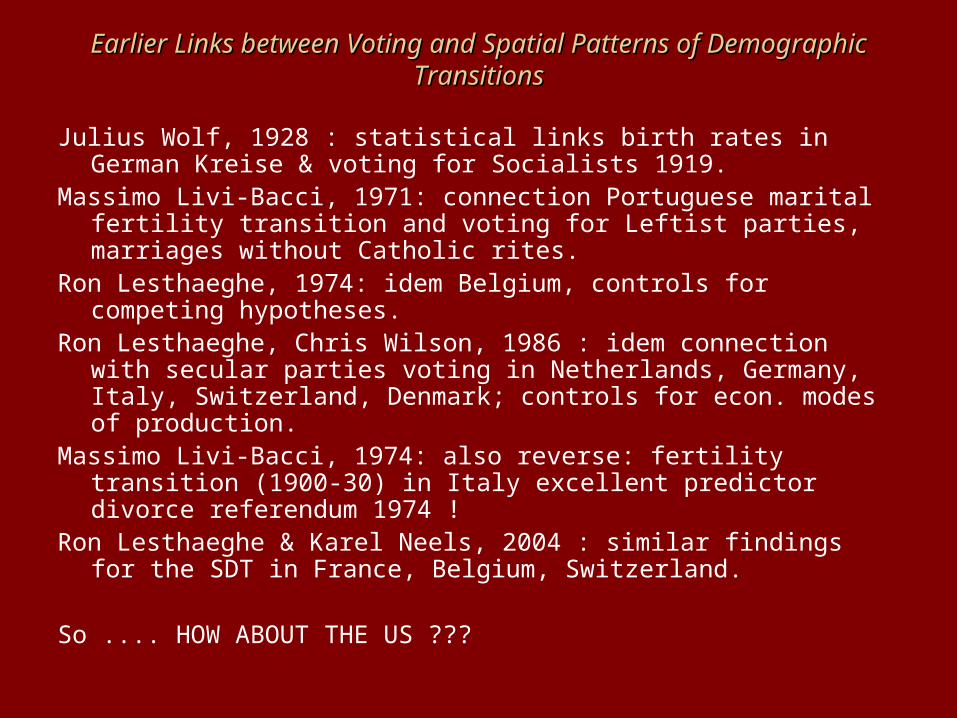
Earlier Links between Voting and Spatial Patterns of Demographic Earlier Links between Voting and Spatial Patterns of Demographic TransitionsTransitions
Julius Wolf, 1928 : statistical links birth rates in German Kreise & voting for Socialists 1919.
Massimo Livi-Bacci, 1971: connection Portuguese marital fertility transition and voting for Leftist parties, marriages without Catholic rites.
Ron Lesthaeghe, 1974: idem Belgium, controls for competing hypotheses.
Ron Lesthaeghe, Chris Wilson, 1986 : idem connection with secular parties voting in Netherlands, Germany, Italy, Switzerland, Denmark; controls for econ. modes of production.
Massimo Livi-Bacci, 1974: also reverse: fertility transition (1900-30) in Italy excellent predictor divorce referendum 1974 !
Ron Lesthaeghe & Karel Neels, 2004 : similar findings for the SDT in France, Belgium, Switzerland.
So .... HOW ABOUT THE US ???
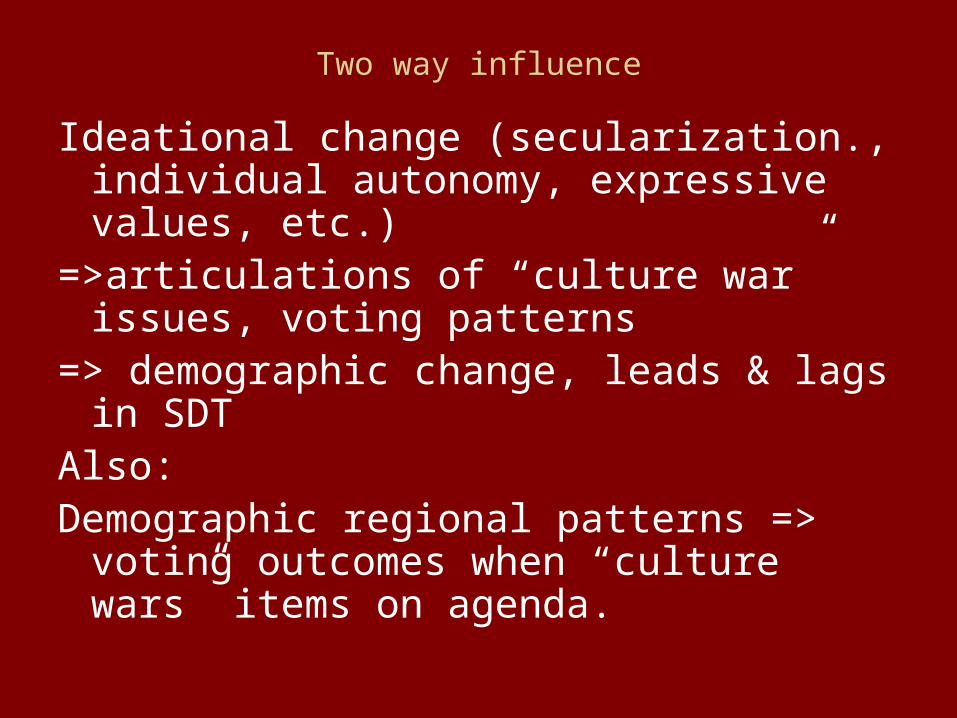
Two way influence
Ideational change (secularization., individual autonomy, expressive values, etc.)
=>articulations of “culture war” issues, voting patterns
=> demographic change, leads & lags in SDT
Also:Demographic regional patterns => voting
outcomes when “culture wars” items on agenda.
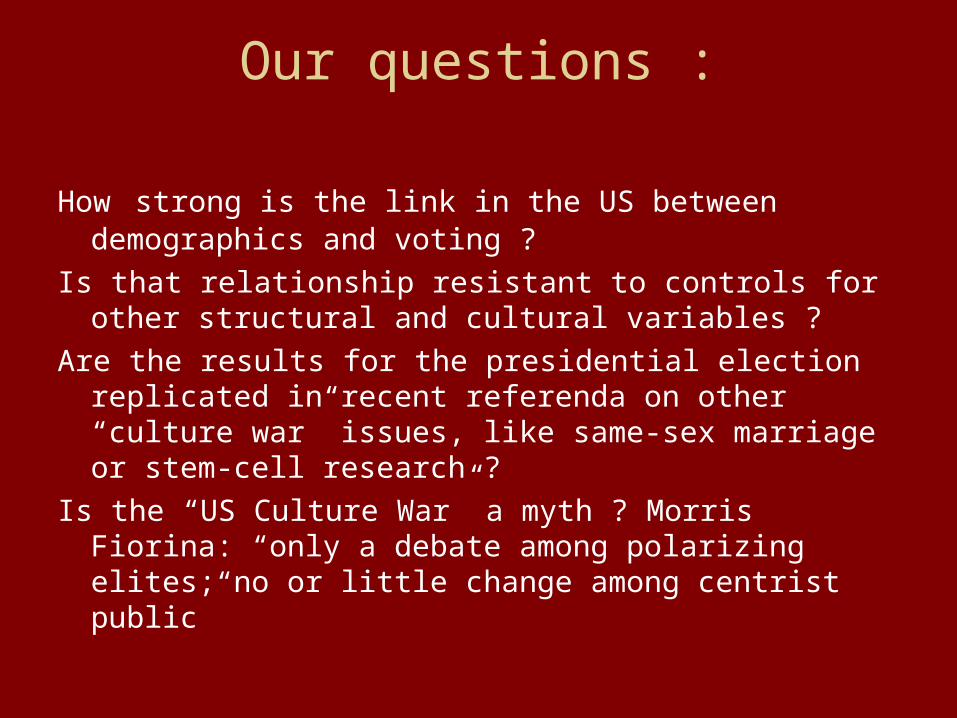
Our questions :
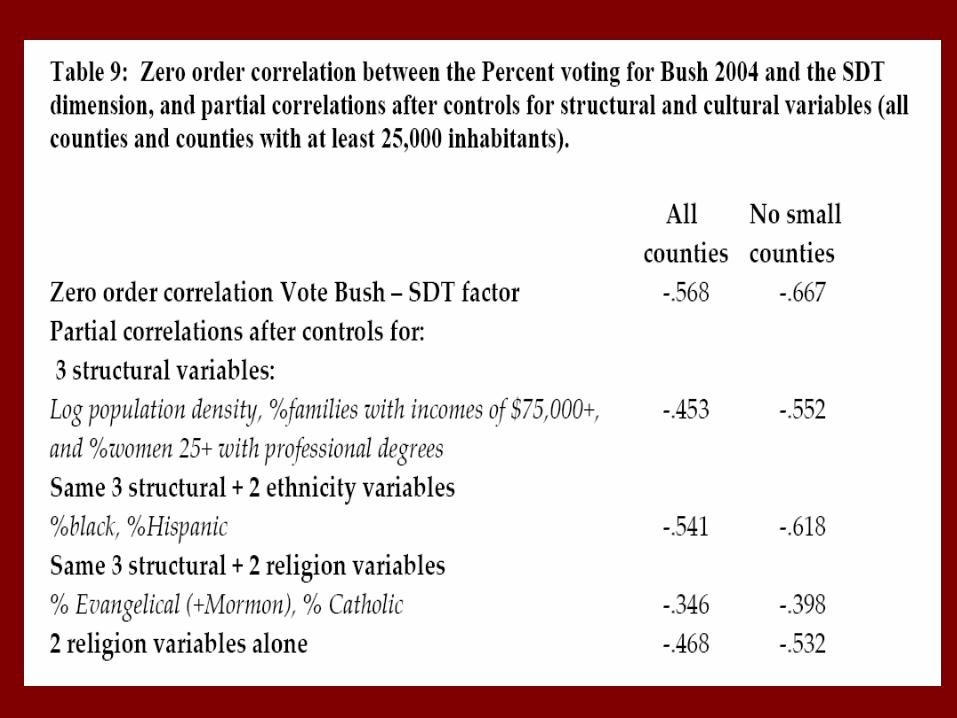
How strong is the link in the US between demographics and voting ?
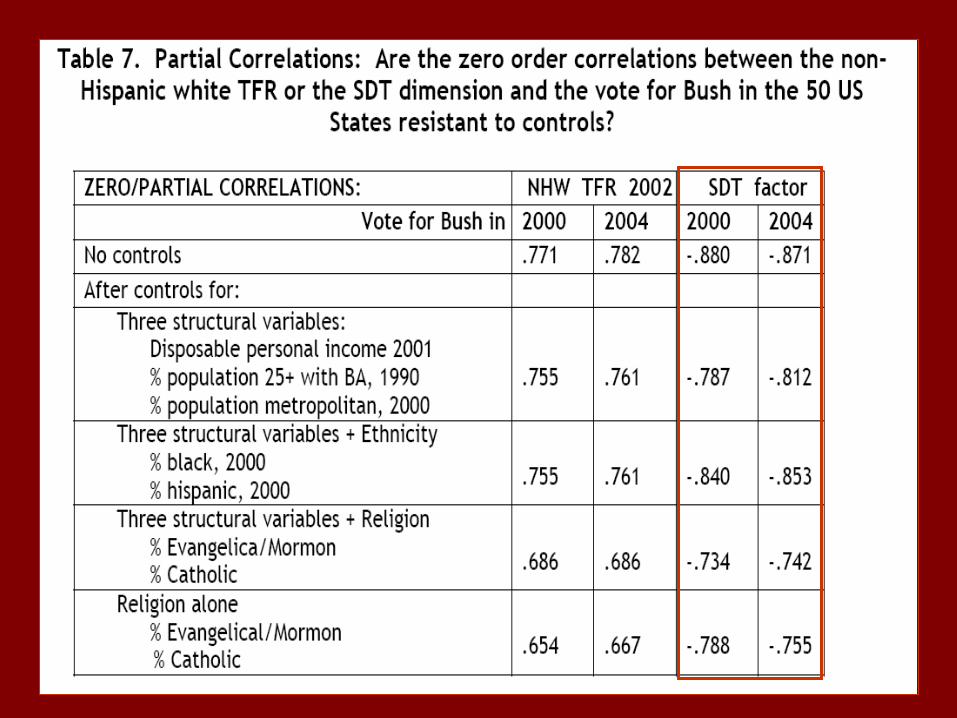
Is that relationship resistant to controls for other structural and cultural variables ?
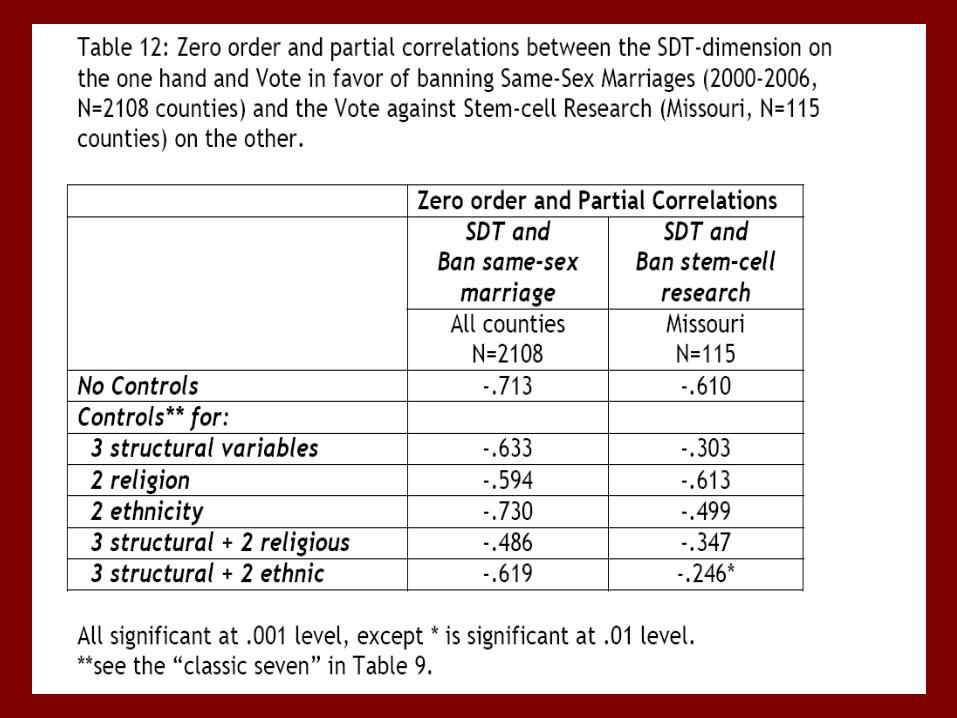
Are the results for the presidential election replicated in recent referenda on other “culture war” issues, like same-sex marriage or stem-cell research ?
Is the “US Culture War” a myth ? Morris Fiorina: “only a debate among polarizing elites; no or little change among centrist public”
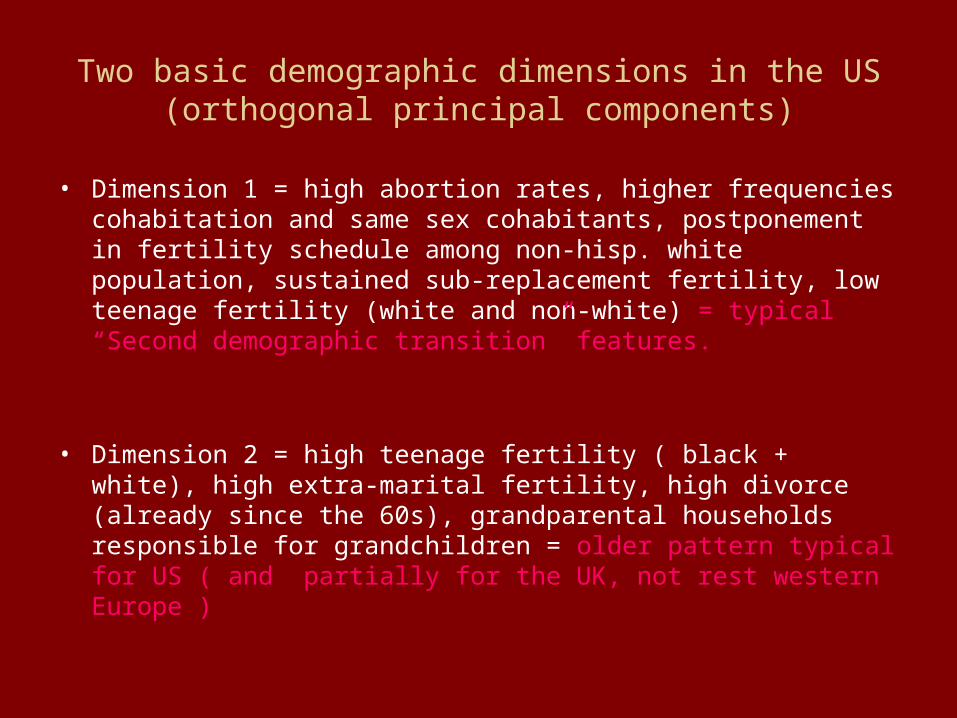
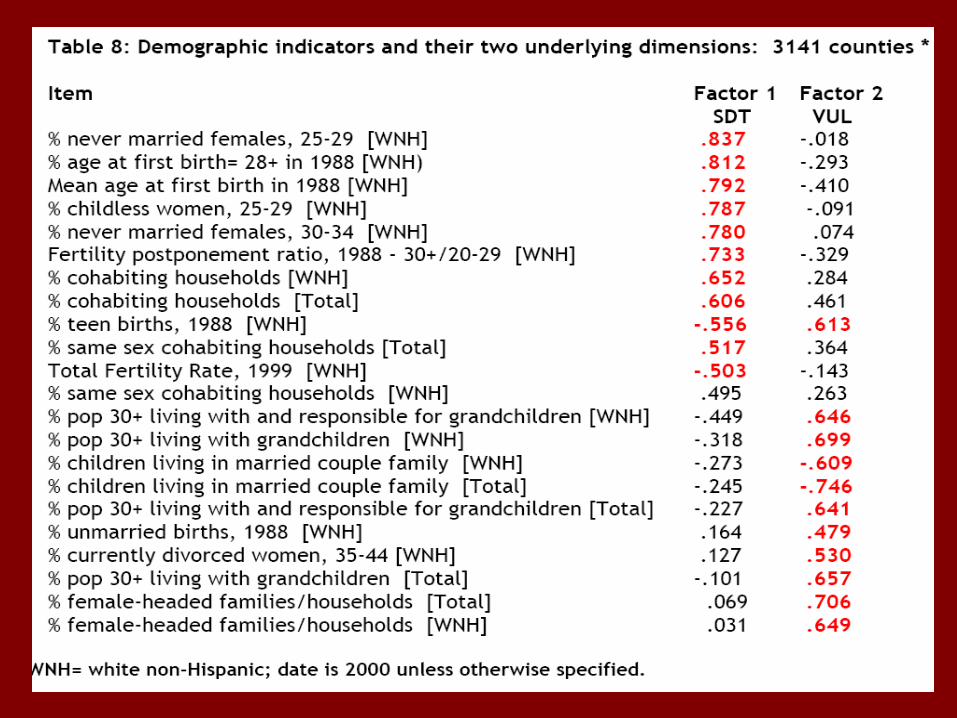
Two basic demographic dimensions in the US(orthogonal principal components)
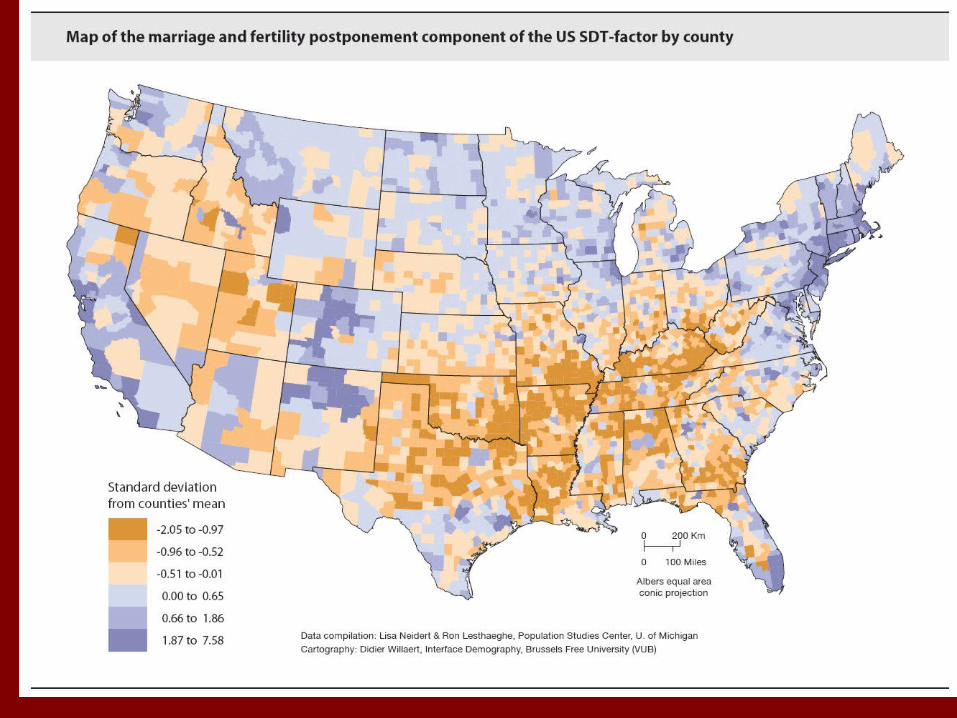
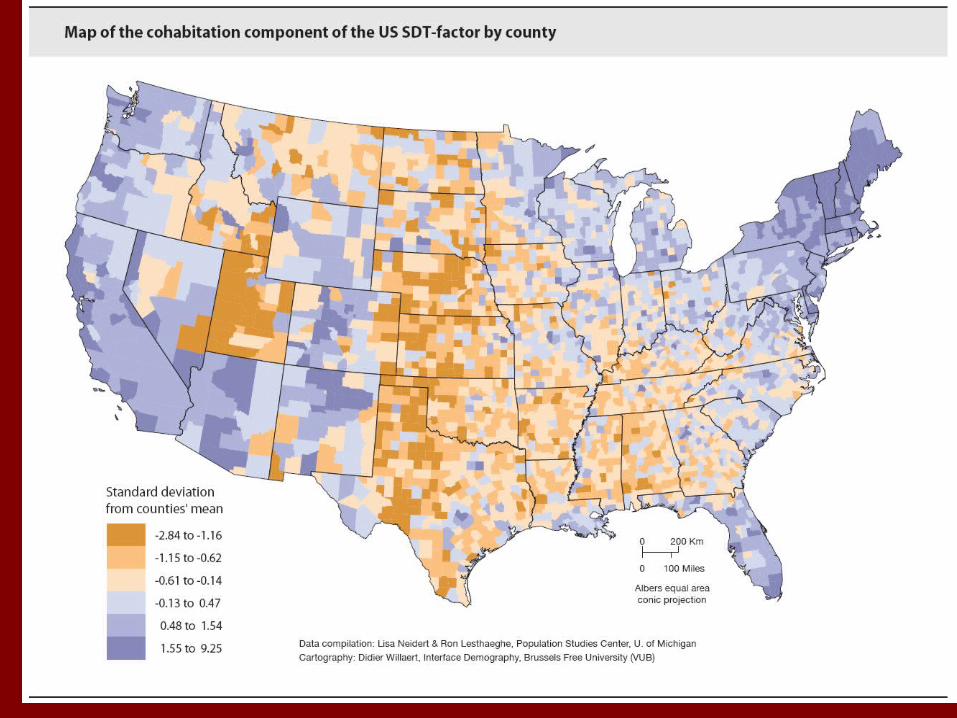
• Dimension 1 = high abortion rates, higher frequencies cohabitation and same sex cohabitants, postponement in fertility schedule among non-hisp. white population, sustained sub-replacement fertility, low teenage fertility (white and non-white) = typical “Second demographic transition” features.
• Dimension 2 = high teenage fertility ( black + white), high extra-marital fertility, high divorce (already since the 60s), grandparental households responsible for grandchildren = older pattern typical for US ( and partially for the UK, not rest western Europe )
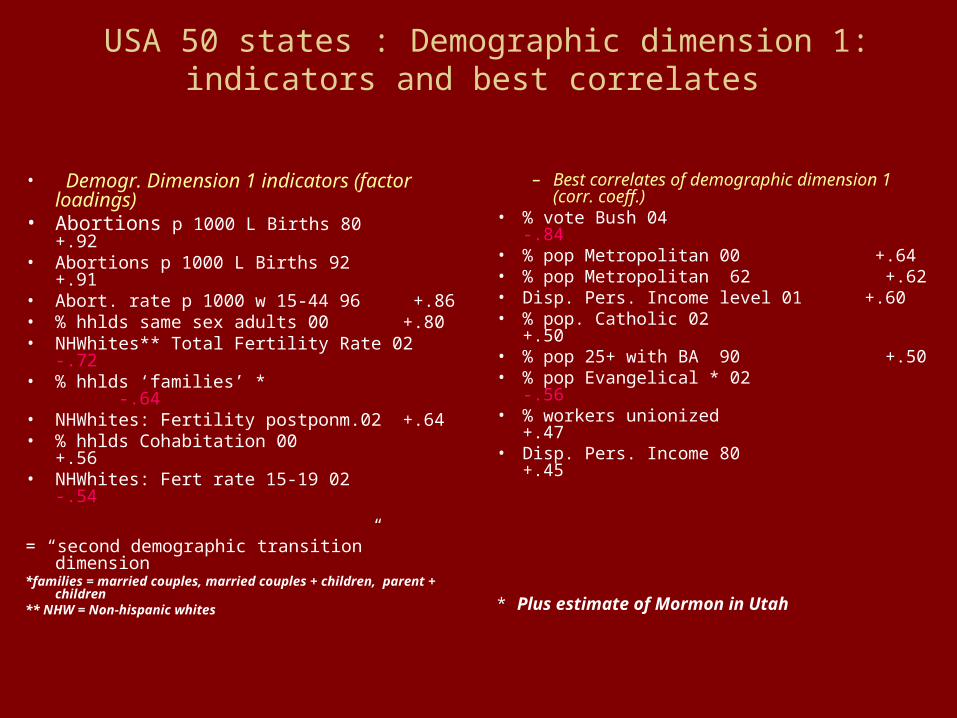
USA 50 states : Demographic dimension 1:indicators and best correlates
• Demogr. Dimension 1 indicators (factor loadings)
• Abortions p 1000 L Births 80 +.92• Abortions p 1000 L Births 92 +.91• Abort. rate p 1000 w 15-44 96 +.86• % hhlds same sex adults 00 +.80• NHWhites** Total Fertility Rate 02 -.72• % hhlds ‘families’ * -.64• NHWhites: Fertility postponm.02 +.64• % hhlds Cohabitation 00 +.56• NHWhites: Fert rate 15-19 02 -.54
= “second demographic transition” dimension*families = married couples, married couples + children,
parent + children** NHW = Non-hispanic whites
– Best correlates of demographic dimension 1 (corr. coeff.)
• % vote Bush 04 -.84• % pop Metropolitan 00 +.64• % pop Metropolitan 62 +.62• Disp. Pers. Income level 01 +.60• % pop. Catholic 02 +.50• % pop 25+ with BA 90 +.50• % pop Evangelical * 02 -.56• % workers unionized +.47• Disp. Pers. Income 80 +.45
* Plus estimate of Mormon in Utah
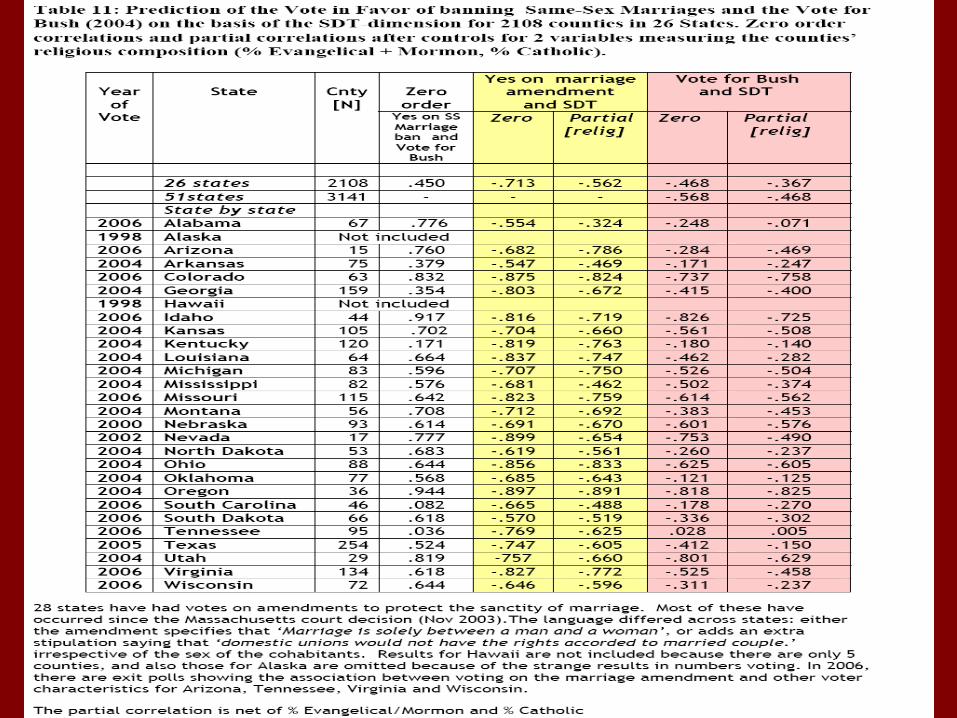
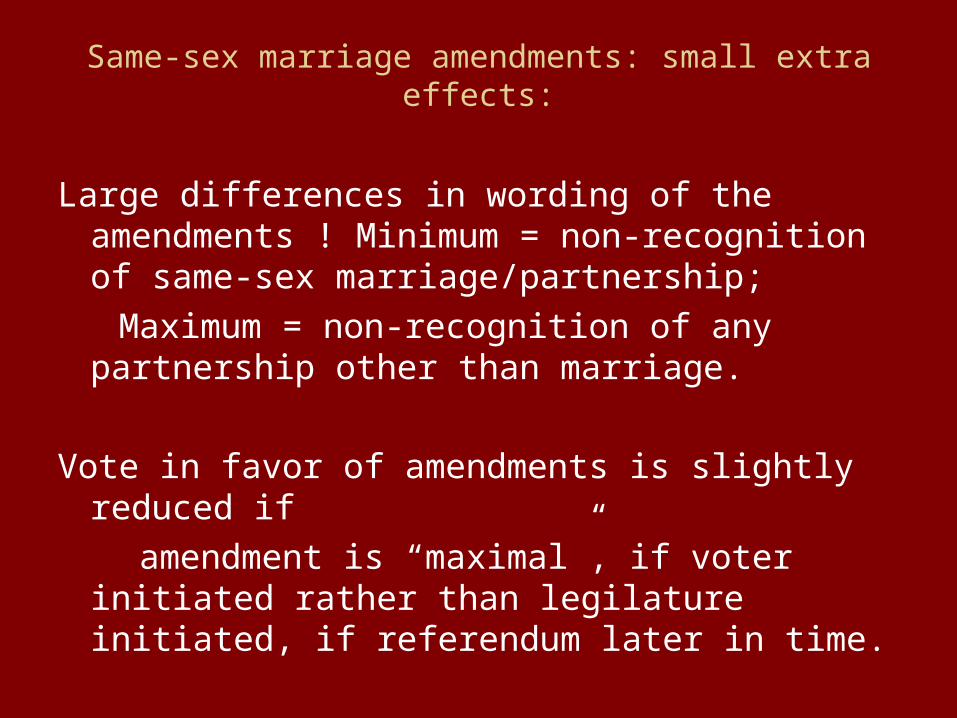
Same-sex marriage amendments: small extra effects:
Large differences in wording of the amendments ! Minimum = non-recognition of same-sex marriage/partnership;
Maximum = non-recognition of any partnership other than marriage.
Vote in favor of amendments is slightly reduced if
amendment is “maximal”, if voter initiated rather than legilature initiated, if referendum later in time.
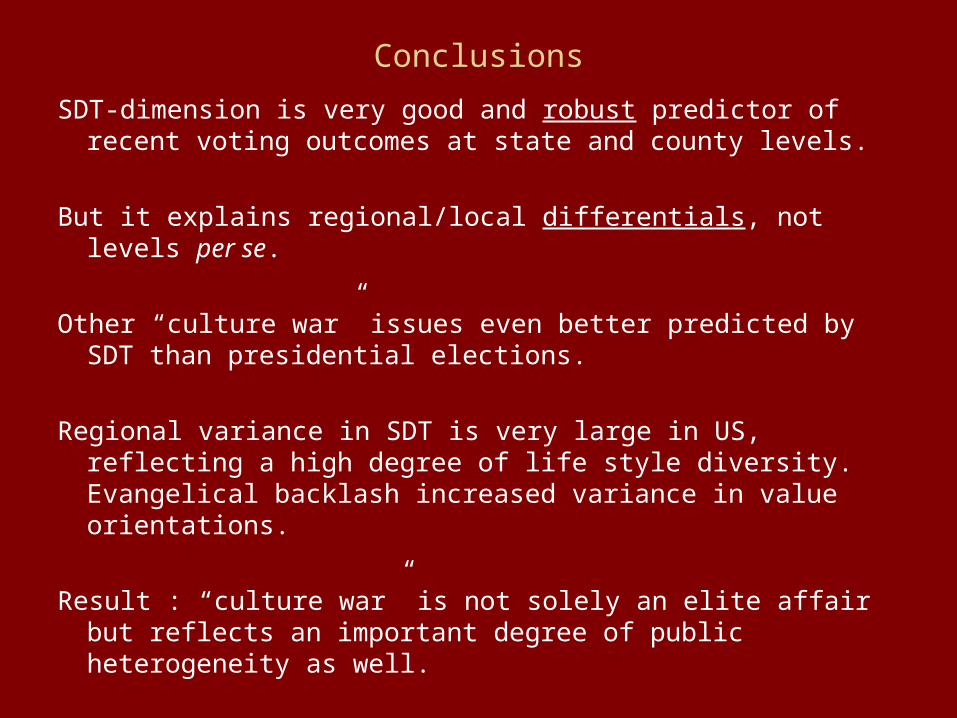
Conclusions
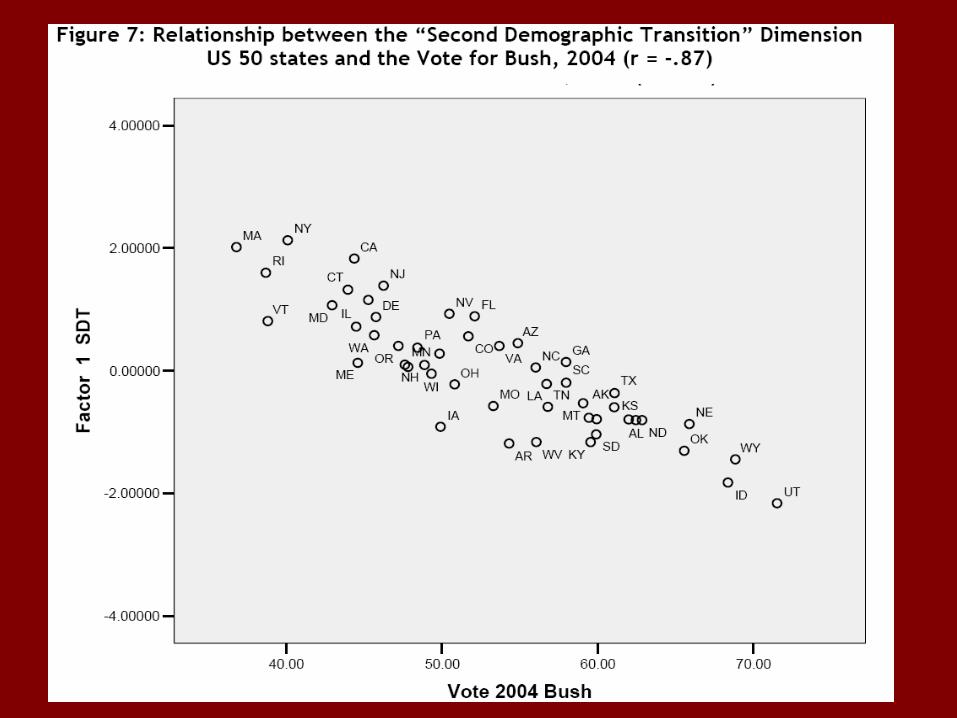
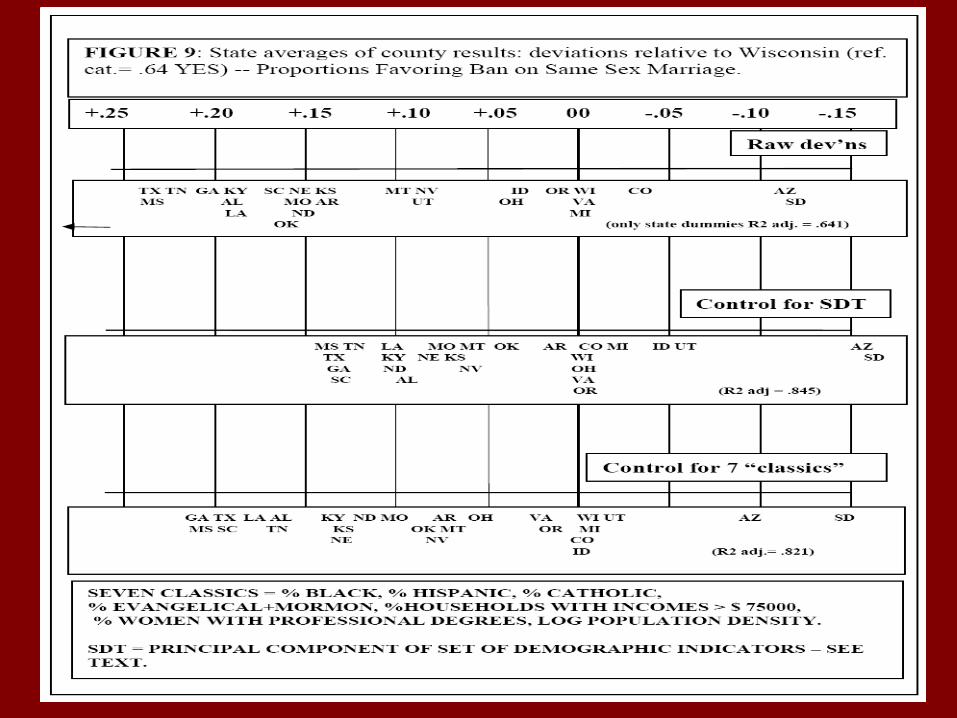
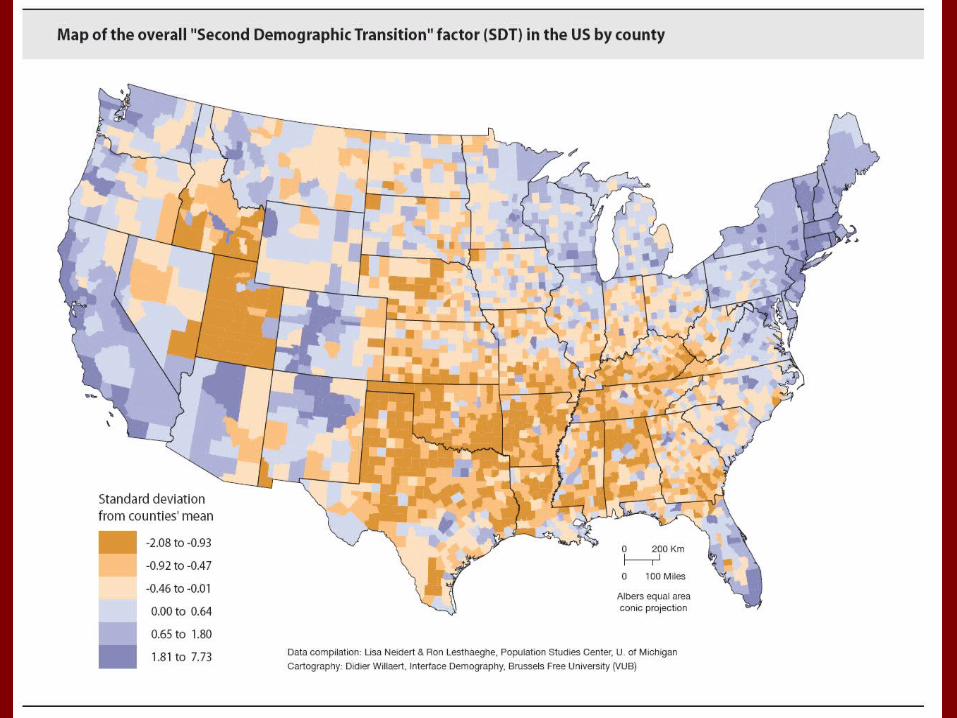
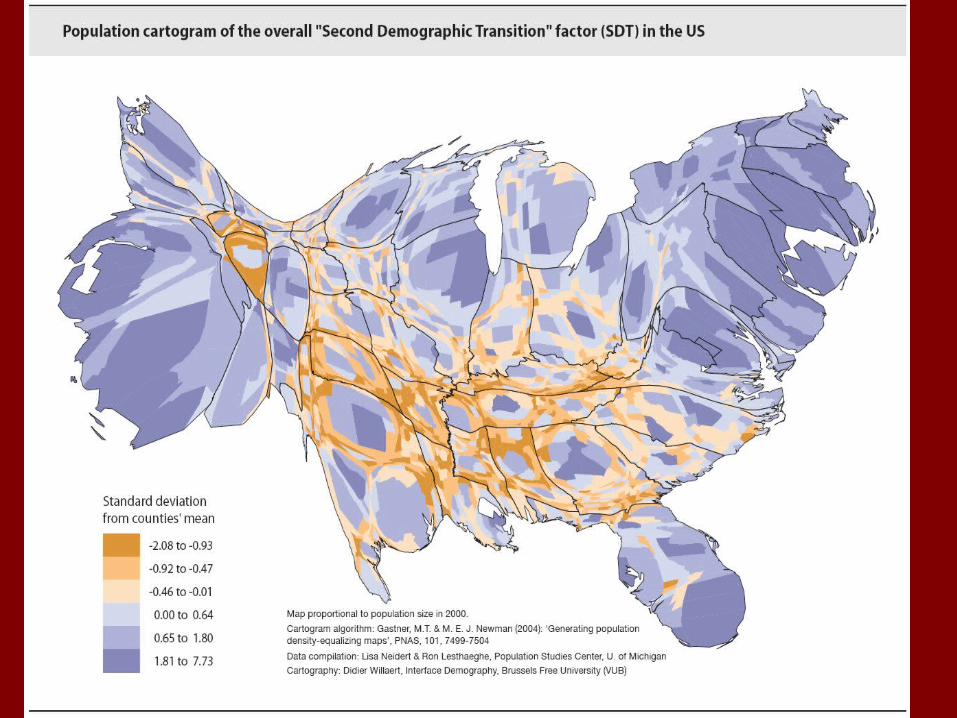
SDT-dimension is very good and robust predictor of recent voting outcomes at state and county levels.
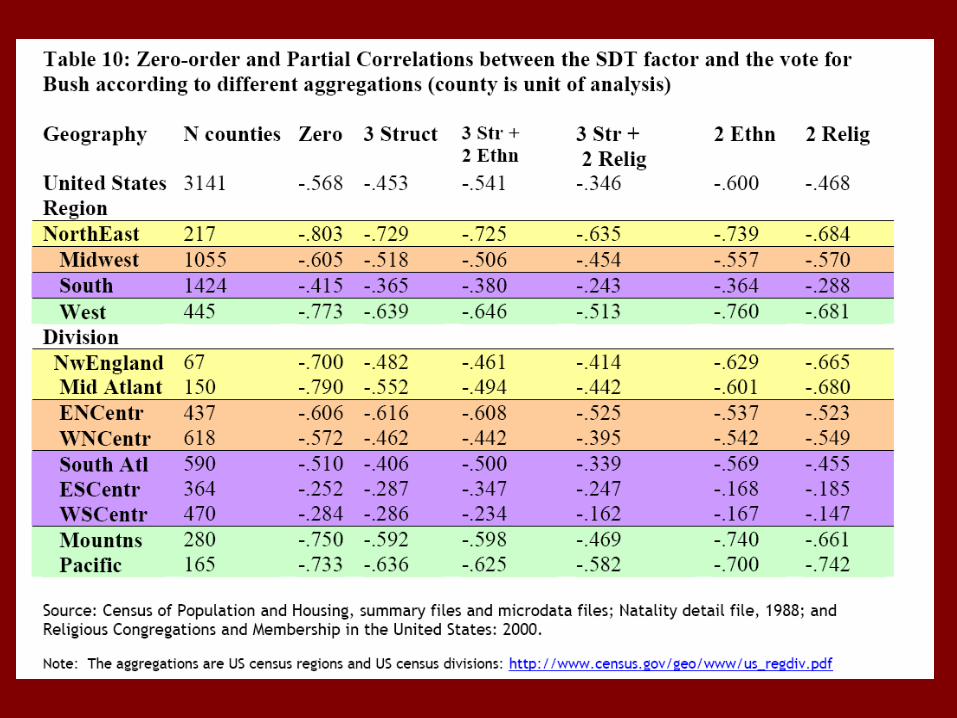
But it explains regional/local differentials, not levels per se.
Other “culture war” issues even better predicted by SDT than presidential elections.
Regional variance in SDT is very large in US, reflecting a high degree of life style diversity. Evangelical backlash increased variance in value orientations.
Result : “culture war” is not solely an elite affair but reflects an important degree of public heterogeneity as well.
BOTTOM LINE
The US is a textbook example of how spatial ideational differentials shaped the map of the SDT, and how in its turn, the SDT-map co-determines the political outcomes at levels of States and counties.
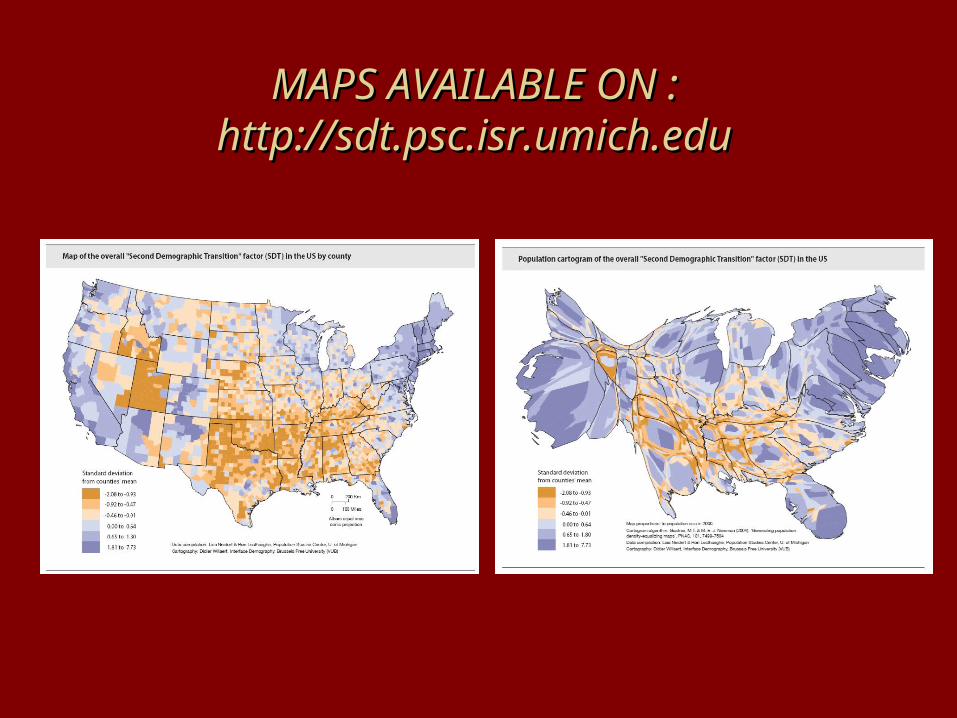
MAPS AVAILABLE ON :MAPS AVAILABLE ON :http://sdt.psc.isr.umich.eduhttp://sdt.psc.isr.umich.edu