Embed Size (px)
Citation preview
The preparation of high conversion polymeric systems containingeugenol residues and their rheological characterization
Luis Rojo Æ Assunta Borzacchiello Æ Juan Parra Æ Sanjukta Deb ÆBlanca Vazquez Æ Julio San Roman
Received: 7 September 2007 / Accepted: 17 October 2007 / Published online: 29 November 2007
� Springer Science+Business Media, LLC 2007
Abstract Copolymeric systems bearing eugenol cova-
lently linked to the macromolecular chains have been
prepared and characterised in terms of thermal, rheological
and in vitro behaviour. Eugenyl methacrylate (EgMA) and
ethoxyeugenyl methacrylate (EEgMA) were polymerized
and copolymerized with ethyl methacrylate (EMA) in a
wide range of feed composition by bulk at high conversion.
Glass transition temperature (Tg) increased with the con-
tent of EgMA in the copolymer whereas Tg decreased with
the content of EEgMA. The presence of any of the eugenyl
monomers in the copolymer increased the thermal stability
of the materials. Rheological analysis showed that EMA-
co-EgMA copolymers present a higher density of cross-
linking or entanglements among the chains compared with
EMA-co-EEgMA materials, and copolymers containing
more than 40% EgMA exhibited a pseudo-solid like
behaviour with G0 relatively independent of the frequency.
The average molecular weight between cross-links (Mc) for
the latter copolymers was in the order of 104 Da. For
EEgMA copolymers, tan d was lower than unity and G0
showed a gradual and slight dependency with frequency
over the whole range of composition. In vitro behaviour
showed a higher hydrophilicity of the EEgMA containing
copolymers manifested in higher water sorption values,
lower water contact angle values and higher surface free
energy due to an increase in polarity. All systems presented
a good cytocompatibility with human fibroblasts assessed
through direct and indirect assays.
1 Introduction
Innovations in the field of polymers for therapeutic pur-
poses are increasingly aiming to develop systems with
specific functionality. The immobilisation of biologically
active molecules in macromolecular chains is a strategy
currently used to attain this objective [1]. One immobili-
sation route is to covalently link the active molecule to a
polymeric backbone that has the advantage of providing
the stability of the biomolecule in the system. The incor-
poration of a biomolecule within a hydrocarbonated
skeleton can be attained directly or through the introduc-
tion of a spacer group. The use of a spacer group provides a
higher steric freedom which, consequently will result in a
higher efficiency of the activity of the biomolecule, espe-
cially in the case of smallest ones [2]. Moreover, the spacer
group can contribute to the hydrolytic release of the
immobilised molecule during the degradation process [3].
Following this strategy route, the development of poly-
meric systems in which a eugenol residue has been
covalently linked to the macromolecular chains has been
attempted successfully [4]. Eugenol, has been used in
L. Rojo � B. Vazquez (&) � J. San Roman
Institute of Polymer Science and Technology, CSIC,
C/Juan de la Cierva 3, Madrid 28006, Spain
e-mail: [email protected]
A. Borzacchiello
Institute of Composite and Biomedical Materials, CNR and
CRIB, University of Naples, Federico II, Piazzale Tecchio 80,
Napoli 80125, Italy
J. Parra
Associated Unity CSIC-HP, CHA.SACyL. C/Jesus del Gran
Poder 42, Avila 05003, Spain
S. Deb
King’s College London, GKT Dental Institute, Floor 17 Guy’s
Tower, London Bridge, London SE1 9RT, UK
123
J Mater Sci: Mater Med (2008) 19:1467–1477
DOI 10.1007/s10856-007-3317-x

dental materials [5] since at least the 19th century and
currently used in combination with zinc oxide as temporary
pulp capping agent and as filling systems in root canals,
where the eugenol functions as an obturating agent pro-
ducing a soothing effect on the pulp. It has been reported
that the release of unreacted eugenol, in some concentra-
tions, can produce tissue irritation and induce inflammatory
reactions over the oral mucous membrane. Furthermore,
eugenol also interferes with the free radical polymerization
of the dental composites that are often required to be
placed. The use of a covalently linked eugenol is advan-
tageous as it reduces the migration of eugenol to the
surrounding tissues and improves its hydrolytic stability.
On the other hand the covalently linked eugenol does not
produce the inhibitory effect of eugenol against free radical
polymerization and the new derivative can participate in
polymerisation reactions. This approach widens the appli-
cation of eugenol in the dental and also in the orthopaedic
field through the preparation of self-curing resins. In
addition, the bactericidal properties are maintained. Thus,
two eugenol derivative methacrylates with spacer groups
between the methacrylic group and the eugenol moiety
were synthesized: eugenyl methacrylate (EgMA), in which
the acrylic residue was directly bonded to the aromatic ring
of eugenol, and ethoxyeugenyl methacrylate (EEgMA) in
which the acrylic and eugenol moieties were separated
through an oxyethylene group.
The aim of this study was the preparation and charac-
terisation of high conversion polymers of EgMA and
EEgMA and their copolymers with ethyl methacrylate
(EMA) in a wide range of feed composition. Due to the
presence of two different double bonds in the chemical
structure of both the eugenyl monomers, they are suscep-
tible to polymerise in the presence of a free radical initiator
and yield polymeric networks that are partially crosslinked.
Thus, the degree of crosslinking and average molecular
weight between cross-links (Mc) have been evaluated by
rheological properties. In addition, thermal properties and
the in vitro behaviour of the copolymer systems have been
studied through water sorption experiments, contact angle
measurements and cellular response to human fibroblast
cultures.
2 Experimental procedures
2.1 Materials
Ethyl methacrylate (EMA) (Aldrich) was purified by dis-
tillation under reduced pressure. EgMA and EEgMA were
synthesized as reported previously [4]. Azobisisobutyro-
nitrile (AIBN) (Merck) was recrystallised from methanol
(M.p. 104 �C). The solvents hexane (Scharlau), tert-
butanol (Aldrich) and toluene (Merck) were purified by
standard procedures.
2.2 Synthesis and characterisation of polymers
and copolymers
High conversion polymers of EMA, EgMA and EEgMA
and EMA-co-EgMA and EMA-co-EEgMA copolymers
for feed EMA/eugenyl monomer molar ratios ranging
from 20:80 to 80:20 were obtained by bulk radical
polymerization using AIBN (1 wt% with respect to
monomer) as a free radical initiator. About 250 mg of the
corresponding monomer or monomer mixture were
introduced in polypropylene capped cylinder moulds of
1.5 mm of diameter. The reaction medium was saturated
with N2 atmosphere for 15 min and then the tube was
capped and heated at 70 �C for 2 h. Subsequently, the
temperature was reduced to 60 �C and the reaction was
allowed to proceed for 46 h. The polymerised samples
were extracted from the moulds, thoroughly washed with
hexane and water to remove residual monomers and filed
with a sandpaper to obtain 1 mm thickness discs. Finally,
the samples were dried under vacuum until constant
weight.
The soluble fraction of each material was obtained by
Soxhlet extraction in toluene for 48 h. After the treatment,
samples were dried under vacuum and soluble fraction was
calculated by using Eq. 1:
Fsol = [100 � (Wi � Wf)/Wi] ð1Þ
where Fsol is the soluble fraction; Wi the initial weight of
the sample before the treatment and Wf is the dried weight
of the sample after the treatment. Three samples of each
material were tested and results were averaged.
Densities of PEMA, PEgMA and PEEgMA homopoly-
mers were measured by a flotation pycnometric method
using an aqueous calcium nitrate solution at 25 ± 0.1 �C.
Measurements were taken placing 10 small films of each
material in water and adding successive small volumes of a
saturated aqueous calcium nitrate solution until the density
of the final solution equalled that of the sample. Then, the
density of the final solution was determined by
pycnometry.
ATR-FTIR spectra of all the polymers and copolymers
were recorded on a Perkin–Elmer-Spectrum One spectro-
photometer, with an ATR attachment.
2.3 Thermal properties
Glass transition temperatures (Tg) were measured using
differential scanning calorimetry (DSC) with a Perkin–
1468 J Mater Sci: Mater Med (2008) 19:1467–1477
123
Elmer DSC7 interfaced to thermal analysis data system
TAC 7/DX. Films of dry samples (15–20 mg) were placed
in aluminium pans and heated from -20 �C to 150 �C at a
constant rate of 10 �C/min. Tg was taken as the midpoint of
the heat capacity transition. Two samples were tested for
each material. Thermogravimetric diagrams were obtained
in a thermogravimetric analyzer using a TGA Q500 (TA
Instrument) apparatus, under dynamic nitrogen at a heating
rate of 5 �C/min in a range of 40–600 �C. Samples were
tested in duplicate.
2.4 Rheological measurements
The rheological properties were evaluated by using a
stress-controlled rotational rheometer (Gemini, Bohlin
Reologi A B, Lund, Sweden) using parallel plate configu-
ration. The tests were performed at a controlled
temperature of 37 ± 0.1 �C. Swelling of polymer discs in
tert-butanol to equilibrium was carried out to study the
rheological behaviour of the materials. Three samples of
each formulation were allowed to equilibrate for at least
30 min prior to analysis. To avoid tert-butanol evaporation,
the cell containing the sample was enclosed in a solvent
trap saturated with solvent. The alcohol sorption (AS) was
calculated according to Eq. 6.
Small amplitude oscillatory shear experiments were
performed to evaluate the viscoelastic properties. This
technique has been used successfully to determine the
structure-mechanical properties relationship of materials or
tissues [6–7]. In dynamic mode the material was subjected
to a sinusoidal shear strain:
c ¼ c0 sinðxtÞ ð2Þ
where c0 is the shear strain amplitude, x is the oscillation
frequency (which can also be expressed as 2pf where f is
the frequency in Hz and t the time). The mechanical
response, expressed as shear stress s of viscoelastic
materials, was intermediate between an ideal pure elastic
solid (obeying Hooke’s law) and an ideal pure viscous
fluid (obeying Newton’s law) and therefore out of phase
with respect to the imposed deformation as expressed by
Eq. 3:
s ¼ G0ðxÞc0 sinðxtÞ þ G00ðxÞc0 cosðxtÞ ð3Þ
where G0(x) is the shear storage modulus or elastic mod-
ulus, and G@(x) is the shear loss modulus or viscous
modulus. G0 gives information about the elasticity or the
energy stored in the material during deformation, whereas
G@ describes the viscous character or the energy dissipated
as heat.
The dynamic viscosity g0 is related to the loss modulus
G@ as shown in Eq. 4 [8]:
g0 ¼ G00
xð4Þ
It is a measure of the gel resistance to shear flow which
is always associated with internal dissipation, generally, as
heat; while the loss tangent (tan d) is defined as:
tan d ¼ G00
G0ð5Þ
Preliminary strain sweep test at a fixed oscillation
frequency (consisting in monitoring the viscoelastic
properties while logarithmically varying the strain
amplitude c0) were performed on the materials to
determine the strain amplitude at which linear
viscoelasticity is valid. The oscillation frequency ranged
from 0.1 Hz to 10 Hz.
2.5 In vitro behaviour
For swelling experiments, discs of polymers were accu-
rately measured and weighed, and introduced in phosphate-
buffered solution (PBS), and kept until they reached
equilibrium at 37 �C. The values of water sorption (WS)
were determined gravimetrically using Eq. 6, where Ww is
the weight of the wet sample at time t and W0 is the weight
of the dry sample. Three samples of each material were
evaluated and results averaged.
WS ð%Þ ¼ 100� ðWw �W0Þ=W0 ð6Þ
Contact angles were measured on non filed polymer
surfaces discs by using the sessile drop technique and
employing liquids with known surface tension: water (cL =
72.8 mN/m) and methylene iodide (cL = 51.8 mN/m).
cL refers to the total surface free energy of the liquid. A
minimum of 10 drops were applied on each sample. The
surface free energy of homopolymers and copolymers
(SFE) was calculated by the Fowkes’ [9] and Owens’
method [10].
cs ¼ cds þ cp
s ð7Þ
ð1þ cos hÞc1=2 ¼ ðcds c
dl Þ
1=2 þ ðcps c
pl Þ
1=2 ð8Þ
where h is the contact angle, cs and cl are the surface free
energy of solid and liquid respectively and csd, cs
p, cld and cl
p
clp are the dispersive and polar components of SFE of solid
and liquid respectively.
For biocompatibility evaluation, a direct contact assay
was performed in which Thermanox1 (TMX) as the
standard control and discs of the copolymers were placed
in a 24-well plate (in duplicate), seeded with human
fibroblasts at a density of 1.4 9 105 cells/mL and
J Mater Sci: Mater Med (2008) 19:1467–1477 1469
123

incubated at 37 �C. After 24 h of incubation, the cultures
were washed to remove non-adherent cells and the cells
adhered were fixed with 1.5% glutaraldehyde buffered in
0.1 M phosphate buffer. The dried samples were sputter-
coated with gold before examination under an ESEM
apparatus (Philips XL 30) at an accelerating voltage of
15 KeV.
To evaluate the cytotoxicity of the eluants from the
materials, TMX and discs of copolymers were set up in
5 mL of minimal essential Eagle’s medium (MEM), foetal
bovine serum-free. They were placed on a roller mixer at
37 �C and the medium was removed at 1 and 2 days. The
medium containing the extracts of the specimens was
added to a sterile six-well culture plate containing human
fibroblasts seeded at a density of 1.4 9 105 cell/ml, in
complete medium and incubated at 37 �C for 24 h. The
culture medium was replaced with the corresponding
extract and incubated again at 37 �C for 96 h. Then, the
cells were fixed, using 10% formaldehyde solution, and
stained using Harris haematoxilin and eosin. The obtained
samples, all of them in duplicate, were observed and
photographed using an optical microscope NIKON
ECLIPSE E600 with a camera NIKON DXM 1200.
3 Results and discussion
3.1 Synthesis and characterisation of polymers and
copolymers
The free radical polymerization of EgMA and EgMA
carried out in bulk at high conversion provided polymers
which were insoluble in common organic solvents, with a
soluble fraction in toluene as little as 1.4 and 0.8% for
PEgMA and PEEgMA respectively. This fact reveals the
participation of the two types of double bonds present in
the chemical structure of the eugenol monomers, acrylic
and allylic double bonds. It has been demonstrated that
acrylic double bonds are the first to react giving soluble
polymers when the polymerization reaction is carried out at
low conversion [4]. Then, as polymerization conversion
increases the pendant allylic double bonds contribute to
grafting and crosslinking. If the polymerization is carried
out in bulk, the conditions involved in this process may
contribute to the formation of crosslinks. Bulk polymeri-
zation involves heat dissipation, which promotes an
exponential increase of viscosity, decreasing the mobility
of the macro-radicals that enhances the autoacceleration
effect. The density of PEgMA and PEEgMA was calcu-
lated and compared with that of PEMA obtained under
identical conditions. The values obtained were 1.186 g/mL
for PEMA, 1.181 g/mL for PEgMA and 1.093 g/mL for
PEEgMA, which was slightly lower for the methacrylate
bearing the most voluminous side group. The free radical
copolymerization of the eugenol containing monomers
with EMA in a wide range of monomer feed composition,
also provided copolymers partially insoluble in organic
solvents and the soluble fraction increased with the EMA
content in the copolymer up to 26% for contents of 80%
EMA in the copolymer, reflecting that the presence of
allylic double bonds is determinant of the degree of
grafting and crosslinking.
PEgMA, PEEgMA and the two copolymers were char-
acterized by ATR-FTIR spectroscopy (see Fig. 1). All the
spectra showed the absorption bands characteristic of the
eugenyl methacrylates and EMA units [11], at 3,080 cm-1 m
4000 3500 3000 2500 2000 1500 1000 500
PEgMA
Wavenumber (cm-1)
ecnatimsnar
T
PEMA
p(EMA-co-EEgMA) (50:50)
p(EMA-co-EgMA) (50:50)
PEgMAFig. 1 ATR-FTIR spectra of
EMA-co-EgMA and EMA-co-
EEgMA systems obtained at
high conversion
1470 J Mater Sci: Mater Med (2008) 19:1467–1477
123

C=C in the allyl group [12, 13], 3,000–2,900 cm-1 ms and
mas CH2 aliphatic, 1,725 cm-1 m C=O ester, 1,650–
1,550 cm-1 m C=C in the aryl-ester groups, 1,635 cm-1 mC=C in the allyl group [12, 13], 1,503 cm-1 m in the aro-
matic ring, 1,415 and 995 cm-1 d C=C in the allyl group
[12, 13], 1,360 cm-1 m O–Ph, 700–760 cm-1 m in the
aromatic ring.
3.2 Thermal properties
Thermal properties of the high conversion polymers and
copolymers were evaluated by DSC and TGA. The deter-
mination of the glass transition temperature (Tg) provides
accurate information about the relative flexibility of poly-
meric segments and hence of the polymeric network.
Values of Tg are shown in Fig. 2 along with the corre-
sponding themograms. Tg values of homopolymers were in
the order PEgMA [ PEMA [ PEEgMA and were consis-
tent with those reported for homopolymers obtained at low
conversion [4]. EMA-co-EgMA copolymers exhibited
values of Tg in the range of those of the corresponding
homopolymers (96–55 �C), with a trend to decrease with
EMA content in the copolymer, which reflects the greater
rigidity of the EgMA unit, probably associated to interac-
tions involving the substituent groups in the aromatic ring.
For EMA-co-EEgMA copolymers, on the other hand,
values of Tg decreased with the content of EEgMA units in
the copolymer, indicating that the voluminous group of
eugenol separated from the backbone by an oxyethylene
group contributed to the flexibility of the side group. The
values of Tg obtained were in the range 55–35 �C. The
thermal stability of the copolymers was evaluated by
thermogravimetric analysis and the results are shown in
Fig. 3. The thermogravimetric curves of PEMA showed
four degradation steps, which was very similar to the
behaviour of PMMA that has been well described in lit-
erature [14–15]. The first stage of degradation (around
207 �C) originate from the sterically hindered linkages that
result from head-to-head coupling during polymerisation,
the second stage of degradation (around 274 �C) is attrib-
uted to the decomposition of the chain from the vinylidene
end formed via disproportionation, and the two subsequent
stages (around 350 and 430 �C) are ascribed to the random
chain scission of the main chain leading to depolymerisa-
tion of the acrylic polymer. However, the eugenol
containing polymers and copolymers underwent practically
single-step decomposition, which can be attributed to the
totally random scission of the main chain. The presence of
the eugenyl monomer provided a clear increase in thermal
stability, which is reflected in the values of the temperature
for maximum rate of decomposition and temperature for
50% weight loss as shown in Table 1.
3.3 Rheological properties
Rheological behaviour of both the high conversion systems
were studied using a stress controlled rotational rheometer
with parallel plate configuration. To perform these mea-
surements, polymeric and copolymeric discs were swollen
in tert-butanol to attain equilibrium and the values of AS
0
AMg
E-oc
-A
ME
AM g
EE -
o c-
AM
E
Tg = 73 °C
Tg = 55 °C
Tg = 48 °C
Tg = 40 °C
Tg = 37 °C
Tg = 35 °C
wolf taeH
Temperature (°C)
100% PEEgMA
20:80
50:50
Tg = 93 °C
Tg = 86 °C
80:20
100% PEMA
80:20
50:50
20:80
Tg = 96 °C 100% PEgMA
12010080604020
Fig. 2 DSC thermograms of
EMA-co-EgMA and EMA-co-
EEgMA systems obtained in
bulk at high conversion
J Mater Sci: Mater Med (2008) 19:1467–1477 1471
123

are shown in Table 2. In order to determine the rheological
parameters it was necessary to establish the validity range
of linear viscoelasticity. To this aim, preliminary stress
sweep tests at a fixed oscillation frequency (consisting in
monitoring the viscoelastic properties while logarithmi-
cally varying the stress amplitude) were performed on the
materials. For all polymers and copolymeric systems the
dynamic storage modulus G0 reached a constant value for
stress higher than 100 Pa, and a stress amplitude of 350 Pa
was fixed for further tests.
Figure 4 shows the dependence of the storage modulus
G0 for both copolymeric systems upon frequency. EMA-co-
EgMA copolymers showed values of G0 one order of
magnitude higher than those obtained for EMA-co-EEgMA
copolymers indicating that a higher density of crosslinking
or entanglements among the chains is present in the former
system. It was also observed that EMA-co-EgMA
copolymers containing more than 40% EgMA and PEg-
MA, exhibited a pseudo-solid like behaviour with G0[ G00
and G0 relatively independent of the frequency range of
0.1–100 rad/s. This fact is reflected in the values of slope
of G0 versus frequency which were almost zero, equal to
0.02 for EMA-co-EgMA 20:80, 0.05 for EMA-co-EgMA
40:60 and 0.09 for PEgMA. For EEgMA copolymers, G0
showed a gradual and slight dependency with frequency
over the whole range of frequency and for all copolymer
compositions, with values of slopes between 0.11 and 0.21,
indicating the typical viscoelastic behaviour exhibited
by branched systems with a slightly crosslinked degree
[16, 17].
The average molecular weight between cross-links (Mc)
can be estimated from viscoelastic measurements by
applying the rubber elasticity theory [7]. For EMA-co-
EgMA copolymers, that show pseudo-solid like behaviour,
the values of Mc obtained, using the storage modulus value
at 1 Hz and 37 �C, were in the order of 104 Da. For
PEgMA a lower value of Mc was obtained (0.6 9 104)
indicating a highest degree of crosslinking in the final
network.
0
0
20
40
60
80
100d
c
b
a
Derivative Weighta PEMAb (60:40)c (40:60)d PEgMA
p(EMA-co-EgMA)
Weight lossa PEMAb (60:40)c (40:60)d PEgMA
Temperature (°C)
)%( ssoL thgie
W t hg i
eW
e vi t
a vi r
eD
0
20
40
60
80
100
d
c
b
a
Derivative Weighta PEMAb (60:40)c (40:60)d PEEgMA
p(EMA-co-EEgMA)
Weight lossa PEMAb (60:40)c (40:60)d PEEgMA
)%( ssoL thgie
W t hgi
eW
evit
avir
eD
600500400300200100
0
Temperature (°C)
600500400300200100
Fig. 3 TGA and DTA curves of high conversion PEMA and eugenol
containing polymers and copolymers obtained by bulk polymeriza-
tion. Upper: EMA-co-EgMA system; lower EMA-co-EEgMA system
Table 1 Values of temperature for maximum rate of decomposition
(Tmax) and temperature for 50% weight loss (T50%) obtained from the
TGA curves of PEMA, eugenol containing polymers and copolymers
synthesized at high conversion in bulk polymerization
System Composition (%) Tmax (�C) T50% (�C)
PegMA 100 444 442
EMA-co-EgMA 40:60 439 435
60:40 437 429
PEMA 100 359 350
EMA-co-EegMA 60:40 427 423
40:60 428 427
PEEgMA 100 431 429
Table 2 Values of swelling at equilibrium in tert-butanol, slope of G0
versus frequency [log(G0) = a + n log(w)] and molecular weight
between cross-links (Mc) calculated according to the rubber elasticity
theory at 1 Hz and 37 �C
System Composition (%) AS (%) n Mc (Da)
EMA-co-EgMA 80:20 22.8 ± 0.8 0.52 –
60:40 3.6 ± 0.6 0.31 –
40:60 2.3 ± 0.4 0.05 1.0 9 104
20:80 1.9 ± 0.5 0.02 1.1 9 104
PEgMA 100 0.8 ± 0.8 0.09 0.6 9 104
EMA-co-EegMA 80:20 26.7 ± 0.9 0.11 –
60:40 14.5 ± 0.9 0.21 –
40:60 7.8 ± 0.8 0.13 –
20:80 7.2 ± 0.9 0.14 –
PEEgMA 100 5.0 ± 0.2 0.17 –
1472 J Mater Sci: Mater Med (2008) 19:1467–1477
123

A linear relationship between storage modulus (G0) and
eugenyl monomer in the copolymer was obtained, and G0
increased with the content of EgMA or EEgMA in the
copolymer. Both curves are shown in Fig. 5 where it is
evident that the elastic behaviour is different for each
copolymeric system.
The relationship between elastic and viscous compo-
nents (tan d) is shown in Fig. 6. It can be observed that for
EMA-co-EgMA 80:20 copolymer loss tangent was higher
than unity (tan d [ 1) for over the range oscillation fre-
quencies and tan d decreased with increasing frequency
showing a predominant dissipative behaviour in all the
frequency range examined. For the rest of EgMA copoly-
mers, tan d was lower than 0.5 and independent of
frequency according with a pseudo-solid like behaviour.
For EEgMA copolymers, tan d was lower than unity
showing a quasi-linear relationship.
The viscosity of a material is a measurement of resis-
tance to flow and it is always associated with the
1
105
106
)aP( '
G
W (rad·s-1)
EMA-co-EgMA 80:20 ( exp) 60:40 ( exp) 40:60 ( exp) 20:80 ( exp) 00:100 ( exp)
105
106
)aP( '
G
EMA-co-EEgMA 80:20 ( exp) 60:40 ( exp) 40:60 ( exp) 20:80 ( exp) 00:100 ( exp)
10010
1
W (rad·s-1)
10010
Fig. 4 Dependence of elastic modulus (G0) with frequency of high
conversion EMA-co-EgMA (upper) and EMA-co-EEgMA (lower)
copolymers obtained by bulk polymerization
0.20.5
1.0
1.5
2.0
2.5
3.0
3.5
4.0
4.5
01( 'G
5)a
P
f(EgMA) or f(EEgMA) copolymer
p(EMA-co-EgMA) ( exp R = 0.96)
p(EMA-co-EEgMA) ( exp R = 0.98)
1.00.80.60.4
Fig. 5 Dependence of elastic modulus (G0) with eugenyl monomer
molar fraction of high conversion EMA-co-EgMA and EMA-co-
EEgMA copolymers obtained by bulk polymerization
10.0
0.5
1.0
1.5
2.0
2.5
3.0nat
δ
W (rad·s-1)
EMA-co-EgMA 80:20 ( exp) 60:40 ( exp) 40:60 ( exp) 20:80 ( exp) 00:100 ( exp)
0.0
0.1
0.2
0.3
0.4
0.5
0.6
0.7
0.8
0.9
1.0
1.1
1.2
1.3
natδ
EMA-co-EEgMA 80:20 ( exp) 60:40 ( exp) 40:60 ( exp) 20:80 ( exp) 00:100 ( exp)
10010
1
W (rad·s-1)
10010
Fig. 6 Dependence of loss tangent (tand) with frequency of high
conversion EMA-co-EgMA (upper) and EMA-co-EEgMA (lower)
copolymers obtained by bulk polymerization
J Mater Sci: Mater Med (2008) 19:1467–1477 1473
123
dissipation of internal energy, mainly heating. A low vis-
cosity means that the material slides easily and dissipates
little internal energy in the shear stress process. A high
viscosity, on the other hand, means that the material slides
more slowly and dissipates more energy in the process.
That resistance can be approximated by dynamic viscosity.
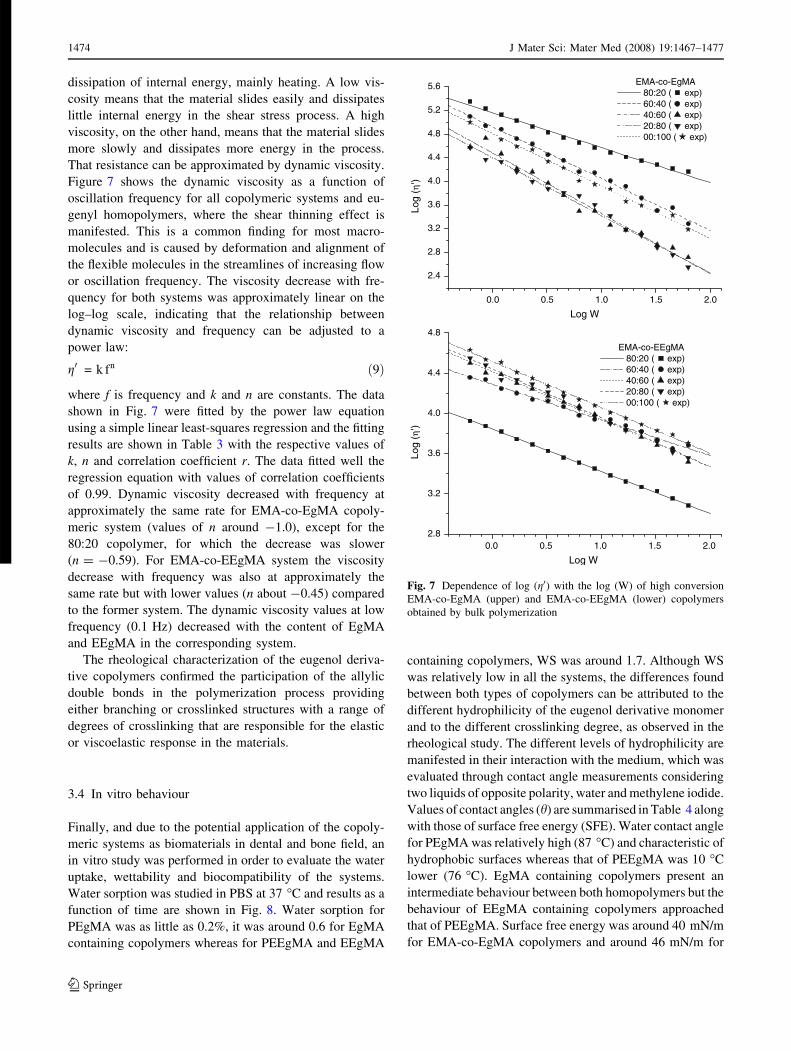
Figure 7 shows the dynamic viscosity as a function of
oscillation frequency for all copolymeric systems and eu-
genyl homopolymers, where the shear thinning effect is
manifested. This is a common finding for most macro-
molecules and is caused by deformation and alignment of
the flexible molecules in the streamlines of increasing flow
or oscillation frequency. The viscosity decrease with fre-
quency for both systems was approximately linear on the
log–log scale, indicating that the relationship between
dynamic viscosity and frequency can be adjusted to a
power law:
g0 = k fn ð9Þ
where f is frequency and k and n are constants. The data
shown in Fig. 7 were fitted by the power law equation
using a simple linear least-squares regression and the fitting
results are shown in Table 3 with the respective values of
k, n and correlation coefficient r. The data fitted well the
regression equation with values of correlation coefficients
of 0.99. Dynamic viscosity decreased with frequency at
approximately the same rate for EMA-co-EgMA copoly-
meric system (values of n around -1.0), except for the
80:20 copolymer, for which the decrease was slower
(n = -0.59). For EMA-co-EEgMA system the viscosity
decrease with frequency was also at approximately the
same rate but with lower values (n about -0.45) compared
to the former system. The dynamic viscosity values at low
frequency (0.1 Hz) decreased with the content of EgMA
and EEgMA in the corresponding system.
The rheological characterization of the eugenol deriva-
tive copolymers confirmed the participation of the allylic
double bonds in the polymerization process providing
either branching or crosslinked structures with a range of
degrees of crosslinking that are responsible for the elastic
or viscoelastic response in the materials.
3.4 In vitro behaviour
Finally, and due to the potential application of the copoly-
meric systems as biomaterials in dental and bone field, an
in vitro study was performed in order to evaluate the water
uptake, wettability and biocompatibility of the systems.
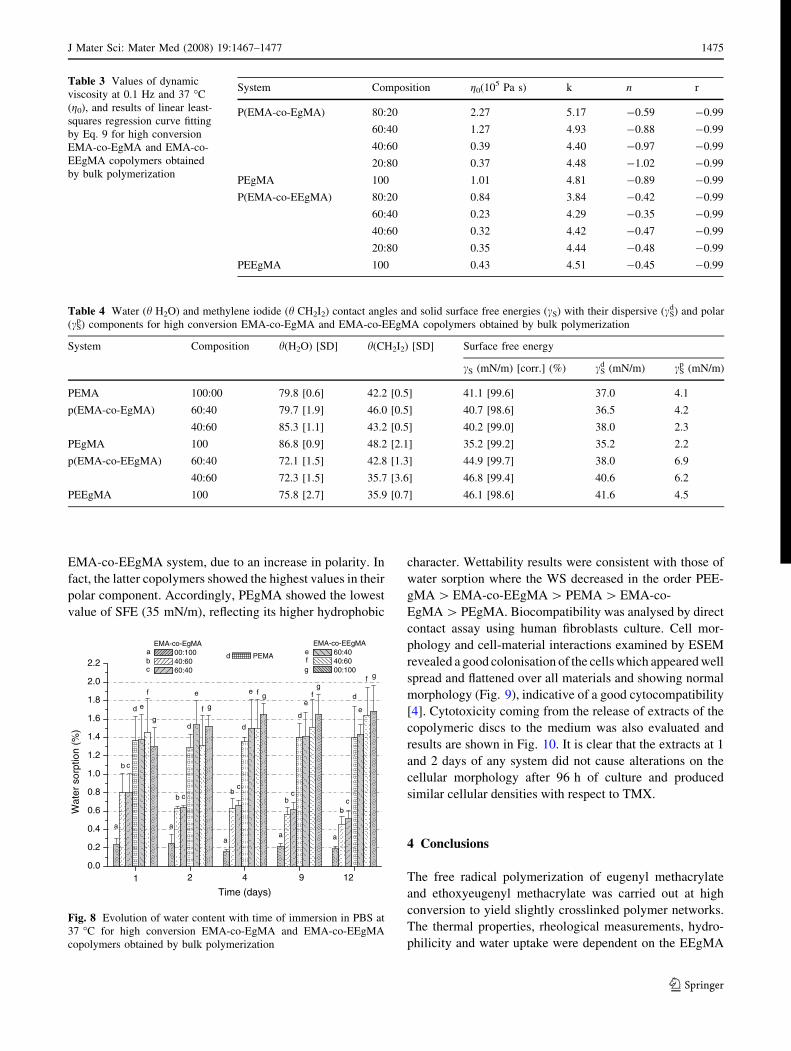
Water sorption was studied in PBS at 37 �C and results as a
function of time are shown in Fig. 8. Water sorption for
PEgMA was as little as 0.2%, it was around 0.6 for EgMA
containing copolymers whereas for PEEgMA and EEgMA
containing copolymers, WS was around 1.7. Although WS
was relatively low in all the systems, the differences found
between both types of copolymers can be attributed to the
different hydrophilicity of the eugenol derivative monomer
and to the different crosslinking degree, as observed in the
rheological study. The different levels of hydrophilicity are
manifested in their interaction with the medium, which was
evaluated through contact angle measurements considering
two liquids of opposite polarity, water and methylene iodide.
Values of contact angles (h) are summarised in Table 4 along
with those of surface free energy (SFE). Water contact angle
for PEgMA was relatively high (87 �C) and characteristic of
hydrophobic surfaces whereas that of PEEgMA was 10 �C
lower (76 �C). EgMA containing copolymers present an
intermediate behaviour between both homopolymers but the
behaviour of EEgMA containing copolymers approached
that of PEEgMA. Surface free energy was around 40 mN/m
for EMA-co-EgMA copolymers and around 46 mN/m for
0.0
2.4
2.8
3.2
3.6
4.0
4.4
4.8
5.2
5.6
( goLη
)'
Log W
EMA-co-EgMA 80:20 ( exp) 60:40 ( exp) 40:60 ( exp) 20:80 ( exp) 00:100 ( exp)
2.8
3.2
3.6
4.0
4.4
4.8
( goLη
)'
EMA-co-EEgMA 80:20 ( exp) 60:40 ( exp) 40:60 ( exp) 20:80 ( exp) 00:100 ( exp)
2.01.51.00.5
0.0
Log W
2.01.51.00.5
Fig. 7 Dependence of log (g0) with the log (W) of high conversion
EMA-co-EgMA (upper) and EMA-co-EEgMA (lower) copolymers
obtained by bulk polymerization
1474 J Mater Sci: Mater Med (2008) 19:1467–1477
123
EMA-co-EEgMA system, due to an increase in polarity. In
fact, the latter copolymers showed the highest values in their
polar component. Accordingly, PEgMA showed the lowest
value of SFE (35 mN/m), reflecting its higher hydrophobic
character. Wettability results were consistent with those of
water sorption where the WS decreased in the order PEE-
gMA [ EMA-co-EEgMA [ PEMA [ EMA-co-
EgMA [ PEgMA. Biocompatibility was analysed by direct
contact assay using human fibroblasts culture. Cell mor-
phology and cell-material interactions examined by ESEM
revealed a good colonisation of the cells which appeared well
spread and flattened over all materials and showing normal
morphology (Fig. 9), indicative of a good cytocompatibility
[4]. Cytotoxicity coming from the release of extracts of the
copolymeric discs to the medium was also evaluated and
results are shown in Fig. 10. It is clear that the extracts at 1
and 2 days of any system did not cause alterations on the
cellular morphology after 96 h of culture and produced
similar cellular densities with respect to TMX.
4 Conclusions
The free radical polymerization of eugenyl methacrylate
and ethoxyeugenyl methacrylate was carried out at high
conversion to yield slightly crosslinked polymer networks.
The thermal properties, rheological measurements, hydro-
philicity and water uptake were dependent on the EEgMA
Table 3 Values of dynamic
viscosity at 0.1 Hz and 37 �C
(g0), and results of linear least-
squares regression curve fitting
by Eq. 9 for high conversion
EMA-co-EgMA and EMA-co-
EEgMA copolymers obtained
by bulk polymerization
System Composition g0(105 Pa s) k n r
P(EMA-co-EgMA) 80:20 2.27 5.17 -0.59 -0.99
60:40 1.27 4.93 -0.88 -0.99
40:60 0.39 4.40 -0.97 -0.99
20:80 0.37 4.48 -1.02 -0.99
PEgMA 100 1.01 4.81 -0.89 -0.99
P(EMA-co-EEgMA) 80:20 0.84 3.84 -0.42 -0.99
60:40 0.23 4.29 -0.35 -0.99
40:60 0.32 4.42 -0.47 -0.99
20:80 0.35 4.44 -0.48 -0.99
PEEgMA 100 0.43 4.51 -0.45 -0.99
Table 4 Water (h H2O) and methylene iodide (h CH2I2) contact angles and solid surface free energies (cS) with their dispersive (cSd) and polar
(cSp) components for high conversion EMA-co-EgMA and EMA-co-EEgMA copolymers obtained by bulk polymerization
System Composition h(H2O) [SD] h(CH2I2) [SD] Surface free energy
cS (mN/m) [corr.] (%) cSd (mN/m) cS
p (mN/m)
PEMA 100:00 79.8 [0.6] 42.2 [0.5] 41.1 [99.6] 37.0 4.1
p(EMA-co-EgMA) 60:40 79.7 [1.9] 46.0 [0.5] 40.7 [98.6] 36.5 4.2
40:60 85.3 [1.1] 43.2 [0.5] 40.2 [99.0] 38.0 2.3
PEgMA 100 86.8 [0.9] 48.2 [2.1] 35.2 [99.2] 35.2 2.2
p(EMA-co-EEgMA) 60:40 72.1 [1.5] 42.8 [1.3] 44.9 [99.7] 38.0 6.9
40:60 72.3 [1.5] 35.7 [3.6] 46.8 [99.4] 40.6 6.2
PEEgMA 100 75.8 [2.7] 35.9 [0.7] 46.1 [98.6] 41.6 4.5
0.0
0.2
0.4
0.6
0.8
1.0
1.2
1.4
1.6
1.8
2.0
2.2g
g
g
gg
f
ff
f
f
f
ee
e
g
e
e
e
d
d
dd
d
d
cc
cc
c
cb
bb
bb
b
aaa
aa
aEMA-co-EEgMA
60:40 40:60 00:100
PEMA
EMA-co-EgMA 00:100 40:60 60:40
12941 2
)%( noitpros reta
W
Time (days)
Fig. 8 Evolution of water content with time of immersion in PBS at
37 �C for high conversion EMA-co-EgMA and EMA-co-EEgMA
copolymers obtained by bulk polymerization
J Mater Sci: Mater Med (2008) 19:1467–1477 1475
123

and EgMA content in the copolymers. Cytoxicity mea-
surements indicated that all the polymeric systems were
viable for in vivo applications.
Acknowledgements Financial support from the Comision Inter-ministerial de Ciencia y Tecnologıa, CICYT, (MAT2004-01654), NoE
EXPERTISSUES (UE contract No: 500283-2) and CIBER-BBN
(CB06-01-0013) are grateful acknowledged.
Fig. 10 Microphotographs
(2009) showing the influence of
the eluted extracts on control
TMX (upper), and EMA-co-
EgMA 50:50 (middle) and
EMA-co-EEgMA 50:50 (lower)
copolymers, collected at 1 day
(left column) and 2 days (right
column) on the cellular culture
after 96 h. Harris
haematoxylin–eosin dye
Fig. 9 ESEM images (2,0009) of human fibroblasts colonized over the control TMX (left), EMA-co-EgMA 50:50 (middle) and EMA-co-
EEgMA 50:50 (right) copolymers at 2 days
1476 J Mater Sci: Mater Med (2008) 19:1467–1477
123

References
1. A. S. HOFFMAN in ‘‘Biomaterials Science’’ (Academic Press,
San Diego, California, 1996)
2. P. CUTRECASA and C. B. ANFINSEN Ann. Rev. Biochem. 40(1971) 259
3. J. KOPECEK Polym. Med. 7 (1977) 191
4. L. ROJO, B. VAZQUEZ, J. PARRA, A. LOPEZ-BRAVO, S.
DEB and J. SAN ROMAN Biomacromolecules 7 (2006) 2751
5. M. YUWONO, A. F. SISWANDONO HAFID, A. T. POER-
NOMO, M. AIL, G. INDRAYANTO and S. EBEL In ‘‘AnalyticalProfiles of Drug Substances and Excipients’’ Vol 29 (Elsevier
Science, USA, 2002)
6. M. DOI, in ‘‘Materials Science and Technology’’, edited by E. L.
THOMAS (VHC, Weinheim, Germany, 1993, p. 389)
7. J. D. FERRY, in ‘‘Viscoelastic Properties of Polymers’’ (John
Wiley & Sons, New York, 1980)
8. H. A. BARNES, J. F. HUTTON and K. WALTER, in ‘‘AnIntroduction to Rheology’’ (Elsevier, Amsterdam, 1989)
9. F. M. FOWKES, Ind. Eng. Chem. 56 (1964) 40
10. D. K. OWENS and R. C. WENDT, J. Appl. Pol. Sci. 13 (1969)
1741
11. N. J. EVERALL, J. M. CHALMERS and P. R. GRIFFITHS
(Eds.) in ‘‘Vibrational Spectroscopy of Polymers: Principles andPractice’’ (Wiley, 2007)
12. A. K. TYAGI, V. CHOUNDARY and I. K. VARMA Eur. Polym.J. 28 (1992) 419
13. E. A. RAHIM, F. SANDA and T. MASUDA J. Macromol. Sci.A41 (2004) 133
14. S. D. SMITH, T. E. LONG and J. E. McGRATH, J. Polym. Sci.Part A Polym. Chem. 32 (1994) 1747
15. T. KASHIWAGI, A. INABA, J. E. BROWN, K. HATADA, T.
KITAYAMA and E. MASUDA, Macromolecules 19 (1986) 2160
16. P. M. WORD-ADAMS and J. M. DEALY, Macromolecules 33(2000) 7481
17. P. M. WORD-ADAMS and J. M. DEALY, Macromolecules 33(2000) 7489
J Mater Sci: Mater Med (2008) 19:1467–1477 1477
123