Embed Size (px)
Citation preview
Head Office
Commission HouseCnr Hamilton &
Ziervogel StreetsArcadia 0083
Private Bag X121Pretoria 0001
Tel: +27 (0) 12 352 1000Fax: +27 (0) 12 325 8382
www.psc.gov.za

STATE OF THE PUBLIC SERVICE REPORT 2008A Mid-Term Review of Public Service Transformation
Published in the Republic of South Africa by:
THE PUBLIC SERVICE COMMISSION (PSC)
Commission HouseCnr. Hamilton & Ziervogel Streets
Arcadia, 0083
Private Bag x121Pretoria, 0001
Tel. (012) 352-1000Fax (012) 325-8382
Website. www.psc.gov.za
National Anti-Corruption Hotline Number: 0800 701 701 (Toll-Free)
Production & Distribution by: Directorate: Communication and Information Services
Compilation by:Branch: Monitoring and Evaluation
ISBN: 978-0-621-37641-8RP: 22/2008
Date of issue: March 2008
1 SOPS Intro new 4/8/08 8:42 AM Page 1
Table of Contents
Tables i
Foreword ii
Acronyms iii
Introduction:A Mid-Term Review of Public Service Transformation 1
Key Public Service Transformation Phases Since 1994 6
Principle One:A High Standard of Professional Ethics must be Maintained 13
Principle Two:Efficient, Economic and Effective use of Resources must be Promoted 24
Principle Three:Public Administration must be Development Oriented 35
Principle Four:Services must be provided Impartially, Fairly, Equitably and without Bias 44
Principle Five:People's Needs must be Responded to and the Public must be Encouragedto Participate in Policy-Making 52
Principle Six:Public Administration must be Accountable 59
Principle Seven:Transparency must be Fostered by Providing the Public with Timely,Accessible and Accurate Information 69
Principle Eight:Good Human Resource Management and Career Development Practices, to Maximise Human Potential, must be Cultivated 75
Principle Nine:Public Administration must be Broadly Representative of the South AfricanPeople, with Employment and Personnel Management Practices Based onAbility, Objectivity, Fairness and the Need to Redress the Imbalances of thePast to Achieve Broad Representation 84
Conclusion 92
List of recent Public Service Commission and other useful reports 97
Office Addresses 108
1 SOPS Intro new 4/8/08 8:42 AM Page 2
i
Table 1: Synopsis of issues raised in previous SOPS reports 17
Table 2: Allegations of Corruption reported to the NACH 18
Table 3: Trends in financial disclosures (2004/5 - 2006/7) 20
Table 4: Synopsis of issues raised in previous SOPS reports 28
Table 5: Trends in over and under spending from 2004/05 - 2006/07 30
Table 6: Synopsis of observations and suggestions made in previousSOPS reports 40
Table 7: Synopsis of issues raised in previous SOPS reports 49
Table 8: Synopsis of issues raised in previous SOPS reports 55
Table 9: Synopsis of issues raised in previous SOPS reports 62
Table 10: Number of qualified audit opinions 63
Table 11: Departments that have received qualified audits 64
Table 12: Submission of PAs of HoDs 65
Table 13: Trends in the evaluation of the performance of HoDs 66
Table 14: Synopsis of issues raised in previous SOPS reports 71
Table 15: Synopsis of issues raised in previous SOPS reports 79
Table 16: Total number of posts versus funded vacant posts 80
Table 17: Number of grievances reported by Provincial and National Departments from January 2005 to June 2006 81
Table 18: Race representivity in the Public Service 86
Table 19: Disaggregation of race representivity in the Public Service 86
Table 20: Disaggregation of gender representivity in the Public Service 87
Table 21: Synopsis of issues raised in previous SOPS reports 88
Table 22: Gender representivity at SMS level in the Public Service 89
Table 23: Disability representivity 90
Figure 1: Comparison of Satisfaction Scores 57
Tables
Table of Figures
1 SOPS Intro new 4/8/08 8:42 AM Page 3

Foreword
ii
It is with a sense of pride that I present this seventh edition of the Stateof the Public Service Report. The report comes against thebackground of a country that has gone through fourteen years ofdemocratic rule, throughout which the guiding vision was the creationof a better life for all. An important part of the South African experiencehas always been the practice of reflection and taking stock, and it isappreciated that by constantly assessing where we come from andwhat we have been able to achieve that we will be able to improve onour efforts in going forward. I am proud to head a Constitutional bodywhose core mandate is to support this process of critical reflection andengagement, particularly around how the Public Service, as animplementation engine of the programmes of government, isperforming.
This report builds on previous editions of the SOPS series, which hasnow become a centre-stage and highly cited document on PublicService performance. The questions asked in this report on howPublic Service delivery has evolved since 2004 are questions that aregenerally in the minds of many members of society. Our country isfortunate in that the framework for assessing performance isprescribed in terms of the 9 Constitutional Values and Principles forpublic administration. The Values and Principles remain enduring.Being enduring, these Values and Principles should continue to shapepublic administration for many years to come.
In reading this report we would expect that you get a good sense of theprogress that has been made during the first part of government's thirdterm of office. You would also gain an appreciation that much moreneeds to be done, and that the quality and speed of service deliveryhas to be accelerated. It is through such acceleration that the currentgovernment can consolidate its service delivery legacy as it preparesto hand over the baton and usher in a new term of office.
I trust that you find this report useful in your deliberations and that ithelps to sustain the discourse on what good governance means inpractice in our country.
Professor Stan SangweniChairperson: Public Service Commission
1 SOPS Intro new 4/8/08 8:42 AM Page 4
iii
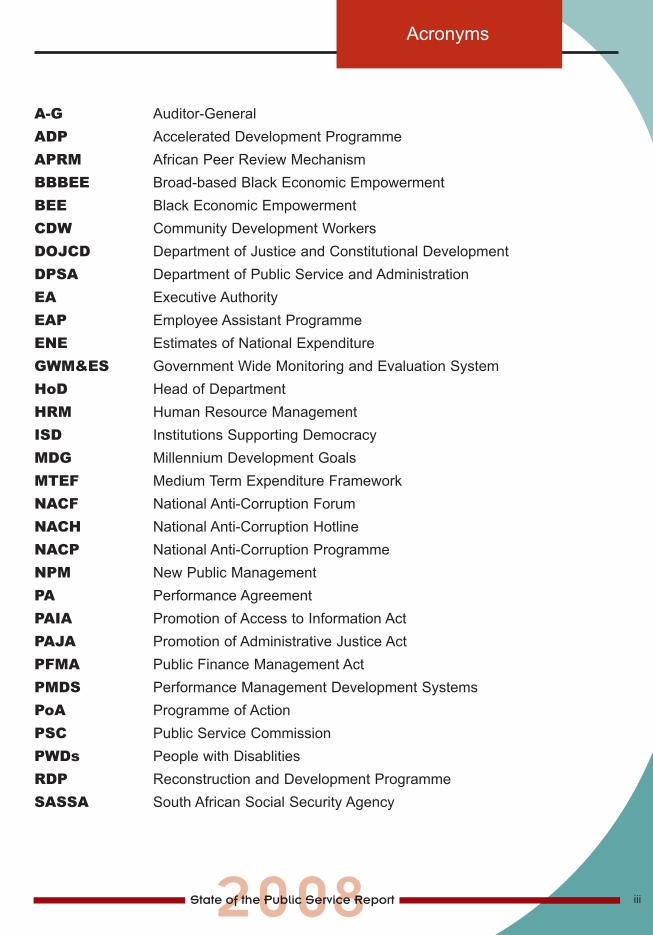
A-G Auditor-GeneralADP Accelerated Development ProgrammeAPRM African Peer Review MechanismBBBEE Broad-based Black Economic EmpowermentBEE Black Economic EmpowermentCDW Community Development WorkersDOJCD Department of Justice and Constitutional DevelopmentDPSA Department of Public Service and AdministrationEA Executive AuthorityEAP Employee Assistant ProgrammeENE Estimates of National ExpenditureGWM&ES Government Wide Monitoring and Evaluation SystemHoD Head of DepartmentHRM Human Resource ManagementISD Institutions Supporting DemocracyMDG Millennium Development GoalsMTEF Medium Term Expenditure FrameworkNACF National Anti-Corruption ForumNACH National Anti-Corruption HotlineNACP National Anti-Corruption ProgrammeNPM New Public ManagementPA Performance AgreementPAIA Promotion of Access to Information ActPAJA Promotion of Administrative Justice ActPFMA Public Finance Management ActPMDS Performance Management Development SystemsPoA Programme of ActionPSC Public Service CommissionPWDs People with DisablitiesRDP Reconstruction and Development ProgrammeSASSA South African Social Security Agency
Acronyms
1 SOPS Intro new 4/8/08 8:42 AM Page 5
iv
SAMDI South African Management Development InstituteSDIP Service Delivery Improvement PlanSMS Senior Management ServicesSOPS State of the Public Service Report
Acronyms (continued)
1 SOPS Intro new 4/8/08 8:42 AM Page 6

1
Introduction
A Mid-Term Review of PublicService Transformation
2 SOPS Chap Intro new 4/8/08 8:41 AM Page 1

PUBLIC SERVICE COMMISSION
2
Introduction
The State ofthe PublicServiceReports :2004 - 2007
The Public Service has undergone various transformation processessince the advent of democratic rule in 1994. As an institution entrustedwith the mandate to, among others, promote the values and principlesof public administration enshrined in Chapter 10 of the Constitution,1
the Public Service Commission (PSC) has, throughout this period,provided insightful reports on the progress of this transformation. Inaddition, the PSC has annually consolidated findings from its oversightactivities as well as other selected initiatives to produce a State of thePublic Service (SOPS) report. The SOPS report provides a high levelanalytical overview of the performance of the Public Service and hasbecome a critical source document in this regard.
This report is the seventh edition of the SOPS reports produced by thePSC. With the third term of office for the democratic governmentcoming to an end in 2009, the PSC deemed it fit to focus this editionof SOPS on an overview of Public Service transformation since thebeginning of this term. Guided by this focus, the report identifies keymilestones, critical issues that have shaped Public Servicetransformation as well as recurring concerns and draws attention tospecific considerations for accelerating implementation in theremaining period of this term of office for government. Organizedaccording to the 9 Constitutional values and principles of publicadministration, the report draws primarily from the findings of the PSCover the period 2004 to 2007, and supplements these with relevantfindings and conclusions from other sources.
As high level overviews that annually analyse Public Serviceperformance, SOPS reports are a useful reference source from whichto identify and review key performance trends over time. Accordingly,this report draws from the SOPS reports released since 2004 to informits midterm review. For each of the Constitutional values andprinciples, the report provides a synopsis of key observations andsuggestions from previous SOPS reports, and uses these as a basisfor identifying recurring themes for analysis and follow up.
The PSC has, for each of its SOPS reports since 2004, identified apertinent theme on which to base its analysis and recommendations.The 2004 edition of the SOPS report, for example, focused onprogress achieved in broad terms in the first decade of democracy.While acknowledging the progress made, the report observed that it
1 Republic of South Africa. Constitution of the Republic of South Africa. Act 108 of 1996.
2 SOPS Chap Intro new 4/8/08 8:41 AM Page 2
3
Introduction
was important to “…shift to another phase, one in which the goodfeatures of our State are consolidated and built upon while those areasneeding attention are systematically addressed”.2 Overall, the reportindicated that the key challenges were around improving the efficiencyof the Public Service and getting its various components to worktogether more effectively. Through SOPS 2004 the PSC looked backat a decade of Public Service transformation, thus creating ameaningful base from which to carefully consider what could be donebetter during the second decade.
Following on the above retrospective report, in 2005 the PSC releasedan edition of SOPS which was forward looking, identifying keychallenges for the Second Decade of Democracy as well as proposingstepping stones to guide implementation.3 The report concluded that acoherent policy and institutional base had been created, and thatauthentic efforts had been made to ensure implementation. However,the report noted that there was still a need to consolidate and improvethe implementation of the public management frameworks and toaddress negative workplace cultures that were hampering PublicService effectiveness.
The challenges identified in the above reports highlighted theimportance of the Public Service to acquire and demonstrate thenecessary capacity. Accordingly, in 2006 the PSC released its nextedition of the SOPS report under the theme Girding the Public Servicewith the Appropriate Capacity for Effective Service Delivery andAdherence to the Values of the Constitution.4 While recognizing themulti-faceted nature of capacity, the report emphasized the critical roleof human resource capacity and how it can be optimally used toimprove the performance of government. The report noted thatsignificant progress had been made to put in place the necessarylegislative, normative and regulatory framework. The challenge was toensure that the Public Service enhances its capacity to effectivelyimplement these frameworks on a sustained basis.
However, efforts to build Public Service capacity must be guided bythe priorities which government seeks to deliver on. In this regard, thePSC recognized that the promotion of growth and development hasbeen a high priority for government from the inception of ourdemocracy. All organs of the State as well as business and civilsociety are expected to actively participate in processes that will lead
2 Republic of South Africa. Public Service Commission. State of the Public Service Report. 2004.3 Republic of South Africa. Public Service Commission. State of the Public Service Report. 2005.4 Republic of South Africa. Public Service Commission. State of the Public Service Report. 2006.
2 SOPS Chap Intro new 4/8/08 8:41 AM Page 3
PUBLIC SERVICE COMMISSION
4
Focus of thisreport
to the achievement of this priority, and thus raise the standard andquality of life of citizens. Guided by this priority, the PSC in 2007released its sixth edition of the SOPS report under the themePromoting Growth and Development through an Effective PublicService.5
The 2007 SOPS report noted that significant milestones have beenachieved in such areas as economic growth, the lowering of inflation,and improving the international competitiveness as well asgovernance ratings of the country. Other areas of progress that thereport noted are the establishment of various legal frameworks,policies and programmes that guide good governance. However, thereport pointed out that the Public Service needed to deepen theimplementation of its programmes in such a manner that they canimpact effectively on the well-being of citizens. An importantconsideration in this regard would be to focus on those aspects ofpublic administration that are important high impact areas fordeepening growth and development.
Collectively, the SOPS reports mentioned in the aforegoing, raisecertain key recurring issues on which the PSC has consistently raisedconcerns regarding the pace of progress in Public Servicetransformation. These include how departments report on results (inaddition to outputs), the manner in which poverty reduction projectsare being managed and integrated, the extent to which the fairnessand impartiality are being promoted through the effectiveimplementation of the Promotion of Administrative Justice Act, theinvolvement of citizens in policy-making and implementation,adherence to human resource management policies, and theachievement of representivity targets (especially with regard to theemployment of people with disabilities). It is now necessary andopportune to take stock and review the progress the Public Servicehas made since 2004 to improve its performance.
This Report provides a mid-term review of Public Servicetransformation since 2004. The overall term of office for government isfive years, which means that starting from 2004 the mid-term for thecurrent government would effectively be the first quarter of 2007.However, for purposes of this report, the analysis considers the periodstarting from 2004 to the rest of the 2007 calendar year as the mid-term. The Report looks at the key transformation priorities that were
5 Republic of South Africa. Public Service Commission. State of the Public Service Report. 2007
2 SOPS Chap Intro new 4/8/08 8:41 AM Page 4
5
Introduction
Outline of thereport
set for the Public Service in 2004, assesses the progress madetowards achieving them, and highlights the challenges that still lieahead. Such a review is necessary to facilitate a groundedappreciation of the milestones that have been achieved to date and toidentify areas of concern which government should particularly payattention to as its current term of office draws to a close.
The next section of this report provides an overview of the differentphases of Public Service transformation in the country since 1994.This is then followed by nine sections, each of which takes anindividual Constitutional value and principle and assesses theprogress made towards the transformation of the Public Service since2004. The last section of the report provides concluding remarks andhighlights key considerations for enhancing Public Servicetransformation.
2 SOPS Chap Intro new 4/8/08 8:41 AM Page 5
6
Key Public ServiceTransformation
Phases Since 1994
2 SOPS Chap Intro new 4/8/08 8:41 AM Page 6
7
Key Public Service Transformation Phases since 1994
Introduction
Rationalisationand PolicyDevelopment(1994 - 1999)
The transformation of the South African Public Service has been apressing priority for government following the transition to democraticrule in 1994. This should not come as a surprise given that the PublicService is a key institution through which government interfaces withthe public to deliver services, and it was, therefore, found necessary totransform it in such a manner that it can be oriented towards the vision,values and principles of the new democratic dispensation. In thisregard, a key consideration was that the country “…cannot lay hold ofan apartheid or colonial state machinery and try to use it to achievewhat would in fact be an anti-thesis of what that state was...”6 Postapartheid South Africa, therefore, required the creation of a new orderand the Public Service that was inherited in 1994 was inappropriate forthis order.7
Since 1994 the Public Service has undergone a number oftransformation processes that sought to reposition it as a keyimplementation arm of the state. These transformation processes canbe divided into three broad phases, namely, the Rationalisation andPolicy Development phase (1994 - 1999), the Modernisation andImplementation phase (1999 - 2004) and the Accelerated Implementationphase (2004 - current).8 This three-phase delineation is provided inorder to highlight the key transformation concerns that characterisedthe different periods, leading up to and including the mid term period,which is the focus of this report. These phases are also an importantbackground against which to understand the various observations andsuggestions made by the PSC's SOPS reports during the current termof democratic government.
The first open and non-racial democratic elections in South Africa tookplace in 1994 following a negotiated settlement involving variouspolitical groups. Mr. Nelson Mandela became the first Presidentfollowing the elections, and this period is generally regarded as an eraof “a nation seeking reconciliation and unity after decades of racial andpolitical tensions”.9 Measures, therefore, had to be put in place toensure that the pace and direction of transformation is in keeping withthe cherished ideals of reconciliation and nation-building. In thisregard, one of the immediate priorities was to rationalise the PublicService into one institution to replace the 11 disparate racially- and
6 Netshitenzhe, J. Government Communication in Public Service Transformation and the African Renaissance. 11 May 1999.7 Ibid.8 Note: There is an overlap from one phase to another because of alignment to the country's electoral periods which start in April every 5 years.9 Dickow, H and Moller, V. South Africa's Rainbow People, National Pride and Optimism: A Trend Study. Social Indicators Research, 59 (2). pp. 175-202. 2002.
2 SOPS Chap Intro new 4/8/08 8:41 AM Page 7
PUBLIC SERVICE COMMISSION
8
10 Republic of South Africa. Department of Public Service and Administration. White Paper on the Transformation of the Public Service. November 1995.11 Ibid.12 Republic of South Africa. The Constitution of the Republic of South Africa. Act 108 of 1996.13 Republic of South Africa. Department of Public Service and Administration. White Paper on Transforming Public Service Delivery. 1997.14 Republic of South Africa. Department of Public Service and Administration. White Paper on Affirmative Action in the Public Service.1998.
ethnically-based public services inherited from the apartheidestablishment. Alongside this rationalisation process, an importantcomplementary priority was the revision of existing policies to createthe necessary regulatory and legislative frameworks that are in linewith the imperatives of the new democratic establishment. Most of thetransformation efforts of this period were guided by the White Paper onthe Transformation of the Public Service which was published in1995.10 The White Paper sought to set a framework for “…atransformed Public Service which is representative, coherent,transparent, efficient, effective, accountable and responsive to theneeds of all”.11
Guided by the above vision, the White Paper identified the followingeight key transformation priorities:
• Rationalisation and restructuring of the Public Service.• Institution building and management to promote greater
accountability and organisational and material effectiveness.• Representivity and affirmative action.• Transforming service delivery to meet basic needs and redress past
imbalances.• Democratisation of the state.• Human resource development.• Improved employment conditions and labour relations.• The promotion of a professional service ethos.
Given that at the time the White Paper came into effect it was only ayear since the new government had come into office, it wasrecognised that more legislative and normative frameworks would stillfollow to further sharpen the transformation trajectory of the PublicService. Indeed, the White Paper was followed by a range of otherlegislative instruments, including the Constitution,12 the White Paper onTransforming Public Service Delivery,13 and the White Paper onAffirmative Action in the Public Service,14 among others. Thedevelopment of these policies ensured that by the time of the secondterm of democratic government, the legislative foundation had alreadybeen laid to facilitate reconciliation and rationalise the Public Serviceinto a single institution.
2 SOPS Chap Intro new 4/8/08 8:41 AM Page 8
9
Key Public Service Transformation Phases since 1994
Modernisationand Implementation(1999 - 2004)
The second national democratic elections were held in 1999, andthese led to Mr. Thabo Mbeki taking over as the next President ofSouth Africa. Given what had already been put in place during thefirst phase of transformation, this new term of office for thedemocratically elected government was seen as that of delivery.15
During this period the Public Service transformation agenda wastaken further through implementation and the introduction ofprocesses that sought to promote modernisation in administrationand service delivery.
Through the introduction of, among others, Public ServiceRegulations,16 amendments to the Public Service Act,17 the PublicFinance Management Act,18 Treasury Regulations19 and a number ofcollective agreements reached between government and organisedlabour, greater space was provided for Executing Authorities andHeads of Department to be responsible for the overall running of theirrespective departments. This decentralisation was introduced in orderto empower departments to exercise decision-making authority andthus strengthen the service delivery value chain. The creation of apolicy framework and institutional arrangements for electronicgovernment also took shape, and this sought to enable the PublicService to take advantage of the opportunities for efficiency andeffectiveness that could be derived from the use of InformationTechnologies.20
While all these initiatives were being undertaken, there was,nonetheless, recognition of the fact that the Public Servicetransformation process was still far from over.21 Accordingly, thefollowing key priorities were identified for the second term ofdemocratic government:22
• Rightsising the Public Service;• Raising the skills levels within the public sector and retaining
professional staff;• Improving management, financial accountability and service
delivery;• Combating corruption and the abuse of public resources;
15 Note: See for example, Dickow, H and Moller, V. South Africa's Rainbow People, National Pride and Optimism: A Trend Study. Social Indicators Research, 59 (2).pp. 175-202. 2002.
16 Republic of South Africa. Department of Public Service and Administration. Public Service Regulations. 2001.17 Republic of South Africa. Department of Public Service and Administration. Public Service Act. 1994.18 Republic of South Africa. National Treasury. Public Finance Management Act. Act 1 of 1999.19 Republic of South Africa. National Treasury. Treasury Regulations. 2001.20 Republic of South Africa. Department of Public Service and Administration. Electronic Government - The Digital Future: A Public Service IT Policy Framework.
February 2001.21 Mbeki, T. President of the Republic of South Africa. The State of the Nation Address by the President of the Republic of South Africa. National Assembly. 4 February
2000.22 Adapted from Mbeki, T. The State of the Nation Address by the President of the Republic of South Africa. National Assembly. 4 February 2000.
2 SOPS Chap Intro new 4/8/08 8:41 AM Page 9
AcceleratingImplementation(2004 - to date)
23 Note: See for example, Republic of South Africa. The Presidency. Towards a Ten-Year Review. Synthesis Report on the Implementation of GovernmentProgrammes. 2003.
24 Republic of South Africa. The Presidency. A Planning Framework for Government. Medium-Term Strategic Framework. Undated.25 Mbeki, T. President of the Republic of South Africa. State of the Nation Address to the Houses of Parliament, Cape Town, 8 February 2004.
PUBLIC SERVICE COMMISSION
10
• Improving efforts to further motivate/improving the morale of all public sector workers; and
• Increasing the proportion of public funds spent on investment.
The above constitute a basic reference point for transformation effortsfollowing the second democratic elections in 1999. However, ensuringthat these priorities are effectively implemented proved to be a morechallenging task. Adherence to key pieces of legislation remainedinadequate, and capacity constraints slowed down theimplementation of departmental plans and programmes. Goingforward, what was required, therefore, was a deepening of theimplementation process.
At the beginning of the second decade of democracy in 2004, it wasgenerally acknowledged that the key policy frameworks fortransformation had been put in place.23 An important follow up step wasto consolidate the gains made and to accelerate implementation. Inorder to provide a strategic focus for such consolidation andacceleration, the electoral mandate given to government set out clearobjectives with targets for the period ending in 2009.24 The targetswere clustered around the following broad themes:
• A growing economy;• Sustainable livelihoods;• Access to services;• Comprehensive social security;• Crime and corruption;• Constitutional rights and governance; and• Cooperation with Africa and the World.
In line with the emphasis on implementation, the electoral mandatealso underscored the importance of creating the necessary capacityto achieve the above objectives. Guided by this mandate, PresidentThabo Mbeki announced in his 2004 State of the Nation Addressthat “we do not foresee that there will be any need for new andmajor policy initiatives. The task we will all face during the decadeahead will be to ensure the vigorous implementation of thesepolicies, to create the winning people-centered society of which[former President] Nelson Mandela spoke.”25
2 SOPS Chap Intro new 4/8/08 8:41 AM Page 10
11
Key Public Service Transformation Phases since 1994
Conclusion
SOPS reports produced by the PSC at the time echoed thesesentiments and acknowledged that while challenges still remained,progress had been made as well. The PSC went even further toprovide pointers towards the transformation priorities that neededattention post-2004. These included:26
• Beefing up the capacity of the state to deliver.• Strengthening public management.• Fostering and nurturing Public Service Leadership.• Accelerating service delivery.• Achieving social development and addressing poverty through
mechanisms that promote greater public participation.
The second decade of democracy was, therefore, largely viewed as atime to act. Based on an assessment by government that “the tide ...[had]...turned”, a key focus for the new term of office was “...to take thistide at the flood, further to progress towards the achievement of thegoals for which so many of our people sacrificed.”27
Any assessment of the post-2004 transformation phase should,therefore, take into account the implementation focus that was pointedout by government. This approach does not necessarily suggest thatno further pieces of legislation were introduced after 2004. Indeed, itshould be noted that during this period other policy changes were alsointroduced. Notably, the Public Service Act was amended,28 and a newBill on the creation of a Single Public Service is underway.29 Theselegislative developments were arguably the most profound since thepolicy changes introduced in the mid- to late 90s. However, thelegislative review initiatives did not constitute a major focus of thetransformation process after 2004.
The Public Service remains a key institution through whichgovernment can realise its commitment to bettering the lives ofcitizens. As an important implementation agency of the state, thePublic Service has received a lot of attention since 1994 throughefforts to position it to better deliver on the priorities ofgovernment.
It is, therefore, fitting that as the third term of democratic government
26 Republic of South Africa. Public Service Commission. State of the Public Service Report. 2004.27 Mbeki, T. President of the Republic of South Africa. State of the Nation Address at the Opening of Parliament. Cape Town. 14 February 2003. 28 Republic of South Africa. Department of Public Service and Administration. Public Service Act Amendment Bill. 2007.29 Republic of South Africa. Department of Public Service and Administration. Draft Single Public Service Bill. 2007.
2 SOPS Chap Intro new 4/8/08 8:41 AM Page 11
PUBLIC SERVICE COMMISSION
12
nears its end, there is an assessment which reflects on the progressthat has been made with the deepening of the transformation agendaof Public Service. The assessment should also highlight what stillneeds to be done as the country approaches the new term ofgovernment that is due to start in 2009.
2 SOPS Chap Intro new 4/8/08 8:41 AM Page 12

13
Principle 1
A High Standard of ProfessionalEthics must be Maintained
3 SOPS Principal 1 new 4/8/08 8:40 AM Page 1
PUBLIC SERVICE COMMISSION
14
Introduction
Mid-Termreview
The global discourse on good governance is underpinned by a call forgovernments to be proactive in fighting the spread of corruption and inpromoting integrity-driven forms of administration. In this context, stateinstitutions such as the Public Service are expected to serve asexemplars and promote and maintain a high standard of professionalethics. Achieving this standard requires a strong ethics infrastructuresupported by enabling policies and a commitment to implement. InSouth Africa, as with other areas of the transformation agenda of thePublic Service, by 2004 government had managed to put in place arange of key policy instruments and normative frameworks necessaryto promote and support a high standard of professional ethics. Inaddition, South Africa has committed itself to a range of multi-lateralanti-corruption agreements and has acceded to various internationalinstruments on anti-corruption. Collectively, these developments havehelped shape the ethical identity of the Public Service and resonatedwith government's commitment to ethical administration.
As the end of the third term of democratic government approaches, it iscrucial that the gains made towards building an integrity-driven PublicService are consolidated and that there is a deepening ofimplementation. This consolidation is particularly important in the currentcontext where there are reports that suggest that public confidence inthe country's institutions and leaders has dropped.30 The risk is thatgovernment may be making strides in promoting ethical administration,but in the mind of the public there may be a sense that the standard ofethics is deteriorating instead of improving. These perceptions may notalways be supported by the actual experiences of the public,31 but theirpotential impact on social cohesion and nation building should not beunderestimated. The remaining period leading up to the 2009 electionswill have to be used optimally to address the real causes of this drop inpublic confidence if a legacy of a government that has remainedcommitted to fighting corruption is to be left.
In keeping with the general post-2004 focus on deepeningimplementation, important milestones were realised in the fight againstcorruption. One of these was the promulgation of the Prevention andCombating of Corruption Activities Act, 2004 (Act 12 of 2004). The Actis aimed at preventing and combating corrupt activities and providesfor specific requirements for reporting corruption.32 Among others, the
30 Institute for Justice and Reconciliation. Transformation Audit: Leadership and Legitimacy. 2007.31 Mattes, R. Good News and Bad News: Public Perceptions of Crime, Corruption and Government. Crime Quarterly (18). 2006.32 Republic of South Africa. Prevention and Combating of Corrupt Activities Act. Act No. 12 of 2004.
3 SOPS Principal 1 new 4/8/08 8:40 AM Page 2
15
Principle 1
Act criminalises corruption and corrupt activities and outlinesinvestigative measures for dealing with such activities. The passing ofthe Act strengthened the legislative base for fighting corruption as thecountry entered the second decade of democracy.
In promoting the Act among the public it was important to move awayfrom the technical legal jargon and release user-friendly guidelines.Accordingly, a set of guidelines on the implementation of the Act waspublished to simplify the content of the Act and to make the publicaware of their responsibilities and obligations in dealing withcorruption.33 The release of the Guidelines was, therefore, a usefulstep in the direction of empowering the public and deepeningcollaboration in anti-corruption efforts.
Possibly the most visible and collaborative anti-corruption effort post2004 was the creation of the National Anti-Corruption Hotline (NACH).Prior to 2004, there were different department-specific and provincialhotlines for this purpose, a practice which led to poor coordination andinefficient implementation.34 The NACH provides a 'one-stop'mechanism for members of the public to report acts of corruption andcreates an opportunity for different role-players to cooperate better inreceiving and handling allegations of misconduct. Indeed, the NACHhas turned out to be a widely used mechanism to report corruption,and each year the PSC has witnessed an increase in the level of itsutilisation.
The strong partnership dimension characteristic of South Africa's fightagainst the spread of corruption continued during this period, andmanifested further when parties to the National Anti-Corruption Forum(NACF) - government, business and civil society - adopted a NationalAnti-Corruption Programme (NACP) in June 2005.35 The NACP wasdeveloped to give effect to key resolutions from the Second NationalAnti-Corruption Summit held in March 2005. The adoption of theprogramme was a first, and represented a deepening of commitmentby the parties to heighten their cooperation in the fight againstcorruption. Not only did the NACP give expression to practicalprojects that adequately took advantage of the partnership approachpromoted by the Forum, but it gave more action-oriented content to thestrategies of the NACF, and created a yard-stick through which theprogress of the Forum could be assessed.36
33 National Anti-Corruption Forum. Guide to the Prevention and Combating of Corrupt Activities. 2007.34 Republic of South Africa. Public Service Commission. Measuring the Effectiveness of the National Anti-Corruption Hotline. 2007.35 Republic of South Africa. Department of Public Service and Administration. Report on the Review and Impact Assessment of the Extent to which Departments and
Organisational Components have Complied with the Minimum Anti-Corruption Requirements. 2007.36 Ramsingh, O and Dobie, K. Case Study on the South African National Anti-Corruption Forum. Undated.
3 SOPS Principal 1 new 4/8/08 8:40 AM Page 3

PUBLIC SERVICE COMMISSION
16
The post-2004 ethics landscape also witnessed a shift in the emergingdebates. While there still remained a strong focus on anti-corruptionefforts, increasingly attention turned towards deepening the debate onthe complex nature of potential conflicts of interest. Prior to 2004,most of the focus in this regard was the implementation of theFinancial Disclosure Framework for senior managers, in terms ofwhich senior managers in the Public Service are required to disclosetheir financial interests regarding, among others, shares, directorships,property, and remunerated work outside the Public Service. However,there has since been a process of much deeper engagement on thismatter, effectively raising the debate beyond a narrow focus ondeclaring potential conflicts of interest. While encouraging, the PSCremains disappointed by the limited movement on the policy options itproposed in the area of conflicts of interest.37
Sustained engagement on ethical integrity is important especially asthe country has also taken firm moves in the direction of voluntarilyopening itself to public scrutiny. A defining moment in this regard wasin 2006 when South Africa became the eighth country to be voluntarilyreviewed through the African Peer Review Mechanism (APRM).38 Inthe country's trajectory towards promoting good governance, this hasmarked an important and bold step, especially because the processinvolves systematic public scrutiny from a range of local stakeholdersas well as assessors from other parts of the African continent. TheAPRM Country Report commended South Africa on the anti-corruptioninstitutions and pieces of legislation that have been put in place.However, the Report further noted that while tangible results havebeen achieved, capacity constraints have compromised effectiveimplementation.39
Beyond the APRM process, it would be important to maintain themomentum of systematic public scrutiny. Regionally, the Mo IbrahimIndex of African Governance offers a mechanism for heightenedscrutiny on government practices. Developed and implemented underthe auspices of the Mo Ibrahim Foundation, the Index measuresprogress in 48 Sub-Saharan countries in terms of safety and security,the rule of law, transparency and corruption, participation and humanrights, sustainable economic development, and human development.40
In a report that was released in 2007 (using 2005 data), the Indexrated South Africa fifth (after Mauritius, Seychelles, Botswana andCape Verde).41 While there is prize money awarded as part of the
37 Republic of South Africa. Public Service Commission. Report on Managing Conflicts of Interest in the Public Service. 2006.38 Note: The APRM was developed as part of the New Partnership for Africa's Development, and is an instrument through which member states of the African Union
volunteer to be reviewed to establish compliance with specified values, principles and codes of good governance.39 The New Partnership for Africa's Development. African Peer Review Mechanism. APRM Country Review Report No. 4. Country Review Report Republic of South
Africa. May 2007.40 Mo Ibrahim Foundation. Ibrahim Index of African Governance. 2007. (http://www.Moibrahimfoundation.org).41 Ibid.
3 SOPS Principal 1 new 4/8/08 8:40 AM Page 4
17
Principle 1
application of the Index, the principle of encouraging good governanceefforts should be the bigger reward.42 The strides made thus far inSouth Africa bode well for the inculcation of ethical integrity in publicadministration, and a key issue for the country is the readiness andwillingness to learn from past experience to strengthen our efforts.
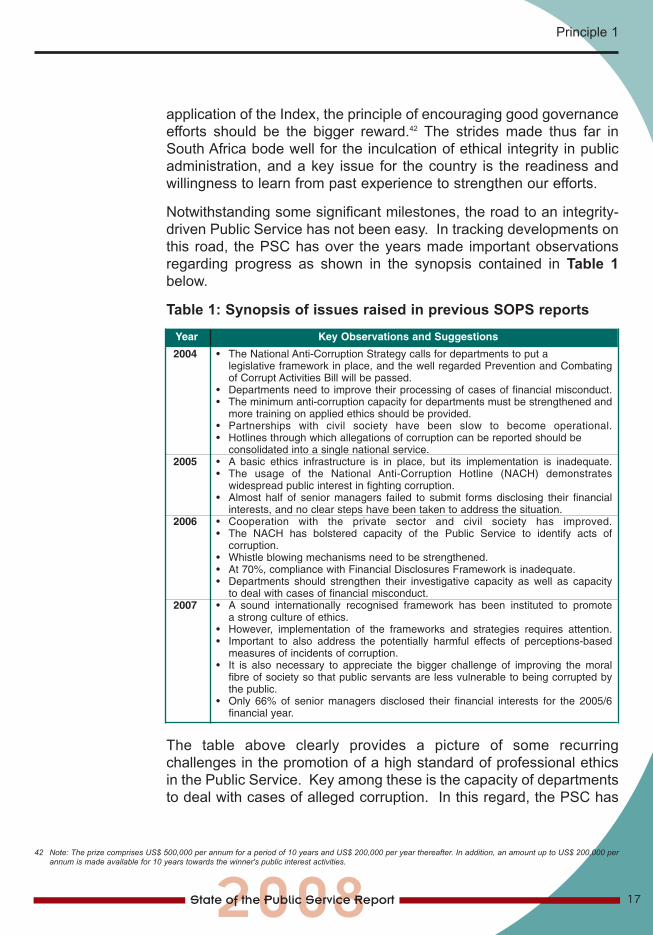
Notwithstanding some significant milestones, the road to an integrity-driven Public Service has not been easy. In tracking developments onthis road, the PSC has over the years made important observationsregarding progress as shown in the synopsis contained in Table 1below.
Table 1: Synopsis of issues raised in previous SOPS reports
The table above clearly provides a picture of some recurringchallenges in the promotion of a high standard of professional ethicsin the Public Service. Key among these is the capacity of departmentsto deal with cases of alleged corruption. In this regard, the PSC has
42 Note: The prize comprises US$ 500,000 per annum for a period of 10 years and US$ 200,000 per year thereafter. In addition, an amount up to US$ 200,000 perannum is made available for 10 years towards the winner's public interest activities.
2004 • The National Anti-Corruption Strategy calls for departments to put a legislative framework in place, and the well regarded Prevention and Combatingof Corrupt Activities Bill will be passed.
• Departments need to improve their processing of cases of financial misconduct.• The minimum anti-corruption capacity for departments must be strengthened and
more training on applied ethics should be provided.• Partnerships with civil society have been slow to become operational.• Hotlines through which allegations of corruption can be reported should be
consolidated into a single national service.2005 • A basic ethics infrastructure is in place, but its implementation is inadequate.
• The usage of the National Anti-Corruption Hotline (NACH) demonstrates widespread public interest in fighting corruption.
• Almost half of senior managers failed to submit forms disclosing their financialinterests, and no clear steps have been taken to address the situation.
2006 • Cooperation with the private sector and civil society has improved.• The NACH has bolstered capacity of the Public Service to identify acts of
corruption.• Whistle blowing mechanisms need to be strengthened.• At 70%, compliance with Financial Disclosures Framework is inadequate. • Departments should strengthen their investigative capacity as well as capacity
to deal with cases of financial misconduct.2007 • A sound internationally recognised framework has been instituted to promote
a strong culture of ethics.• However, implementation of the frameworks and strategies requires attention.• Important to also address the potentially harmful effects of perceptions-based
measures of incidents of corruption.• It is also necessary to appreciate the bigger challenge of improving the moral
fibre of society so that public servants are less vulnerable to being corrupted bythe public.
• Only 66% of senior managers disclosed their financial interests for the 2005/6financial year.
Year Key Observations and Suggestions
3 SOPS Principal 1 new 4/8/08 8:40 AM Page 5
PUBLIC SERVICE COMMISSION
18
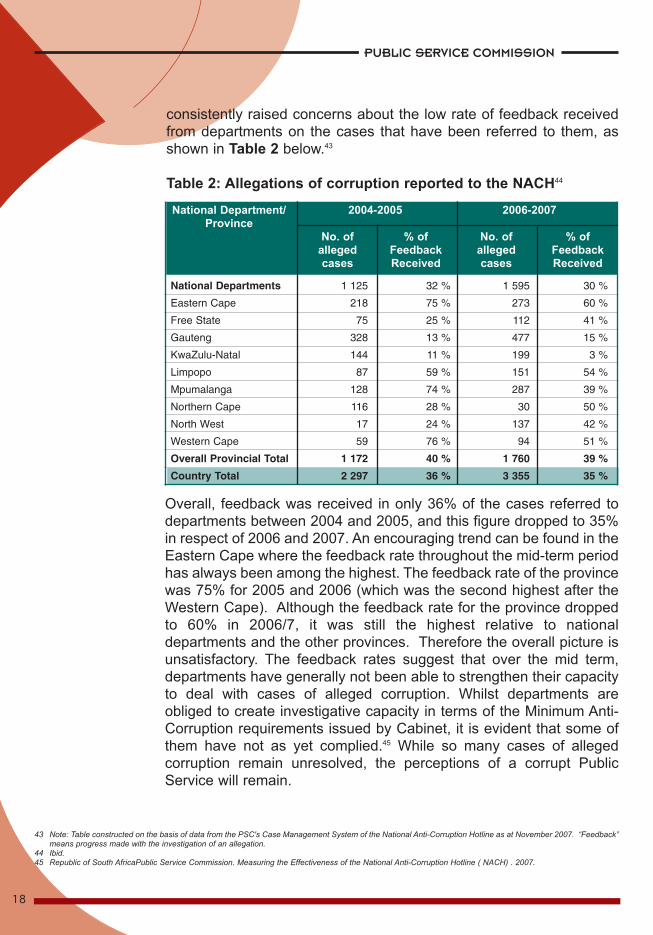
consistently raised concerns about the low rate of feedback receivedfrom departments on the cases that have been referred to them, asshown in Table 2 below.43
Table 2: Allegations of corruption reported to the NACH44
43 Note: Table constructed on the basis of data from the PSC's Case Management System of the National Anti-Corruption Hotline as at November 2007. “Feedback”means progress made with the investigation of an allegation.
44 Ibid.45 Republic of South AfricaPublic Service Commission. Measuring the Effectiveness of the National Anti-Corruption Hotline ( NACH) . 2007.
National Departments 1 125 32 % 1 595 30 %
Eastern Cape 218 75 % 273 60 %
Free State 75 25 % 112 41 %
Gauteng 328 13 % 477 15 %
KwaZulu-Natal 144 11 % 199 3 %
Limpopo 87 59 % 151 54 %
Mpumalanga 128 74 % 287 39 %
Northern Cape 116 28 % 30 50 %
North West 17 24 % 137 42 %
Western Cape 59 76 % 94 51 %
Overall Provincial Total 1 172 40 % 1 760 39 %
Country Total 2 297 36 % 3 355 35 %
National Department/ 2004-2005 2006-2007Province
No. of % of No. of % of alleged Feedback alleged Feedbackcases Received cases Received
Overall, feedback was received in only 36% of the cases referred todepartments between 2004 and 2005, and this figure dropped to 35%in respect of 2006 and 2007. An encouraging trend can be found in theEastern Cape where the feedback rate throughout the mid-term periodhas always been among the highest. The feedback rate of the provincewas 75% for 2005 and 2006 (which was the second highest after theWestern Cape). Although the feedback rate for the province droppedto 60% in 2006/7, it was still the highest relative to nationaldepartments and the other provinces. Therefore the overall picture isunsatisfactory. The feedback rates suggest that over the mid term,departments have generally not been able to strengthen their capacityto deal with cases of alleged corruption. Whilst departments areobliged to create investigative capacity in terms of the Minimum Anti-Corruption requirements issued by Cabinet, it is evident that some ofthem have not as yet complied.45 While so many cases of allegedcorruption remain unresolved, the perceptions of a corrupt PublicService will remain.
3 SOPS Principal 1 new 4/8/08 8:40 AM Page 6
19
Principle 1
Rather than just accept that departments were unwilling to addressthis worrying situation, the PSC attempted to understand theunderlying reasons. The PSC studies show that the capacitychallenges faced by departments with respect to handling allegationsof corruption are multi-faceted. It was found in KwaZulu-Natal, forexample, that not enough resources were being made available tocreate posts and employ staff for this purpose.46 Where posts hadbeen created, they were mostly at salary levels 6 - 8 (StateAdministration Officers) and 9 - 12 Assistant/Deputy Directors).47
These resource limitations are also compounded by weaknesses insystems and procedures. In the Free State, it was found that only twodepartments had investigative procedures in place.48 Processes toensure timely referral of cases to departments were also found to beunsatisfactory. In KwaZulu-Natal, some cases only reached the pointof investigation six months after they had been referred to the provinceby the PSC.49
With such limited resources being availed, it cannot be expected thatdepartments will be able to build the required investigative capacity todeal with cases of alleged corruption. All these institutional constraintscompromise the effectiveness of the NACH as well as government'soverall anti-corruption drive.
Constraints on departmental capacity also emerge in managingpotential conflicts of interest among officials. Trends in themanagement of conflicts of interest among senior managers showthat departments face capacity limitations in achieving the effectiveimplementation of the Financial Disclosure Framework for seniormanagers. As shown in the synopsis contained in Table 3 on thenext page, the PSC has during the period under review continued tomonitor and report on the implementation of the Framework andcompliance levels have always been below the required target of100%.
46 Republic of South Africa. Public Service Commission. Assessment of Professional Ethics in KwaZulu-Natal. 2007.47 Ibid.48 Republic of South Africa. Public Service Commission. Assessment of Professional Ethics in the FreeState. 2007.49 Republic of South Africa. Public Service Commission. Assessment of Professional Ethics in KwaZulu Natal. 2007.
3 SOPS Principal 1 new 4/8/08 8:40 AM Page 7
PUBLIC SERVICE COMMISSION
20
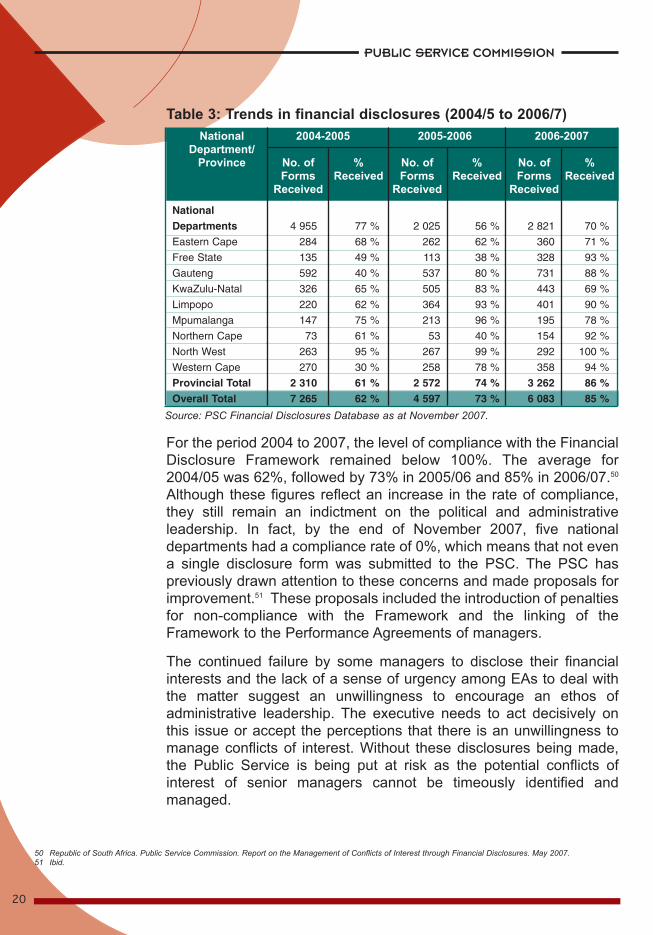
For the period 2004 to 2007, the level of compliance with the FinancialDisclosure Framework remained below 100%. The average for2004/05 was 62%, followed by 73% in 2005/06 and 85% in 2006/07.50
Although these figures reflect an increase in the rate of compliance,they still remain an indictment on the political and administrativeleadership. In fact, by the end of November 2007, five nationaldepartments had a compliance rate of 0%, which means that not evena single disclosure form was submitted to the PSC. The PSC haspreviously drawn attention to these concerns and made proposals forimprovement.51 These proposals included the introduction of penaltiesfor non-compliance with the Framework and the linking of theFramework to the Performance Agreements of managers.
The continued failure by some managers to disclose their financialinterests and the lack of a sense of urgency among EAs to deal withthe matter suggest an unwillingness to encourage an ethos ofadministrative leadership. The executive needs to act decisively onthis issue or accept the perceptions that there is an unwillingness tomanage conflicts of interest. Without these disclosures being made,the Public Service is being put at risk as the potential conflicts ofinterest of senior managers cannot be timeously identified andmanaged.
Table 3: Trends in financial disclosures (2004/5 to 2006/7)
50 Republic of South Africa. Public Service Commission. Report on the Management of Conflicts of Interest through Financial Disclosures. May 2007. 51 Ibid.
Source: PSC Financial Disclosures Database as at November 2007.
National Departments 4 955 77 % 2 025 56 % 2 821 70 %
Eastern Cape 284 68 % 262 62 % 360 71 %
Free State 135 49 % 113 38 % 328 93 %
Gauteng 592 40 % 537 80 % 731 88 %
KwaZulu-Natal 326 65 % 505 83 % 443 69 %
Limpopo 220 62 % 364 93 % 401 90 %
Mpumalanga 147 75 % 213 96 % 195 78 %
Northern Cape 73 61 % 53 40 % 154 92 %
North West 263 95 % 267 99 % 292 100 %
Western Cape 270 30 % 258 78 % 358 94 %
Provincial Total 2 310 61 % 2 572 74 % 3 262 86 %Overall Total 7 265 62 % 4 597 73 % 6 083 85 %
National 2004-2005 2005-2006 2006-2007Department/
Province No. of % No. of % No. of %Forms Received Forms Received Forms Received
Received Received Received
3 SOPS Principal 1 new 4/8/08 8:40 AM Page 8
21
Principle 1
Conflicts of interest are fairly rampant. Apart from designatedemployees being directors in companies that in turn do business withgovernment,52 another conflict of interest that may arise is that of dualemployment. A recent study undertaken by the PSC raised questionson the neutrality of public servants who also serve as full-time or part-time councillors.53 Focusing on Limpopo and the Western Cape, thestudy found that there is a legislative gap in the management of publicservants who are elected as municipal councillors. The currentframework regulating the election of public servants as councillors isalso not adhered to in all instances by departments. The PSC feelsvery strongly that the practice of dual employment of public servantsshould be entirely discontinued. Alternatively, the DPSA should amendthe Public Service Act to, among others, include conditions underwhich public servants can be elected to serve as municipalcouncillors.54
If one adds the rising debate on “cooling off periods”55 to the issues offinancial disclosures and dual employment, the PSC's view that thereneeds to be a further strengthening of policy in terms of the scope ofthe South African conflict of interest system is confirmed.56 Theabsence of clear regulations on these matters only clouds theotherwise strong messages of a Public Service that promotes a highstandard of professional ethics.
Another consistently strong message from government has been theimportance of effective partnerships between government and otherrole players in the fight against corruption. As the ethics infrastructureof the country was being initiated during the first decade of democracy,there was already recognition that fighting corruption is complex andthus requires cooperation between departments as well asstakeholders outside government who may have specialised skills.However, despite the existence of the NACF at the national level, thismodel has not been successfully replicated among the provinces.57
This was one of the findings of the 2006 PSC investigation into theethics and anti-corruption infrastructure in the Free State Province.The study found that a Provincial Anti-Corruption Forum as well as aStrategy did not exist. In KwaZulu-Natal a Forum has been establishedbut does not include civil society.58 These findings show that the co-operative approach to fighting corruption has not been systematically
52 Republic of South Africa. Auditor-General. Report on the Declaration of Interest by Ministers, Deputy Ministers and Government Employees. 2006.53 Republic of South Africa. Public Service Commission. Report on the Investigation into the Management of Public Servants in terms of Prevailing Provisions who
are Elected as Municipal Councillors in the Limpopo and Western Cape Provinces. 2007.54 Ibid.55 Note: This practice generally refers to situations where an employee takes up employment with an organisation with which s/he had direct or significant dealings
during her/his last year of office.56 Republic of South Africa. Public Service Commission. Report on Managing Conflicts of Interest in the Public Service. 2006.57 Republic of South Africa. Public Service Commission. Assessment of Professional Ethics in the Free State. 2007.58 Republic of South Africa. Public Service Commission. Assessment of Professional Ethics in KwaZulu- Natal. 2007.
3 SOPS Principal 1 new 4/8/08 8:40 AM Page 9
PUBLIC SERVICE COMMISSION
22
AcceleratingDeliverytowards 2009and Beyond
cascaded to provincial level. Unless there is such a collaborativeapproach and resolve to address corruption, the impact of efforts toboost the ethical fibre of the Public Service may be compromised.
The PSC believes that at the heart of many of the gaps that still existregarding the country's anti-corruption efforts is the lack of a nationalintegrity system. Although important building blocks such as regulations,normative frameworks, hotlines and international agreements have beenput in place, their impact is compromised if they are not located within acoherent national system which reflects how the different efforts relate toand complement one another. Such a system will also facilitate bettercollaboration between the different anti-corruption agencies ofgovernment to obviate a duplication of efforts and promote efficiency andeffectiveness. It is through this system that the adage “the sum is biggerthan the parts” would come true because there would be better alignmentand complementarity between the different instruments and actors. Onthe eve of the publication of this review, preparations for the Third NationalAnti-Corruption Summit are underway. Indications are that the Summit willseek to deliberate on the creation of an integrated integrity framework.59 Itis hoped that the Summit will be used effectively as an opportunity to setin motion this framework.
As the third term of the current government draws to a close, it iscritically important that concrete steps are taken to deal with thoseaspects of professional ethics in which progress has been inadequateto date. Firstly, departments must ensure that, as a quick win, all theirsenior managers complete and submit their Financial DisclosureForms. Where a 100% submission rate is not achieved, there shouldbe concrete evidence to show that the senior managers who ignorethis regulatory requirement have been dealt with by the EA. Secondly,departments should ensure that they acquire and utilise the capacitythat is required to identify, investigate and deal with instances ofunethical conduct. The time has come to commit to such capacitybuilding by allocating as much resources as possible to departments.Without the minimum anti-corruption capacity the requirementsstipulated by Cabinet may not be achieved. Current attempts to createanti-corruption capacity in departments are not bold enough andunless a critical mass of resources is availed to departments, progresswill remain highly unsatisfactory.
59 National Anti-Corruption Forum. Media Release. 30 August 2007.
3 SOPS Principal 1 new 4/8/08 8:40 AM Page 10
23
Principle 1
Thirdly, the executive should take concrete steps to close thelegislative gaps that still exist in the country's ethics infrastructure.These include the gaps relating to the dual employment of publicservants and adoption of a comprehensive policy framework on themanagement of conflicts of interest. Clear timelines should be set forthis process and communicated to Parliament to facilitate politicaloversight of the process.
Finally, parties to the NACF must ensure that the coming National Anti-Corruption Summit is more than a talk shop. The Summit must providefor an opportunity to assess the progress and shortcomings of ourcollective anti-corruption efforts. The assessment should take intoaccount the workplan agreed to at the second National Anti-CorruptionSummit. In addition, the Summit must inspire a concerted effort toaddress these shortcomings and deepen the implementation of anti-corruption interventions.
3 SOPS Principal 1 new 4/8/08 8:40 AM Page 11
24
Principle 2
Efficient, Economic and Effectiveuse of Resources must bePromoted
3 SOPS Principal 1 new 4/8/08 8:40 AM Page 12
Principle 2
Introduction Adherence to the principle of effectiveness, economy and efficiencyin Public Service delivery is an important and yet complex area ofpublic administration. On the one hand, it is recognised that publicresources are finite and that the priorities they should fund areimmense. It is, therefore, important to ensure that the limitedresources available are spent in ways that achieve more value formoney. However, on the other hand, it is also recognised that theproducts and services provided by the Public Service are complex.Among others, this complexity arises out of the fact that in deliveringservices, the Public Service also pursues social objectives (such asequity) which may not always readily render themselves to simplecost-benefit analyses. In order to achieve such social objectives, thePublic Service may at times spend resources in ways that some mayview as inefficient. However, this may actually be a necessaryintervention through which past inequities can be redressed moreeffectively.
A further aspect of the complexity of Public Service delivery is thatsometimes the real benefits only become discernable after a longperiod when some may have even forgotten the costs that wereinitially incurred. When the Public Service invests in teacher training,for example, the real benefits of this investment can only beestablished over time when the quality of teaching and learningimproves as reflected in the achievements of learners. As Smith andStreet correctly put it, “contemporary performance is to some extentdependent on previous investment, and contemporary inputs are tosome extent invested for future outputs”.60
Amidst the rising influence of ideas advanced by the New PublicManagement (NPM) since the 1980s,61 public managers need to beeven more vigilant to avoid an uncritical focus on efficiency andeconomy without any regard for effectiveness. The NPM generallypromotes the adoption of private sector practices such as theintroduction of competition among service providers through termcontracts, and a focus on outputs and results rather than processes.However, if Public Service managers uncritically adopt NPMprinciples, they may end up pursuing narrow efficiency gains whichdo not address other important performance dimensions that arerelevant to their respective contexts.
60 Smith, P.C. and Street, A. Measuring the Efficiency of Public Services: The Limits of Analysis. Journal of the Royal Statistical Society. 2005.61 Note: NPM is used to generally refer to certain administrative reform doctrines adopted by a number of countries in the late 70s and early 80s. See for example,
Hood ,C. A Public Management for All Seasons? Public Administration. Vol. 69. 1991.
25
4 SOPS Principal 2 new 4/8/08 8:39 AM Page 1
PUBLIC SERVICE COMMISSION
26
62 Republic of South Africa. National Treasury. Public Finance Management Act. Act 1 of 1999.63 Republic of South Africa. National Treasury. Treasury Regulations. 2001.64 Fraser Moleketi, G J. Minister for Public Service and Administration. Budget Vote Speech. 21 June 2004.65 Republic of South Africa. National Treasury. 2007. Provincial Budgets and Expenditure Review: 2003/04-2009/10. 2007.
Mid-TermReview
Half way into the third term of office for the democratically electedgovernment, it is opportune to take stock of the measures that thePublic Service has put in place since 2004 to promote the efficient,economic and effective use of resources. In this process, it would beequally important to ensure that the measures put in place areadequately sensitive to the complexities of public service delivery.
The foundation for greater awareness around the importance ofefficiency, effectiveness and economy was built during the firstdecade of democracy through, among others, the introduction of thePublic Finance Management Act (PFMA),62 Treasury Regulations63
and the Medium Term Strategic Framework. Post-2004, an importantpriority was to build on this solid regulatory foundation and ensureimproved implementation by building in a more nuanced focus oneffectiveness, efficiency and economy. In this regard, the Minister forPublic Service and Administration reported to Parliament that “ourPublic Service simply has to get better at doing whatever it does. Weneed to achieve better results with the same resources and the samepeople. This requires a renewed focus on effectiveness across theentire public sector.”64 Such public pronouncements were indicationsthat during its third term of office, the democratic governmentintended to prioritise the creation of public value through betterservice delivery.
One of the important developments in this regard was introduced in2004 when nationally uniform sector-specific budget structures wereimplemented. In terms of this important budget reform, all budgetsfor departments within the same sector (for example, education orpublic works) would be organised according to the same structureacross all provinces.65 This development sought to simplify budgetstructures, and facilitate comparisons of performance data betweenprovinces. Through these uniform budget structures, departmentswithin the same sector could reflect on each other's resourceallocation and utilisation patterns, a process which would facilitatebenchmarking and in the long run contribute to economy, efficiencyand effectiveness.
4 SOPS Principal 2 new 4/8/08 8:39 AM Page 2
27
Principle 2
Simplifying budget structures did detract focus from improving thequality of performance data generated and reported by departments.In 2007 National Treasury published a Framework for ManagingProgramme Performance Information, which, among others, clarifiesdefinitions and standards for performance information and seeks toimprove the way departments plan, monitor and report on theirperformance.66 The Framework should serve as an important guidefor the Public Service, and if used properly it will improve the qualityof reporting on performance and support informed decision-making.
The above developments have built on the pre-2004 legislativefoundation by promoting a gradual and yet noticeable shift fromnarrow compliance based performance reporting to a morequalitative engagement with the public value that is being createdthrough service delivery. Indeed, the period under review has seengreater awareness of the need to examine what value for moneymeans in the context of public service delivery.67 In this processdepartments have been encouraged to ensure that they focus notjust on the rand cost of public services but on their quality and thedifference they make towards the well-being of citizens.68
The need to promote a better understanding of public value shouldalso be understood within the context of the increasing fundsgovernment has been allocating to national and provincialdepartments. This allocation increased from R306 billion in 2004/05to R391 billion in 2006/07.69 However, increased allocations do nothelp support improved efficiency and effectiveness if departmentsunder spend the funds they receive. Encouragingly, during thisperiod the Public Service witnessed an overall decrease in underspending, suggesting that departments were progressively startingto overcome their spending difficulties.70
Notwithstanding the above important milestones, the performance ofthe Public Service has, during the period under review continued tobe inadequate in certain areas as is evidenced by the tracking ofprogress by the PSC reflected in Table 4 on the next page.
66 Republic of South Africa. National Treasury. Framework for Managing Programme Performance Information. 2007.67 Republic of South Africa. Public Service Commission. Report on the Evaluation of the Batho Pele Principle of Value for Money in the Public Service. 2007.68 Note: See, for example, Manuel T. Minister of Finance. Republic of South Africa. Budget Speech 2006.15 February 2006.69 Republic of South Africa. National Treasury. Provincial Budgets and Expenditure Review:2003/04 - 2009/10. 2007.70 Republic of South Africa. Public Service Commission. State of the Public Service Report. 2005.
4 SOPS Principal 2 new 4/8/08 8:39 AM Page 3
PUBLIC SERVICE COMMISSION
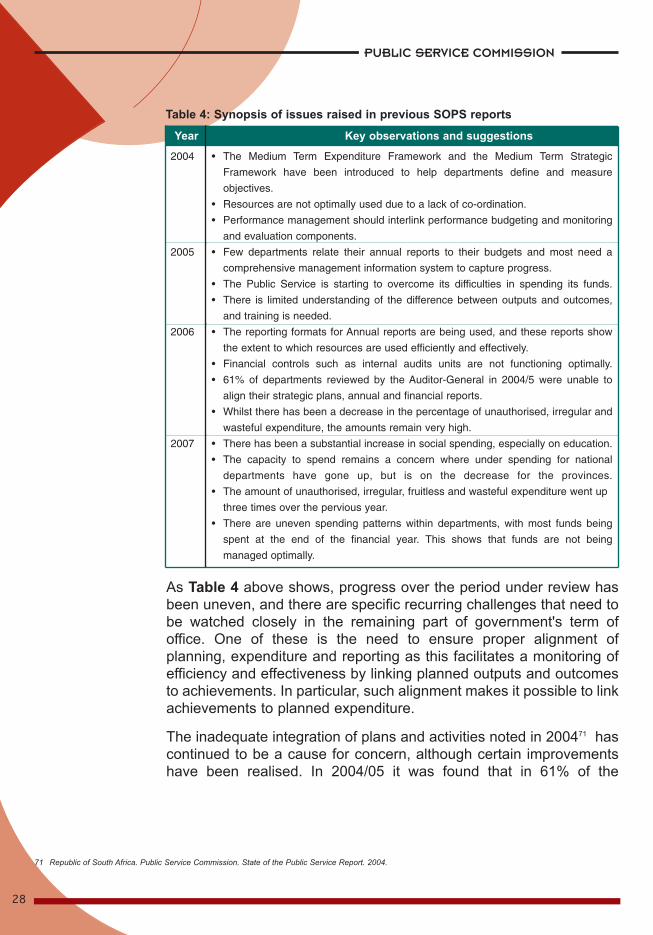
28
As Table 4 above shows, progress over the period under review hasbeen uneven, and there are specific recurring challenges that need tobe watched closely in the remaining part of government's term ofoffice. One of these is the need to ensure proper alignment ofplanning, expenditure and reporting as this facilitates a monitoring ofefficiency and effectiveness by linking planned outputs and outcomesto achievements. In particular, such alignment makes it possible to linkachievements to planned expenditure.
The inadequate integration of plans and activities noted in 200471 hascontinued to be a cause for concern, although certain improvementshave been realised. In 2004/05 it was found that in 61% of the
Table 4: Synopsis of issues raised in previous SOPS reports
71 Republic of South Africa. Public Service Commission. State of the Public Service Report. 2004.
2004 • The Medium Term Expenditure Framework and the Medium Term Strategic
Framework have been introduced to help departments define and measure
objectives.
• Resources are not optimally used due to a lack of co-ordination.
• Performance management should interlink performance budgeting and monitoring
and evaluation components.
2005 • Few departments relate their annual reports to their budgets and most need a
comprehensive management information system to capture progress.
• The Public Service is starting to overcome its difficulties in spending its funds.
• There is limited understanding of the difference between outputs and outcomes,
and training is needed.
2006 • The reporting formats for Annual reports are being used, and these reports show
the extent to which resources are used efficiently and effectively.
• Financial controls such as internal audits units are not functioning optimally.
• 61% of departments reviewed by the Auditor-General in 2004/5 were unable to
align their strategic plans, annual and financial reports.
• Whilst there has been a decrease in the percentage of unauthorised, irregular and
wasteful expenditure, the amounts remain very high.
2007 • There has been a substantial increase in social spending, especially on education.
• The capacity to spend remains a concern where under spending for national
departments have gone up, but is on the decrease for the provinces.
• The amount of unauthorised, irregular, fruitless and wasteful expenditure went up
three times over the pervious year.
• There are uneven spending patterns within departments, with most funds being
spent at the end of the financial year. This shows that funds are not being
managed optimally.
Year Key observations and suggestions
4 SOPS Principal 2 new 4/8/08 8:39 AM Page 4

29
Principle 2
departments reviewed by the Auditor-General (A-G), performanceinformation contained in annual reports was not aligned to theinformation contained in the strategic plans and the Estimates ofNational Expenditure (ENE).72 The following year (2005/06) saw amarked improvement in this regard with only 29% of the departmentsreviewed lacking alignment in terms of annual reports versus strategicplans and the ENE.73 In 2006/07, in only 9% and 25% of national andprovincial departments respectively were material inconsistenciesfound between reported performance information and the objectivescontained in strategic plans and the ENE.74
The above observations suggest that over the mid-term, the PublicService has generally improved in terms of ensuring better alignmentbetween planning and reporting. However, from the rate of progressreported it can also be observed that there are still departments inwhich the institutional practice of meaningfully accounting for what youpromised to deliver on has yet to take root.75 Institutionalising goodpractice in this regard lays a good foundation for effectiveness,efficiency and economy by creating links between planned activities,the resources allocated to these activities and the achievementsmade. Ultimately it is this practice that will facilitate a betterappreciation of how value for money can be achieved.
Of critical importance is for the Public Service to also improve thereliability of performance data by ensuring that there is consistency inthe content of reports from one period to the next. However, NationalTreasury has found that there remain major variances between thedata reported by departments in their quarterly reports and the datapublished in annual reports.76 This means that different reports by thesame department give conflicting information on performance, andthat, therefore, a reader's understanding of what the department hasachieved will depend on which report is being looked at. Suchvariances suggest that in monitoring the quality of performanceinformation, it is important to ensure that there is consistency in whatis being reported from one period to the next. These inconsistenciescompromise the reliability of the performance data and lead to a lossof confidence in the reports provided by the departments. While it isenvisaged that following National Treasury's release of a Framework
72 Republic of South Africa. Auditor-General. General Report on Audit Outcomes for 2004 - 05 (RP 223 2005).73 Republic of South Africa. Auditor-General. General Report on Audit Outcomes for 2005 - 06 (RP 247 2006).74 Republic of South Africa. Auditor-General. General Report on Audit Outcomes of National and Provincial, Public Entities and Constitution Institutions for the
Financial Year 2006 - 2007. December2007.75 Ibid.76 Republic of South Africa. National Treasury. 2006. Provincial Annual Report Review as a Performance Measure for 2005/06.
4 SOPS Principal 2 new 4/8/08 8:39 AM Page 5
for Managing Programme Performance Information,77 furtherimprovements in the quality of performance data will be realised, thisis a matter that requires close attention during the remaining years ofthe government's current term of office.
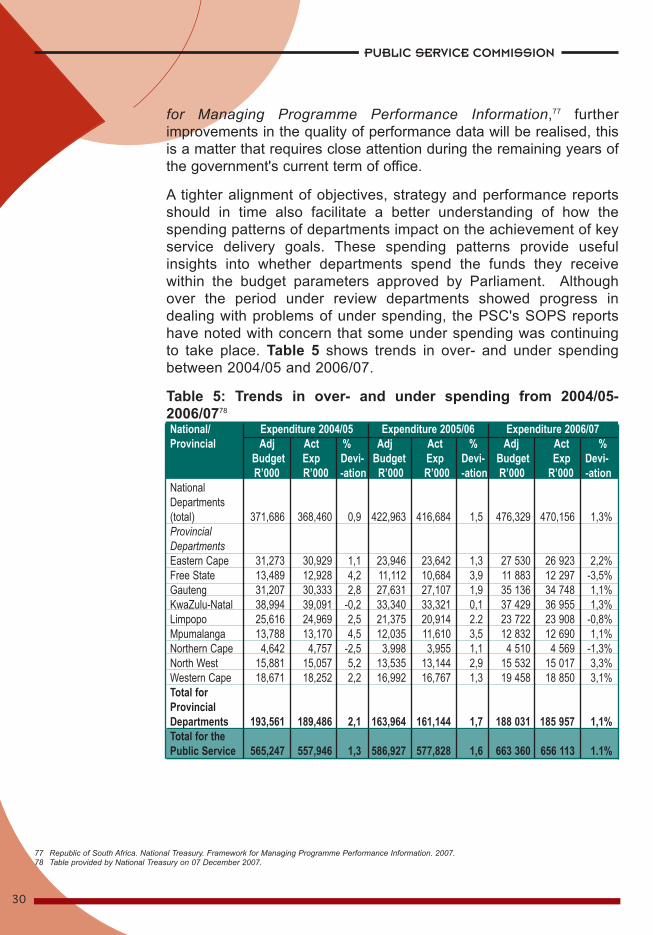
A tighter alignment of objectives, strategy and performance reportsshould in time also facilitate a better understanding of how thespending patterns of departments impact on the achievement of keyservice delivery goals. These spending patterns provide usefulinsights into whether departments spend the funds they receivewithin the budget parameters approved by Parliament. Althoughover the period under review departments showed progress indealing with problems of under spending, the PSC's SOPS reportshave noted with concern that some under spending was continuingto take place. Table 5 shows trends in over- and under spendingbetween 2004/05 and 2006/07.
Table 5: Trends in over- and under spending from 2004/05-2006/0778
National/ Expenditure 2004/05 Expenditure 2005/06 Expenditure 2006/07Provincial Adj Act % Adj Act % Adj Act %
Budget Exp Devi- Budget Exp Devi- Budget Exp Devi-R’000 R’000 -ation R’000 R’000 -ation R’000 R’000 -ation
National Departments (total) 371,686 368,460 0,9 422,963 416,684 1,5 476,329 470,156 1,3%Provincial DepartmentsEastern Cape 31,273 30,929 1,1 23,946 23,642 1,3 27 530 26 923 2,2%Free State 13,489 12,928 4,2 11,112 10,684 3,9 11 883 12 297 -3,5%Gauteng 31,207 30,333 2,8 27,631 27,107 1,9 35 136 34 748 1,1%KwaZulu-Natal 38,994 39,091 -0,2 33,340 33,321 0,1 37 429 36 955 1,3%Limpopo 25,616 24,969 2,5 21,375 20,914 2.2 23 722 23 908 -0,8%Mpumalanga 13,788 13,170 4,5 12,035 11,610 3,5 12 832 12 690 1,1%Northern Cape 4,642 4,757 -2,5 3,998 3,955 1,1 4 510 4 569 -1,3%North West 15,881 15,057 5,2 13,535 13,144 2,9 15 532 15 017 3,3%Western Cape 18,671 18,252 2,2 16,992 16,767 1,3 19 458 18 850 3,1%Total for Provincial Departments 193,561 189,486 2,1 163,964 161,144 1,7 188 031 185 957 1,1%Total for the Public Service 565,247 557,946 1,3 586,927 577,828 1,6 663 360 656 113 1.1%
77 Republic of South Africa. National Treasury. Framework for Managing Programme Performance Information. 2007.78 Table provided by National Treasury on 07 December 2007.
30
PUBLIC SERVICE COMMISSION
4 SOPS Principal 2 new 4/8/08 8:39 AM Page 6
Over the period 2004/05 to 2006/07, departments have generallycontinued to under spend their funds at a rate of between 1% and 2%of the budget. However, specific percentages for individual provincesreveal worrying trends. For example, under spending in the WesternCape increased from 1,3% in 2005/6 to 3,1% in 2006/7, a trend thatindicates that some funds may be lying unused while there remainspressing service delivery needs in the province. Other provinces suchas the Free State and the Northern Cape reversed their trends fromunder spending to overspending. Material over- and under spendingrepresent a gap between planning and implementation and can thusnot be in the interest of efficient and effective service delivery. Thecountry cannot afford to have funds being returned unspent given thebacklogs that still exist in the provision of basic services. As thePresident noted, “…it is a fact that 8 million people are still withoutportable water. Many more are without electricity and sanitation”.79
This under spending suggests that it is not necessarily a lack of fundsthat is preventing the delivery of such basic services but appropriatecapacity to use existing resources efficiently and effectively.
Progress in achieving acceptable expenditure patterns should beunderstood within the context of the commitment to give citizens bettervalue for money. A full appreciation of this commitment is required toinform the overall orientation of public administration in the country.The Public Service still has a long way to go in this area, especiallywhen cognisance is taken of a PSC study which found, among others,that it was still difficult for departments to determine if they aredelivering value for money.80 The challenge departments face is largelyin terms of being rigorous in the collection, analysis and reporting ofnon-financial performance data.
However, as attention is being paid to spending patterns, it is equallyimportant to ensure that accountable spending processes are beingfollowed. In this regard, a recurring concern over the period underreview has been the practice of unauthorised, irregular, fruitless andwasteful expenditure. This practice has been on the rise, in theprocess leading to more and more funds being expended ineffectivelyand inefficiently. In terms of national departments expenditure that fellin this category in 2003/04 was R142,1 million.81 This amountdecreased to R83,8 million in 2004/05 and then more than doubled in2005/06 when it reached R266,7 million.82 Such forms of expenditureare not in the interest of efficiency, effectiveness and economy, and it
Principle 2
31
79 Mbeki, T. President of the Republic of South Africa. State of the Nation Address. Joint Sitting of Parliament. 9 February 2007.80 Republic of South Africa. Public Service Commission. Report on the Evaluation of the Batho Pele Principle of Value for Money in the Public Service. 2007.81 Republic of South Africa. Auditor-General. General Report on Audit Outcomes for 2003 - 04 (RP 211 2004).82 Republic of South Africa. Auditor-General. General Report on Audit Outcomes of National andProvincial, Public Entities and Constitution Institutions for the
Financial Year 2006 - 2007. December 2007.
4 SOPS Principal 2 new 4/8/08 8:39 AM Page 7

PUBLIC SERVICE COMMISSION
32
is very worrying that the amounts involved continue to be so high.
The ability to spend is reliant on the capacity and conduct of publicservants. It requires a mindset which is alert to the risks of lack offinancial discipline. It would not be far-fetched to suggest that thediscipline to manage personal finances is an important part of thefoundation that one requires in order to effectively manage large publicfunds. Where one's personal finances are poorly managed, there arealso likely to be doubts about the honesty and integrity with whichpublic funds will be managed. A PSC study has found that a numberof public servants are failing to manage their own personal financeseffectively. The study found that 20% of all public servants had madegarnishee related payments during 2006/07.83 This suggests that manypublic servants are over-indebted and thus default on repayments totheir creditors, leading to the courts ordering them to honour thepayments. The total debt owed to micro-lenders by public servantswas R13,3 million during 2006/07, 25% of which was attributed toemployees based in national departments.84 Such apparent inaptitudeto manage personal finances raises uncertainties about theeffectiveness with which departmental budgets can be managed.
Some of the allocations to departments include very large amountstargeted for infrastructure spending. With the country now makingpreparations to host the 2010 Soccer World Cup, infrastructurespending has been raised even further, with the 2007 budgetprojecting a R416 billion earmarked for this purpose over the mediumterm.85 The country cannot afford to have these funds managedinappropriately. Infrastructure spending is a key lever for economicgrowth, and in a developmental context such growth is important forimproved service delivery and then achievement of social objectives.Efficiency, effectiveness and economy will, therefore, remain crucialimperatives for Public Service transformation in general, and the roleof public servants in particular.
Concerns about a lack of financial discipline among public servantsshould also be understood against the background of the risks thatsuch officials pose in terms of acts of financial misconduct. The PSChas observed a big increase in the cases of financial misconductreported by departments.86 For the 2003/04 financial year, the totalnumber of cases reported was 582, which decreased to 513 in2004/05, only to up massively to 771 and 1042 in 2005/0687 and2006/0788, respectively. While these trends should not necessarily be
83 Republic of South Africa. Public Service Commission. Draft Report on the Indebtedness of PublicServants. 2007.84 Ibid.85 Manuel, T. Minister of Finance. Republic of South Africa. Economic Policy and South Africa's Growth Strategy. 19 March 2007.86 Republic of South Africa. Public Service Commission. Report on Financial Misconduct for the 2005/2006 Financial Year. 2007.87 Ibid.88 Republic of South Africa. Public Service Commission. Report on Financial Misconduct for the 2006/2007 Financial Year. 2008.
4 SOPS Principal 2 new 4/8/08 8:39 AM Page 8
33
Principle 2
AcceleratingDeliveryTowards 2009and Beyond
interpreted to suggest that financial misconduct is on the increase,they should be a source of concern for a Public Service that seeks topromote efficiency and effectiveness. The impact of such actsbecomes even more evident when one considers the amount ofmoney they involve. In 2003/04, the total amount involved was justover R20m, which increased drastically to close to R121m in 2004/05and then came down to about R45m in 2005/06. By all counts theseare massive resources that the Public Service cannot afford tomisappropriate. What is even more worrying is that in most of thecases, departments could not provide any indication of whether theyhave been able to institute criminal or any other proceedings againstthe offending employees, which means that chances of recoupingsome of the money involved are limited.
The Public Service has made good progress with putting frameworksand policies in place to incrementally improve the quality ofperformance information. However, it is apparent that departmentsstill need to strengthen their monitoring of non-financial data and itslink to expenditure to ensure a strengthening of the quality ofperformance reporting. Frameworks to guide such reporting are inplace and a critical step would be to ensure capacity at departmentallevel to generate the required information which, in its analysis, linksfinancial and non-financial data so that progress on efficiency,effectiveness and economy can be properly accounted for. Suchmonitoring would also help assess the progress being made in thedelivery of key government services which are at the heart of creatinga better life for all.
In order to further promote an institutionalisation of efficiency andeffectiveness, National Treasury should provide a guideline on how tounderstand and monitor value for money in Public Service Delivery.
Given the growing importance of credible performance data, it iscrucial for institutions that place reporting demands on departments(such as National Treasury, the PSC, and the A-G, among others) tocoordinate and streamline their requirements. Without suchcoordination, the information demands placed on departments mayend up being burdensome. In addition, there may be a duplication ofinformation requirements, a practice which may not be in the interestof optimising the use of state resources.
4 SOPS Principal 2 new 4/8/08 8:39 AM Page 9
PUBLIC SERVICE COMMISSION
34
In order to bring to an end the practice of unauthorised, fruitless,irregular and wasteful expenditure, departmental performancemanagement and disciplinary processes (including the performanceevaluation of Heads of Department) should decisively deal withofficials who incur such unacceptable forms of expenditure. Inaddition, incidents of such expenditure should be seriously taken intoaccount when departmental budget votes are being passed byParliament to ensure that departments that are implicated begin toface certain sanctions regarding the funds they are allocated insubsequent years.
As part of tightening up the processes of dealing with financialmisconduct, departments need to ensure that they also increase therate of recovering money from the offending officials. It is not enoughto simply demote, warn, suspend or dismiss these officials. The moneyinvolved should be recovered and returned to the fiscus.
4 SOPS Principal 2 new 4/8/08 8:39 AM Page 10

35
Principle 3
Public Administration must beDevelopment Oriented
5 SOPS Principal 3 new 4/8/08 8:37 AM Page 1
PUBLIC SERVICE COMMISSION
36
89 Republic of South Africa. The Presidency. The White Paper on Reconstruction and Development. 1994.90 Note: See, for example, Hendricks, L.B. Minister of Water Affairs and Forestry. Republic of South Africa. Media Release: Response to the Sunday Times Article.
4 February 2008.
Introduction Development orientation as a Constitutional value and principle hasbeen at the centre of many debates on the role of the state and thepolicies that should be put in place to support this role. The PSCbelieves that in the South African context, the principle ofdevelopment orientation requires state institutions to ensure that intheir programmes and policies they prioritise the creation of a betterlife for the people. The democratic government has promoted thisorientation from the time of the first term of office, by among others,adopting the Reconstruction and Development Programme (RDP) in1994.89 In the years that followed, a range of policies and programmeswere designed and implemented to give impetus to the promotion ofdevelopment, and all of these efforts assumed a new sense of urgencywith the adoption of the eight Millennium Development Goals (MDGs)and their accompanying targets.
With government's third term of office now coming to an end, a keyquestion to be addressed is how to increase in a sustainable mannerthe pace of implementing the current policies and programmes. Thisquestion is particularly important considering recent concerns thatcertain important pillars on which growth and development rest arebeginning to experience challenges. One such important pillar is anenergy strategy for a reliable and sustainable power supply in supportof productive economic activities and a better quality of life. Recentpower outages in the country have raised questions about how reliableour energy supply is and the implications thereof for growth anddevelopment. Similar concerns are being raised in certain quartersabout the sustainability of the country's water supply, including thecapacity to monitor and maintain the existing infrastructure.90
The above issues need urgent attention to ensure that the gainsrealised since the advent of democratic rule can be consolidated intoa sustainable legacy that future governments can build on. The role ofthe Public Service in this process cannot be overemphasised. Adevelopment oriented Public Service must leverage its administrativewherewithal and resource base and use these in such a manner thatthey help to invigorate the implementation of programmes thatpromote growth and development. The results of such growth anddevelopment should become particularly visible in the reduction ofpoverty and the improvement of the quality of life of people.
5 SOPS Principal 3 new 4/8/08 8:37 AM Page 2
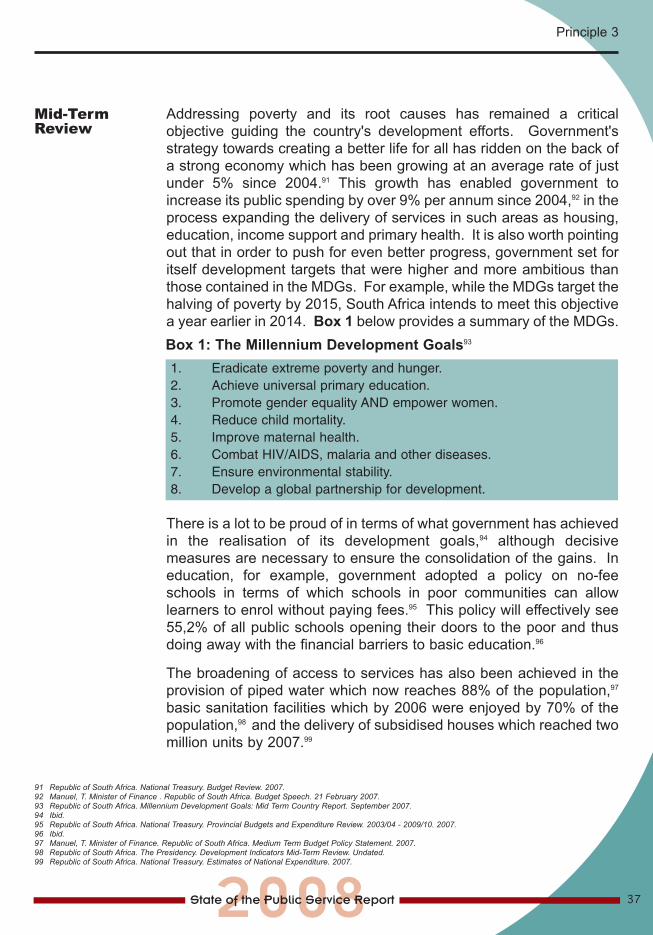
37
Principle 3
Mid-TermReview
Addressing poverty and its root causes has remained a criticalobjective guiding the country's development efforts. Government'sstrategy towards creating a better life for all has ridden on the back ofa strong economy which has been growing at an average rate of justunder 5% since 2004.91 This growth has enabled government toincrease its public spending by over 9% per annum since 2004,92 in theprocess expanding the delivery of services in such areas as housing,education, income support and primary health. It is also worth pointingout that in order to push for even better progress, government set foritself development targets that were higher and more ambitious thanthose contained in the MDGs. For example, while the MDGs target thehalving of poverty by 2015, South Africa intends to meet this objectivea year earlier in 2014. Box 1 below provides a summary of the MDGs.
There is a lot to be proud of in terms of what government has achievedin the realisation of its development goals,94 although decisivemeasures are necessary to ensure the consolidation of the gains. Ineducation, for example, government adopted a policy on no-feeschools in terms of which schools in poor communities can allowlearners to enrol without paying fees.95 This policy will effectively see55,2% of all public schools opening their doors to the poor and thusdoing away with the financial barriers to basic education.96
The broadening of access to services has also been achieved in theprovision of piped water which now reaches 88% of the population,97
basic sanitation facilities which by 2006 were enjoyed by 70% of thepopulation,98 and the delivery of subsidised houses which reached twomillion units by 2007.99
91 Republic of South Africa. National Treasury. Budget Review. 2007.92 Manuel, T. Minister of Finance . Republic of South Africa. Budget Speech. 21 February 2007. 93 Republic of South Africa. Millennium Development Goals: Mid Term Country Report. September 2007.94 Ibid.95 Republic of South Africa. National Treasury. Provincial Budgets and Expenditure Review. 2003/04 - 2009/10. 2007.96 Ibid.97 Manuel, T. Minister of Finance. Republic of South Africa. Medium Term Budget Policy Statement. 2007.98 Republic of South Africa. The Presidency. Development Indicators Mid-Term Review. Undated.99 Republic of South Africa. National Treasury. Estimates of National Expenditure. 2007.
Box 1: The Millennium Development Goals93
1. Eradicate extreme poverty and hunger.2. Achieve universal primary education.3. Promote gender equality AND empower women.4. Reduce child mortality.5. Improve maternal health.6. Combat HIV/AIDS, malaria and other diseases.7. Ensure environmental stability.8. Develop a global partnership for development.
5 SOPS Principal 3 new 4/8/08 8:37 AM Page 3
PUBLIC SERVICE COMMISSION
38
The momentum for poverty reduction was also boosted by theintroduction of the Expanded Public Works Programme set out tocreate work and training opportunities between 2004/05 to 2008/09.Between April 2004 up till the end of September 2007, 854 406 network opportunities were created. This is a 77% achievement againstthe target of 1 112 000 that had been set. The programme also has acapacity building component, and the overall number of person-daysof training provided since commencement is 3,6 million. In this regardthe project achieved 23% towards its 15,5 million person-days oftraining target.100
A lasting legacy that government has introduced to reduce poverty isthe provision of social grants to qualifying individuals based on ameans-test. This measure has been in place since 1994, but theperiod after 2004 saw a marked increase in the amount of moneyspent on social assistance as well as the beneficiaries from this.Social assistance now reaches close to 12 million beneficiaries, upfrom 8 million in 2004.101 Considering that the total estimatedpopulation is 46 million, it means that about 25 % of the country'spopulation receives social grants of one form or another. The rapidincrease in the beneficiaries of social grants suggests that what wasinitially intended as a safety net has over time turned into a highlyresourced intervention covering a large section of the population.
Amidst the growing concerns about the unsustainability of an everincreasing social security budget, government has taken a critical stepof initiating the development of a comprehensive poverty reductionstrategy. This step seeks to promote a cluster approach towardspoverty reduction in order to facilitate greater integration between theactivities of different state institutions.
However, addressing poverty also requires clarity regarding howpoverty should be measured. This clarity helps create benchmarksagainst which progress can be measured over time. As a signatory tothe 1995 Copenhagen Declaration on Social Development, SouthAfrica undertook to have in place a specific poverty line by 1996.102
Yet it wasn't until 2007 that an important step was taken in this regardwith the introduction of proposals on a national poverty line for SouthAfrica.103 Once finalised, the matrix will serve as a common referencepoint for determining who the poor are and how interventions shouldaccordingly be tailored. As the clock ticks towards the 2015 overall
100 Republic of South Africa. Department of Public Works. Expanded Public Works Programme. Second Quarterly Report-Year 4. Financial Year 2007/08.101 Republic of South Africa. The Presidency. Development Indicators Mid-Term Review. Undated.102 Studies in Poverty and Inequality Institute. The Measurement of Poverty in South Africa Project: Key Issues. 2007.103 Manuel, T. Minister of Finance. Republic of South Africa. Budget Speech. 21 February 2007.
5 SOPS Principal 3 new 4/8/08 8:37 AM Page 4

39
Principle 3
target of the MDGs, it is important that there is a shared understandingof whether we are making adequate progress as a country to achievethese goals. Therefore the need for a national poverty line cannot beoverstressed as a useful element of measures to promote such ashared understanding.
However, caution needs to be exercised to ensure that the nationalpoverty line, once developed, does not lead to oversimplifying the livedexperiences of the poor into numeric data. For this reason, theadoption of a poverty line must of necessity also be accompanied byan explanation of how it should be used and which other indicatorsshould be taken into consideration.104 Without this explanation, the riskexists that the poverty line will promote narrow conceptions of what itmeans to be poor, and thus lead to ineffective intervention strategies.
In order to ensure effective poverty reduction interventions, it is alsoimportant to have a full appreciation of the different programmes andprojects that departments are implementing and their strengths andweaknesses. In 2007, the PSC completed the development of adatabase on poverty reduction programmes and projects.105 Given thedynamic nature of the programmes and projects that are implemented,it is necessary for the database to be kept updated so that it remainsa reliable source of information on the nature and extent ofgovernment poverty reduction initiatives. A partnership approach withother coordinating institutions such as the Department of SocialDevelopment is necessary to ensure that the database is kept up todate.
Collectively, the above developments represent important milestonesin terms of promoting a development-oriented Public Service.However, the PSC has, through its previous SOPS reports madecertain observations which should be noted and reflected upon inorder to accelerate implementation efforts. These observations aresummarised in Table 6 on the next page.
104 Studies in Poverty and Inequality Institute. The Measurement of Poverty in South Africa: Key Issues.2007.105 Republic of South Africa. Public Service Commission. Report on an Audit of Government's Poverty Reduction Programmes and Projects. 2007.
5 SOPS Principal 3 new 4/8/08 8:37 AM Page 5
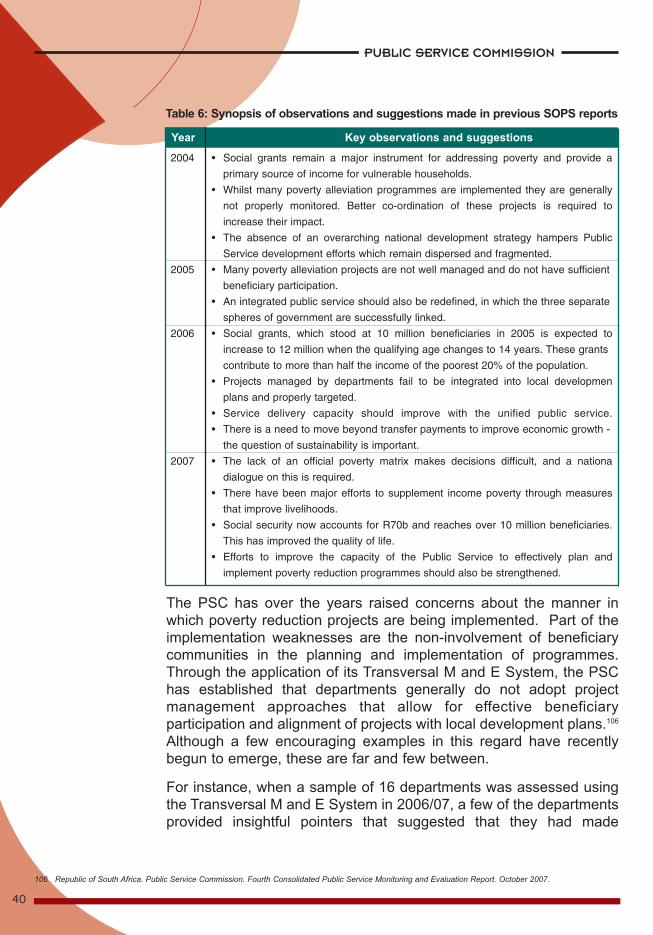
PUBLIC SERVICE COMMISSION
40
The PSC has over the years raised concerns about the manner inwhich poverty reduction projects are being implemented. Part of theimplementation weaknesses are the non-involvement of beneficiarycommunities in the planning and implementation of programmes.Through the application of its Transversal M and E System, the PSChas established that departments generally do not adopt projectmanagement approaches that allow for effective beneficiaryparticipation and alignment of projects with local development plans.106
Although a few encouraging examples in this regard have recentlybegun to emerge, these are far and few between.
For instance, when a sample of 16 departments was assessed usingthe Transversal M and E System in 2006/07, a few of the departmentsprovided insightful pointers that suggested that they had made
106 Republic of South Africa. Public Service Commission. Fourth Consolidated Public Service Monitoring and Evaluation Report. October 2007.
Table 6: Synopsis of observations and suggestions made in previous SOPS reports
2004 • Social grants remain a major instrument for addressing poverty and provide a
primary source of income for vulnerable households.
• Whilst many poverty alleviation programmes are implemented they are generally
not properly monitored. Better co-ordination of these projects is required to
increase their impact.
• The absence of an overarching national development strategy hampers Public
Service development efforts which remain dispersed and fragmented.
2005 • Many poverty alleviation projects are not well managed and do not have sufficient
beneficiary participation.
• An integrated public service should also be redefined, in which the three separate
spheres of government are successfully linked.
2006 • Social grants, which stood at 10 million beneficiaries in 2005 is expected to
increase to 12 million when the qualifying age changes to 14 years. These grants
contribute to more than half the income of the poorest 20% of the population.
• Projects managed by departments fail to be integrated into local developmen
plans and properly targeted.
• Service delivery capacity should improve with the unified public service.
• There is a need to move beyond transfer payments to improve economic growth -
the question of sustainability is important.
2007 • The lack of an official poverty matrix makes decisions difficult, and a nationa
dialogue on this is required.
• There have been major efforts to supplement income poverty through measures
that improve livelihoods.
• Social security now accounts for R70b and reaches over 10 million beneficiaries.
This has improved the quality of life.
• Efforts to improve the capacity of the Public Service to effectively plan and
implement poverty reduction programmes should also be strengthened.
Year Key observations and suggestions
5 SOPS Principal 3 new 4/8/08 8:37 AM Page 6
41
Principle 3
progress in their attempts to involve beneficiary communities in thedevelopment projects, and in the adoption of credible projectmanagement approaches.107 An example in this regard is theDepartment of Social Development in the Eastern Cape which,through the use of participatory rural appraisals, ensured improvedinvolvement of project beneficiaries. There are many benefits forbeneficiary involvement, not the least of which is ensuring relevance ofprojects and shifting the ethos from one that is underpinned by apassive and extractive relationship with government to one that isactive and contributory on the part of beneficiaries.
The coordination of the poverty reduction programmes has alsoremained a recurring challenge to government departments. Giventhat the various programmes target the same communities,coordination is key to obviate a duplication of efforts and optimise theuse of the resources deployed in the programmes. It is hoped that theNational War Room for a War Against Poverty announced by PresidentMbeki will go a long way towards improving the scope and quality ofcoordination.108 The War Room must seek to bring together keygovernment institutions working on poverty reduction together withnon-governmental organisations and business to collectively put inplace targeted poverty reduction interventions.109
In order to generate more information on the types of projectsimplemented and their progress, in 2007 the PSC published anoverview evaluation of Government's Poverty ReductionProgramme.110 The PSC has followed up this work with targetedevaluations of selected programmes and projects. One of the keyobservations regarding some of these projects is that adequatelyrigorous assessment information on their success is not available,though case study based research has been done.111 Available data islargely about expenditure and the number of beneficiaries, not aboutthe actual benefits.
There is, however, evidence that suggests that the poverty reductionprogrammes that are being implemented are making a difference.112
Most importantly, beneficiary surveys indicate that targetedbeneficiaries value the projects. For example, in a sample ofbeneficiaries of land reform projects who participated in a PSC study,85% of them indicated that their households were generally better offsince they joined the projects. The PSC believes that although such
107 Republic of South Africa. Public Service Commission. Fourth Consolidated Public Service Monitoring and Evaluation Report. October 2007.108 Mbeki, T. President of the Republic of South Africa. State of the Nation Address. Joint Sitting of Parliament. Cape Town. 8 February 2008.109 Ibid.110 Republic of South Africa. Public Service Commission. Report on the Evaluation of Government's Poverty Reduction Programme. 2007.111 Ibid.112 Ibid.
5 SOPS Principal 3 new 4/8/08 8:37 AM Page 7
PUBLIC SERVICE COMMISSION
42
AcceleratingDeliveryTowards 2009and Beyond
perception-based statistics may not always represent the real impactof the projects, they do indicate that the projects are adding somevalue to the poverty reduction strategy of government. A keyconsideration is to ensure that there is a sense of realism as to whatthe deliverables from these projects are. It cannot be expected thatthe transfer of land in the short term will produce primary economicactivity that helps sustain families. Even large scale commercialagriculture does not become economically viable in the short term.What can be expected, however, is that land transfer creates a senseof ownership and pride, restores dignity especially in restitution cases,partly contributes to household incomes, and does provide aproductive asset that can grow over time.
A deepening of the practice of monitoring and evaluation ofgovernment's poverty reduction programmes is essential to improveour understanding of their progress and challenges. It is throughcredible monitoring and evaluation data that government can drawlessons from experience and improve implementation going forward.In addition to its monitoring and evaluation activities, the PSC isexploring the value and feasibility of undertaking meta-evaluationsparticularly on poverty reduction programmes. Such evaluations willhelp in the critique and subsequent improvement of current evaluationpractices as well as provide more information on the impact ofgovernment's poverty reduction programmes.
The adoption of a development orientation by government departmentsrequires greater coordination of efforts in terms of planning,implementation and the generation of appropriate performance data. Itwould be important to identify the good practices that certaindepartments are beginning to follow in this regard and to use these,where applicable, for wider application in the Public Service.
However, as measures are being undertaken to reduce poverty, a twinchallenge that continues to rear its head is inequality. What this meansin practice is that the rate at which income poverty is being reduced isactually outpaced by the increase in income for the relatively richsections of the community.113 To illustrate the stark realities in thisregard, it is estimated that real per capita income of the poorest 10%of the population is R734, compared to R70 144 for the richest 10%.114
113 Republic of South Africa. The Presidency. Development Indicators: Mid-Term Review. Undated.114 Ibid.
5 SOPS Principal 3 new 4/8/08 8:37 AM Page 8
43
Principle 3
Attention would, therefore, need to be paid to this trend to ensure thatthe gains of poverty reduction are not cancelled out by theconsequences of persistent income inequality.
In the remaining period of the current term of office of government, itis going to be very crucial to also pay attention to the infrastructure thatgovernment has created to support development. Unless theinfrastructure that has been created to support energy supply, theprovision of piped water, the improvement of the country's roadsnetwork, among others, is buttressed, the many gains realised to datemay be reversed in future.
The work that has been initiated to develop and implement acomprehensive poverty reduction strategy should also be accelerated.In this process, lessons and experiences from other African countriesshould be tapped into to ensure that the strategy and itsimplementation are strengthened.
Effective implementation will also require on-going monitoring andevaluation. The database developed by the PSC on poverty reductionprojects and programmes should be kept up to date to ensure that theinformation it contains remains current.
5 SOPS Principal 3 new 4/8/08 8:37 AM Page 9
44
Principle 4
Services must be provided
without Bias
5 SOPS Principal 3 new 4/8/08 8:37 AM Page 10
Impartially, Fairly, Equitably and
45
Principle 4
Introduction The nature and history of society in South Africa imposes two criticalbut potentially contradictory requirements on public administration. Onthe one hand, the democratic ideals of equality before the law asenshrined in the Constitution require the promotion of impartiality anda lack of bias. At the same time there is also a recognition that yearsof apartheid rule have led to serious inequalities between differentgroups and as a result the Constitution stipulates that “to promote theachievement of equality, legislative and other measures designed toprotect and advance persons, or categories of persons, disadvantagedby unfair discrimination, may be taken.”115 As a key implementing armof the state, the Public Service is expected to work with theserequirements and effectively manage the potential tensions that mayarise when applying them.
Not surprisingly, the Public Service's adherence to the principles offairness, impartiality and lack of bias has been watched closely. ThePromotion of Administrative Justice Act (PAJA)116 provides theframework for assessing this principle which acts as a benchmark forimpartiality, fairness, equity and non-biasness. There remains agrowing awareness by the citizenry of their rights to hold governmentto account. Evidence of this growing awareness manifests in theservice delivery protests and the demand that public institutions applya very informed and grounded approach to fairness, equity andimpartiality.
Experience in the promotion of whistle-blowing in the Public Servicesuggests that fear of victimisation is an important factor affecting thepublic's involvement in reporting allegations of corruption.117 Thepossibility of fear of victimisation impacting on PAJA implementationshould, therefore, not be ignored. The democratic state is trying tocreate a society that is indeed vigilant, and which is able to holdgovernment accountable. Should citizens not exercise this right andresponsibility for fear of reprisals or a belief that complaints lodged willnot be addressed, it would be very easy for the state to regress totendencies of the old era when it was feared and unaccountable. Thismust be avoided at all costs, and providing examples to the public ofwhere their individual actions made a difference in terms of improvingperformance is perhaps the best incentive for citizens to continue withtheir scrutiny function.
In the remaining period of government's third term of office, there is
115 Republic of South Africa. The Constitution of the Republic of South Africa, 1996. Act 108 of 1996.116 Republic of South Africa. Department of Justice and Constitutional Development. Promotion of Administrative Justice Act. Act 3 of 2000.117 Republic of South Africa. Public Service Commission. State of the Public Service Report. 2006.
6 SOPS Principal 4 new 4/8/08 8:35 AM Page 1

PUBLIC SERVICE COMMISSION
46
118 Republic of South Africa. The Presidency. Development Indicators Mid-Term Review. Undated.119 The Institute for Justice and Reconciliation Employment and Industrial Policy. Economic Transformation Audit. 2006.120 Republic of South Africa. Department of Trade and Industry. South Africa's Economic Transformation: A strategy for Broad-Based Economic Empowerment.
Undated.121 Republic of South Africa. The Presidency. Development Indicators Mid-Term Review. Undated.122 The Institute for Justice and Reconciliation. Employment and Industrial Policy. Economic Transformation Audit. 2006. 123 Republic of South Africa. Public Service Commission. State of the Public Service Report. 2007.124 The Institute for Justice and Reconciliation. Economic and Industrial Policy. Economic Transformation Audit. 2006.
Mid-Term Review
going to be a need to ensure that the potential tensions betweenfairness and equity are strategically managed. As the country'sdemocracy matures, it should be expected that there will also begrowing awareness among the public of their rights and the obligationsof the state. State institutions should, therefore, position themselves toserve an increasingly rights-conscious public.
Government's efforts to promote fairness, impartiality and equity haveyielded important achievements in certain areas. By 2006, inequalitybetween races had dropped to 41% (compared to 45% in 2004),118 agradual and yet important improvement in the country's efforts ofpromoting redress and social cohesion. In 2007 it was found that blackhouseholds had a larger share of personal disposable income (46%)than whites (40.4%), which is a turn-about from 1960 when whitesearned 69.4%.119 Although the sad reality of poverty still faces manycommunities, the reduced inter-racial inequalities should beacknowledged This achievement is a manifestation of the impactremoving discrimination has had on unleashing the economic potentialof previously disadvantaged individuals.
The economic prospects of previously disadvantaged individuals werefurther improved by measures such as the Broad-Based BlackEconomic Empowerment (BBBEE) strategy of government.120 Theaverage share of BEE in transactions involving mergers andacquisitions is estimated at 15% and totalled R56 billion in 2006.121
These are substantial resources, and although there are growingsentiments which suggest that BBBEE may be exacerbating intra-racial inequality, its impact on reducing inequality between racialgroups should still be acknowledged.122
In addition to the creation of economic opportunities, government hasalso achieved good progress in ensuring equitable access toeducation.123 Success is evident at the tertiary level where Africans arenow acquiring post matriculation qualifications at a faster rate thanother South Africans and comprise more than 60% of university anduniversity of technology (formerly known as 'technikon') students.124
The effective utilisation of the socio-economic opportunities created by
6 SOPS Principal 4 new 4/8/08 8:35 AM Page 2
47
Principle 4
government requires a strong institutional base that the public can relyon for support. Among the institutions that play an important role inthis regard are the country's Institutions Supporting Democracy(ISDs). These institutions are the cornerstone of democracy and serveas the eyes and ears of the public in ensuring equity, fairness,impartiality and lack of bias. In 2007, Parliament initiated a review ofthese institutions. Focusing on institutions such as the PublicProtector, the South African Human Rights Commission, and thePublic Service Commission, the review was a crucial and timelydevelopment in the country's efforts of promoting fairness andimpartiality.125
In fulfilling their respective mandates, ISDs are required to act in animpartial way. Given this requirement, these institutions must be opento scrutiny to inspire confidence in their credibility and ability to fulfiltheir constitutional obligations. The PSC welcomed the review andalso saw it as an opportunity for introspection on the part of the ISDs,a practice that can only further strengthen the safeguarding of thepublic interest. It is, therefore, important that these institutions areassessed to ensure that the purpose for which they were establishedis not compromised.
Another important institution in the promotion of fairness andimpartiality is the judiciary. There has been debate around thetransformation of the judiciary to reflect the demographic compositionof the country. While for some it was important for the state tointervene and ensure that such transformation takes place, for othersthis move was viewed as interference motivated by pervasiveagendas.126
The judiciary is not necessarily part of the Public Service, but its rolein ruling on the fairness and impartiality of other parties is very crucialin terms of inspiring confidence in the justice system of the country. Ifnot dealt with decisively, the debate on transformation in the judiciarymay end up impacting on such public confidence. The implications ofdevelopments such as this should not be undermined. The keyhallmarks of all oversight bodies are their independence andimpartiality, which must be protected.
In addition to a credible institutional base for supporting impartiality
125 Asmal. K. Address to Representatives of 11 Chapter 9 and Associated Institutions. Parliament. 20 October 2006.126 Hoffman, P. The Strategy and tactics for reforming the Judiciary. The FW De Klerk Foundation. June 2007.
6 SOPS Principal 4 new 4/8/08 8:35 AM Page 3
PUBLIC SERVICE COMMISSION
48
and fairness, enabling legislative frameworks should also be in place.In order to buttress the country's legislative instruments forentrenching fairness and impartiality, the PAJA127 was introduced in2000. Given that the Act has now been in place for over 7 years, it isimportant that its effectiveness is assessed. Whilst the period afterenactment was rightly dedicated to awareness-raising, it was foundthat this did not translate into behavioural change - in particular howmanagers exercised their decision-making function. This promptedthe Department of Justice and Constitutional Development (DOJCD)to work directly with departments to help infuse PAJA considerationsinto decision-making processes.
The DOJCD adopted a workflow analysis approach that mappedadministrative processes in order to identify points of decision-makingand stipulate the actions required, all of which were supported by ahands-on training programme.128 The issues focused on in this trainingwere about the fair and unbiased provision of service delivery.129 Theseinclude land use, objections from neighbours, re-zoning of land, sellingof stands, building inspections, health inspections, registration ofindigents, application for housing subsidies, supply chainmanagement, the appointment of personnel and business licensing.All of these areas tend to be relatively vulnerable to corruption andbias, and by focusing on them and ensuring that the points of decision-making are subject to transparency, decision-making is less likely to betainted. Emerging from these support exercises were encouragingexamples of success in the South African Social Security Agency(SASSA), where better operational and decision-making procedureswere put in place and the Masters Office where a systematicamendment of all service delivery processes was undertaken.130
The implementation of PAJA was further supported through itstranslation into the 11 official languages and its incorporation into the“Know Your Service Rights” booklet, which is part of a biggercampaign to educate the public about their service rights.131
It is hoped that the above measures, together with the currentrequirements that PAJA should be included in the Service DeliveryImprovement Plans (SDIPs) of departments, will help institutionalise thepromotion of fair and impartial administrative actions in the Public Service.There is, however, also a need to focus on the specific recurring challengesthat tend to inhibit the effective implementation of frameworks for fairnessand impartiality. A synopsis of these is provided on the next page.
127 Republic of South Africa. Promotion of Administrative Justice Act, 2000 (Act No. 3 of 2000).128 Republic of South Africa. Department of Justice and Constitutional Development. Promotion of Administrative Justice Act Administrator's Guide. July 2006.129 Republic of South Africa. Department of Justice and Constitutional Development PAJA e-newsletter. Edition 3/2007. 130 Republic of South Africa. Department of Justice and Constitutional Development PAJA e-newsletter Edition 1/2007. 131 Republic of South Africa. Department of Public Service and Administration Know your Rights booklet. 2007.
6 SOPS Principal 4 new 4/8/08 8:35 AM Page 4
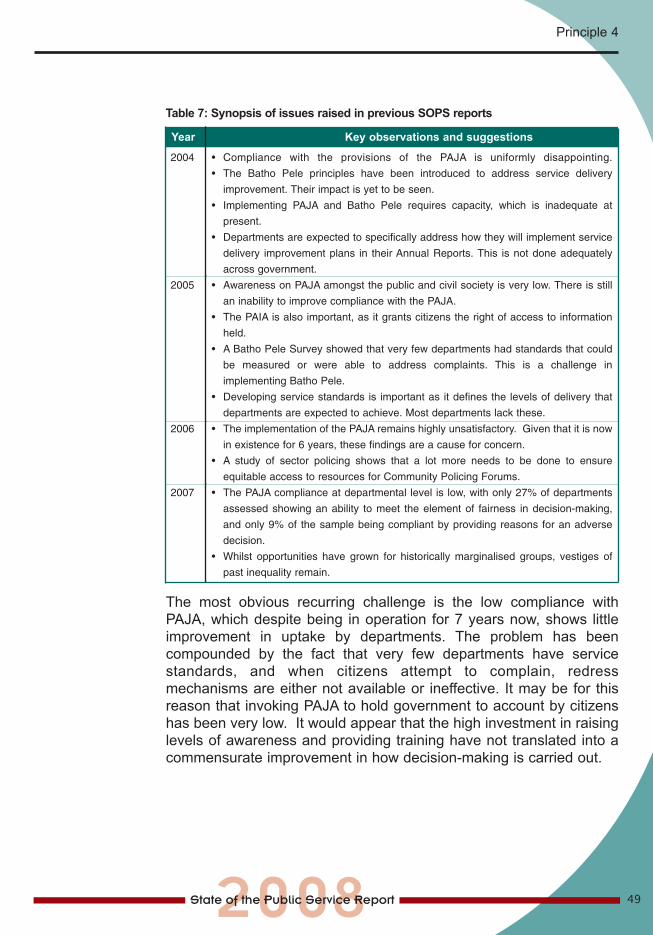
49
Principle 4
Table 7: Synopsis of issues raised in previous SOPS reports
2004 • Compliance with the provisions of the PAJA is uniformly disappointing.
• The Batho Pele principles have been introduced to address service delivery
improvement. Their impact is yet to be seen.
• Implementing PAJA and Batho Pele requires capacity, which is inadequate at
present.
• Departments are expected to specifically address how they will implement service
delivery improvement plans in their Annual Reports. This is not done adequately
across government.
2005 • Awareness on PAJA amongst the public and civil society is very low. There is still
an inability to improve compliance with the PAJA.
• The PAIA is also important, as it grants citizens the right of access to information
held.
• A Batho Pele Survey showed that very few departments had standards that could
be measured or were able to address complaints. This is a challenge in
implementing Batho Pele.
• Developing service standards is important as it defines the levels of delivery that
departments are expected to achieve. Most departments lack these.
2006 • The implementation of the PAJA remains highly unsatisfactory. Given that it is now
in existence for 6 years, these findings are a cause for concern.
• A study of sector policing shows that a lot more needs to be done to ensure
equitable access to resources for Community Policing Forums.
2007 • The PAJA compliance at departmental level is low, with only 27% of departments
assessed showing an ability to meet the element of fairness in decision-making,
and only 9% of the sample being compliant by providing reasons for an adverse
decision.
• Whilst opportunities have grown for historically marginalised groups, vestiges of
past inequality remain.
Year Key observations and suggestions
The most obvious recurring challenge is the low compliance withPAJA, which despite being in operation for 7 years now, shows littleimprovement in uptake by departments. The problem has beencompounded by the fact that very few departments have servicestandards, and when citizens attempt to complain, redressmechanisms are either not available or ineffective. It may be for thisreason that invoking PAJA to hold government to account by citizenshas been very low. It would appear that the high investment in raisinglevels of awareness and providing training have not translated into acommensurate improvement in how decision-making is carried out.
6 SOPS Principal 4 new 4/8/08 8:35 AM Page 5
PUBLIC SERVICE COMMISSION
50
Based on a sample of 53 departments evaluated by the PSC on thePAJA compliance, it was found that the majority of departments werenot meeting the basic compliance requirements. These include puttingin place a clear plan for implementing PAJA, communicatingadministrative decisions and their reasons to the people affected, andcreating opportunities for people affected by administrative decisionsto make representations.132
There have been a few exceptions to this generally bleak picture. Forexample, among the departments included in the 2006/07 sample, theDepartment of Public Enterprises performed quite well. In this case, alladministrative decisions assessed in the Department had been takenby duly authorised officials in terms of departmental delegations, andthe decisions were appropriately communicated to those affected sothat such stakeholders could make representations in case theywanted to do so. The National Department of Labour and the GautengDepartment of Community Safety also performed well in theimplementation of PAJA. The sample of administrative decisionsobtained from these departments and assessed by the PSC showedthat it was guided by clear criteria and legislative provisions to ensurethat there is no bias and unfairness.
There are reasons for the generally weak result found around PAJAcompliance. These relate primarily to the implementationenvironment.133 The most pertinent reason pointed to is that there is anabsence of sanctions and the fact that PAJA134 implementation ishampered by members of the public being generally reluctant tochallenge government for fear of victimisation. Therefore, instead ofmembers of the public exercising their rights and holding departmentsaccountable as provided for in PAJA, they pull back and avoidstanding up for good administrative practice. However, other PSCstudies have also shown that because of inadequate complaintshandling and redress mechanisms in the Public Service, members ofthe public find it difficult to come forward and raise their concerns withgovernment departments.135 It is, therefore, important to look beyondvictimisation when examining measures to enhance PAJAimplementation.
132 Republic of South Africa. Public Service Commission. Fourth Consolidated Public Service Monitoring And Evaluation Report. October 2007.133 Republic of South Africa. Public Service commission. Report on the Compliance with the Promotion of Administrative Justice Act, 2000 (Act No. 3 of 2000).
December 2006. Pretoria.134 Republic of South Africa. Department of Justice and Constitutional Development. Promotion of Access to Information Act, 2000.135 See for example, Republic of South Africa. Public Service Commission. Citizens Satisfaction Survey: Criminal Justice Sector, 2005; and Republic of South Africa.
Public Service Commission. Evaluation of the Implementation of the Batho Pele Principle of Redress. 2007.
6 SOPS Principal 4 new 4/8/08 8:35 AM Page 6
51
Principle 4
AcceleratingImplementa-tion Towards2009
The promotion of fairness, impartiality and lack of bias has been puton a sound legislative footing, and the key issue going forward is toprioritise implementation. In order to enhance implementation,departments need to honestly reflect on their own specificcircumstances that hinder implementation and address theseaccordingly. The provisions of PAJA can serve as a guide regardingspecific processes and procedures that should be in place.
A further area for attention is the need to educate the public regardingtheir rights with respect to fairness, impartiality and lack of bias. TheDepartment of Public Service and Administration (DPSA) is planningto embark on a “know your rights campaign” for the public, and it wouldbe important for the campaign to also include issues of fairness andimpartiality.136
Attached to knowing your rights must be the ability to ensure thatcomplaints and recourse mechanisms are functional, and that theseinspire confidence amongst citizens that their concerns will beaddressed timeously and seriously. The perception of the PublicService as being unfriendly and insensitive to genuine concerns canonly be dispelled when there is enough evidence to show thatconcerns are addressed timeously and properly.
136 Republic of South Africa. Department of Public Service and Administration. Report on the Implementation of Batho Pele. 2004.
6 SOPS Principal 4 new 4/8/08 8:35 AM Page 7

52
Principle 5
People's Needs must beResponded to and the Publicmust be Encouraged toParticipate in Policy-Making
6 SOPS Principal 4 new 4/8/08 8:35 AM Page 8
53
Principle 5
Introduction
Mid-TermReview
The struggle to entrench the right public participation in governancepredates South Africa's democratic transition. It was at the centre ofthe fight against apartheid rule.137 Mass mobilisation of communitieswas common at the time, and as the day of democracy dawned, “thepost-apartheid government needed no convincing [about] the virtuesof participatory governance mechanisms.”138
With this background, it should come as no surprise that publicparticipation was enshrined in the Constitution as one of the valuesand principles of public administration. Equally important also is thefact that given its history, ours is a citizenry that not only values butalso expects public participation. Practically, this means that if stateinstitutions do not institutionalise and adequately promote publicparticipation, citizens are likely to find other ways to expressthemselves and attract attention, even if this involves using lessconstructive mechanisms.139
Recently, some citizens have found alternative ways to draw attentionto the need for public participation through service delivery protestsand rising activism. This development should come as a signal togovernment that effective communication and public participation mustremain a fundamental priority.140 Otherwise the challenges evident in,among others, the municipal demarcation battles in Merafong whichhave now reached the Constitutional Court141 for arbitration mayremain. A key part of these battles is about what constitutesconsultation, and how citizens get involved in decisions which affecttheir lives.
Taking the above into consideration, there is a need to carefullyexamine existing processes of public participation with a view tostrengthening them and amplifying the voices of citizens.
A key feature of the period under review was a series ofunprecedented local protests by different communities. Theseprotests begun in 2004 and some of them continued right through to2007.142 Different possible reasons have been advanced to explainwhy these protests took place,143 but what cannot be ignored is thestrong message they have sent out about the need to revisit and
137 Friedman, S. Participatory governance and citizen action in post-apartheid South Africa. Discussion Paper. International Institute of Labour Studies. 2006.138 Ibid.139 Republic of South Africa. Reflections and Human Rights: Decade of the South African Constitution (Act 108 of 1996).140 Residents continue housing and service delivery protests. 6 September 2007. www.internafrica.org141 Republic of South Africa. Constitutional Court of South Africa. Merafong Demarcation Forum and Others v President of the Republic of South Africa and Others
CCT41/07. 04 September 2007. http://www.constitutionalcourt.org.za/site/home.htm.142 Botes, L, Lenka, M et al. University of the Free State. The New Struggle: Service Delivery-Related Unrest in South Africa. Handisa Media. Undated.143 Ibid.
7 SOPS Principal 5 new 4/8/08 8:33 AM Page 1
PUBLIC SERVICE COMMISSION
54
144 Hangana, N. Deputy Minister for Provincial and Local Government. Republic of South Africa. Address at the Institute for Local Government Management Annual Conference. Cape Town. 2005.
145 Republic of South Africa. Government Communication and Information System. Bua News. 28 October 2003.146 Centre for Policy Studies. A Developmental Democracy? Democracy and Political Governance Discussion Paper Prepared for Phase One of the South African
APRM January 2006. http://www.aprm.org.za/docs/APRMiscussionPaperFinal12.pdf.147 Ibid.148 Mbeki, T. President of the Republic of South Africa. State of the Nation Address. Joint Sitting of Parliament. Cape Town. February 2003.149 Republic of South Africa. Department of Public Service and Administration. Proceedings of the 1st CDW Conference held in Gallagher Estate. 11 - 12 June 2007.150 Ibid.
reinforce participatory governance. In this regard, some introspectionis necessary to ensure that government reflects honestly on questionssuch as “Are we using existing opportunities to communicate to ourcommunities? And where they are lacking, are we creating newinnovative ways to talk to them, to inform them of plans and to keepthem up-to-date on progress?”144 Given that some of the protestscontinued well into 2007, there is reason to assume that decisiveaction is still necessary to ensure that government-communityrelationships are stabilised in the interest of good governance andeffective Public Service delivery.
One of the mechanisms government has continued to use tostrengthen its relationship with communities is Izimbizo. As forums atwhich government interacts with communities, Izimbizo have beenconducted every year since their adoption by Cabinet in 2000.145
Although there has been good progress with the implementation ofIzimbizo, some challenges have also been observed. For example,research conducted146 for the APRM indicates that whilst this form ofcitizens' engagement remains innovative, it has both advantages anddisadvantages. Its advantage lies in its ability to easily and rapidlydraw in members of the public to articulate their problems andexpectations and also to hear government policy proposals,achievements and failures. The disadvantage and a critical challengeis that there is usually no feedback loop for communities to trackwhether their concerns are addressed or not.147 The PSC has, throughits previous editions of the State of the Public Service Report raisedthese observations, and it is important for institutions responsible forthe coordination of Izimbizo to ensure that effective measures are putin place to address these gaps.
In order to further improve the interface between government and thecitizens, the government introduced the concept of communitydevelopment workers in 2003.148The main purpose was to employofficials who would be a link between government (across all spheres)and communities, to ensure that communication about the servicesthat government offers reaches communities.149 There are currently3 000 Community Development Workers (CDWs) deployed in all theparticipating municipalities (about 2 000 municipal wards).150 In the
7 SOPS Principal 5 new 4/8/08 8:33 AM Page 2
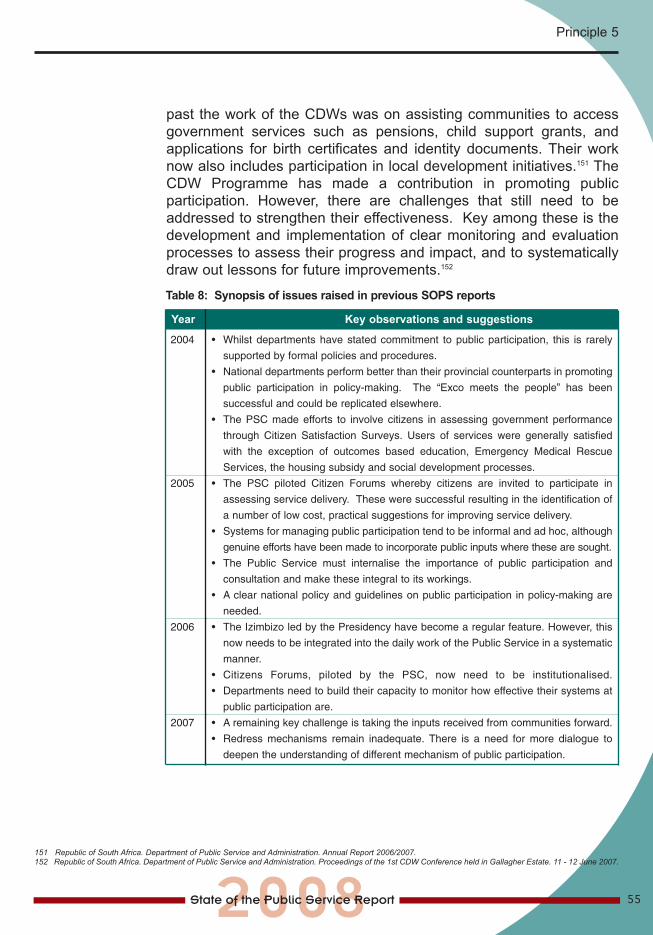
55
Principle 5
past the work of the CDWs was on assisting communities to accessgovernment services such as pensions, child support grants, andapplications for birth certificates and identity documents. Their worknow also includes participation in local development initiatives.151 TheCDW Programme has made a contribution in promoting publicparticipation. However, there are challenges that still need to beaddressed to strengthen their effectiveness. Key among these is thedevelopment and implementation of clear monitoring and evaluationprocesses to assess their progress and impact, and to systematicallydraw out lessons for future improvements.152
151 Republic of South Africa. Department of Public Service and Administration. Annual Report 2006/2007.152 Republic of South Africa. Department of Public Service and Administration. Proceedings of the 1st CDW Conference held in Gallagher Estate. 11 - 12 June 2007.
Table 8: Synopsis of issues raised in previous SOPS reports
2004 • Whilst departments have stated commitment to public participation, this is rarely
supported by formal policies and procedures.
• National departments perform better than their provincial counterparts in promoting
public participation in policy-making. The “Exco meets the people” has been
successful and could be replicated elsewhere.
• The PSC made efforts to involve citizens in assessing government performance
through Citizen Satisfaction Surveys. Users of services were generally satisfied
with the exception of outcomes based education, Emergency Medical Rescue
Services, the housing subsidy and social development processes.
2005 • The PSC piloted Citizen Forums whereby citizens are invited to participate in
assessing service delivery. These were successful resulting in the identification of
a number of low cost, practical suggestions for improving service delivery.
• Systems for managing public participation tend to be informal and ad hoc, although
genuine efforts have been made to incorporate public inputs where these are sought.
• The Public Service must internalise the importance of public participation and
consultation and make these integral to its workings.
• A clear national policy and guidelines on public participation in policy-making are
needed.
2006 • The Izimbizo led by the Presidency have become a regular feature. However, this
now needs to be integrated into the daily work of the Public Service in a systematic
manner.
• Citizens Forums, piloted by the PSC, now need to be institutionalised.
• Departments need to build their capacity to monitor how effective their systems at
public participation are.
2007 • A remaining key challenge is taking the inputs received from communities forward.
• Redress mechanisms remain inadequate. There is a need for more dialogue to
deepen the understanding of different mechanism of public participation.
Year Key observations and suggestions
7 SOPS Principal 5 new 4/8/08 8:33 AM Page 3
PUBLIC SERVICE COMMISSION
56
While the above milestones are crucial, the PSC has also made otherimportant observations about public participation since 2004, and asynopsis of these is provided in Table 8 on the previous page. Thetable indicates that the efforts towards making government processesmore participatory and transparent have not reached a point wheretheir performance can be categorise as successful. This view is borneout by the fact that whilst the imperative for participatory governmentis contained in policy and other documents, apart from the politicallydriven Izimbizo, there has been reluctance by governmentdepartments to follow suite and engage with citizens in theirimplementation processes.
A recurring challenge on public participation has been the lack ofguidelines prescribing minimum levels of consultation. Suchguidelines are particularly important given that the Public Service isstill experiencing a challenge of engendering a commonunderstanding of participatory governance. For example, in a recentstudy by the PSC,153 it was found that despite the definitions ofconsultation provided by the White Paper on Transforming PublicService Delivery (1997), definitions advanced by most departmentsreflect a potential misalignment with what was intended in the WhitePaper. Departments' understanding of consultation includedinformation sharing, conferences and surveys/research. Theintroduction of minimum consultation guidelines, to be produced by theDPSA, will ensure that definitional differences do not end up dilutingthe quality of consultation required in the Public Service.
A further recurring challenge for the Public Service has been the lackof redress mechanisms. In terms of the Batho Pele Principle ofRedress, when complaints are made to government departments,citizens should receive a sympathetic, positive response.154 However,departments have generally not succeeded in putting in place andimplementing effective redress mechanisms. By their own admission,there is still more to be done in this area, with only 5% of national and2% of provincial departments rating themselves as excellent in theimplementation of redress mechanisms.155
Effective redress mechanisms are important in helping the public tounderstand the workings of departments. Without these, it can beexpected that citizen satisfaction with the services of departments willbe impacted negatively. Since 2003, the PSC completed 4 CitizensSatisfaction Surveys focusing on selected services provided by
153 Republic of South Africa. Public Service Commission. Report on the Implementation of the Batho Principle of Consultation in the Public Service.154 Republic of South Africa. Department of Public Service and Administration. White Paper onTransforming Public Service Delivery. 1997.155 Republic of South Africa. Public Service Commission. Report on the Implementation of the Batho Principle of Redress in the Public Service. 2007
7 SOPS Principal 5 new 4/8/08 8:33 AM Page 4
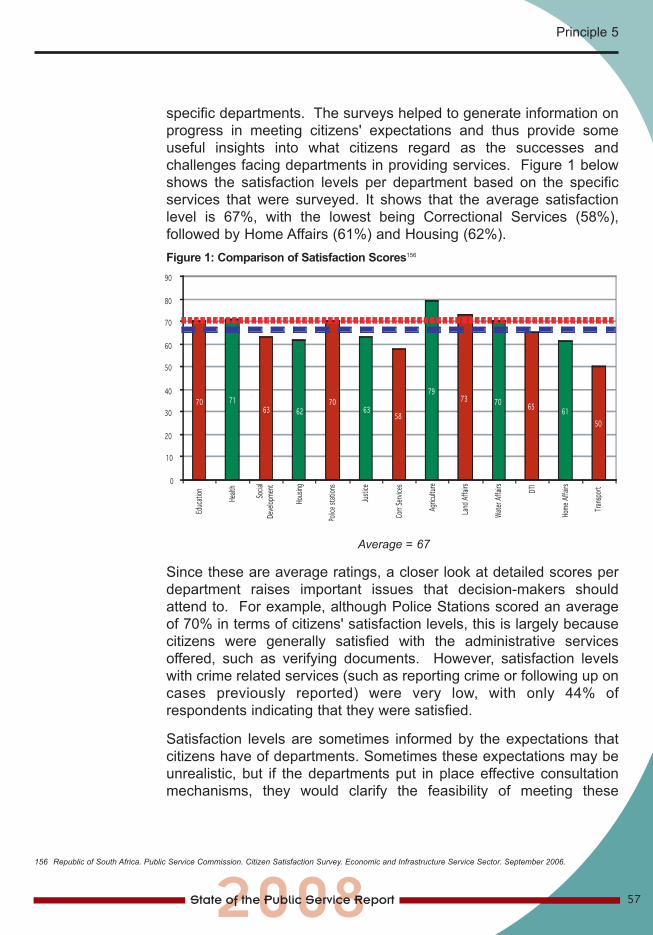
57
Principle 5
specific departments. The surveys helped to generate information onprogress in meeting citizens' expectations and thus provide someuseful insights into what citizens regard as the successes andchallenges facing departments in providing services. Figure 1 belowshows the satisfaction levels per department based on the specificservices that were surveyed. It shows that the average satisfactionlevel is 67%, with the lowest being Correctional Services (58%),followed by Home Affairs (61%) and Housing (62%).
Average = 67
Since these are average ratings, a closer look at detailed scores perdepartment raises important issues that decision-makers shouldattend to. For example, although Police Stations scored an averageof 70% in terms of citizens' satisfaction levels, this is largely becausecitizens were generally satisfied with the administrative servicesoffered, such as verifying documents. However, satisfaction levelswith crime related services (such as reporting crime or following up oncases previously reported) were very low, with only 44% ofrespondents indicating that they were satisfied.
Satisfaction levels are sometimes informed by the expectations thatcitizens have of departments. Sometimes these expectations may beunrealistic, but if the departments put in place effective consultationmechanisms, they would clarify the feasibility of meeting these
156 Republic of South Africa. Public Service Commission. Citizen Satisfaction Survey. Economic and Infrastructure Service Sector. September 2006.
Figure 1: Comparison of Satisfaction Scores156
7 SOPS Principal 5 new 4/8/08 8:33 AM Page 5
58
AcceleratingDeliveryTowards 2009and Beyond
expectations. Effective consultation and engagement withcommunities is going to be particularly important for theimplementation of critical priorities such as crime prevention. Crimeremains a key concern for many South Africans and efforts to preventit can benefit substantially from a partnership approach involvinggovernment, communities and business. To expect that the problemcan only be solved by government alone is unrealistic.
The private space within which crime sometimes occurs means thatsuch situations are often difficult to police. If there is communityparticipation, such 'inside' information and intelligence can be fed topolice to act. Although there has been a consistent call for communityparticipation in fighting crime, this does not appear to have yielded anadequately enthusiastic response.157 The reported murder rate of closeon 20 000 per annum, and the reported rape rate of 52 000 per annumshould serve as a wake up call for strengthening collective actionagainst crime.158
The challenges highlighted in this principle suggest the need for arethink of systems for public participation. Most critically, as part ofgovernment's Programme of Action, a process should be undertakento embark on an honest stock-taking exercise, looking at how publicparticipation can be heightened. There are already compellingfindings available to suggest that such participation requires attention.Given that citizens are becoming increasingly aware of their rights, theacceleration of the implementation of participatory mechanisms is aneven more pressing requirement. There is a menu of options for thedepartments to choose from that have been produced over the mid-term such as Citizen Forums and Citizen Satisfaction Surveys. Theuptake of these has unfortunately been inadequate and should beimproved upon.
One other option is to revisit the early experiences of governmentwhen there were high levels of public engagement around the “green”and “white” paper formulation process. What was positive about theperiod and which should be reinforced now is that there was muchconsensual understanding of what was expected.
157 South African Crime Statistics 2006/7: the Good and the Bad, 16 July 2007. www. Institute for Security Studies.158 South African Police Service. Crime Information Analysis Centre. Crime Statistics for South Africa (1994-2004).
PUBLIC SERVICE COMMISSION
7 SOPS Principal 5 new 4/8/08 8:33 AM Page 6

59
Principle 6
Public Administration must beAccountable
8 SOPS Principal 6 new 4/8/08 8:31 AM Page 1
PUBLIC SERVICE COMMISSION
60
Introduction
Mid-TermReview
A key transformation priority for the post-apartheid Public Service inSouth Africa has been the promotion of accountability. Accountabilityinvolves an obligation on the part of public officials to be answerablefor what they deliver and how they deliver. In other words, it is not onlyenough to account for performance, but rather there should also beaccountability for how this performance takes place.
In order to facilitate and achieve accountability, government has put inplace various instruments. These include the publication of annualreports, the application of performance management and developmentsystems, and policies such as the PAJA159 and the Promotion ofAccess to Information Act (PAIA)160 which allows citizens certain levelsof unfettered access to information held by departments.
The effective implementation of the above instruments is a key prioritygiven that there are heightened expectations locally and internationallyregarding improved accountability. After three terms of democraticgovernment, state institutions will need to demonstrate thatgovernment has effectively used the time it has had in office to lay asolid foundation for an accountability-driven public administration.
One of the key instruments for accountability in the Public Serviceis the system for performance management and development.Through the system, performance expectations are clarified andopportunities are created to provide feedback on performance aswell as address areas of weakness. As part of efforts to ensureimproved accountability, the Performance Management andDevelopment System (PMDS) for Senior Managers were amendedin 2006. In terms of these amendments, senior managers are,among others, required to incorporate all the Batho Pele principlesinto their work plans and Performance Agreements (PAs).161 Prior to2006, Batho Pele was just a normative framework with no concretelinks to the accountability processes of senior managers. Thisamendment was in response to growing concerns that theimplementation of Batho Pele was not being adequatelyinstitutionalised by departments and that the PMDS should be usedas a lever to deepen implementation.162 The amendment was,therefore, an important step towards raising the accountabilitystakes for the implementation of Batho Pele.
159 Republic of South Africa. Department of Justice and Constitutional Development. Promotion of Administrative Justice Act. Act No. 3 of 2000.160 Republic of South Africa. Department of Justice and Constitutional Development. Promotion of Access to Information Act. Act No. 2 of 2000.161 Note: The Batho Pele Principles were introduced in the Public Service in 1995 as part of the White Paper on Transforming Public Service Delivery.162 Note: See for example, Republic of South Africa. Department of Public Service and Administration. Report on the Implementation and promotion of Batho Pele.
June 2004.
8 SOPS Principal 6 new 4/8/08 8:31 AM Page 2
61
Principle 6
In an effort to also deepen accountability for the management of theresources assigned to departments, in 2006 government furtherintroduced an amendment in the PMDS for senior managers whichstipulates that “…no cash bonus may be paid to an accounting officer(irrespective of level) who materially over or under spends on her/hisbudget.”163 This requirement underscores the importance of accountablefinancial management, and it effectively disqualifies Heads ofDepartment (HoDs) from receiving financial performance rewards if thedepartments they are responsible for under or overspend.
However, the practice of over or under spending is but one element offinancial management. Senior managers are required to accountproperly for the entire financial management value chain. One of themost common measures to establish progress with this accountabilityhas been the reports on the regularity audits. Despite the heightenedfocus on accountability, the audits conducted by the A-G still reflectthat departments receive qualified audit opinions. These findingssuggest that the A-G identified certain significant concerns with theway these departments manage the resources assigned to them.Moreover, some departments have received a qualified audit opinionfor at least four years in a row.164
The perceived lack of action from the Executive to address thisproblem impacts negatively on public confidence in the accountabilitysystems of the Public Service. Where the A-G has expressed aqualified audit opinion, there is reason for management and theexecutive to be seriously concerned and to be accordingly called toaccount. Hopefully, the recent call by Cabinet for affected EAs andHoDs to urgently address the weaknesses that give rise to thequalified audit findings will result in the much needed action in thisarea.165 This move by Cabinet is certainly a positive one, although itshould have been taken earlier given the long history of qualified auditopinions in some departments. However, the administrative andexecutive leadership concerned still has a full financial year ahead ofthem during which to get their act together and effect improvementsthat will leave their departments on a sound financial footing.
Effective accountability also needs to be supported by a strongmonitoring and evaluation base which ensures that appropriateperformance information is collected regularly, analysed and reportedon. During the period under review an important development in thisarea was the development of a Government Wide Monitoring and
163 Republic of South Africa. Department of Public Service and Administration. Senior Management Service Handbook, Chapter 4, as amended in 2006.164 Note: See Table 13 on page 58.165 Republic of South Africa. Statement on the Cabinet meeting of 22 January 2008. www.info.gov.za/speeches.
8 SOPS Principal 6 new 4/8/08 8:31 AM Page 3
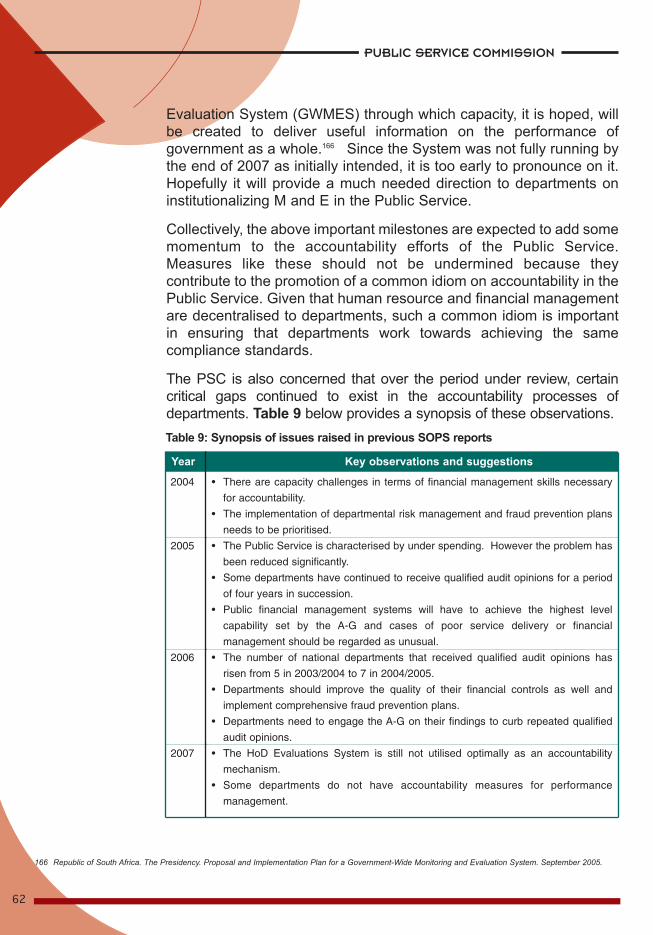
PUBLIC SERVICE COMMISSION
62
Evaluation System (GWMES) through which capacity, it is hoped, willbe created to deliver useful information on the performance ofgovernment as a whole.166 Since the System was not fully running bythe end of 2007 as initially intended, it is too early to pronounce on it.Hopefully it will provide a much needed direction to departments oninstitutionalizing M and E in the Public Service.
Collectively, the above important milestones are expected to add somemomentum to the accountability efforts of the Public Service.Measures like these should not be undermined because theycontribute to the promotion of a common idiom on accountability in thePublic Service. Given that human resource and financial managementare decentralised to departments, such a common idiom is importantin ensuring that departments work towards achieving the samecompliance standards.
The PSC is also concerned that over the period under review, certaincritical gaps continued to exist in the accountability processes ofdepartments. Table 9 below provides a synopsis of these observations.
166 Republic of South Africa. The Presidency. Proposal and Implementation Plan for a Government-Wide Monitoring and Evaluation System. September 2005.
Table 9: Synopsis of issues raised in previous SOPS reports
2004 • There are capacity challenges in terms of financial management skills necessary
for accountability.
• The implementation of departmental risk management and fraud prevention plans
needs to be prioritised.
2005 • The Public Service is characterised by under spending. However the problem has
been reduced significantly.
• Some departments have continued to receive qualified audit opinions for a period
of four years in succession.
• Public financial management systems will have to achieve the highest level
capability set by the A-G and cases of poor service delivery or financial
management should be regarded as unusual.
2006 • The number of national departments that received qualified audit opinions has
risen from 5 in 2003/2004 to 7 in 2004/2005.
• Departments should improve the quality of their financial controls as well and
implement comprehensive fraud prevention plans.
• Departments need to engage the A-G on their findings to curb repeated qualified
audit opinions.
2007 • The HoD Evaluations System is still not utilised optimally as an accountability
mechanism.
• Some departments do not have accountability measures for performance
management.
Year Key observations and suggestions
8 SOPS Principal 6 new 4/8/08 8:31 AM Page 4
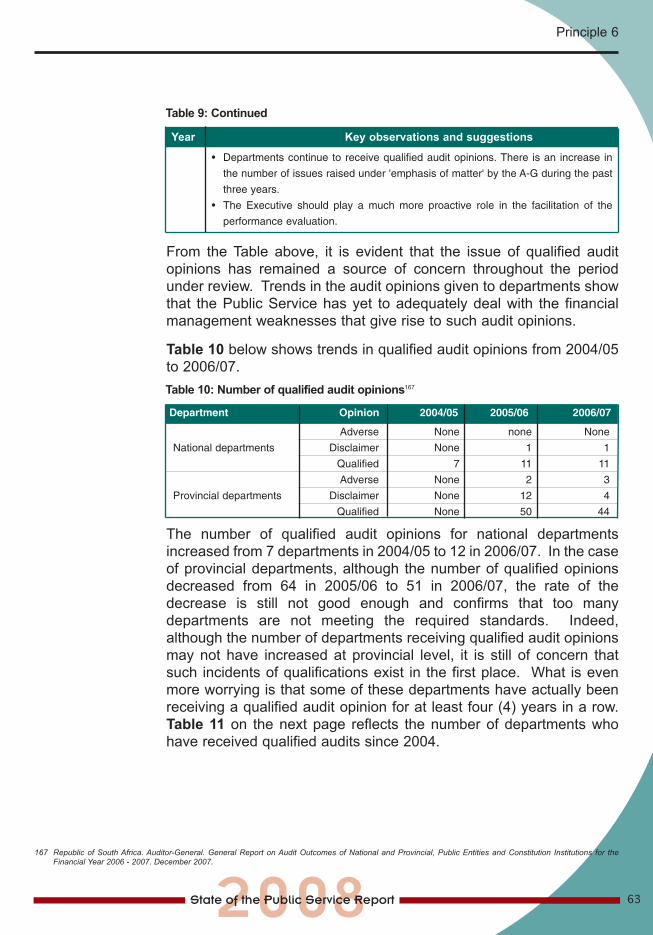
From the Table above, it is evident that the issue of qualified auditopinions has remained a source of concern throughout the periodunder review. Trends in the audit opinions given to departments showthat the Public Service has yet to adequately deal with the financialmanagement weaknesses that give rise to such audit opinions.
Table 10 below shows trends in qualified audit opinions from 2004/05to 2006/07.
The number of qualified audit opinions for national departmentsincreased from 7 departments in 2004/05 to 12 in 2006/07. In the caseof provincial departments, although the number of qualified opinionsdecreased from 64 in 2005/06 to 51 in 2006/07, the rate of thedecrease is still not good enough and confirms that too manydepartments are not meeting the required standards. Indeed,although the number of departments receiving qualified audit opinionsmay not have increased at provincial level, it is still of concern thatsuch incidents of qualifications exist in the first place. What is evenmore worrying is that some of these departments have actually beenreceiving a qualified audit opinion for at least four (4) years in a row.Table 11 on the next page reflects the number of departments whohave received qualified audits since 2004.
63
Principle 6
167 Republic of South Africa. Auditor-General. General Report on Audit Outcomes of National and Provincial, Public Entities and Constitution Institutions for theFinancial Year 2006 - 2007. December 2007.
Table 9: Continued
• Departments continue to receive qualified audit opinions. There is an increase in
the number of issues raised under 'emphasis of matter' by the A-G during the past
three years.
• The Executive should play a much more proactive role in the facilitation of the
performance evaluation.
Year Key observations and suggestions
Adverse None none None
National departments Disclaimer None 1 1
Qualified 7 11 11
Adverse None 2 3
Provincial departments Disclaimer None 12 4
Qualified None 50 44
Department Opinion 2004/05 2005/06 2006/07
Table 10: Number of qualified audit opinions167
8 SOPS Principal 6 new 4/8/08 8:31 AM Page 5
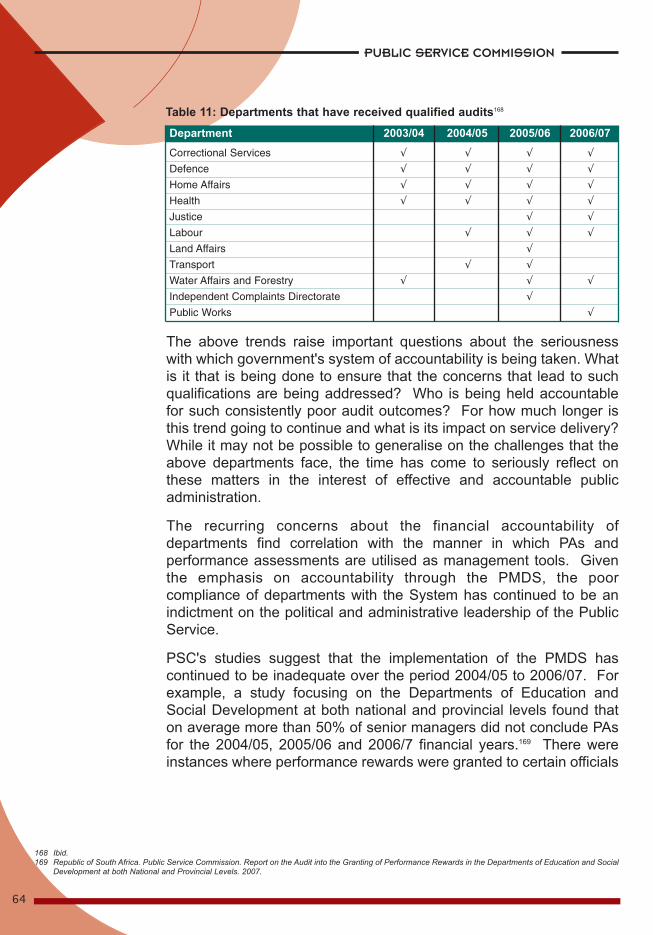
PUBLIC SERVICE COMMISSION
64
The above trends raise important questions about the seriousnesswith which government's system of accountability is being taken. Whatis it that is being done to ensure that the concerns that lead to suchqualifications are being addressed? Who is being held accountablefor such consistently poor audit outcomes? For how much longer isthis trend going to continue and what is its impact on service delivery?While it may not be possible to generalise on the challenges that theabove departments face, the time has come to seriously reflect onthese matters in the interest of effective and accountable publicadministration.
The recurring concerns about the financial accountability ofdepartments find correlation with the manner in which PAs andperformance assessments are utilised as management tools. Giventhe emphasis on accountability through the PMDS, the poorcompliance of departments with the System has continued to be anindictment on the political and administrative leadership of the PublicService.
PSC's studies suggest that the implementation of the PMDS hascontinued to be inadequate over the period 2004/05 to 2006/07. Forexample, a study focusing on the Departments of Education andSocial Development at both national and provincial levels found thaton average more than 50% of senior managers did not conclude PAsfor the 2004/05, 2005/06 and 2006/7 financial years.169 There wereinstances where performance rewards were granted to certain officials
168 Ibid.169 Republic of South Africa. Public Service Commission. Report on the Audit into the Granting of Performance Rewards in the Departments of Education and Social
Development at both National and Provincial Levels. 2007.
Table 11: Departments that have received qualified audits168
Correctional Services √ √ √ √
Defence √ √ √ √
Home Affairs √ √ √ √
Health √ √ √ √
Justice √ √
Labour √ √ √
Land Affairs √
Transport √ √
Water Affairs and Forestry √ √ √
Independent Complaints Directorate √
Public Works √
Department 2003/04 2004/05 2005/06 2006/07
8 SOPS Principal 6 new 4/8/08 8:31 AM Page 6
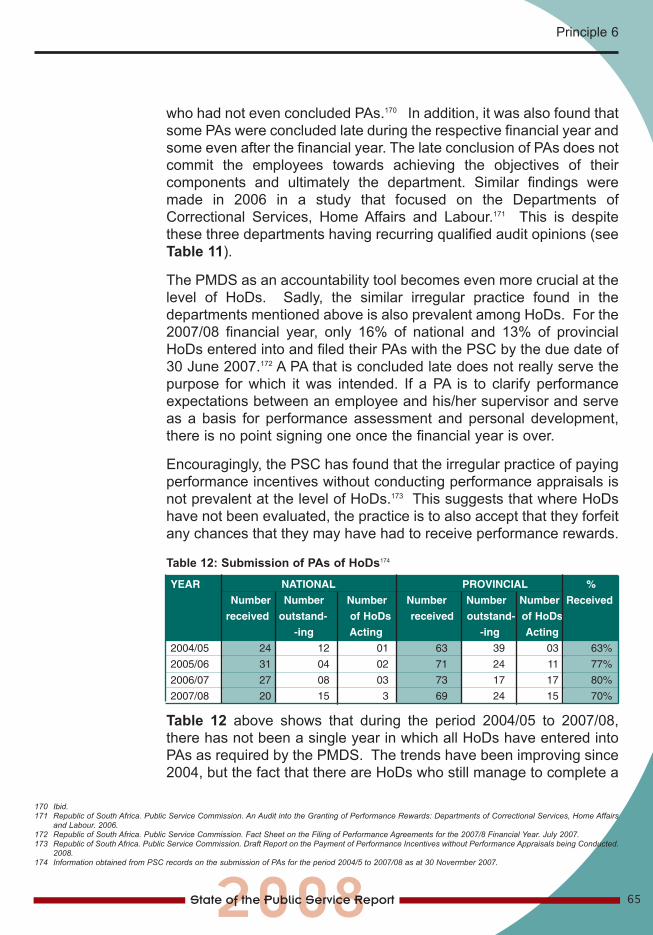
65
Principle 6
who had not even concluded PAs.170 In addition, it was also found thatsome PAs were concluded late during the respective financial year andsome even after the financial year. The late conclusion of PAs does notcommit the employees towards achieving the objectives of theircomponents and ultimately the department. Similar findings weremade in 2006 in a study that focused on the Departments ofCorrectional Services, Home Affairs and Labour.171 This is despitethese three departments having recurring qualified audit opinions (seeTable 11).
The PMDS as an accountability tool becomes even more crucial at thelevel of HoDs. Sadly, the similar irregular practice found in thedepartments mentioned above is also prevalent among HoDs. For the2007/08 financial year, only 16% of national and 13% of provincialHoDs entered into and filed their PAs with the PSC by the due date of30 June 2007.172 A PA that is concluded late does not really serve thepurpose for which it was intended. If a PA is to clarify performanceexpectations between an employee and his/her supervisor and serveas a basis for performance assessment and personal development,there is no point signing one once the financial year is over.
Encouragingly, the PSC has found that the irregular practice of payingperformance incentives without conducting performance appraisals isnot prevalent at the level of HoDs.173 This suggests that where HoDshave not been evaluated, the practice is to also accept that they forfeitany chances that they may have had to receive performance rewards.
Table 12: Submission of PAs of HoDs174
Table 12 above shows that during the period 2004/05 to 2007/08,there has not been a single year in which all HoDs have entered intoPAs as required by the PMDS. The trends have been improving since2004, but the fact that there are HoDs who still manage to complete a
170 Ibid.171 Republic of South Africa. Public Service Commission. An Audit into the Granting of Performance Rewards: Departments of Correctional Services, Home Affairs
and Labour. 2006.172 Republic of South Africa. Public Service Commission. Fact Sheet on the Filing of Performance Agreements for the 2007/8 Financial Year. July 2007.173 Republic of South Africa. Public Service Commission. Draft Report on the Payment of Performance Incentives without Performance Appraisals being Conducted.
2008.174 Information obtained from PSC records on the submission of PAs for the period 2004/5 to 2007/08 as at 30 Novermber 2007.
YEAR NATIONAL PROVINCIAL %
Number Number Number Number Number Number Received
received outstand- of HoDs received outstand- of HoDs
-ing Acting -ing Acting
2004/05 24 12 01 63 39 03 63%
2005/06 31 04 02 71 24 11 77%
2006/07 27 08 03 73 17 17 80%
2007/08 20 15 3 69 24 15 70%
8 SOPS Principal 6 new 4/8/08 8:31 AM Page 7
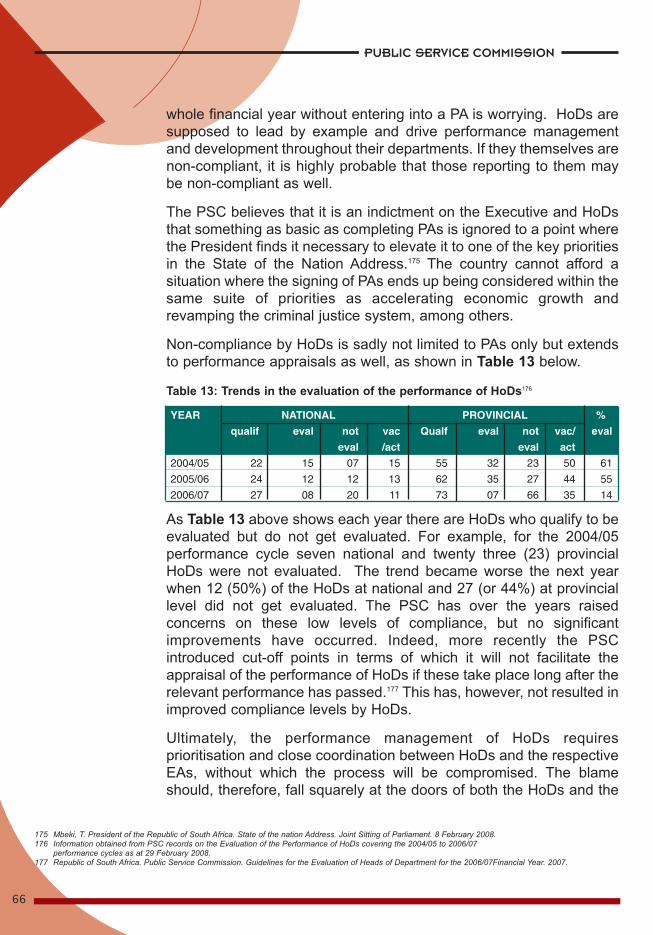
PUBLIC SERVICE COMMISSION
66
whole financial year without entering into a PA is worrying. HoDs aresupposed to lead by example and drive performance managementand development throughout their departments. If they themselves arenon-compliant, it is highly probable that those reporting to them maybe non-compliant as well.
The PSC believes that it is an indictment on the Executive and HoDsthat something as basic as completing PAs is ignored to a point wherethe President finds it necessary to elevate it to one of the key prioritiesin the State of the Nation Address.175 The country cannot afford asituation where the signing of PAs ends up being considered within thesame suite of priorities as accelerating economic growth andrevamping the criminal justice system, among others.
Non-compliance by HoDs is sadly not limited to PAs only but extendsto performance appraisals as well, as shown in Table 13 below.
Table 13: Trends in the evaluation of the performance of HoDs176
As Table 13 above shows each year there are HoDs who qualify to beevaluated but do not get evaluated. For example, for the 2004/05performance cycle seven national and twenty three (23) provincialHoDs were not evaluated. The trend became worse the next yearwhen 12 (50%) of the HoDs at national and 27 (or 44%) at provinciallevel did not get evaluated. The PSC has over the years raisedconcerns on these low levels of compliance, but no significantimprovements have occurred. Indeed, more recently the PSCintroduced cut-off points in terms of which it will not facilitate theappraisal of the performance of HoDs if these take place long after therelevant performance has passed.177 This has, however, not resulted inimproved compliance levels by HoDs.
Ultimately, the performance management of HoDs requiresprioritisation and close coordination between HoDs and the respectiveEAs, without which the process will be compromised. The blameshould, therefore, fall squarely at the doors of both the HoDs and the
175 Mbeki, T. President of the Republic of South Africa. State of the nation Address. Joint Sitting of Parliament. 8 February 2008.176 Information obtained from PSC records on the Evaluation of the Performance of HoDs covering the 2004/05 to 2006/07
performance cycles as at 29 February 2008.177 Republic of South Africa. Public Service Commission. Guidelines for the Evaluation of Heads of Department for the 2006/07Financial Year. 2007.
YEAR NATIONAL PROVINCIAL %
qualif eval not vac Qualf eval not vac/ eval
eval /act eval act
2004/05 22 15 07 15 55 32 23 50 61
2005/06 24 12 12 13 62 35 27 44 55
2006/07 27 08 20 11 73 07 66 35 14
8 SOPS Principal 6 new 4/8/08 8:31 AM Page 8

67
Principle 6
AcceleratingDeliveryTowards 2009and Beyond
EAs. The recent call by Cabinet on EAs and HoDs to address thecauses of qualified audit opinions should find expression in this areaas well. This is particularly important to ensure that following the 2009elections, EAs do not inherit a backlog of outstanding performanceappraisals which demand their attention at a time when they should befocusing on the new electoral mandate.
The PSC has over the years drawn attention to aspects ofaccountability that require attention in the Public Service. Goingforward, the PSC believes that there needs to be an honestconsideration of why qualified audit opinions continue to persist incertain departments, and why performance management at the levelof HoDs is still not receiving adequate attention. Is it becauseParliament is not holding the Public Service accountable enough anddoes not demand explanations and concrete interventions in areas ofnon-compliance, or is it because there are fundamental difficulties thatthe Departments are facing and are genuinely trying to address?There may be many other reasons, but as the third term of democraticgovernment draws to a close, these issues must be tackled andresolved. There are other areas of accountability (such as thegeneration of performance data and the preparation of annual reports)where measures are being taken to ensure improvement and whereprogress is being made. There is thus no reason for the cycle ofqualified audits and poor performance management not to be brokendecisively.
The PSC has previously proposed that a roundtable discussion beconvened to create an opportunity for the Executive and HoDs toassess the challenges they face in insuring the effectiveimplementation of performance management and developmentpractices. This roundtable should be convened as a matter of urgency.
PAs must be entered into timeously as required by Public Serviceprescripts, failing which both the HoDs and EAs concerned should becalled to account by Parliament. The PSC currently produces a factsheet on compliance with PAs after the due date of June each year,and this can be used as a basis to call HoDs and EAs to account.
There should also be a careful examination of PAs as a managementtool in the Public Service. Such an examination should help to
8 SOPS Principal 6 new 4/8/08 8:31 AM Page 9

PUBLIC SERVICE COMMISSION
68
establish whether some of the implementation challenges currentlyexperienced are perhaps not as a result of inherent weaknesses withthe PA as a tool.
The use of organisational performance should also be considered toprovide further insight into the performance of departments. Suchtools will improve the quality of the evaluation, as both the individualand organisational dimensions of performance would be considered.
8 SOPS Principal 6 new 4/8/08 8:31 AM Page 10
69
Principle 7
Transparency must be Fosteredby Providing the Public withTimely, Accessible and AccurateInformation
9 SOPS Principal 7 new 4/8/08 8:30 AM Page 1

PUBLIC SERVICE COMMISSION
70
178 Pasquier, M and Villeneuve, J. Organisational Barriers to Transparency: a Typology and Analysis of Organisational Behaviour Tending to Prevent or RestrictAccess to Information. International Review of Administrative Sciences. (73(1). Sage Publications. March 2007.
179 Ibid.180 Republic of South Africa. Public Service Commission. State of the Public Service Report. 2007.
Introduction
Mid-Termreview
Transparency remains a cornerstone for the successfulimplementation of transformative legislation. Indeed, transparency is acrucial enabler which facilitates adherence to the rest of theConstitutional values and principles of public administration. Forexample, the transparent sharing of information by governmentenables the public to participate from an informed perspective inpolicy-making and implementation. In addition, sharing information inthis way facilitates accountability as the activities of governmentdepartments are put out to public scrutiny.
However, organisations the world over tend to grapple with how tostrike a balance between transparency and the provision ofinformation which, for one reason or another, should be protected.178
Faced with the uncertainty of whether to disclose information or not,and faced with stakeholders who also do not always know where todraw the line, organisations (including governments) find themselvesmanifesting behaviour that may create impediments to transparency.179
These are essentially global pressures for transparency, to which theSouth African Public Service is not immune. The Public Service isexpected to make information available on own accord and upondemand, and this expectation will continue to grow as the democraticdispensation comes of age and the public becomes more involved ingovernance processes. Unless the Public Service equips itself to dealwith these expectations, it may find itself increasingly failing thetransparency litmus test.
Requirements for transparency in the Public Service are built intospecific legislation. Post-2004 the focus has been on strengtheningimplementation of existing measures while also introducing new oneswhere necessary. A key shift has been in how departmental annualreports have been reconfigured to serve as an effective mechanism oftransparency. The content of the reports is gradually showing achange from reporting on activities to focusing on outputs,180 and thereis already a vibrant debate that seeks to lift reporting to the level ofoutcomes. This debate is essential to ensure that the importantquestions which relate to effectiveness and public value in PublicService delivery are addressed.
Although annual reports are important, they only get published five
9 SOPS Principal 7 new 4/8/08 8:30 AM Page 2
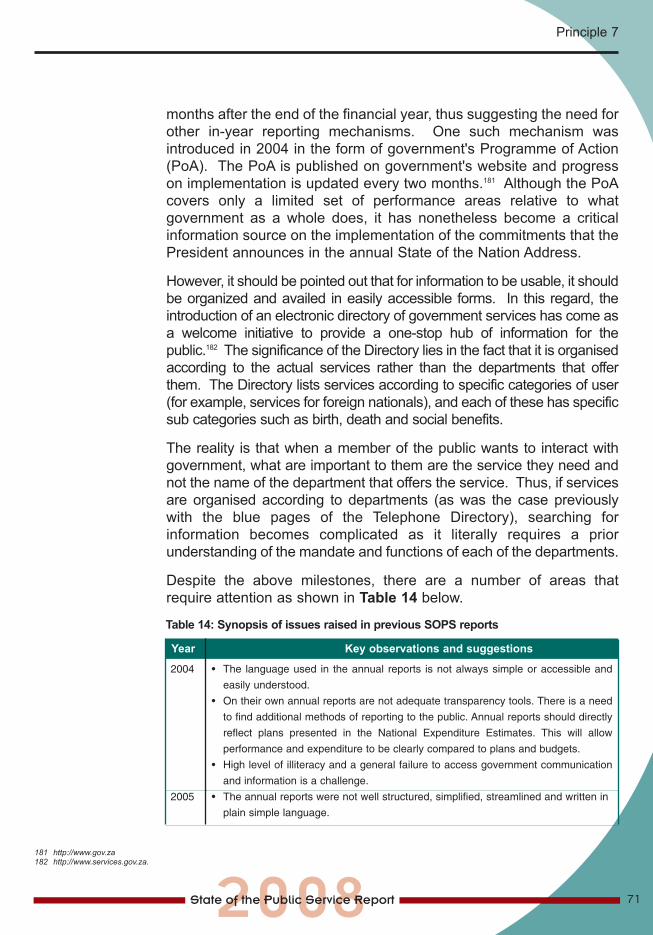
71
Principle 7
months after the end of the financial year, thus suggesting the need forother in-year reporting mechanisms. One such mechanism wasintroduced in 2004 in the form of government's Programme of Action(PoA). The PoA is published on government's website and progresson implementation is updated every two months.181 Although the PoAcovers only a limited set of performance areas relative to whatgovernment as a whole does, it has nonetheless become a criticalinformation source on the implementation of the commitments that thePresident announces in the annual State of the Nation Address.
However, it should be pointed out that for information to be usable, it shouldbe organized and availed in easily accessible forms. In this regard, theintroduction of an electronic directory of government services has come asa welcome initiative to provide a one-stop hub of information for thepublic.182 The significance of the Directory lies in the fact that it is organisedaccording to the actual services rather than the departments that offerthem. The Directory lists services according to specific categories of user(for example, services for foreign nationals), and each of these has specificsub categories such as birth, death and social benefits.
The reality is that when a member of the public wants to interact withgovernment, what are important to them are the service they need andnot the name of the department that offers the service. Thus, if servicesare organised according to departments (as was the case previouslywith the blue pages of the Telephone Directory), searching forinformation becomes complicated as it literally requires a priorunderstanding of the mandate and functions of each of the departments.
Despite the above milestones, there are a number of areas thatrequire attention as shown in Table 14 below.
181 http://www.gov.za182 http://www.services.gov.za.
Table 14: Synopsis of issues raised in previous SOPS reports
2004 • The language used in the annual reports is not always simple or accessible and
easily understood.
• On their own annual reports are not adequate transparency tools. There is a need
to find additional methods of reporting to the public. Annual reports should directly
reflect plans presented in the National Expenditure Estimates. This will allow
performance and expenditure to be clearly compared to plans and budgets.
• High level of illiteracy and a general failure to access government communication
and information is a challenge.
2005 • The annual reports were not well structured, simplified, streamlined and written in
plain simple language.
Year Key observations and suggestions
9 SOPS Principal 7 new 4/8/08 8:30 AM Page 3
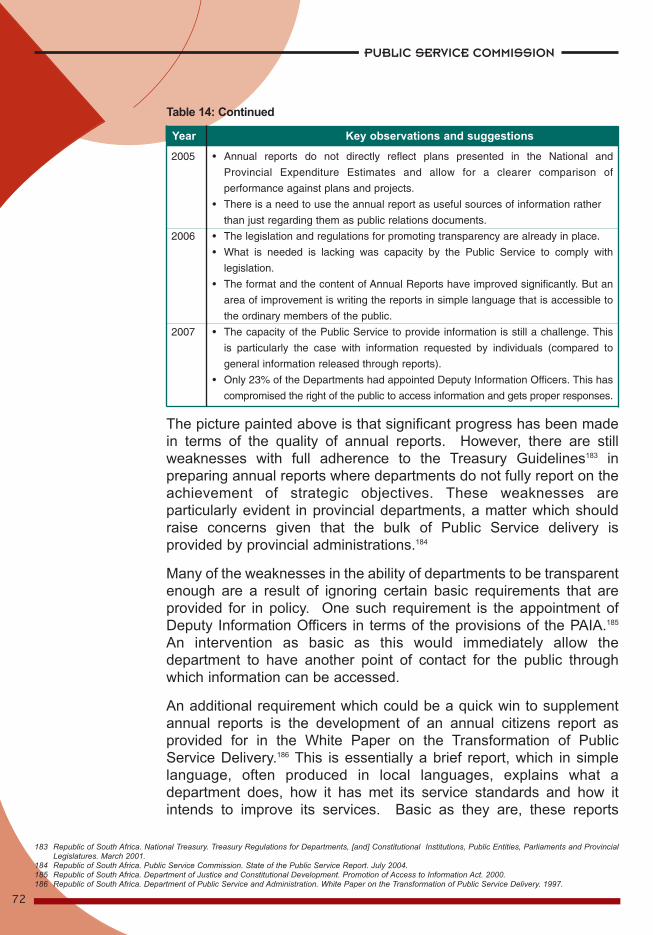
PUBLIC SERVICE COMMISSION
72
The picture painted above is that significant progress has been madein terms of the quality of annual reports. However, there are stillweaknesses with full adherence to the Treasury Guidelines183 inpreparing annual reports where departments do not fully report on theachievement of strategic objectives. These weaknesses areparticularly evident in provincial departments, a matter which shouldraise concerns given that the bulk of Public Service delivery isprovided by provincial administrations.184
Many of the weaknesses in the ability of departments to be transparentenough are a result of ignoring certain basic requirements that areprovided for in policy. One such requirement is the appointment ofDeputy Information Officers in terms of the provisions of the PAIA.185
An intervention as basic as this would immediately allow thedepartment to have another point of contact for the public throughwhich information can be accessed.
An additional requirement which could be a quick win to supplementannual reports is the development of an annual citizens report asprovided for in the White Paper on the Transformation of PublicService Delivery.186 This is essentially a brief report, which in simplelanguage, often produced in local languages, explains what adepartment does, how it has met its service standards and how itintends to improve its services. Basic as they are, these reports
183 Republic of South Africa. National Treasury. Treasury Regulations for Departments, [and] Constitutional Institutions, Public Entities, Parliaments and ProvincialLegislatures. March 2001.
184 Republic of South Africa. Public Service Commission. State of the Public Service Report. July 2004.185 Republic of South Africa. Department of Justice and Constitutional Development. Promotion of Access to Information Act. 2000.186 Republic of South Africa. Department of Public Service and Administration. White Paper on the Transformation of Public Service Delivery. 1997.
Table 14: Continued
2005 • Annual reports do not directly reflect plans presented in the National and
Provincial Expenditure Estimates and allow for a clearer comparison of
performance against plans and projects.
• There is a need to use the annual report as useful sources of information rather
than just regarding them as public relations documents.
2006 • The legislation and regulations for promoting transparency are already in place.
• What is needed is lacking was capacity by the Public Service to comply with
legislation.
• The format and the content of Annual Reports have improved significantly. But an
area of improvement is writing the reports in simple language that is accessible to
the ordinary members of the public.
2007 • The capacity of the Public Service to provide information is still a challenge. This
is particularly the case with information requested by individuals (compared to
general information released through reports).
• Only 23% of the Departments had appointed Deputy Information Officers. This has
compromised the right of the public to access information and gets proper responses.
Year Key observations and suggestions
9 SOPS Principal 7 new 4/8/08 8:30 AM Page 4

73
Principle 7
provide a very accessible and yet informative source of information.Sadly, very few departments seem to have found it necessary toproduce these reports. In a study conducted by the PSC, not a singlenational department could confirm that it had produced such a report,and only 18 provincial departments had produced them.187 Here, thePublic Service is clearly missing a good opportunity to improve itstransparency by using a fairly easy and basic tool.
Due credit should, however, go to Limpopo and the Free State wheredepartments generally produce Annual Citizens' Reports.188 In fact,departments in provinces often also go a step further and present thereports on the annual Batho Pele day, a day on which departments invitemembers of the public to events which seek to raise awareness on theimportance of putting people first in Public Service delivery. Attendanceat these events is usually good, thus ensuring that the Departmentsshare their information with more citizens. An added advantage in thisregard is that on this day the report is actually presented and not justdistributed, thus ensuring that citizens who are not literate can also haveaccess to the information contained in the report.189
Departments need to appreciate that mechanisms that promoteaccess to information in return also boost public confidence ingovernment institutions. Opinion surveys show that public confidencein government tends to increase around the time of general elections,a pattern that is likely attributable to the vast information that is usuallydisseminated during that time.190 If this extent of informationdissemination could be sustained throughout the year, its impact onpublic confidence could also be optimised.
Public confidence is also influenced by the transparency with whichgovernment manages the private contributions that members of thepublic may, for one reason or another, want to offer public servants.Given the fine line that may exist between gifts and bribes, the publicneeds to be assured that there are clear institutional frameworks andpractices that regulate such private contributions, and that the integrity,impartiality and fairness of public servants is not compromised in thisprocess. It is against this background that the PSC has noted withconcern that there appears to be inconsistencies in the currentlegislative framework governing the receipt of gifts by publicservants.191 While the Code of Conduct requires the receipt of gifts tobe done with the express written approval of the HoD, the Financial
187 Republic of South Africa. Public Service Commission. Draft Report on the Implementation of the Batho Pele Principle of Openness and Transparency in the PublicService. 2008.
188 Ibid.189 Ibid.190 Republic of South Africa. The Presidency. Development Indicators Mid-Term Review. Undated.191 Republic of South Africa. Public Service Commission. Draft Report on the Management of Gifts in the Public Service. 2008.
9 SOPS Principal 7 new 4/8/08 8:30 AM Page 5
74
AcceleratingDeliveryTowards 2009and Beyond
Disclosure Framework does not explicitly require such written approvalbut simply obliges senior managers to disclose gifts valued at R350and above.192
The current inconsistencies create risks for the Public Servicebecause public servants may end up using what would boil down topersonal and often inconsistent judgements when they are offeredgifts. Such discretion becomes even riskier considering that only 4 in10 departments keep gift registers and that even where registers arekept there has not been a practice of making them available to publicscrutiny. Transparency in the receipt of gifts is to some extentpractised at the level of Parliament because there is a section of theRegister of Members' Interests that is made public.193 There is not asimilar provision for public servants. Considering the magnitude ofsome of the gifts received,194 there is case to require moretransparency in this regard while still having due regard for theindividuals' right to privacy and confidentiality.
There are clear quick wins that the Public Service should immediatelyattend to in order to deepen transparency through the provision ofinformation. The development of Annual Citizens' Reports should besomething that each department commits itself to starting this financialyear. In addition, the appointment of Deputy Information Officersshould be fast-tracked to ensure that there is a clear assignment ofduties to officials who should provide information to the public.However, in addressing these two aspects, departments would needto also ensure that they strengthen their basic record-keepingprocesses so that accurate information can be available.
The need to strengthen the alignment of plans and reports has beenraised consistently and decisive steps are required in this area.Departments are required to develop annual work plans and producequarterly reports against these work plans, and there is no reason whythis information should not be published on the department's websites.Subjecting these documents to public scrutiny will encouragedepartments to ensure closer alignment between their plans and reports.
The frameworks for managing the receipt of gifts by public servantsshould also be reviewed to ensure that there is consistency in what thedifferent pieces of legislation provide for. In addition, departments mustensure that they put in place and maintain accurate gift registers fortheir employees.
192 Ibid193 Republic of South Africa. Parliament of the Republic of South Africa. Code of Conduct.194 Note: In one incident, a public servant received a bursary for their daughter to the value of R60 000.
PUBLIC SERVICE COMMISSION
9 SOPS Principal 7 new 4/8/08 8:30 AM Page 6
75
Principle 8
Good Human ResourceManagement and CareerDevelopment Practices, toMaximise Human Potential, must be Cultivated
10 SOPS Principal 8 new 4/8/08 8:27 AM Page 1
PUBLIC SERVICE COMMISSION
76
195 Fraser-Moleketi, G.J. Keynote Address at the International Resource Management Conference. “Building Public Sector Human Resource Capacity in aDevelopmental State.” July 2007.
Introduction
Mid-TermReview
It is generally accepted that public servants are key in determining howwell the policies of government are implemented. As the interpretersand implementers of policy, the levels of skill and motivation of publicservants entrusted with the task of realising government objectivesdetermines the achievement of government priorities. It is, therefore,important to ensure that the human resource management value chainis appropriately strengthened to optimise the potential of employees. Ifthis task is properly fulfilled, it should translate in a highly skilled cadreof public servants who indeed translate policy into effectiveprogrammes, thus improving the quality of life of citizens.
In order to support the effective management of human resources, theSouth African Public Service has sought to shift away from pastmanagement practices which were more compliance driven, impersonal,non-development and authoritarian. The new approach aims to harnesshuman potential through practices that privilege diversity, emphasise peersupport, institute lifelong learning, promote professionalism and recogniseand reward good performance. Such a strategic approach goes to theheart of accelerating transformation and service delivery for the benefit ofthe people of South Africa.195
The application of this strategic approach has, however, given rise tothe need to build strong capacity within departments. During theremaining period of government's third term of office, an importantconsideration would be to ensure that departments consolidate theircapacity to implement the strategic frameworks for human resourcemanagement, and to urgently address those areas where progress isunsatisfactory.
The transformation foundation that was laid during the first decade ofdemocracy was carried forward post-2004 through implementationand the introduction of further complementary policy instruments. Oneof the key developments in this regard has been the need to create ameaningful balance between centralised and decentralised functions.More specifically, there have been indications that the balancebetween decentralisation and centralisation of functions is being re-examined. An amendment of the Public Service Regulations on/forthe process of organisational restructuring, which until now led tosharp disparities between departments, has been one of the steps
10 SOPS Principal 8 new 4/8/08 8:27 AM Page 2
77
Principle 8
taken in this direction. In terms of this amendment, it is nowmandatory for departments to consult with the DPSA before theyfinalise their organograms.196 The amendment to the regulationsessentially seeks to reintroduce consistency in the manner in whichdepartments review their organisational establishments.
Ensuring greater consistency and coherence in organisationalpractices within a decentralised context requires strong administrativeleadership in departments. Government recognised the importance ofsuch leadership, and accordingly, there has been a sustained focus onstrengthening the management echelon of the Public Service.Following the introduction of the Senior Management Service (SMS)dispensation on 1 January 2001 by means of the promulgation ofChapter 4 of the Public Service Regulations, 2000,197 governmentfocused on the introduction of measures to create a sustainable poolof middle managers to compete for senior management positions. Inthis regard, a Generic Competency Framework was finalised during2005 and an Accelerated Development Programme (ADP) for middlemanagers introduced the following year. The ADP targets middlemanagers from designated groups particularly women and people withdisabilities to prepare them for the challenges of functioning in seniormanagement.
One of the challenges that the senior management echelon has todeal with is to ensure that policies and implementation frameworksdeveloped by government are adequately informed by and addressthe contextual realities that exist in local communities. This requiressenior managers who are in touch with service delivery dynamics atlocal level, and who can critically reflect on these dynamics to benefitpolicy and implementation. In order to address this need, an actionlearning training programme called Khaedu was implemented.198
Khaedu represents an important step towards ensuring that seniormanagers' stay in touch with the public administration dynamics thatexist at the level of service delivery sites. It is, however, important forthe DPSA to keep monitoring the programme to ensure that iteffectively addresses the purpose for which it was intended.
However, even with appropriate training interventions such as Khaedu,senior managers may not be effective in their management of thehuman resource value chain if the environment within which they work
196 Public Service Regulation. Chapter 1, part 3 b(2) which states an EA shall determine in consultation with the Minister the departments organisational structure interms of its core and support functions.
197 Public Service Regulation. Chapter 4. Senior Management Service dispensation, 1 January 2000. 198 Khaedu is a TshiVenda word which means “challenge”
10 SOPS Principal 8 new 4/8/08 8:27 AM Page 3
PUBLIC SERVICE COMMISSION
78
is not enabling. Effective HR components in departments arefundamental to the creation of such an enabling environment. In thisregard, an important milestone to reposition the human resourcefunction in the Public Service took place in 2006 with the approval byCabinet of various interventions for implementation. These include thedevelopment of generic organisational structures for Human ResourceManagement (HRM) components, the design of a competencyframework for HRM components, the development of performanceindicators for the HRM function and the establishment of a forum forhuman resource practitioners to facilitate collective learning throughan on-going exchange of experiences.199
The successful implementation of all these new developments willrequire, among others, a stable environment in which there are soundrelationships between government and organised labour. Going into2004, government and organised labour continued to strengthenlabour relations through the use of the collective bargaining structuresestablished for this purpose. Many resolutions were made andimplemented, covering a range of areas such as multi-year wageincrease agreements, medical aid, housing allowances, and pensionbenefits.
However, in 2007 the country witnessed a massive Public Servicestrike which emanated from a breakdown in the negotiations betweengovernment and organised labour. Lasting for just over a month, thiswas perhaps the longest uninterrupted public service strike since thedawn of democracy in South Africa. When the strike eventually cameto an end, different conclusions were drawn about its success orotherwise. The PSC believes that whatever conclusions differentparties arrive at on this matter, there must be a very importantmessage that this experience is sending to government and organisedlabour: It is for the parties to have an honest reflection on what wentwrong. Future collective bargaining will have to be informed by thesobering lessons from this experience.
In addition to reflecting on the strike experience, other recurringchallenges also need the attention of the Public Service as itconsolidates its achievements and prepares for a new term ofgovernment. A synopsis of these is provided in Table 15.
199 Pretorius, L.P. Presentation to EPCM Steering Committee on Re-positioning HR for Strategic Human Resource Management in the Public Service. 4 October 2007.
10 SOPS Principal 8 new 4/8/08 8:27 AM Page 4
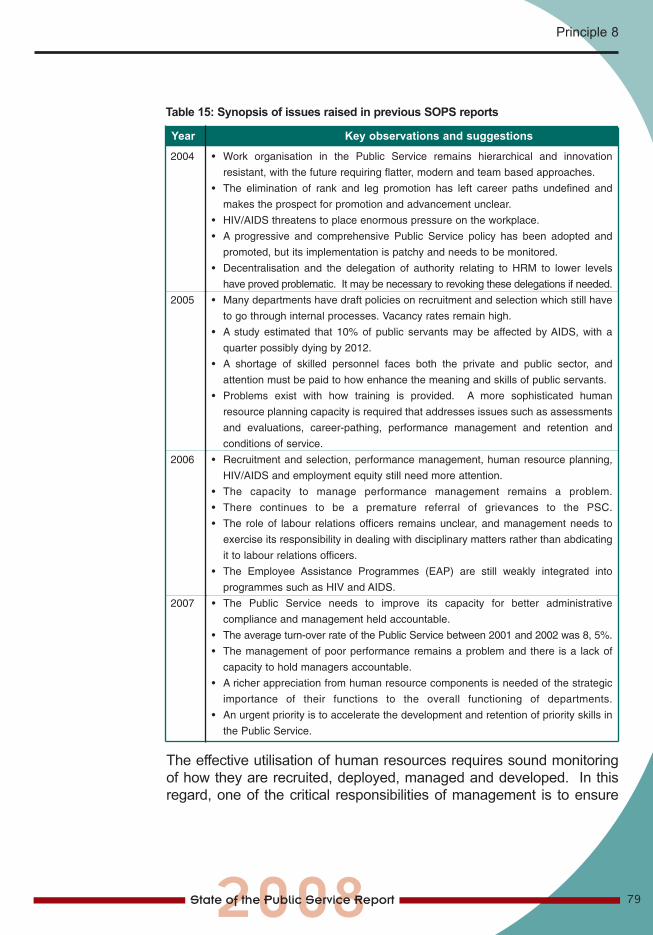
79
Principle 8
The effective utilisation of human resources requires sound monitoringof how they are recruited, deployed, managed and developed. In thisregard, one of the critical responsibilities of management is to ensure
Table 15: Synopsis of issues raised in previous SOPS reports
2004 • Work organisation in the Public Service remains hierarchical and innovation
resistant, with the future requiring flatter, modern and team based approaches.
• The elimination of rank and leg promotion has left career paths undefined and
makes the prospect for promotion and advancement unclear.
• HIV/AIDS threatens to place enormous pressure on the workplace.
• A progressive and comprehensive Public Service policy has been adopted and
promoted, but its implementation is patchy and needs to be monitored.
• Decentralisation and the delegation of authority relating to HRM to lower levels
have proved problematic. It may be necessary to revoking these delegations if needed.
2005 • Many departments have draft policies on recruitment and selection which still have
to go through internal processes. Vacancy rates remain high.
• A study estimated that 10% of public servants may be affected by AIDS, with a
quarter possibly dying by 2012.
• A shortage of skilled personnel faces both the private and public sector, and
attention must be paid to how enhance the meaning and skills of public servants.
• Problems exist with how training is provided. A more sophisticated human
resource planning capacity is required that addresses issues such as assessments
and evaluations, career-pathing, performance management and retention and
conditions of service.
2006 • Recruitment and selection, performance management, human resource planning,
HIV/AIDS and employment equity still need more attention.
• The capacity to manage performance management remains a problem.
• There continues to be a premature referral of grievances to the PSC.
• The role of labour relations officers remains unclear, and management needs to
exercise its responsibility in dealing with disciplinary matters rather than abdicating
it to labour relations officers.
• The Employee Assistance Programmes (EAP) are still weakly integrated into
programmes such as HIV and AIDS.
2007 • The Public Service needs to improve its capacity for better administrative
compliance and management held accountable.
• The average turn-over rate of the Public Service between 2001 and 2002 was 8, 5%.
• The management of poor performance remains a problem and there is a lack of
capacity to hold managers accountable.
• A richer appreciation from human resource components is needed of the strategic
importance of their functions to the overall functioning of departments.
• An urgent priority is to accelerate the development and retention of priority skills in
the Public Service.
Year Key observations and suggestions
10 SOPS Principal 8 new 4/8/08 8:27 AM Page 5
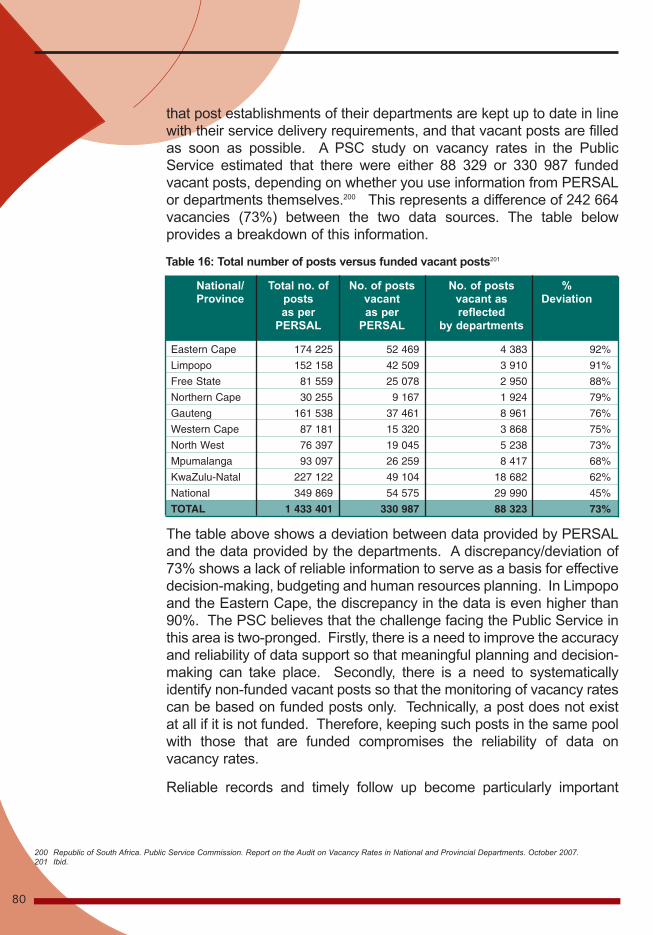
that post establishments of their departments are kept up to date in linewith their service delivery requirements, and that vacant posts are filledas soon as possible. A PSC study on vacancy rates in the PublicService estimated that there were either 88 329 or 330 987 fundedvacant posts, depending on whether you use information from PERSALor departments themselves.200 This represents a difference of 242 664vacancies (73%) between the two data sources. The table belowprovides a breakdown of this information.
The table above shows a deviation between data provided by PERSALand the data provided by the departments. A discrepancy/deviation of73% shows a lack of reliable information to serve as a basis for effectivedecision-making, budgeting and human resources planning. In Limpopoand the Eastern Cape, the discrepancy in the data is even higher than90%. The PSC believes that the challenge facing the Public Service inthis area is two-pronged. Firstly, there is a need to improve the accuracyand reliability of data support so that meaningful planning and decision-making can take place. Secondly, there is a need to systematicallyidentify non-funded vacant posts so that the monitoring of vacancy ratescan be based on funded posts only. Technically, a post does not existat all if it is not funded. Therefore, keeping such posts in the same poolwith those that are funded compromises the reliability of data onvacancy rates.
Reliable records and timely follow up become particularly important
80
PUBLIC SERVICE COMMISSION
200 Republic of South Africa. Public Service Commission. Report on the Audit on Vacancy Rates in National and Provincial Departments. October 2007.201 Ibid.
Table 16: Total number of posts versus funded vacant posts201
Eastern Cape 174 225 52 469 4 383 92%
Limpopo 152 158 42 509 3 910 91%
Free State 81 559 25 078 2 950 88%
Northern Cape 30 255 9 167 1 924 79%
Gauteng 161 538 37 461 8 961 76%
Western Cape 87 181 15 320 3 868 75%
North West 76 397 19 045 5 238 73%
Mpumalanga 93 097 26 259 8 417 68%
KwaZulu-Natal 227 122 49 104 18 682 62%
National 349 869 54 575 29 990 45%
TOTAL 1 433 401 330 987 88 323 73%
National/ Total no. of No. of posts No. of posts % Province posts vacant vacant as Deviation
as per as per reflectedPERSAL PERSAL by departments
10 SOPS Principal 8 new 4/8/08 8:27 AM Page 6
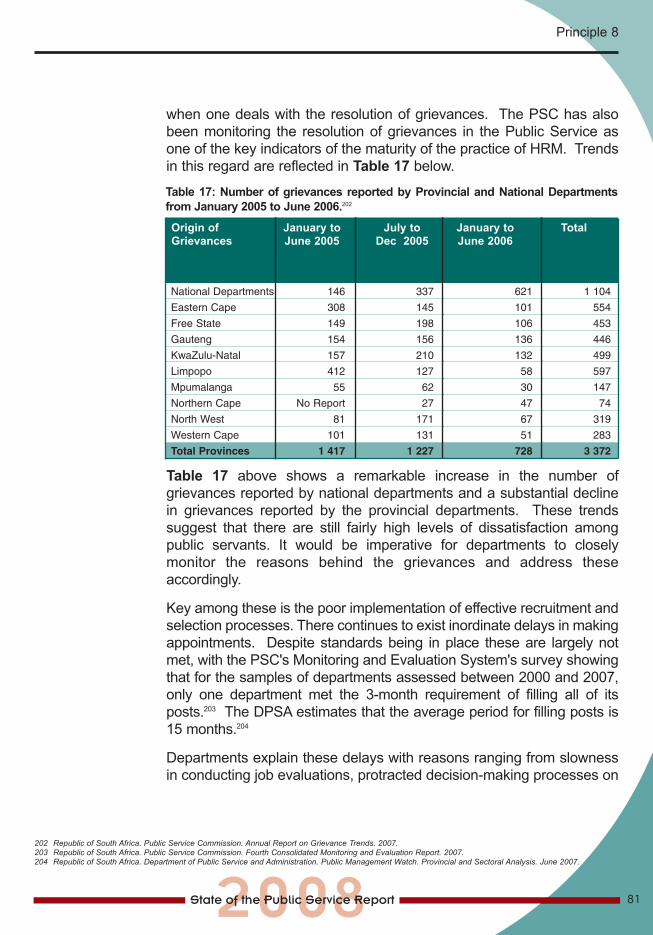
Table 17: Number of grievances reported by Provincial and National Departmentsfrom January 2005 to June 2006.202
National Departments 146 337 621 1 104
Eastern Cape 308 145 101 554
Free State 149 198 106 453
Gauteng 154 156 136 446
KwaZulu-Natal 157 210 132 499
Limpopo 412 127 58 597
Mpumalanga 55 62 30 147
Northern Cape No Report 27 47 74
North West 81 171 67 319
Western Cape 101 131 51 283
Total Provinces 1 417 1 227 728 3 372
Origin of January to July to January to TotalGrievances June 2005 Dec 2005 June 2006
202 Republic of South Africa. Public Service Commission. Annual Report on Grievance Trends. 2007.203 Republic of South Africa. Public Service Commission. Fourth Consolidated Monitoring and Evaluation Report. 2007.204 Republic of South Africa. Department of Public Service and Administration. Public Management Watch. Provincial and Sectoral Analysis. June 2007.
when one deals with the resolution of grievances. The PSC has alsobeen monitoring the resolution of grievances in the Public Service asone of the key indicators of the maturity of the practice of HRM. Trendsin this regard are reflected in Table 17 below.
Table 17 above shows a remarkable increase in the number ofgrievances reported by national departments and a substantial declinein grievances reported by the provincial departments. These trendssuggest that there are still fairly high levels of dissatisfaction amongpublic servants. It would be imperative for departments to closelymonitor the reasons behind the grievances and address theseaccordingly.
Key among these is the poor implementation of effective recruitment andselection processes. There continues to exist inordinate delays in makingappointments. Despite standards being in place these are largely notmet, with the PSC's Monitoring and Evaluation System's survey showingthat for the samples of departments assessed between 2000 and 2007,only one department met the 3-month requirement of filling all of itsposts.203 The DPSA estimates that the average period for filling posts is15 months.204
Departments explain these delays with reasons ranging from slownessin conducting job evaluations, protracted decision-making processes on
Principle 8
81
10 SOPS Principal 8 new 4/8/08 8:27 AM Page 7
PUBLIC SERVICE COMMISSION
82
whether to fill a post or not, and inability of the responsible staffcomponent to handle the workload.205 PSC studies further show thatprogress in the timely filling of posts is also hindered, among others, bylack of effective recruitment policies and delegation of authority, andinadequate reporting to management to facilitate decision-making.206
With such weaknesses in recruitment and selection processes, it is verycrucial to prioritise skills development across the Public Service tocreate a solid base on which the management and operations ofdepartments can rest. Effective training and development requiressystematic planning which takes into consideration the needs of theparticular department, the current skills profile and the resources thatare available. In the PSC's experience, departments have yet tooptimise the use of skills development plans as a strategic managementtool to guide skills development. In an attempt to see how the SMS isprogressing, the PSC conducted research on the training provided forsenior managers. It found that the current process whereby managerswere expected to reflect and identify their own training needs was inpractice not successful, and almost a third of managers did not identifyprofessional or technical knowledge or skills. Furthermore, 20% ofmanagers had not identified any core management criteria to be trainedin. Managers also claimed that their training improved their ownperformance, but actual results of their performance showed that it wasnot as significant as they rated it to be. It would thus appear that thepractice of leaving these training decisions to the manager andsupervisor concerned is ineffectual, and more objective criteria arerequired.207
A further recurring challenge for the Public Service is the scourge of HIVand AIDS. The Public Service needs to be justly concerned about theimpact of this pandemic as it is the largest employer in the country.208 In2004 HIV prevalence rate amongst educators in public schools was12.7%,209 or around 50 000 educators. This is likely to have a profoundimplication for the Public Service as educators decline in supply.210
Indeed, this challenge applies to other sectors as well and requires adeepening of the implementation of HIV/AIDS policies and programmes.
205 Republic of South Africa. Public Service Commission. Third Consolidated Public Service Monitoring and Evaluation Report. Research Cycle 2005/2006. March 2007.
206 Republic of South Africa. Public Service Commission. Report on the Audit on Vacancy Rates in National and Provincial Departments. October 2007. 207 Republic of South Africa. Public Service Commission. Report on the Evaluation of the Training needs of Senior Managers in the Public Service. January 2008.208 Buthelezi G. Fighting AIDS in the Workplace, pp. 36-37 Launch Edition 2001. Service Delivery Review. Department of Public Service and Administration. 209 Rehle, T and Shisana, O. The impact of antiretroviral treatment on AIDS mortality. Education Labour Relations Council. 2005.210 Siyayinqoba Beat it. Episode 25 - Teachers and HIV. www.beatit.co.za/episode25.php.
10 SOPS Principal 8 new 4/8/08 8:27 AM Page 8
83
Principle 8
Acceleratingdeliverytowards 2009and beyond
In the build-up to 2009, it is crucial for the Public Service to target twoimportant levers for strengthening human resource management.Firstly, greater attention will need to be paid to HRM units withindepartments to accelerate their effectiveness. As the corporatebackbone of the development, interpretation and application of HRMPolicies, these units have to rise to the occasion and championmeaningful implementation of policies in their respective departments.The many implementation weaknesses that continue to exist after 14years of transformation suggest that these units are themselves notadequately capacitated.
The second lever to be targeted is to instil upon line managers thecommitment to play their role in HRM. This task includes the full rangeof HR functions that is generally considered to be outside their domain.A sustainable movement for change towards effective HRM requires thatthese two levers be properly positioned to play their respective andcollective roles in departments.
It is also very important for the ADP to receive support from HoDs, andfor the DPSA and South African Development and Management Institute(SAMDI) to monitor and evaluate the implementation thereof so thatappropriate decisions can be taken where necessary to enhance theProgramme.
10 SOPS Principal 8 new 4/8/08 8:27 AM Page 9
84
Principle 9
Public Administration must beBroadly Representative of theSouth African People, withEmployment and PersonnelManagement Practices Based onAbility, Objectivity, Fairness andthe Need to Redress theImbalances of the Past toAchieve Broad Representation
10 SOPS Principal 8 new 4/8/08 8:27 AM Page 10
85
Principle 9
Introduction
Mid-TermReview
The Constitution requires the Public Service to ensure that in itscomposition, it mirrors the South African population in all its diversity.The objective in this regard is not just been to meet numerical targets,which are important in that they show visible change, but also to builda dynamic work environment which draws on the different types ofgroups which the population comprises.
In giving effect to this Constitutional requirement, the Public Service isalso expected to ensure that there is people empowerment so thatrepresentivity and diversity do not become ends in themselves. Theserequirements are challenging, and the Public Service has over theyears put in place different measures to address them. These includeregulatory frameworks such as the White Paper on Affirmative Actionin the Public Service, the setting of generic numeric targets to beachieved, and the provision of training.
The effectiveness of the above measures needs to be consideredcarefully so that implementation can be strengthened. Thisconsideration is particularly crucial at this juncture given thatquestions are now being asked about whether government'saffirmative action (AA) policy is still necessary.211 There are alsodebates around whether AA is in fact not perpetuating classdivisions.212 In a way, these are old questions that were particularlyprevalent soon after democratisation in 1994, but they have beenresuscitated after a few years of relative quiescence. Emotive as itmay be, this debate challenges organisations to adopt a diversitymanagement perspective that transcends a narrow focus onnumeric targets, and the Public Service will similarly have to buildthis perspective. In the remaining term of government seriousconsideration must have to be given to these issues in terms of therole played by government in nation building.
The most visible success of our democracy has been the extent towhich the Public Service currently reflects the demographiccomposition of the country. The racial composition of the PublicService now largely mirrors the country's demography, evident in thetable on the next page.
211 Jongens, C.Perceptions of employment equity implementation at a major South African multi-national financial corporations. Postamble 2(1) 2006. p.42.212 Ndleyyana, M. Human Sciences Research Council Review. Volume 5 No. 4, November 2007.
11 SOPS Principal 9 new 4/8/08 8:26 AM Page 1
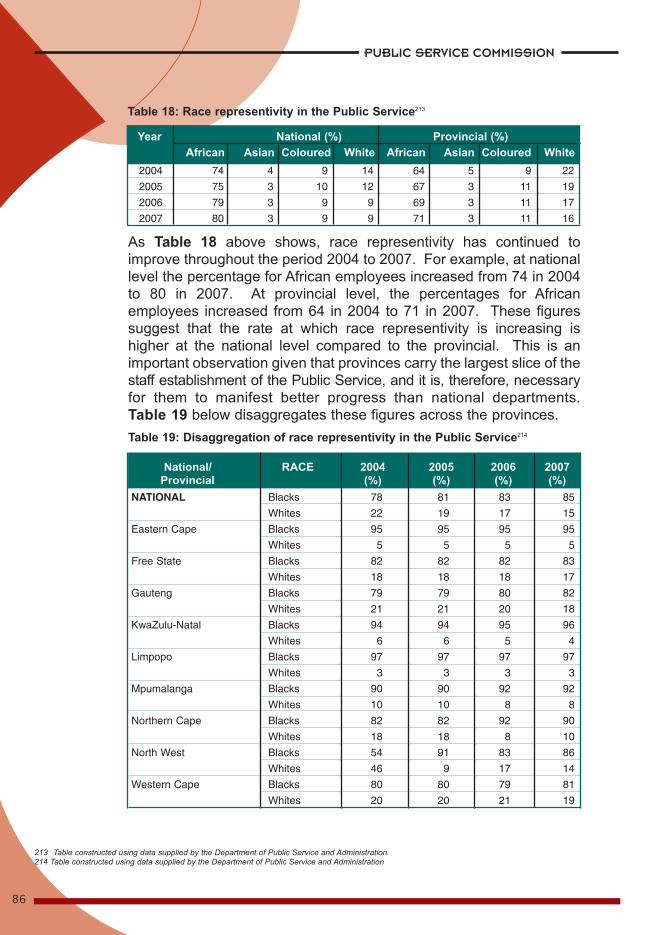
As Table 18 above shows, race representivity has continued toimprove throughout the period 2004 to 2007. For example, at nationallevel the percentage for African employees increased from 74 in 2004to 80 in 2007. At provincial level, the percentages for Africanemployees increased from 64 in 2004 to 71 in 2007. These figuressuggest that the rate at which race representivity is increasing ishigher at the national level compared to the provincial. This is animportant observation given that provinces carry the largest slice of thestaff establishment of the Public Service, and it is, therefore, necessaryfor them to manifest better progress than national departments.Table 19 below disaggregates these figures across the provinces.
213 Table constructed using data supplied by the Department of Public Service and Administration.214 Table constructed using data supplied by the Department of Public Service and Administration
PUBLIC SERVICE COMMISSION
86
NATIONAL Blacks 78 81 83 85
Whites 22 19 17 15
Eastern Cape Blacks 95 95 95 95
Whites 5 5 5 5
Free State Blacks 82 82 82 83
Whites 18 18 18 17
Gauteng Blacks 79 79 80 82
Whites 21 21 20 18
KwaZulu-Natal Blacks 94 94 95 96
Whites 6 6 5 4
Limpopo Blacks 97 97 97 97
Whites 3 3 3 3
Mpumalanga Blacks 90 90 92 92
Whites 10 10 8 8
Northern Cape Blacks 82 82 92 90
Whites 18 18 8 10
North West Blacks 54 91 83 86
Whites 46 9 17 14
Western Cape Blacks 80 80 79 81
Whites 20 20 21 19
National/ RACE 2004 2005 2006 2007Provincial (%) (%) (%) (%)
Table 19: Disaggregation of race representivity in the Public Service214
2004 74 4 9 14 64 5 9 22
2005 75 3 10 12 67 3 11 19
2006 79 3 9 9 69 3 11 17
2007 80 3 9 9 71 3 11 16
Year National (%) Provincial (%)African Asian Coloured White African Asian Coloured White
Table 18: Race representivity in the Public Service213
11 SOPS Principal 9 new 4/8/08 8:26 AM Page 2
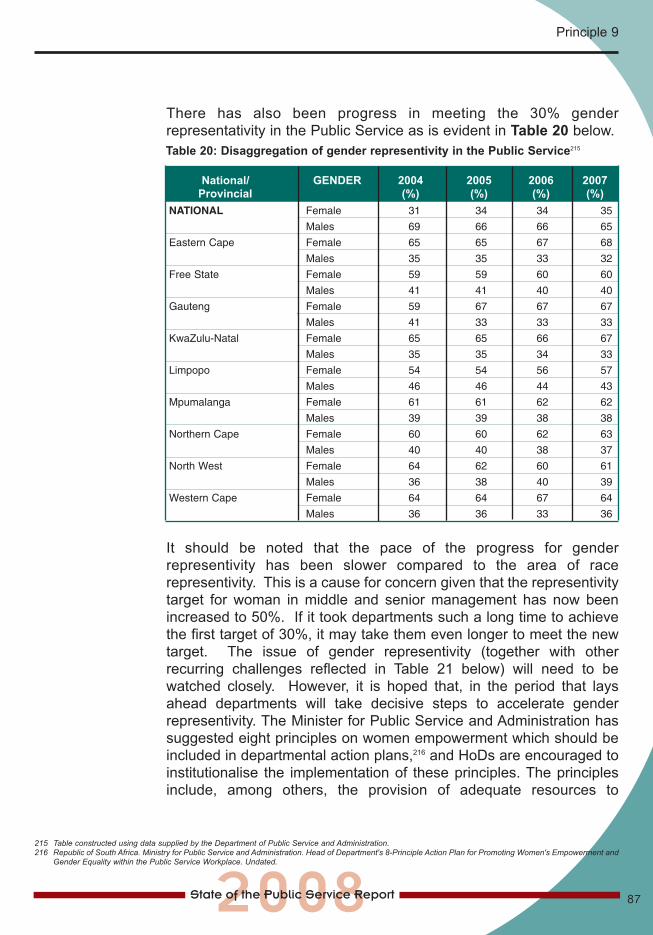
87
Principle 9
215 Table constructed using data supplied by the Department of Public Service and Administration.216 Republic of South Africa. Ministry for Public Service and Administration. Head of Department's 8-Principle Action Plan for Promoting Women's Empowerment and
Gender Equality within the Public Service Workplace. Undated.
There has also been progress in meeting the 30% genderrepresentativity in the Public Service as is evident in Table 20 below.
It should be noted that the pace of the progress for genderrepresentivity has been slower compared to the area of racerepresentivity. This is a cause for concern given that the representivitytarget for woman in middle and senior management has now beenincreased to 50%. If it took departments such a long time to achievethe first target of 30%, it may take them even longer to meet the newtarget. The issue of gender representivity (together with otherrecurring challenges reflected in Table 21 below) will need to bewatched closely. However, it is hoped that, in the period that laysahead departments will take decisive steps to accelerate genderrepresentivity. The Minister for Public Service and Administration hassuggested eight principles on women empowerment which should beincluded in departmental action plans,216 and HoDs are encouraged toinstitutionalise the implementation of these principles. The principlesinclude, among others, the provision of adequate resources to
NATIONAL Female 31 34 34 35
Males 69 66 66 65
Eastern Cape Female 65 65 67 68
Males 35 35 33 32
Free State Female 59 59 60 60
Males 41 41 40 40
Gauteng Female 59 67 67 67
Males 41 33 33 33
KwaZulu-Natal Female 65 65 66 67
Males 35 35 34 33
Limpopo Female 54 54 56 57
Males 46 46 44 43
Mpumalanga Female 61 61 62 62
Males 39 39 38 38
Northern Cape Female 60 60 62 63
Males 40 40 38 37
North West Female 64 62 60 61
Males 36 38 40 39
Western Cape Female 64 64 67 64
Males 36 36 33 36
National/ GENDER 2004 2005 2006 2007Provincial (%) (%) (%) (%)
Table 20: Disaggregation of gender representivity in the Public Service215
11 SOPS Principal 9 new 4/8/08 8:26 AM Page 3
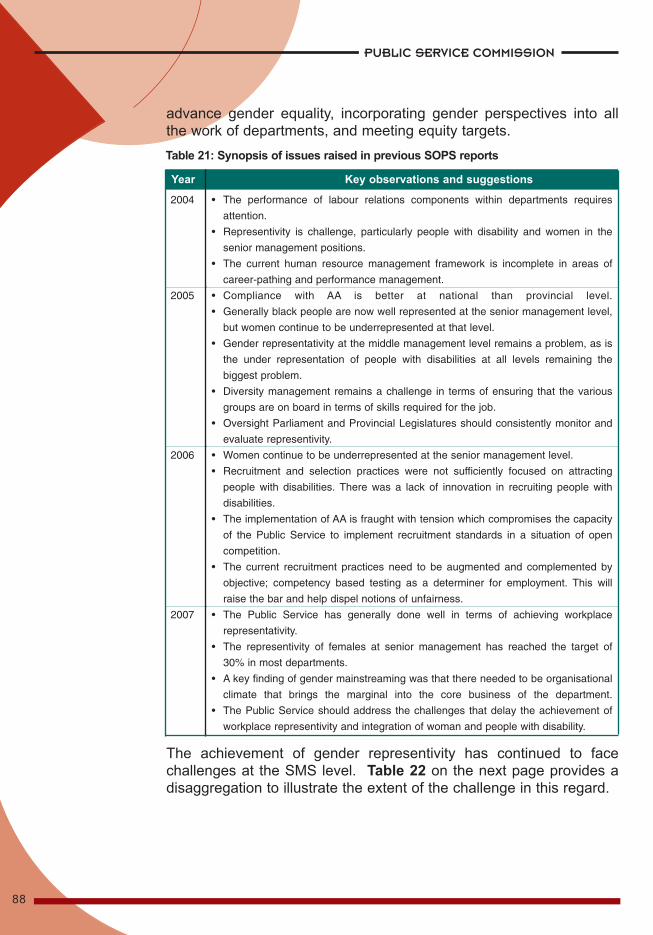
PUBLIC SERVICE COMMISSION
88
advance gender equality, incorporating gender perspectives into allthe work of departments, and meeting equity targets.
The achievement of gender representivity has continued to facechallenges at the SMS level. Table 22 on the next page provides adisaggregation to illustrate the extent of the challenge in this regard.
Table 21: Synopsis of issues raised in previous SOPS reports
2004 • The performance of labour relations components within departments requires
attention.
• Representivity is challenge, particularly people with disability and women in the
senior management positions.
• The current human resource management framework is incomplete in areas of
career-pathing and performance management.
2005 • Compliance with AA is better at national than provincial level.
• Generally black people are now well represented at the senior management level,
but women continue to be underrepresented at that level.
• Gender representativity at the middle management level remains a problem, as is
the under representation of people with disabilities at all levels remaining the
biggest problem.
• Diversity management remains a challenge in terms of ensuring that the various
groups are on board in terms of skills required for the job.
• Oversight Parliament and Provincial Legislatures should consistently monitor and
evaluate representivity.
2006 • Women continue to be underrepresented at the senior management level.
• Recruitment and selection practices were not sufficiently focused on attracting
people with disabilities. There was a lack of innovation in recruiting people with
disabilities.
• The implementation of AA is fraught with tension which compromises the capacity
of the Public Service to implement recruitment standards in a situation of open
competition.
• The current recruitment practices need to be augmented and complemented by
objective; competency based testing as a determiner for employment. This will
raise the bar and help dispel notions of unfairness.
2007 • The Public Service has generally done well in terms of achieving workplace
representativity.
• The representivity of females at senior management has reached the target of
30% in most departments.
• A key finding of gender mainstreaming was that there needed to be organisational
climate that brings the marginal into the core business of the department.
• The Public Service should address the challenges that delay the achievement of
workplace representivity and integration of woman and people with disability.
Year Key observations and suggestions
11 SOPS Principal 9 new 4/8/08 8:26 AM Page 4
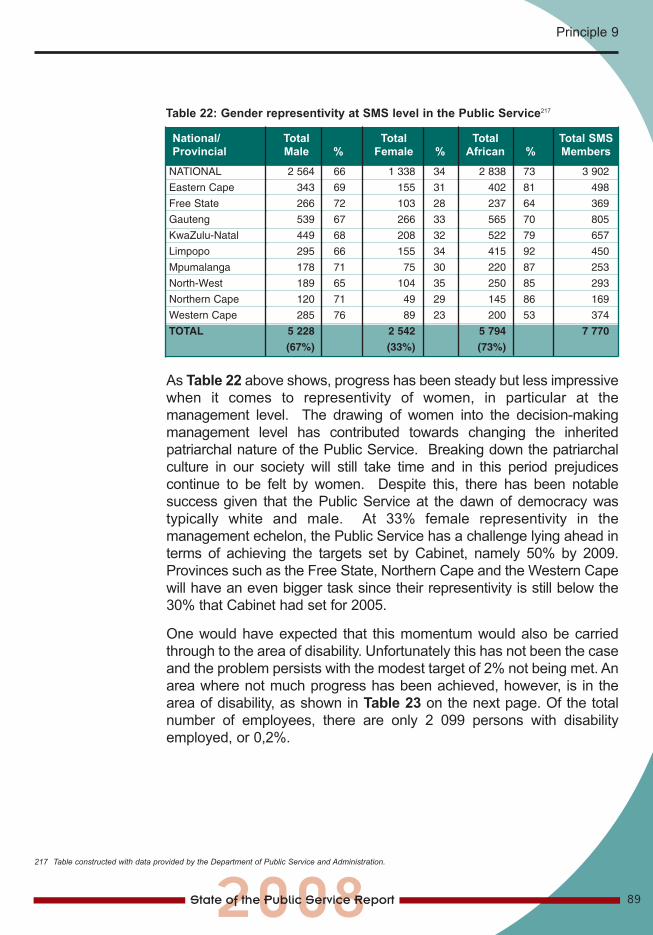
89
Principle 9
217 Table constructed with data provided by the Department of Public Service and Administration.
As Table 22 above shows, progress has been steady but less impressivewhen it comes to representivity of women, in particular at themanagement level. The drawing of women into the decision-makingmanagement level has contributed towards changing the inheritedpatriarchal nature of the Public Service. Breaking down the patriarchalculture in our society will still take time and in this period prejudicescontinue to be felt by women. Despite this, there has been notablesuccess given that the Public Service at the dawn of democracy wastypically white and male. At 33% female representivity in themanagement echelon, the Public Service has a challenge lying ahead interms of achieving the targets set by Cabinet, namely 50% by 2009.Provinces such as the Free State, Northern Cape and the Western Capewill have an even bigger task since their representivity is still below the30% that Cabinet had set for 2005.
One would have expected that this momentum would also be carriedthrough to the area of disability. Unfortunately this has not been the caseand the problem persists with the modest target of 2% not being met. Anarea where not much progress has been achieved, however, is in thearea of disability, as shown in Table 23 on the next page. Of the totalnumber of employees, there are only 2 099 persons with disabilityemployed, or 0,2%.
NATIONAL 2 564 66 1 338 34 2 838 73 3 902
Eastern Cape 343 69 155 31 402 81 498
Free State 266 72 103 28 237 64 369
Gauteng 539 67 266 33 565 70 805
KwaZulu-Natal 449 68 208 32 522 79 657
Limpopo 295 66 155 34 415 92 450
Mpumalanga 178 71 75 30 220 87 253
North-West 189 65 104 35 250 85 293
Northern Cape 120 71 49 29 145 86 169
Western Cape 285 76 89 23 200 53 374
TOTAL 5 228 2 542 5 794 7 770
(67%) (33%) (73%)
National/ Total Total Total Total SMS Provincial Male % Female % African % Members
Table 22: Gender representivity at SMS level in the Public Service217
11 SOPS Principal 9 new 4/8/08 8:26 AM Page 5
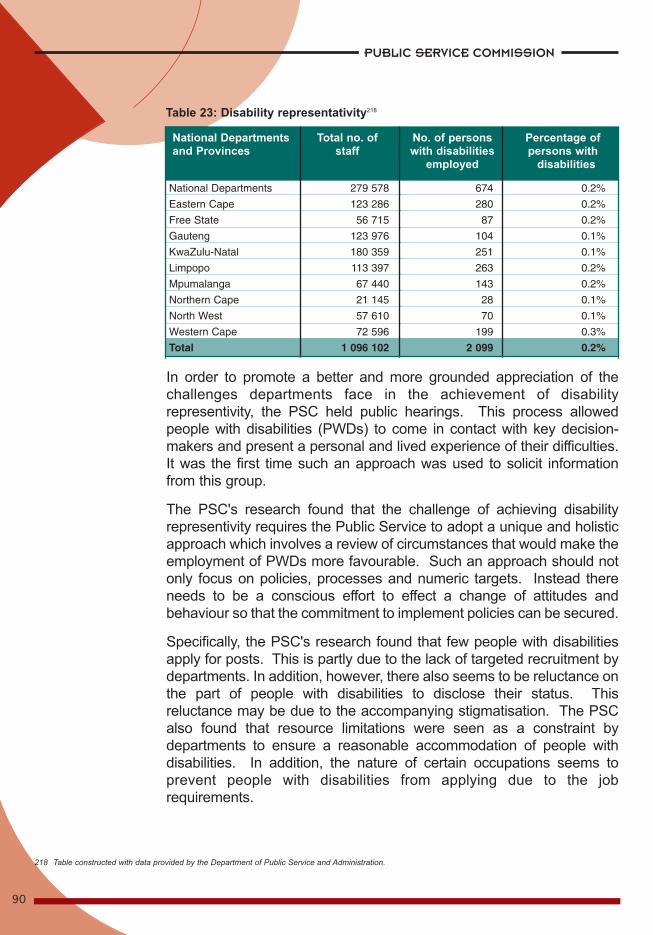
In order to promote a better and more grounded appreciation of thechallenges departments face in the achievement of disabilityrepresentivity, the PSC held public hearings. This process allowedpeople with disabilities (PWDs) to come in contact with key decision-makers and present a personal and lived experience of their difficulties.It was the first time such an approach was used to solicit informationfrom this group.
The PSC's research found that the challenge of achieving disabilityrepresentivity requires the Public Service to adopt a unique and holisticapproach which involves a review of circumstances that would make theemployment of PWDs more favourable. Such an approach should notonly focus on policies, processes and numeric targets. Instead thereneeds to be a conscious effort to effect a change of attitudes andbehaviour so that the commitment to implement policies can be secured.
Specifically, the PSC's research found that few people with disabilitiesapply for posts. This is partly due to the lack of targeted recruitment bydepartments. In addition, however, there also seems to be reluctance onthe part of people with disabilities to disclose their status. Thisreluctance may be due to the accompanying stigmatisation. The PSCalso found that resource limitations were seen as a constraint bydepartments to ensure a reasonable accommodation of people withdisabilities. In addition, the nature of certain occupations seems toprevent people with disabilities from applying due to the jobrequirements.
PUBLIC SERVICE COMMISSION
90
National Departments 279 578 674 0.2%
Eastern Cape 123 286 280 0.2%
Free State 56 715 87 0.2%
Gauteng 123 976 104 0.1%
KwaZulu-Natal 180 359 251 0.1%
Limpopo 113 397 263 0.2%
Mpumalanga 67 440 143 0.2%
Northern Cape 21 145 28 0.1%
North West 57 610 70 0.1%
Western Cape 72 596 199 0.3%
Total 1 096 102 2 099 0.2%
National Departments Total no. of No. of persons Percentage ofand Provinces staff with disabilities persons with
employed disabilities
Table 23: Disability representativity218
218 Table constructed with data provided by the Department of Public Service and Administration.
11 SOPS Principal 9 new 4/8/08 8:26 AM Page 6
91
Principle 9
AcceleratingdeliveryTowards 2009and Beyond
The problem is compounded by the lack of good partnerships withorganisations for people with disabilities, and the fact that there is nocentral database for people with disabilities from which to sourcepotential applicants. Ultimately, though, senior managers need todemonstrate the commitment to promote disability equity and ensurethat there are specific retention strategies targeted at people withdisabilities.
There is reason to celebrate the progress made regarding racerepresentivity in the Public Service. However, there is equally reason tobe worried about the progress being made with gender mainstreamingand disability representivity. Over the remaining period of government'sthird term of office, it is going to be absolutely crucial to take decisivesteps on these matters. Already, there are many studies that have beenconducted and concrete recommendations that have been made in thisregard, and what is required now is the resolve to accelerateimplementation.
In order to improve the recruitment of people with disabilities, awarenesscreation, targeted advertising, accelerating skills amongst people withdisabilities and improving resource allocations through the MTEF isrequired. There is also a need to develop a central database for peoplewith disabilities and for senior managers to promote disability equity.The development of retention strategies as well as strategicpartnerships is also important.
In the area of gender mainstreaming, the Public Service needs to take amuch more strategic approach, which while focusing on theachievement of numeric targets, would also address issues such asfamily friendly policies, improved gender relations in the workplace andinstitutional changes in the areas of new skills and working methods thatsupport the institutionalisation of a gender perspective into mainstreamactivities of the Public Service.
It is important that the representativity continue to be monitored, as it isvery easy for the hard earned gains to be eroded if vigilance is notmaintained. It is also important that diversity management receiveattention, and that the efforts to create dynamic, co-operative andproductive work place cultures are genuine.
11 SOPS Principal 9 new 4/8/08 8:26 AM Page 7
92
Conclusion
11 SOPS Principal 9 new 4/8/08 8:26 AM Page 8
93
Conclusion
This report has captured progress made in the transformation of thePublic Service since the beginning of the second decade of democracy.The Public Service has now had sufficient operational experience inimplementing new policies and the problems that emanated from thisprocess have been raised in previous PSC reports. Progress across thenine (9) Constitutional values and principles has been uneven, butoverall, Public Service transformation continued to gain momentumduring the second decade of democracy.
In the cardinal area of professional ethics, recognised as pivotal to themoral fabric of the Public Service and through it society as a whole,one commends the rapid pace with which South Africa integrated withglobal anti-corruption bodies to the point where it is today a leader inthe field. A strong partnership dimension has resulted in a consensualmodel that has brought together government, business and civilsociety with a common resolved to fight corruption. The focus onpotential conflicts of interest of key decision-makers has deepened thedebate and we witness a shift from narrow compliance issues todiscussions on what does this mean for taking public administrationforward. By subjecting itself to the APRM the country walked the talkaround its statements about good governance. The recurring concernremains the poor follow-up on cases reported to the NACH, and unlessthis is addressed as a matter of urgency, an innovative intervention ofgovernment may fail.
There have been improvements in how resources are managedbrought about due to greater compliance with the PFMA. Thesimplification and standardisation of budgets has been an importantimprovement, as it allows for better benchmarking and monitoring ofexpenditure. There have also been improvements in the quality ofperformance information, which once again translates into betterdecision-making. Notwithstanding this progress, the alignment ofplanning, expenditure and reporting needs to improve. The reliabilityof performance data also needs to improve. With regard to under andover-expenditure, the problem continues and there remain concernsthat funds are not always spent in an efficient and effective way. Manypublic servants lack discipline when it comes to managing personalfinance and are in debt. This inaptitude raises questions about theircompetence when it comes to managing departmental budgets.
Much to beProud of
12 SOPS Conclusion new 4/8/08 8:25 AM Page 1
94
Perhaps the area where the Public Service has contributed the mostto tangibly improving the quality of lives of its citizens is through itsdevelopment orientation. This has taken the form of measures toreduce inequality so as to meet the MDG. Improvement in educationalaccess, better infrastructural services and the provision of mealsthrough the school nutritional programme have helped to reducepoverty. More importantly, the social assistance programme has beenexpanded, with 25% of the population in receipt of some form of grant.These programmes have been shown to make a difference. It isimportant that these gains are not offset by persistent income inequality.
The country has made great strides in providing services that are fair,impartial and equitable. However, these concepts only becomeabsolute once the process of levelling the playing fields has beencompleted, and this means interventions to privilege certain groups inorder to eventually achieve broader societal equality. Efforts attargeted discrimination have been successful in that there are nowlower levels of inter-racial inequality, which is an outcome of greateraccess to education and BBBEE. The PAJA continues to be animportant legal framework to ensure that decisions meet certain qualitystandards that mark them as fair. However, implementation of PAJArequirements is a concern as it continues to not be properlyimplemented. The public needs to be more aware of its rights, andthrough exercising these, a more fair and responsive Public Serviceshould emerge.
It is unfortunate that the Public Service has not managed to performsuccessfully in entrenching public participation measures, resulting inhigh levels of citizen dissatisfaction and unrest. There are clearlydiffering interpretations as to what constitutes adequate consultationand consensus is required around this to prevent the current impasseexperienced. The intervention of the CDWs appears to be successful,with their role evolving from information provision to mediation andempowerment. Citizen satisfaction surveys show that generalsatisfaction levels are negated by poor feedback mechanisms,particularly in the Criminal Justice Sector. The acceleration of theimplementation of participatory mechanism is a pressing requirement.
Perhaps the greatest benefit of accountability is the value this has inensuring that no person or institution is above the law. Our PublicService, often portrayed as a model for good governance, is expected
PUBLIC SERVICE COMMISSION
12 SOPS Conclusion new 4/8/08 8:25 AM Page 2
Conclusion
95
to meet high standards of accountability from citizens and theinternational community. This imperative is particularly pronouncedgiven the apartheid legacy. Several mechanisms have been institutedto drive accountability, especially around contracting for performance,but these continue to pose problems around implementation. A moreproactive role is required on the part of the Executive and seniormanagement to accelerate implementation.
Transparency, as a complementary element to accountability, alsoplays a vital role in promoting good governance, and through it citizensare able to engage on the performance of the state. Reportingmechanisms, such as the annual reports have been configured toserve as a mechanism for transparency, and have evolved fromreporting activities to outputs, which is the real measure of delivery onthe ground. The PoA serves as an important transparency-inducingmechanism, and helps citizens to judge actual performance againstplans. The Public Service is encouraged to make public other types ofreports such as quarterly reports and Annual Citizens Reports requiredby the White Paper on Transforming Public Service Delivery.
It is accepted that the quality of public servants is decisive in ensuringthat government meets its strategic objective. This recognition hasresulted in a shift in South Africa towards a more empoweringapproach to human resource management that emphasises lifelonglearning and which seeks to inculcate professionalism. Measureshave been instituted to produce a pool of skilled middle managers fromdesignated groups to feed into the SMS levels. These measures needto be supported to ensure that representivity and diversity at seniormanagement level are not compromised.
Diversity management is particularly important in South Africa giventhe nature of the political transition the country has gone through. Inthis context, there is a need to achieve workplace representivity whilstat the same time ensuring that other groups are not alienated. Themain success has been the broader achievement of racialrepresentivity. There is progress in the employment of women,particularly at senior management levels, but more effort is required toup the pace of representivity in time to meet the target of 50% set for2009.
12 SOPS Conclusion new 4/8/08 8:25 AM Page 3
LookingAhead
A recurring failure in the area of representivity is with regard torecruiting people with disabilities. Clear strategies are required toachieve the representivity targets. The development of centraliseddata bases for people with disabilities, together with changed attitudesare some of the key considerations that the Public Service shouldattend to in this regard.
Compounding the problem of an effective public service are the highvacancy levels. The Public Service needs to improve the manner inwhich it keeps on vacancies. Conflicting data on the number ofvacancies weakens the reliability of the information base on whichmanagement and the Executive should act. Recruitment and selectionprocesses also need urgent improvement to reduce the time taken tofill posts.
For the remaining period of the electoral term, it is important to ensurea focused attention on matters that will ensure the greatest impact.This a period of coordination, consolidation and acceleration, andframeworks for directing such action already exist through instrumentssuch as the MDG, the APRM Report and the various oversight reportsthat the PSC has generated. It should, therefore, be possible to havebetter targeting of the transformation interventions of the PublicService going forward. Areas for attention include reinforcing thepillars that support growth and development to ensure that the gainsachieved can be sustained. These pillars include mechanisms forefficient and sustainable energy utilisation, water provision andinvestment in infrastructure. There are also clear quick wins such asimproving citizen engagement, greater compliance with ethicsframeworks, and decisive measures to improve accountability througheffective performance management and monitoring. It is through suchtargeting that the Public Service can indeed 'take the tide to the flood'.
As part of fulfilling its Constitutional mandate, the PSC will continue togenerate evidence on the performance of the Public Service to adviseParliament and the Executive on progress and to, among others, drawattention to areas of concern. It is hoped that such reports by the PSCwill be utilised to inform decision-making and by so doing contributetowards better public administration.
96
PUBLIC SERVICE COMMISSION
12 SOPS Conclusion new 4/8/08 8:25 AM Page 4
97
Appendix
List of recent Public ServiceCommission and other usefulReports
13 SOPS Appendix new 4/8/08 8:22 AM Page 1
98
INTRODUCTION1. Republic of South Africa. Constitution of the Republic of South Africa. Act 108 of 1996.2. Republic of South Africa. Public Service Commission. State of the Public Service
Report. 2004.3. Republic of South Africa. Public Service Commission. State of the Public Service
Report. 2005.4. Republic of South Africa. Public Service Commission. State of the Public Service
Report. 2006.5. Republic of South Africa. Public Service Commission. State of the Public Service
Report. 2007.
KEY PUBLIC SERVICE TRANSFORMATION PHASES SINCE 19941. Dickow, H and Moller, V. South Africa's Rainbow People, National Pride and Optimism:
A Trend Study. Social Indicators Research, 59 (2). 2002.2. Mbeki, T. President of the Republic of South Africa. The State of the Nation Address by
the President of the Republic of South Africa. National Assembly. 4 February 2000.3. Mbeki, T. President of the Republic of South Africa. State of the Nation Address at the
Opening of Parliament. Cape Town. 14 February 2003.4. Mbeki, T. President of the Republic of South Africa. State of the Nation Address to the
Houses of Parliament, Cape Town, 8 February 2004.5. Netshitenzhe, J. Government Communication in Public Service Transformation and the
African Renaissance. 11 May 1999.6. Republic of South Africa. Department of Public Service and Administration. Draft Single
Public Service Bill. 2007.7. Republic of South Africa. Department of Public Service and Administration. Electronic
Government - The Digital Future: A Public Service IT Policy Framework. February2001.
8. Republic of South Africa. Department of Public Service and Administration. PublicService Act. 1994.
9. Republic of South Africa. Department of Public Service and Administration. PublicService Act Amendment Bill. 2007.
10. Republic of South Africa. Department of Public Service and Administration. PublicService Regulations. 2001.
11. Republic of South Africa. Department of Public Service and Administration. WhitePaper on Affirmative Action in the Public Service.1998.
12. Republic of South Africa. Department of Public Service and Administration. WhitePaper on the Transformation of the Public Service. November 1995.
Appendix
List of recent Public Service Commission and other useful Reports
13 SOPS Appendix new 4/8/08 8:22 AM Page 2
99
Appendix
13. Republic of South Africa. Department of Public Service and Administration. WhitePaper on Transforming Public Service Delivery. 1997.
14. Republic of South Africa. National Treasury. Public Finance Management Act.1999. Act1 of 1999.
15. Republic of South Africa. National Treasury. Treasury Regulations. 2001.16. Republic of South Africa. Public Service Commission. State of the Public Service
Report. 2004.17. Republic of South Africa. The Presidency. A Planning Framework for Government.
Medium-Term Strategic Framework. Undated.18. Republic of South Africa. The Presidency. Towards a Ten-Year Review. Synthesis
Report on the Implementation of Government Programmes. 2003.19. Republic of South Africa. The Constitution of the Republic of South Africa. Act 108 of
1996.
PRINCIPLE ONE1. Institute for Justice and Reconciliation. Transformation Audit: Leadership and
Legitimacy. 2007.2. Mattes, R. Good News and Bad News: Public Perceptions of Crime, Corruption and
Government. Crime Quarterly (18). 2006.3. Mo Ibrahim Foundation. Ibrahim Index of African Governance. 2007.
(http://www.moibrahimfoundation.org).4. National Anti-Corruption Forum. Guide to the Prevention and Combating of Corrupt
Activities. 2007.5. National Anti-Corruption Forum. Media Release. 30 August 2007.6. Ramsingh, O and Dobie, K. Case Study on the South African National Anti-Corruption
Forum. Undated.7. Republic of South Africa. Auditor General. Report on the Declaration of Interest by
Ministers, Deputy Ministers and Government Employees. 2006.8. Republic of South Africa. Department of Public Service and Administration. Report on
the Review and Impact Assessment of the Extent to which Departments andOrganisational Components have complied with the Minimum Anti-CorruptionRequirements. 2007.
9. Republic of South Africa. Prevention and Combating of Corrupt Activities Act. Act No.12 of 2004.
10. Republic of South Africa. Public Service Commission. Assessment of ProfessionalEthics in the Free State. 2007.
11. Republic of South Africa. Public Service Commission. Assessment of Professional
13 SOPS Appendix new 4/8/08 8:22 AM Page 3
PUBLIC SERVICE COMMISSION
100
Ethics in KwaZulu-Natal. 2007.12. Republic of South Africa. Public Service Commission. Measuring the Effectiveness of
the National Anti-Corruption Hotline. 2007.13. Republic of South Africa. Public Service Commission. Report on Managing Conflicts of
Interest in the Public Service. 2006.14. Republic of South Africa. Public Service Commission. Report on the Investigation into
the Management of Public Servants in terms of Prevailing Provisions who are Electedas Municipal Councillors in the Limpopo and Western Cape Provinces. 2007.
15. Republic of South Africa. Public Service Commission. Report on the Management ofConflicts of Interest through Financial Disclosures. May 2007.
16. The New Partnership for Africa's Development. African Peer Review Mechanism.APRM Country Review Report No. 4. Country Review Report Republic of South Africa.May 2007.
PRINCIPLE TWO:1. Fraser-Moleketi, G. J. Minister for Public Service and Administration. Budget Vote
Speech. 21 June 2004.2. Manuel, T. Minister of Finance. Republic of South Africa. Economic Policy and South
Africa's Growth Strategy. 19 March 2007.3. Mbeki, T. President of the Republic of South Africa. State of the Nation Address. Joint
Sitting of Parliament. 9 February 2007.4. Smith, P.C. and Street, A. Measuring the Efficiency of Public Services: The Limits of
Analysis. Journal of the Royal Statistical Society. 2005.5. Republic of South Africa. Auditor-General. General Report on Audit Outcomes
for 2003 - 04. (RP 211 2004).6. Republic of South Africa. Auditor-General. General Report on Audit Outcomes
for 2004 - 05 (RP 223 2005).7. Republic of South Africa. Auditor-General. General Report of on Audit Outcomes
for 2005 - 06 (RP 247 2006).8. Republic of South Africa. Auditor-General. General Report on Audit Outcomes of
National and Provincial, Public Entities and Constitution Institutions for the FinancialYear 2006 - 2007. December 2007.
9. Republic of South Africa. National Treasury. Framework for Managing ProgrammePerformance Information. 2007.
10. Republic of South Africa. National Treasury. 2006. Provincial Annual Report Review asa Performance Measure for 2005/06.
11. Republic of South Africa. National Treasury. Provincial Budgets and Expenditure
13 SOPS Appendix new 4/8/08 8:22 AM Page 4
101
Appendix
12. Republic of South Africa. National Treasury. Public Finance Management Act. Act 1 of1999.
13. Republic of South Africa. National Treasury. Treasury Regulations. 2001.14. Republic of South Africa. Public Service Commission. Draft Report on the
Indebtedness of Public Servants. 2007.15. Republic of South Africa. Public Service Commission. Report on the Evaluation of the
Batho Pele Principle of Value for Money in the Public Service. 2007.16. Republic of South Africa. Public Service Commission. Report on Financial Misconduct
for the 2005/2006 Financial Year. 2007.17. Republic of South Africa. Public Serice Commission. Report on Financial Misconduct
for the 2006/2007 Financial Year. 2008.18. Republic of South Africa. Public Service Commission. State of the Public Service
Report. 2004.19. Republic of South Africa. Public Service Commission. State of the Public Service
Report. 2005.
PRINCIPLE THREE1. Manuel, T. Minister of Finance. Republic of South Africa. Budget Speech. 21 February
2007.2. Manuel, T. Minister of Finance. Republic of South Africa. Medium Term Budget Policy
Statement. 2007.3. Mbeki, T. President of the Republic of South Africa. State of the Nation Address. Joint
Sitting of Parliament. Cape Town. 8 February 2008.4. Republic of South Africa. Department of Public Works. Expanded Public Works
Programme. Second Quarterly Report-Year 4. Financial Year 2007/08.5. Republic of South Africa. Millennium Development Goals: Mid Term Country Report.
September 2007.6. Republic of South Africa. National Treasury. Budget Review. 2007.7. Republic of South Africa. National Treasury. Estimates of National Expenditure. 2007.8. Republic of South Africa. National Treasury. Provincial Budgets and Expenditure
Review. 2003/04 - 2009/10. 2007.9. Republic of South Africa. Public Service Commission. Fourth Consolidated Public
Service Monitoring and Evaluation Report. October 2007.10. Republic of South Africa. Public Service Commission. Report on the Evaluation of
Government's Poverty Reduction Programme. 2007.11. Republic of South Africa. The Presidency. Development Indicators Mid-Term Review.
Undated.
13 SOPS Appendix new 4/8/08 8:22 AM Page 5
Review: 2003/04-2009/10. 2007.
PUBLIC SERVICE COMMISSION
102
12. Republic of South Africa. The Presidency. The White Paper on Reconstruction andDevelopment. 1994.
13. Studies in Poverty and Inequality Institute. The Measurement of Poverty in South AfricaProject: Key Issues. 2007.
PRINCIPLE FOUR1. Asmal. K. Address to Representatives of 11 Chapter 9 and Associated Institutions.
Parliament. 20 October 2006.2. Hoffman, P. The Strategy and tactics for reforming the Judiciary. The FW De Klerk
Foundation. June 2007.3. Republic of South Africa. The Constitution of the Republic of South Africa, 1996. Act
108 of 1996.4. Republic of South Africa. Department of Justice and Constitutional Development PAJA
e-newsletter. Edition 1/2007. 5. Republic of South Africa. Department of Justice and Constitutional Development PAJA
e-newsletter. Edition 3/2007. 6. Republic of South Africa. Department of Justice and Constitutional Development.
Promotion of Access to Information Act. Act 2 of 2000.7. Republic of South Africa. Department of Justice and Constitutional Development.
Promotion of Administrative Justice Act. Act 3 of 2000.8. Republic of South Africa. Department of Justice and Constitutional Development.
Promotion of Administrative Justice Act Administrator's Guide. July 2006.9. Republic of South Africa. Department of Public Service and Administration. Know your
Rights Booklet. 2007.10. Republic of South Africa. Department of Public Service and Administration. Report on
the Implementation of Batho Pele. 2004.11. Republic of South Africa. Public Service Commission. Fourth Consolidated Public
Service Monitoring and Evaluation Report. Research Cycle 2005/06. October 2007.12. Republic of South Africa. Public Service Commission. Report on the Compliance with
Promotion of Administrative Justice Act, 2000 (Act No. 3 of 2000). December 2006.Pretoria.
13. Republic of South Africa. Public Service Commission. State of the Public ServiceReport. 2006.
14. Republic of South Africa. Public Service Commission. State of the Public ServiceReport, 2007Republic of South Africa.
15. The Presidency. Development Indicators Mid-Term Review. Undated.16. Republic of South Africa. Department of Trade and Industry. South Africa's Economic
Transformation: A strategy for Broad-Based Economic Empowerment. Undated.
13 SOPS Appendix new 4/8/08 8:22 AM Page 6
103
Appendix
17. The Institute for Justice and Reconciliation. Economic and Industrial Policy. EconomicTransformation Audit. 2006.
18. The Institute for Justice and Reconciliation. Employment and Industrial Policy.Economic Transformation Audit. 2006.
PRINCIPLE FIVE1. Botes, L, Lenka, M et al. University of the Free State. The New Struggle: Service
Delivery-Related Unrest in South Africa. Handisa Media. Undated.2. Centre for Policy Studies. A Developmental Democracy? Democracy and Political
Governance Discussion Paper Prepared for Phase One of the South African APRMJanuary 2006.
3. Friedman, S. Participatory governance and citizen action in post-apartheid SouthAfrica. Discussion Paper. International Institute of Labour Studies. 2006.
4. Hangana, N. Deputy Minister for Provincial and Local Government. Republic of SouthAfrica. Address at the Institute for Local Government Management Annual Conference.Cape Town. 2005.
5. Mbeki, T. President of the Republic of South Africa. State of the Nation Address. JointSitting of Parliament. Cape Town. February 2003.
6. Republic of South Africa. Constitutional Court of South Africa. Merafong DemarcationForum and Others v President of the Republic of South Africa and Others CCT41/07.04 September 2007.
7. Republic of South Africa. Department of Public Service and Administration. AnnualReport 2006/2007.
8. Republic of South Africa. Department of Public Service and Administration.Proceedings of the 1st CDW Conference held in Gallagher Estate. 11 - 12 June 2007.
9. Republic of South Africa. Department of Public Service and Administration. WhitePaper on Transforming Public Service Delivery. 1997.
10. Republic of South Africa. Government Communication and Information System. BuaNews. 28 October 2003.
11. Republic of South Africa. Public Service Commission. Citizen Satisfaction Survey.Economic and Infrastructure Service Sector. September 2006.
12. Republic of South Africa. Public Service Commission. Report on the Implementation ofthe Batho Principle of Consultation in the Public Service.
13. Republic of South Africa. Public Service Commission. Report on the Implementation ofthe Batho Principle of Redress in the Public Service. 2007.
14. Republic of South Africa. Reflections and Human Rights: Decade of the South AfricanConstitution (Act 108 of 1996).
15. South African Crime Statistics 2006/7: the Good and the Bad. 16 July 2007.
13 SOPS Appendix new 4/8/08 8:23 AM Page 7
PUBLIC SERVICE COMMISSION
104
www. Institute for Security Studies.16. South African Police Service. Crime Information Analysis Centre. Crime Statistics for
South Africa (1994-2004).
PRINCIPLE SIX1. Mbeki, T. President of the Republic of South Africa. State of the nation Address. Joint
Sitting of Parliament. 8 February 2008.2. Republic of South Africa. Auditor-General. General Report on Audit Outcomes of
National and Provincial, Public Entities and Constitution Institutions for the FinancialYear 2006 - 2007. December 2007.
3. Republic of South Africa. Department of Justice and Constitutional Development.Promotion of Access to Information Act. Act 2 of 2000.
4. Republic of South Africa. Department of Justice and Constitutional Development.Promotion of Administrative Justice Act. Act no 3 of 2000.
5. Republic of South Africa. Department of Public Service and Administration. SeniorManagement Service Handbook, Chapter 4, as amended in 2006.
6. Republic of South Africa. Public Service Commission. An Audit into the Granting ofPerformance Rewards: Departments of Correctional Services, Home Affairs andLabour. 2006.
7. Republic of South Africa. Public Service Commission. Draft Report on the Payment ofPerformance Incentives without Performance Appraisals being Conducted. 2008.
8. Republic of South Africa. Public Service Commission. Fact Sheet on the Filing ofPerformance Agreements for the 2007/8 Financial Year. July 2007.
9. Republic of South Africa. Public Service Commission. Guidelines for the Evaluation ofHeads of Department for the 2006/7 Financial Year. 2007.
10. Republic of South Africa. Public Service Commission. Report on the Audit into theGranting of Performance Rewards in the Departments of Education and SocialDevelopment at both National and Provincial Levels. 2007.
11. Republic of South Africa. Statement on the Cabinet meeting of 22 January 2008. 12. Republic of South Africa. The Presidency. Proposal and Implementation Plan for a
Government-Wide Monitoring and Evaluation System. September 2005.
PRINCIPLE SEVEN1. Pasquier, M and Villeneuve, J. Organisational Barriers to Transparency: A Typology
and Analysis of Organisational Behaviour Tending to Prevent or Restrict Access toInformation. International Review of Administrative Sciences. (73(1). SagePublications. March 2007.
2. Republic of South Africa. Department of Justice and Constitutional Development.
13 SOPS Appendix new 4/8/08 8:23 AM Page 8
105
Appendix
Promotion of Access to Information Act. 2000.3. Republic of South Africa. Department of Public Service and Administration. White
Paper on the Transformation of Public Service Delivery. 1997.4. Republic of South Africa. National Treasury. Treasury Regulations for Departments,
[and] Constitutional Institutions, Public Entities, Parliaments and ProvincialLegislatures. March 2001.
5. Republic of South Africa. Parliament of the Republic of South Africa. Code of Conduct.6. Republic of South Africa. Public Service Commission. Draft Report on the
Implementation of the Batho Pele Principle of Openness and Transparency in thePublic Service. 2008.
7. Republic of South Africa. Public Service Commission. Draft Report on the Managementof Gifts in the Public Service. 2008.
8. Republic of South Africa. Public Service Commission. State of the Public ServiceReport. July 2004.
9. Republic of South Africa. Public Service Commission. State of the Public ServiceReport. 2007.
10. Republic of South Africa. The Presidency. Development Indicators Mid-Term Review.Undated.
PRINCIPLE EIGHT1. Buthelezi G. Fighting AIDS in the Workplace, pp. 36-37 Launch Edition 2001. Service
Delivery Review, Department of Public Service and Administration. 2. Fraser Moleketi, G. J. Republic of South Africa. Building Professionalism and
Competence in the Public Sector. Service Delivery Review (16) 2. 2007.3. Fraser-Moleketi, G. J. Minister for Public Service and Administration. Keynote Address
at the International Resource Management Conference. “Building Public SectorHuman Resource Capacity in a Developmental State.” July 2007.
4. Pretorius, L. P. Presentation to EPCM Steering Committee on Re-positioning HR forStrategic Human Resource Management in the Public Service. 4 October 2007.
5. Rehle, T and Shisana, O. The impact of antiretroviral treatment on AIDS mortality.Education Labour Relations Council. 2005.
6. Republic of South Africa. Department of Public Service and Administration. PublicManagement Watch. Provincial and Sectoral Analysis. June 2007.
7. Republic of South Africa. Department of Public Service and Administration. PublicService Regulations. Chapter 4. Senior Management Service dispensation, 1 January2000.
8. Republic of South Africa. Public Service Commission. Annual Report on Grievance
13 SOPS Appendix new 4/8/08 8:23 AM Page 9
PUBLIC SERVICE COMMISSION
106
Trends. 2007.9. Republic of South Africa. Public Service Commission. Third Consolidated Public
Service Monitoring and Evaluation Report. Research Cycle 2005/2006. March 2007.10. Republic of South Africa. Public Service Commission. Fourth Consolidated Public
Service Monitoring and Evaluation Report, Research Cycle 2005/2006. October 2007.11. Republic of South Africa. Public Service Commission. Report on the Audit on Vacancy
Rates in National and Provincial Departments. October 2007.12. Republic of South Africa. Public Service Commission. Report on the Evaluation of the
Training needs of Senior Managers in the Public Service. January 2008.13. Siyayinqoba Beat it. Episode 25 - Teachers and HIV.
PRINCIPLE NINE1. Jongens, C. Perceptions of employment equity implementation at major South African
multi-national financial corporations. Postamble 2(1) 2006.2. Ndleyyana, M. Human Sciences Research Council Review. Volume 5 No. 4,
November 2007.3. Republic of South Africa. Ministry for Public Service and Administration.Head of
Department's 8-Principle Action Plan for Promoting Women's Empowerment andGender Equality within the Public Service Workplace. Undated.
13 SOPS Appendix new 4/8/08 8:23 AM Page 10

107
NOTES:_______________________________________________ _______________________________________________ _______________________________________________ _____________________________________________
_______________________________________________ _______________________________________________ _______________________________________________ _____________________________________________
_______________________________________________ _______________________________________________ _______________________________________________ _____________________________________________
_______________________________________________ _______________________________________________ _______________________________________________ _____________________________________________
_______________________________________________ _______________________________________________ _______________________________________________ _____________________________________________
_______________________________________________ _______________________________________________ _______________________________________________ _____________________________________________
_______________________________________________ _______________________________________________ _______________________________________________ _____________________________________________
_______________________________________________ _______________________________________________ _______________________________________________ _____________________________________________
_______________________________________________ _______________________________________________ _______________________________________________ _____________________________________________
_______________________________________________ _______________________________________________ _______________________________________________ _____________________________________________
_______________________________________________ _______________________________________________ _______________________________________________ _____________________________________________
_______________________________________________ _______________________________________________ _______________________________________________ _____________________________________________
_______________________________________________ _______________________________________________ _______________________________________________ _____________________________________________
_______________________________________________ _______________________________________________ _______________________________________________ _____________________________________________
_______________________________________________ _______________________________________________ _______________________________________________ _____________________________________________
_______________________________________________ _______________________________________________ _______________________________________________ _____________________________________________
_______________________________________________ _______________________________________________ _______________________________________________ _____________________________________________
_______________________________________________ _______________________________________________ _______________________________________________ _____________________________________________
_______________________________________________ _______________________________________________ _______________________________________________ _____________________________________________
_______________________________________________ _______________________________________________ _______________________________________________ _____________________________________________
_______________________________________________ _______________________________________________ _______________________________________________ _____________________________________________
_______________________________________________ _______________________________________________ _______________________________________________ _____________________________________________
_______________________________________________ _______________________________________________ _______________________________________________ _____________________________________________
_______________________________________________ _______________________________________________ _______________________________________________ _____________________________________________
_______________________________________________ _______________________________________________ _______________________________________________ _____________________________________________
_______________________________________________ _______________________________________________ _______________________________________________ _____________________________________________
_______________________________________________ _______________________________________________ _______________________________________________ _____________________________________________
_______________________________________________ _______________________________________________ _______________________________________________ _____________________________________________
_______________________________________________ _______________________________________________ _______________________________________________ _____________________________________________
_______________________________________________ _______________________________________________ _______________________________________________ _____________________________________________
_______________________________________________ _______________________________________________ _______________________________________________ _____________________________________________
_______________________________________________ _______________________________________________ _______________________________________________ _____________________________________________
14 End Pages new 4/8/08 8:19 AM Page 1

108
NOTES:_______________________________________________ _______________________________________________ _______________________________________________ _____________________________________________
_______________________________________________ _______________________________________________ _______________________________________________ _____________________________________________
_______________________________________________ _______________________________________________ _______________________________________________ _____________________________________________
_______________________________________________ _______________________________________________ _______________________________________________ _____________________________________________
_______________________________________________ _______________________________________________ _______________________________________________ _____________________________________________
_______________________________________________ _______________________________________________ _______________________________________________ _____________________________________________
_______________________________________________ _______________________________________________ _______________________________________________ _____________________________________________
_______________________________________________ _______________________________________________ _______________________________________________ _____________________________________________
_______________________________________________ _______________________________________________ _______________________________________________ _____________________________________________
_______________________________________________ _______________________________________________ _______________________________________________ _____________________________________________
_______________________________________________ _______________________________________________ _______________________________________________ _____________________________________________
_______________________________________________ _______________________________________________ _______________________________________________ _____________________________________________
_______________________________________________ _______________________________________________ _______________________________________________ _____________________________________________
_______________________________________________ _______________________________________________ _______________________________________________ _____________________________________________
_______________________________________________ _______________________________________________ _______________________________________________ _____________________________________________
_______________________________________________ _______________________________________________ _______________________________________________ _____________________________________________
_______________________________________________ _______________________________________________ _______________________________________________ _____________________________________________
_______________________________________________ _______________________________________________ _______________________________________________ _____________________________________________
_______________________________________________ _______________________________________________ _______________________________________________ _____________________________________________
_______________________________________________ _______________________________________________ _______________________________________________ _____________________________________________
_______________________________________________ _______________________________________________ _______________________________________________ _____________________________________________
_______________________________________________ _______________________________________________ _______________________________________________ _____________________________________________
_______________________________________________ _______________________________________________ _______________________________________________ _____________________________________________
_______________________________________________ _______________________________________________ _______________________________________________ _____________________________________________
_______________________________________________ _______________________________________________ _______________________________________________ _____________________________________________
_______________________________________________ _______________________________________________ _______________________________________________ _____________________________________________
_______________________________________________ _______________________________________________ _______________________________________________ _____________________________________________
_______________________________________________ _______________________________________________ _______________________________________________ _____________________________________________
_______________________________________________ _______________________________________________ _______________________________________________ _____________________________________________
_______________________________________________ _______________________________________________ _______________________________________________ _____________________________________________
_______________________________________________ _______________________________________________ _______________________________________________ _____________________________________________
_______________________________________________ _______________________________________________ _______________________________________________ _____________________________________________
14 End Pages new 4/8/08 8:19 AM Page 2

109
NOTES:_______________________________________________ _______________________________________________ _______________________________________________ _____________________________________________
_______________________________________________ _______________________________________________ _______________________________________________ _____________________________________________
_______________________________________________ _______________________________________________ _______________________________________________ _____________________________________________
_______________________________________________ _______________________________________________ _______________________________________________ _____________________________________________
_______________________________________________ _______________________________________________ _______________________________________________ _____________________________________________
_______________________________________________ _______________________________________________ _______________________________________________ _____________________________________________
_______________________________________________ _______________________________________________ _______________________________________________ _____________________________________________
_______________________________________________ _______________________________________________ _______________________________________________ _____________________________________________
_______________________________________________ _______________________________________________ _______________________________________________ _____________________________________________
_______________________________________________ _______________________________________________ _______________________________________________ _____________________________________________
_______________________________________________ _______________________________________________ _______________________________________________ _____________________________________________
_______________________________________________ _______________________________________________ _______________________________________________ _____________________________________________
_______________________________________________ _______________________________________________ _______________________________________________ _____________________________________________
_______________________________________________ _______________________________________________ _______________________________________________ _____________________________________________
_______________________________________________ _______________________________________________ _______________________________________________ _____________________________________________
_______________________________________________ _______________________________________________ _______________________________________________ _____________________________________________
_______________________________________________ _______________________________________________ _______________________________________________ _____________________________________________
_______________________________________________ _______________________________________________ _______________________________________________ _____________________________________________
_______________________________________________ _______________________________________________ _______________________________________________ _____________________________________________
_______________________________________________ _______________________________________________ _______________________________________________ _____________________________________________
_______________________________________________ _______________________________________________ _______________________________________________ _____________________________________________
_______________________________________________ _______________________________________________ _______________________________________________ _____________________________________________
_______________________________________________ _______________________________________________ _______________________________________________ _____________________________________________
_______________________________________________ _______________________________________________ _______________________________________________ _____________________________________________
_______________________________________________ _______________________________________________ _______________________________________________ _____________________________________________
_______________________________________________ _______________________________________________ _______________________________________________ _____________________________________________
_______________________________________________ _______________________________________________ _______________________________________________ _____________________________________________
_______________________________________________ _______________________________________________ _______________________________________________ _____________________________________________
_______________________________________________ _______________________________________________ _______________________________________________ _____________________________________________
_______________________________________________ _______________________________________________ _______________________________________________ _____________________________________________
_______________________________________________ _______________________________________________ _______________________________________________ _____________________________________________
_______________________________________________ _______________________________________________ _______________________________________________ _____________________________________________
14 End Pages new 4/8/08 8:19 AM Page 3
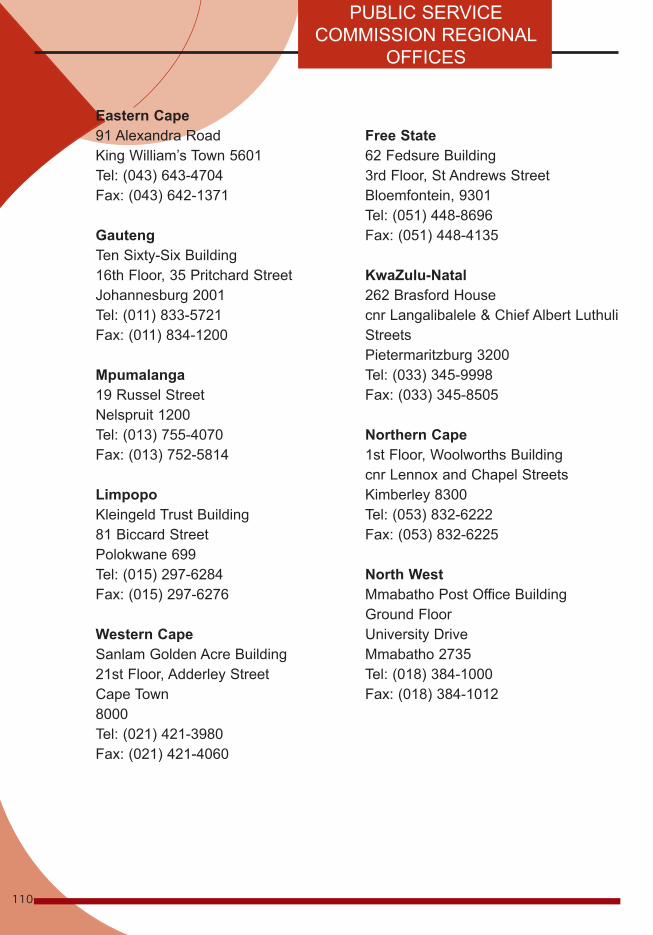
110
Eastern Cape91 Alexandra RoadKing William’s Town 5601Tel: (043) 643-4704Fax: (043) 642-1371
GautengTen Sixty-Six Building16th Floor, 35 Pritchard StreetJohannesburg 2001Tel: (011) 833-5721Fax: (011) 834-1200
Mpumalanga19 Russel StreetNelspruit 1200Tel: (013) 755-4070Fax: (013) 752-5814
LimpopoKleingeld Trust Building81 Biccard StreetPolokwane 699Tel: (015) 297-6284Fax: (015) 297-6276
Western CapeSanlam Golden Acre Building21st Floor, Adderley StreetCape Town8000Tel: (021) 421-3980Fax: (021) 421-4060
Free State62 Fedsure Building3rd Floor, St Andrews StreetBloemfontein, 9301Tel: (051) 448-8696Fax: (051) 448-4135
KwaZulu-Natal262 Brasford Housecnr Langalibalele & Chief Albert LuthuliStreetsPietermaritzburg 3200Tel: (033) 345-9998Fax: (033) 345-8505
Northern Cape1st Floor, Woolworths Buildingcnr Lennox and Chapel StreetsKimberley 8300Tel: (053) 832-6222Fax: (053) 832-6225
North WestMmabatho Post Office BuildingGround FloorUniversity DriveMmabatho 2735Tel: (018) 384-1000Fax: (018) 384-1012
PUBLIC SERVICECOMMISSION REGIONAL
OFFICES
14 End Pages new 4/8/08 8:19 AM Page 4