Embed Size (px)
Citation preview
The residence time distribution of the gas phase in circulating fluidized beds (CFB) Proceedings of European Congress of Chemical Engineering (ECCE-6) Copenhagen, 16-20 September 2007
The residence time distribution of the gas phase in circulating fluidized beds (CFB)
M. Van de Velden a†, J. Baeyens a, J. Degrève b and J.P.K. Seville a
a University of Birmingham, Department of Chemical Engineering, B15 2TT Birmingham, United Kingdom, Tel: +44 (0) 121 414 5354 Fax: +44 (0) 121 414 5377, email: [email protected] [† 21/03/2007] b Catholic University of Leuven, Department of Chemical Engineering, de Croylaan 46, B-3001 Leuven, Belgium
Abstract
CFB reactors are increasingly used for both gas catalytic and gas/solid reactions. Gas flow patterns in the riser are important in their design and subject of the present research. A literature review on the gas mixing in the riser highlights the contradictory results of previous investigations for CFB risers: some investigators neglected back-mixing of gas, whereas others report a considerable amount of back-mixing. The present paper reports experimental findings obtained in a 0.1 m I.D. riser, for a wide range of combined superficial gas velocities and solid circulation fluxes. The gas flow mode (plug vs. mixed) is strongly affected by the operating conditions, however with a dominant mode within a specific (U,G)-range. Sand was used as bed material. The operating conditions varied from 5.5 to 8.3 m/s as superficial gas velocity, and 40 to 170 kg/m² s as solid circulation flux. In order to determine the residence time in the riser, a pulse of propane was injected at the bottom of the riser and detected at its exit. The cumulative response curves [F(t)] define:
- an average residence time (t50) obtained for F(t) = 0.5 - the different slope of the curves, with a steeper one corresponding with a more
pronounced plug flow, and expressed in terms of a deviation, σ.
These parameters (t50 and σ) are used to define the gas flow mode. A quantitative comparison of experimental results with known RTD-models is inconclusive although the occurrence of both mixed flow and plug flow is evident, and (U,G)-dependent. The experimental results can be expressed in design equations:

M. Van de Velden et al.
t50 = 0.57 (U-Utr)-0.25 G-0.2 with t50 in s/m riser height
σ = 0.87 (U-Utr)1.15 G-0.54
The comparison of predicted and experimental results is fair. The results give clear indications concerning the gas mixing mode: - significant deviations of tpf,gas, the residence time of the gas in the empty riser, and t50 already stress deviation from plug flow; - high values of σ (e.g. ≥ 0.1) indicate a significant gas back mixing. Small values of σ are obtained at moderate values of U-Utr and high values of G. Operations at higher excess gas velocities correspond with higher σ-values (σ ≥ 0.25), thus proving the increasing deviation of gas plug flow and growing importance of gas back mixing. This strong (U,G)-dependency explains the contradictory literature findings, since experiments with similar systems might favor plug flow or mixing as function of the (U,G)-values. The approach is finally used to tentatively assess the conversion of the gas in the riser, as illustrated for a simple gas/catalytic first order reaction. The calculations show that the reaction yields, for the specific case, are favored by high velocities, whereas higher G-values at a given U reduce the conversion. Keywords: circulating fluidized bed, flow model, pyrolysis
1. Introduction
The first circulating fluidized bed (CFB) was built in 1939 (Squires, 1986). The fundamental study of its hydrodynamics started only in the late sixties and seventies, and several researchers have published results on the gas and solid flow as reviewed below. The CFB has however gained increasing interest in a wide variety of industrial processes and additional applications are still being explored (Table 1). The key part of the CFB is the relatively small riser where a gas/solid suspension rises from bottom to top. In order to keep a sufficiently dense suspension in the riser, particles are continuously recycled to its base. As illustrated in Table 1, the processes in a CFB can be divided in (i) catalytic gas/gas reactions where the solids serve as catalyst and heat transfer medium (the products are gaseous and mostly organic chemicals, as final or intermediate products); and (ii) gas/solid reactions where both phases react to yield products and/or energy.
( )50
0.8 0.80.5F t ttσ σ
= + −
The residence time distribution of the gas phase in circulating fluidized beds (CFB) 3
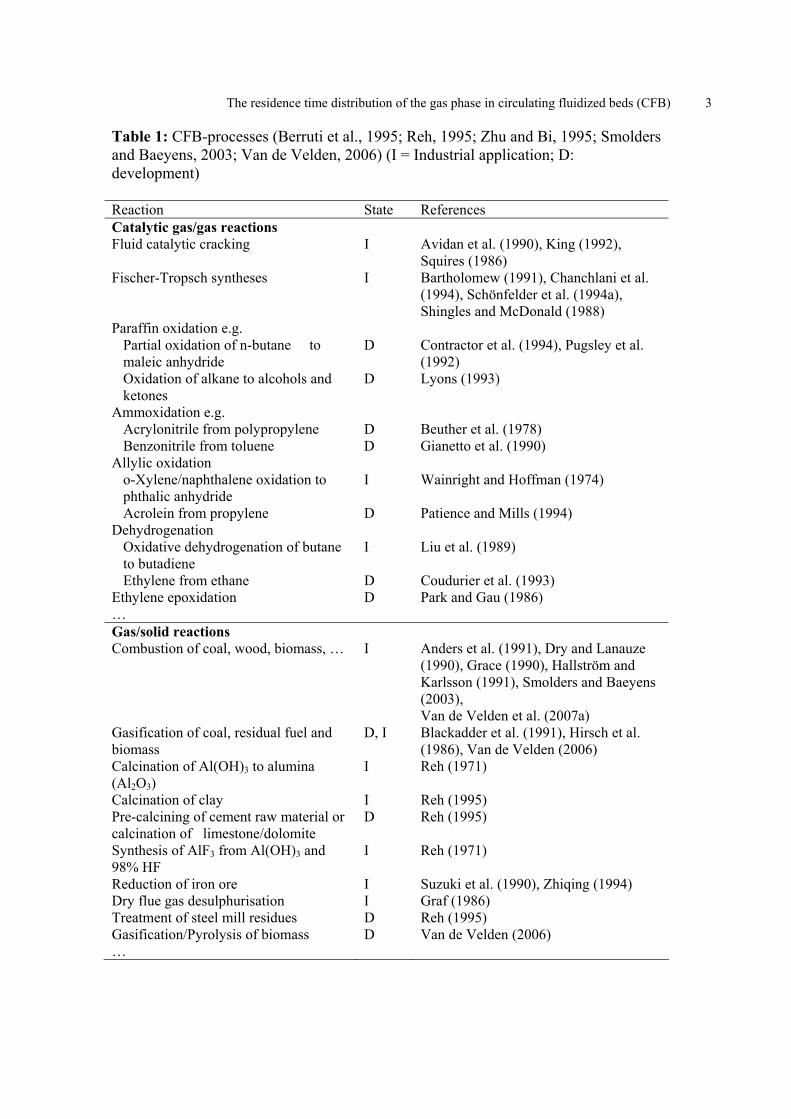
Table 1: CFB-processes (Berruti et al., 1995; Reh, 1995; Zhu and Bi, 1995; Smolders and Baeyens, 2003; Van de Velden, 2006) (I = Industrial application; D: development) Reaction State References Catalytic gas/gas reactions Fluid catalytic cracking I Avidan et al. (1990), King (1992),
Squires (1986) Fischer-Tropsch syntheses I Bartholomew (1991), Chanchlani et al.
(1994), Schönfelder et al. (1994a), Shingles and McDonald (1988)
Paraffin oxidation e.g. Partial oxidation of n-butane to maleic anhydride
D Contractor et al. (1994), Pugsley et al. (1992)
Oxidation of alkane to alcohols and ketones
D Lyons (1993)
Ammoxidation e.g. Acrylonitrile from polypropylene D Beuther et al. (1978) Benzonitrile from toluene D Gianetto et al. (1990)
Allylic oxidation o-Xylene/naphthalene oxidation to phthalic anhydride
I Wainright and Hoffman (1974)
Acrolein from propylene D Patience and Mills (1994) Dehydrogenation
Oxidative dehydrogenation of butane to butadiene
I Liu et al. (1989)
Ethylene from ethane D Coudurier et al. (1993) Ethylene epoxidation D Park and Gau (1986) … Gas/solid reactions Combustion of coal, wood, biomass, … I Anders et al. (1991), Dry and Lanauze
(1990), Grace (1990), Hallström and Karlsson (1991), Smolders and Baeyens (2003), Van de Velden et al. (2007a)
Gasification of coal, residual fuel and biomass
D, I Blackadder et al. (1991), Hirsch et al. (1986), Van de Velden (2006)
Calcination of Al(OH)3 to alumina (Al2O3)
I Reh (1971)
Calcination of clay I Reh (1995) Pre-calcining of cement raw material or calcination of limestone/dolomite
D Reh (1995)
Synthesis of AlF3 from Al(OH)3 and 98% HF
I Reh (1971)
Reduction of iron ore I Suzuki et al. (1990), Zhiqing (1994) Dry flue gas desulphurisation I Graf (1986) Treatment of steel mill residues D Reh (1995) Gasification/Pyrolysis of biomass D Van de Velden (2006) …

M. Van de Velden et al.
The different nature of the reactions requires different working conditions. For catalytic gas-phase reactions, gas back-mixing should be avoided and hence plug flow promoted. Furthermore, short contact times are demanded by the high reaction rates, so that high gas velocities should be used. As the catalyst is quickly deactivated and hence requires frequent regeneration, high solids circulation rates are also needed. As a result, the solids concentration will be high, thus promoting the reaction rate and permitting frequent catalyst reactivation. For gas solid processes on the other hand, the usually low reaction rate does neither require a high gas velocity, nor a high solids circulation rate. Low gas velocity operation is permitted because the solids are usually the key reactant/product so that the extent of gas and/or solids back-mixing may not always be critical. Some gas/solid reactions, e.g. biomass pyrolysis (Van de Velden and Baeyens, 2007), require operating conditions of gas catalytic reactions since the by-product (char) acts as cracking catalyst for the main product (bio-oil), thus considerably reducing its production yield at high residence times. Typical operating conditions for both reaction processes are given in Table 2 (Berutti et al., 1995; Zhu and Bi, 1995). Table 2: Typical operating conditions of gas/solid and catalytic gas/gas circulating fluidized bed reactors (Berutti et al., 1995; Zhu and Bi, 1995) gas/solid reactions catalytic gas/gas reactions Particle density (kg/m³) 1 800 – 2 600 1 100 - 1 700 Particle size (mm) 0.10 – 0.30 0.04 - 0.08 superficial gas velocity (m/s)
5 – 9 6 – 28
solids circulation rate (kg/m²s)
10 – 100 400 - 1 200
solids concentration in the development region
mostly < 1% 3 - 12%
average solids residence time (single pass) (s)
20 – 40 2 – 4
riser diameter (m) 4 - 8 for combustors, 1 - 3 for other applications
0.7 - 1.5
height-to-diameter ratio < 5 – 10 > 20 solids recycle control non-mechanical valves mechanical valves
The conversion of gas and/or particles depends on the reaction rate and the residence time in the riser. Whereas the reaction rate (and its rate constant) are determined mostly by the chemistry and thermodynamics of the system under scrutiny, the residence time is a function only of the hydrodynamics of the gas/solid flow in the riser.

The residence time distribution of the gas phase in circulating fluidized beds (CFB) 5
The increasing interest in using a CFB for fast reactions underlines the importance of the gas hydrodynamics, subject of the present research. The study of the hydrodynamics of the particles has been published previously (Van de Velden et al., 2007b,c).
2. Literature review of gas hydrodynamics in a CFB
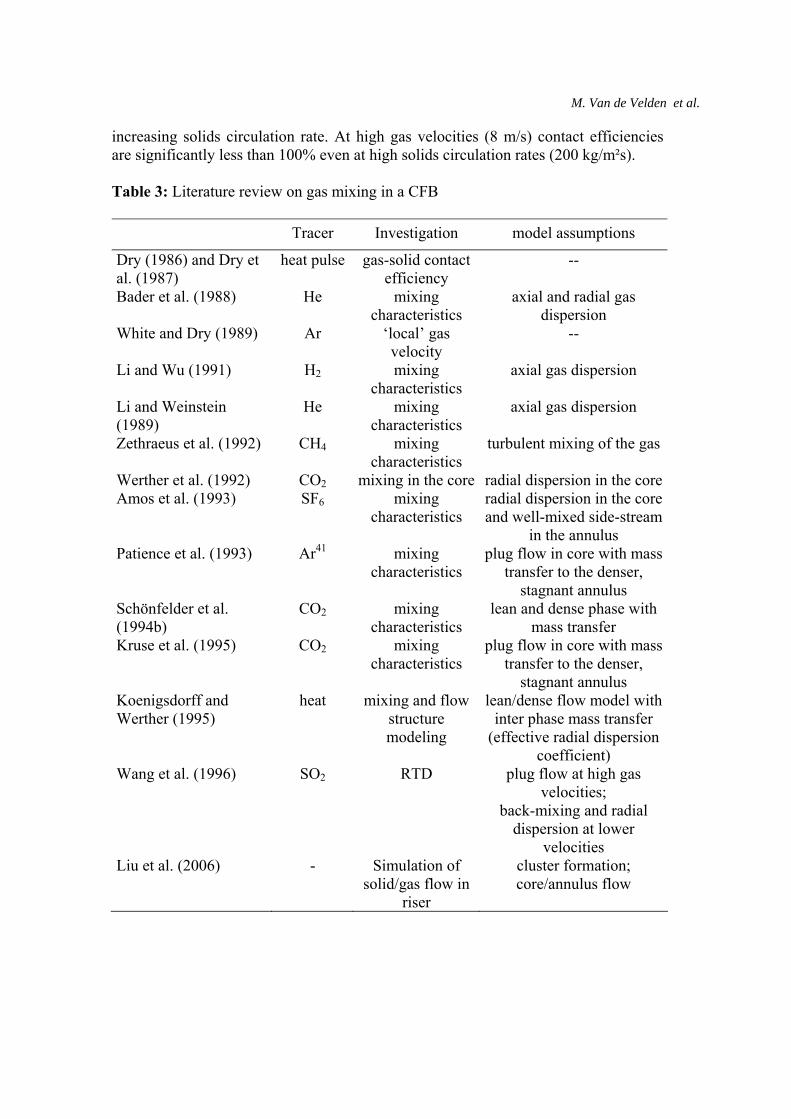
The solids motion in CFBs has been extensively studied and reported (e.g. Van de Velden et al., 2007b,c). The literature on gas mixing in CFB-risers is limited. Gas mixing investigations consider either the overall behavior or local mixing phenomena. These investigations are summarized in Table 3. The overall mixing behavior has been studied by measuring the residence time distribution of a gas tracer injected at the distributor level (Patience and Chaouki, 1993; Wang et al., 1996). A detailed insight into the mixing characteristics of the CFB is obtained from studies where tracer gas is injected and measured at various locations inside the riser (Bader et al., 1988; Dry, 1986; Li and Weinstein, 1989). He, Ar, CH4, CO2 and other gases have been used as tracer and are detected by e.g. mass spectrometry. The injection of the tracer is mostly performed as a pulse, although a continuous injection has also be used (Brereton et al., 1988). Cankurt and Yerushalmi (1978) concluded that back-mixing of gas in the CFB riser is negligible when compared with convective gas flow. This was further confirmed by other authors (Bader et al., 1988; Helmrich et al., 1986). Other investigators however (Kruse et al., 1995) stated that a considerable amount of back-mixing exists in CFB risers. This contradiction can be explained by the different flow regions in the riser and by the limited accuracy of the measuring equipment. In order to account for gas back-mixing, the gas/solid flow in the riser has been modeled by a homogeneous one-dimensional axial dispersion model or by a two-region model based on the core/annulus concept or on the lean/dense flow concept with falling clusters. Several assumptions have been proposed: plug flow, radial dispersion in the core with a mass transfer to the annular zone, back-mixing in the annular zone, etc. Table 3 reviews the previous investigations with their main model assumptions. Other references are found in Patience et al. (1993). Dry et al. (Dry, 1986; Dry et al., 1987) and White and Dry (1989) measured the contact efficiency between the gas and solid phase in a CFB by means of hot gas injection and rapid-response thermocouple detection. The rate at which hot gas is thermally equilibrated with the bed is measured and is interpreted in terms of the degree to which gas and solid come into intimate contact. This can be an important parameter as bypassing of the gas without contacting solid particles can result in a decreased performance of the reactor e.g. in coal combustion where complete capture of SO2 by limestone becomes difficult. Their results reveal that gas/solid contact appears to be almost complete at low gas velocities (2 - 4 m/s) and improves with
M. Van de Velden et al.
increasing solids circulation rate. At high gas velocities (8 m/s) contact efficiencies are significantly less than 100% even at high solids circulation rates (200 kg/m²s). Table 3: Literature review on gas mixing in a CFB
Tracer Investigation model assumptions
Dry (1986) and Dry et al. (1987)
heat pulse gas-solid contact efficiency
--
Bader et al. (1988)
He mixing characteristics
axial and radial gas dispersion
White and Dry (1989) Ar ‘local’ gas velocity
--
Li and Wu (1991) H2
mixing characteristics
axial gas dispersion
Li and Weinstein (1989)
He mixing characteristics
axial gas dispersion
Zethraeus et al. (1992) CH4
mixing characteristics
turbulent mixing of the gas
Werther et al. (1992) CO2 mixing in the core radial dispersion in the coreAmos et al. (1993) SF6 mixing
characteristics radial dispersion in the core and well-mixed side-stream
in the annulus Patience et al. (1993) Ar41 mixing
characteristics plug flow in core with mass
transfer to the denser, stagnant annulus
Schönfelder et al. (1994b)
CO2 mixing characteristics
lean and dense phase with mass transfer
Kruse et al. (1995) CO2 mixing characteristics
plug flow in core with mass transfer to the denser,
stagnant annulus Koenigsdorff and Werther (1995)
heat mixing and flow structure modeling
lean/dense flow model with inter phase mass transfer
(effective radial dispersion coefficient)
Wang et al. (1996)
SO2 RTD plug flow at high gas velocities;
back-mixing and radial dispersion at lower
velocities Liu et al. (2006) - Simulation of
solid/gas flow in riser
cluster formation; core/annulus flow

The residence time distribution of the gas phase in circulating fluidized beds (CFB) 7
A recent paper by Liu et al. (2006) simulated the solid-gas motion in the riser and stressed the importance of cluster formation and gas back mixing near the wall of the riser. The above review on the gas mixing in the riser of a CFB clearly shows the contradictory results of previous investigations: some investigators neglected back-mixing of gas, whereas others report a considerable amount of back-mixing in CFB risers. The present paper reports experimental findings obtained in a 0.1 m I.D. riser, and using a wide range of combined superficial gas velocity and solid circulation rate. It will be shown that the gas mixing mode is strongly affected by the operating conditions, however with a specific dominant mode within a specific (U,G)-range. Additional ongoing research targets the behaviour of the solid and the gas phase in risers of 0.16 and 0.3 m I.D., and at elevated temperature.
3. Experimental work
3.1. Experimental layout
The experiments were performed in a riser of 0.1 m ID and 6.5 m height with a sharp (90°) exit. A detailed description of the experimental rig can be found elsewhere (Van de Velden et al., 2007b). The powder used was sand with a particle density of 2600 kg/m³ and an average size of 90µm. The operating conditions varied from 5.5 to 8.3 m/s as superficial gas velocity, and 40 to 170 kg/m² s as solid circulation flux. In order to determine the residence time in the riser, a pulse of propane was injected at different radial positions in the axis of the L-valve solids recirculation and detected at the riser exit, immediately after the sharp 90° bend. The distance between the exit sampling and the injection point was 6.45 m. The effect of the location of the injection point on the tracer response was firstly investigated by positioning the injection at respectively in the axis of the riser and at 1/3rd. and 2/3rd. of its radius. No significant difference in response curve was measured, thus stressing that the position of the injection point has no marked effect. The annulus downflow of solids (Van de Velden et al., 2006) and the massive solids feed through the recycle loop divert the tracer towards the axis of the riser. A fixed injection time of 0.5 s was used. The continuous detection of propane was by gas chromatography: a constant flow of riser air (and tracer) was sucked to the FID-detector. Since the gas velocity in the exhaust pipe of the riser (0.05 m I.D.) exceeds 15 to 20 m/s, full turbulence is established and the propane concentration at the suction point can be considered as representative for the whole cross section of the exhaust pipe, thus facilitating sampling performed at a single point in the centre of the pipe. The lag time of the suction and detection system was approx. 0.1 seconds. As the propane pulse is firstly transformed by the injection and later on by the riser, both systems will increase the dispersion of the propane flow.

M. Van de Velden et al.
An adsorption isotherm for propane on sand was measured and no adsorption took place. A similar adsorption experiment was carried out using FCC catalyst. Although a minor adsorption effect was measured, further experiments are programmed since adsorption-desorption could affect the gas residence time through the FCC refluxing.
3.2. Data treatment
Fig. 1A illustrates the measured concentration profiles from the tracer injection experiments. The tracer is already detected shortly after its injection (< 1 sec) even at low superficial gas velocities as part of the upward particles flow in the core without transfer to the downward moving particle flow near the wall of the CFB-riser (annulus flow). The particles are conveyed at a velocity nearly equal to the gas velocity in the core. This core flow of tracer is detected as a first peak whereas the refluxing tracer is thereafter detected as a tailing signal. Since the peak is already seen shortly after pulse injection, the injection time period (0.5 s) can not be neglected and is modelled as a block function in the data treatment.
Figure 1: Illustration of A) a measured concentration profile (U = 4.92 m/s, G = 34.1 kg/m²s); and B) the resulting residence time distribution The tracer response is considered to be dispersed firstly by an injection block function and secondly by the riser system itself (Fig. 2). The lag time of the detection system is 0.1 s, and neglected in comparison with the injection and riser residence time. Since gas back mixing is assumed of limited contribution in the overall RTD of the system, a convolution principle can be applied to the residence time distribution (RTD) of the total system (Levenspiel, 1972), and the overall average residence time of the total system is equal to the sum of the average residence times of both parts.
0
0.005
0.01
0.015
0.02
0.025
0 5 10 15 20time (s)
C (g
trac
er/g
sand
)
0
0.1
0.2
0.3
0.4
0.5
0.6
E(t)
C(t)E(t)
A
B
C (m
g tra
cer/m
³air)
500
400
300
200
100mg
C3H
8/m³a
ir
The residence time distribution of the gas phase in circulating fluidized beds (CFB) 9
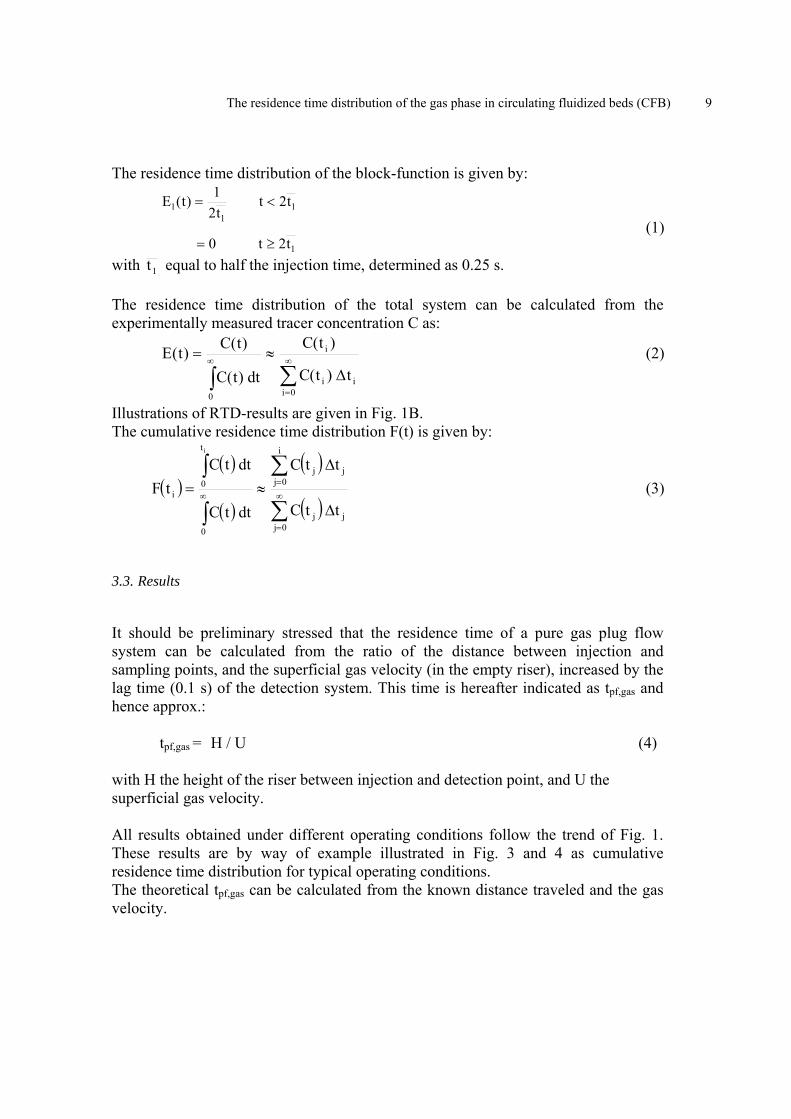
The residence time distribution of the block-function is given by:
1
11
1
t2t0
t2tt21)t(E
≥=
<=
(1)
with t1 equal to half the injection time, determined as 0.25 s.
The residence time distribution of the total system can be calculated from the experimentally measured tracer concentration C as:
∑∫
∞
=
∞
∆≈=
0iii
i
0
t)t(C
)t(C
dt)t(C
)t(C)t(E (2)
Illustrations of RTD-results are given in Fig. 1B. The cumulative residence time distribution F(t) is given by:
( )( )
( )
( )
( )∑
∑
∫
∫∞
=
=∞
∆
∆≈=
0jjj
i
0jjj
0
t
0i
ttC
ttC
dttC
dttCtF
i
(3)
3.3. Results
It should be preliminary stressed that the residence time of a pure gas plug flow system can be calculated from the ratio of the distance between injection and sampling points, and the superficial gas velocity (in the empty riser), increased by the lag time (0.1 s) of the detection system. This time is hereafter indicated as tpf,gas and hence approx.:
tpf,gas = H / U (4)
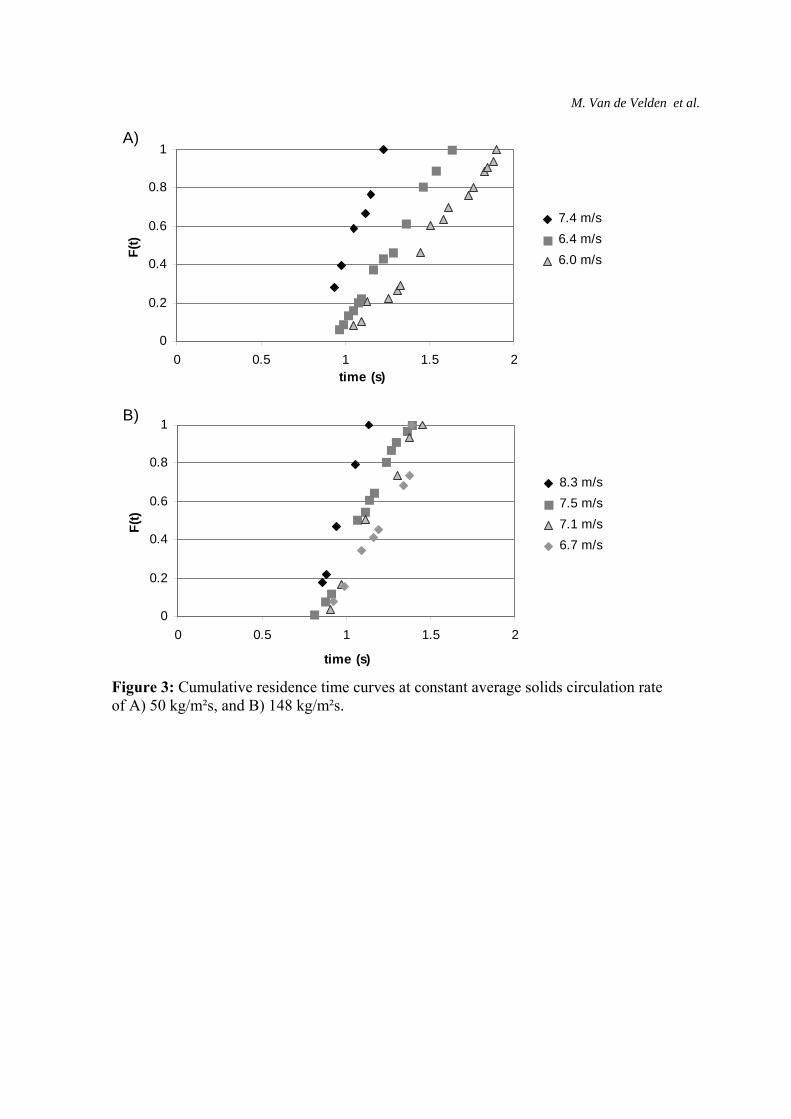
with H the height of the riser between injection and detection point, and U the superficial gas velocity. All results obtained under different operating conditions follow the trend of Fig. 1. These results are by way of example illustrated in Fig. 3 and 4 as cumulative residence time distribution for typical operating conditions. The theoretical tpf,gas can be calculated from the known distance traveled and the gas velocity.
M. Van de Velden et al.
Figure 3: Cumulative residence time curves at constant average solids circulation rate of A) 50 kg/m²s, and B) 148 kg/m²s.
0
0.2
0.4
0.6
0.8
1
0 0.5 1 1.5 2time (s)
F(t)
7.4 m/s 6.4 m/s 6.0 m/s
0
0.2
0.4
0.6
0.8
1
0 0.5 1 1.5 2
time (s)
F(t)
8.3 m/s 7.5 m/s 7.1 m/s 6.7 m/s
A)
B)
The residence time distribution of the gas phase in circulating fluidized beds (CFB) 11
( ) ( )0.9 0.1
50
F t F tt t
tσ = =−
=
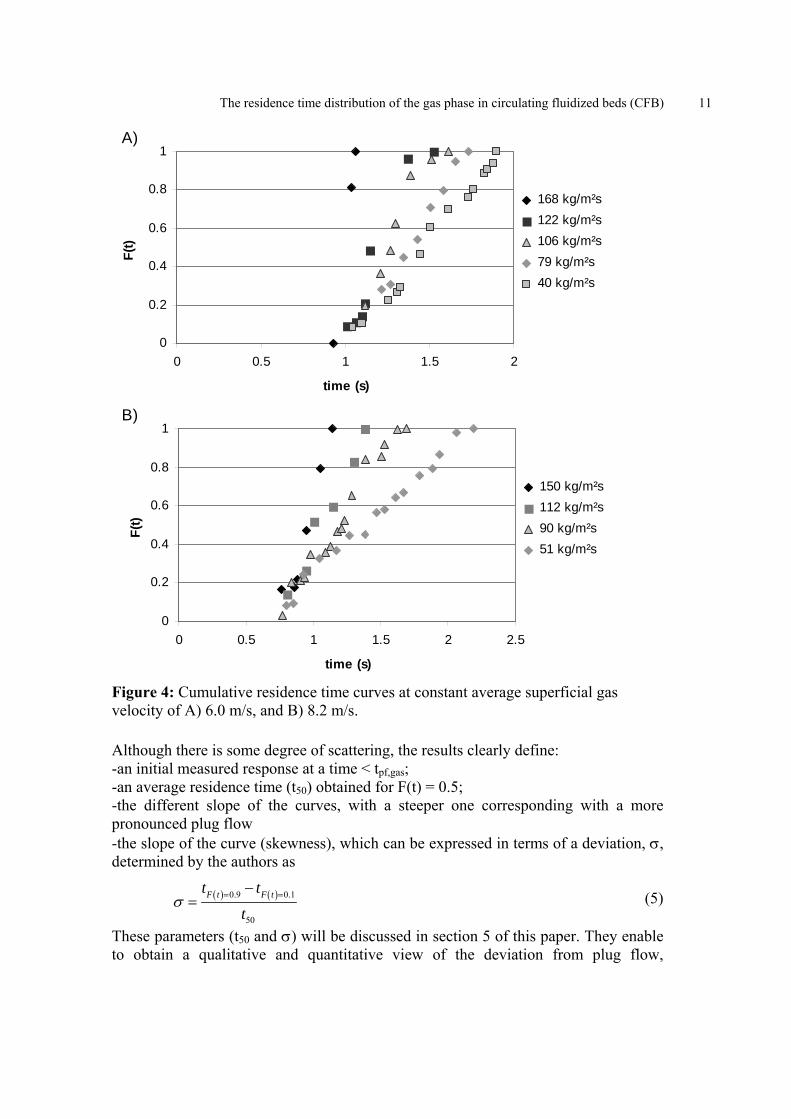
Figure 4: Cumulative residence time curves at constant average superficial gas velocity of A) 6.0 m/s, and B) 8.2 m/s. Although there is some degree of scattering, the results clearly define: -an initial measured response at a time < tpf,gas; -an average residence time (t50) obtained for F(t) = 0.5; -the different slope of the curves, with a steeper one corresponding with a more pronounced plug flow -the slope of the curve (skewness), which can be expressed in terms of a deviation, σ, determined by the authors as
(5)
These parameters (t50 and σ) will be discussed in section 5 of this paper. They enable to obtain a qualitative and quantitative view of the deviation from plug flow,
0
0.2
0.4
0.6
0.8
1
0 0.5 1 1.5 2
time (s)
F(t)
168 kg/m²s 122 kg/m²s 106 kg/m²s 79 kg/m²s 40 kg/m²s
0
0.2
0.4
0.6
0.8
1
0 0.5 1 1.5 2 2.5
time (s)
F(t)
150 kg/m²s 112 kg/m²s 90 kg/m²s 51 kg/m²s
A)
B)

M. Van de Velden et al.
expressed by both the ratio of t50/tpf,gas and the ratio σ/t50. A quantitative comparison could possibly also be obtained by using RTD-models, as discussed hereafter.
4. Model predictions
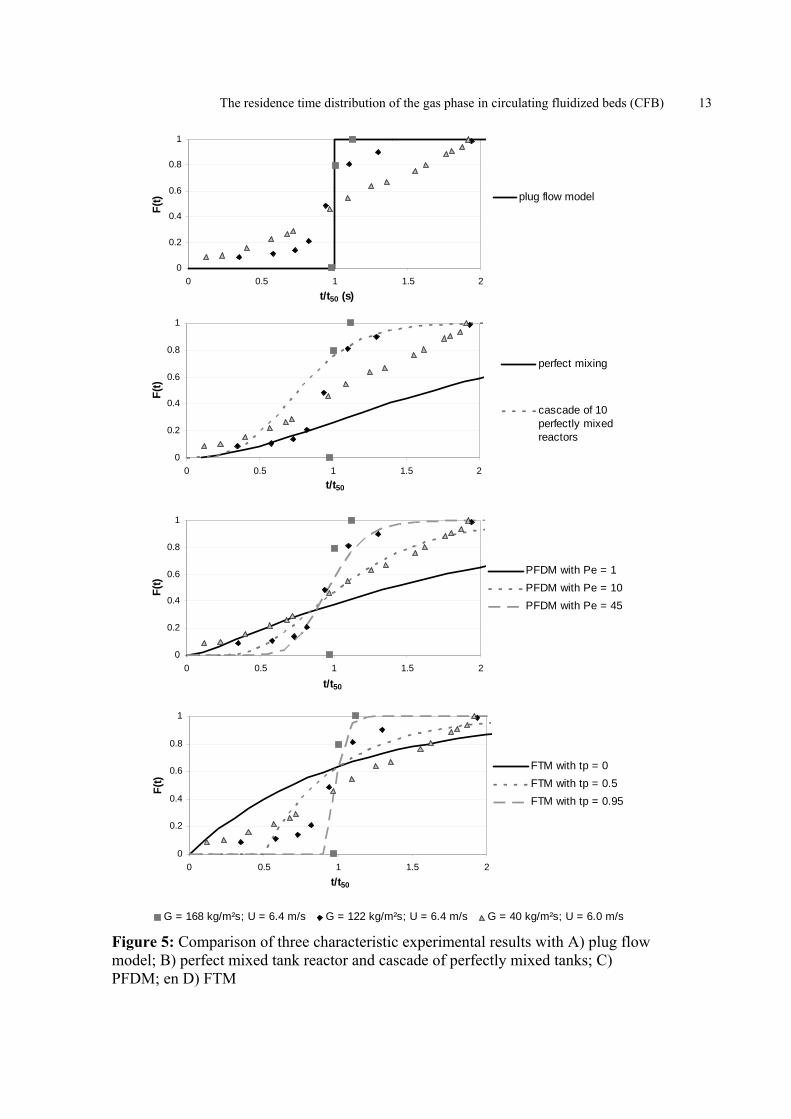
Different modelling approaches can be used to describe the flow regime. The traditional approaches of plug flow and perfectly mixed (or a cascade of perfectly mixed) tank reactors as well as various (semi-empirical) models, such as the PFD- (Plug Flow with Dispersion), the PTD- (Probabilistic Time Delay) and the FT- (Fractional Tubularity) model were tested (Nauman, 1987; Nauman and Buffham, 1983). These modelling approaches were also used to assess the solids’ RTD in the riser (Van de Velden et al., 2007-b). The predictions of the PTD-model are not included because of the required fitting of three parameters. This model is seldom used in powder reaction engineering but has been validated in the hydrodynamics of spiral-wound membranes, where membranes are separated by spacers (Van Gauwbergen and Baeyens, 1997; Van Gauwbergen et al., 2000). The experiments were performed in a wide range of velocities (5.5 - 8.3 m/s) and solid circulation fluxes (40 to 170 kg/m²s), in order to study the gas hydrodynamics in different flow regimes (dilute, dense, mixed). To illustrate the gas behaviour in these different regimes, the normalized cumulative residence times of three representative experiments are shown in Fig. 5. Similar results were obtained for all other (U,G)-combinations.
The residence time distribution of the gas phase in circulating fluidized beds (CFB) 13
00.20.40.60.81
0 1 2t/tav (s)
F(t)
G = 168 kg/m²s; U = 6.4 m/s G = 122 kg/m²s; U = 6.4 m/s G = 40 kg/m²s; U = 6.0 m/s
0
0.2
0.4
0.6
0.8
1
0 0.5 1 1.5 2t/t50 (s)
F(t) plug flow model
0
0.2
0.4
0.6
0.8
1
0 0.5 1 1.5 2t/t50
F(t)
perfect mixing
cascade of 10perfectly mixedreactors
0
0.2
0.4
0.6
0.8
1
0 0.5 1 1.5 2
t/t50
F(t)
PFDM with Pe = 1PFDM with Pe = 10PFDM with Pe = 45
0
0.2
0.4
0.6
0.8
1
0 0.5 1 1.5 2t/t50
F(t)
FTM with tp = 0FTM with tp = 0.5FTM with tp = 0.95
Figure 5: Comparison of three characteristic experimental results with A) plug flow model; B) perfect mixed tank reactor and cascade of perfectly mixed tanks; C) PFDM; en D) FTM
M. Van de Velden et al.
None of the models fit the experimental data over the complete (U,G)-range, although the plug flow and PT models fit near-plug flow results. The occurrence of both mixed flow and plug flow is evident, and strongly dependent upon combined operational parameters of gas superficial velocity and solids circulation rate as was described above. The interesting operating conditions for catalytic gas phase reactions are those that are characterized by a minimal difference between the real average residence time and the theoretical residence time according to the plug flow mode: a significant degree of back-mixing might indeed enhance secondary (unwanted) reactions.
5. Discussion of t50 and σ
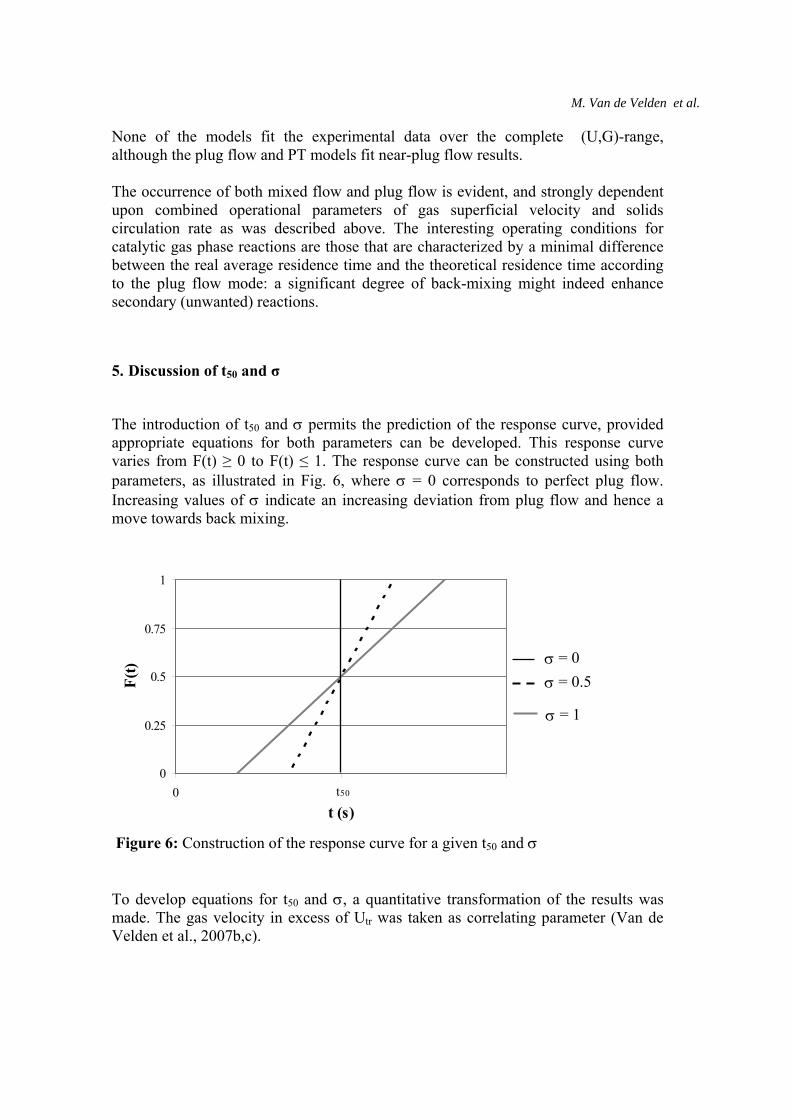
The introduction of t50 and σ permits the prediction of the response curve, provided appropriate equations for both parameters can be developed. This response curve varies from F(t) ≥ 0 to F(t) ≤ 1. The response curve can be constructed using both parameters, as illustrated in Fig. 6, where σ = 0 corresponds to perfect plug flow. Increasing values of σ indicate an increasing deviation from plug flow and hence a move towards back mixing.
Figure 6: Construction of the response curve for a given t50 and σ To develop equations for t50 and σ, a quantitative transformation of the results was made. The gas velocity in excess of Utr was taken as correlating parameter (Van de Velden et al., 2007b,c).
0
0.25
0.5
0.75
1
0 1 2t (s)
F(t) σ = 0
σ = 0.5
σ = 1
t50
The residence time distribution of the gas phase in circulating fluidized beds (CFB) 15
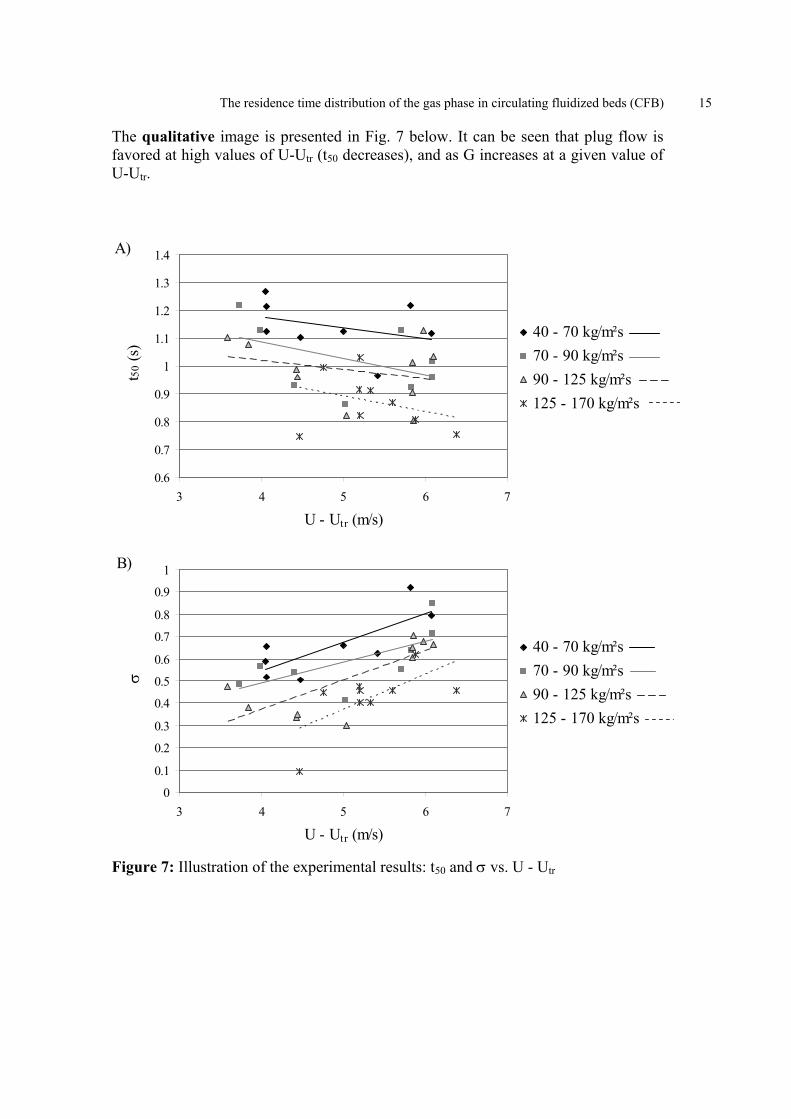
The qualitative image is presented in Fig. 7 below. It can be seen that plug flow is favored at high values of U-Utr (t50 decreases), and as G increases at a given value of U-Utr.
Figure 7: Illustration of the experimental results: t50 and σ vs. U - Utr
0.6
0.7
0.8
0.9
1
1.1
1.2
1.3
1.4
3 4 5 6 7
U - Utr (m/s)
t 50 (s
)
40 - 70 kg/m²s70 - 90 kg/m²s90 - 125 kg/m²s125 - 170 kg/m²s
0
0.1
0.2
0.3
0.4
0.5
0.6
0.7
0.8
0.9
1
3 4 5 6 7
U - Utr (m/s)
σ
40 - 70 kg/m²s70 - 90 kg/m²s90 - 125 kg/m²s125 - 170 kg/m²s
A)
B)
M. Van de Velden et al.
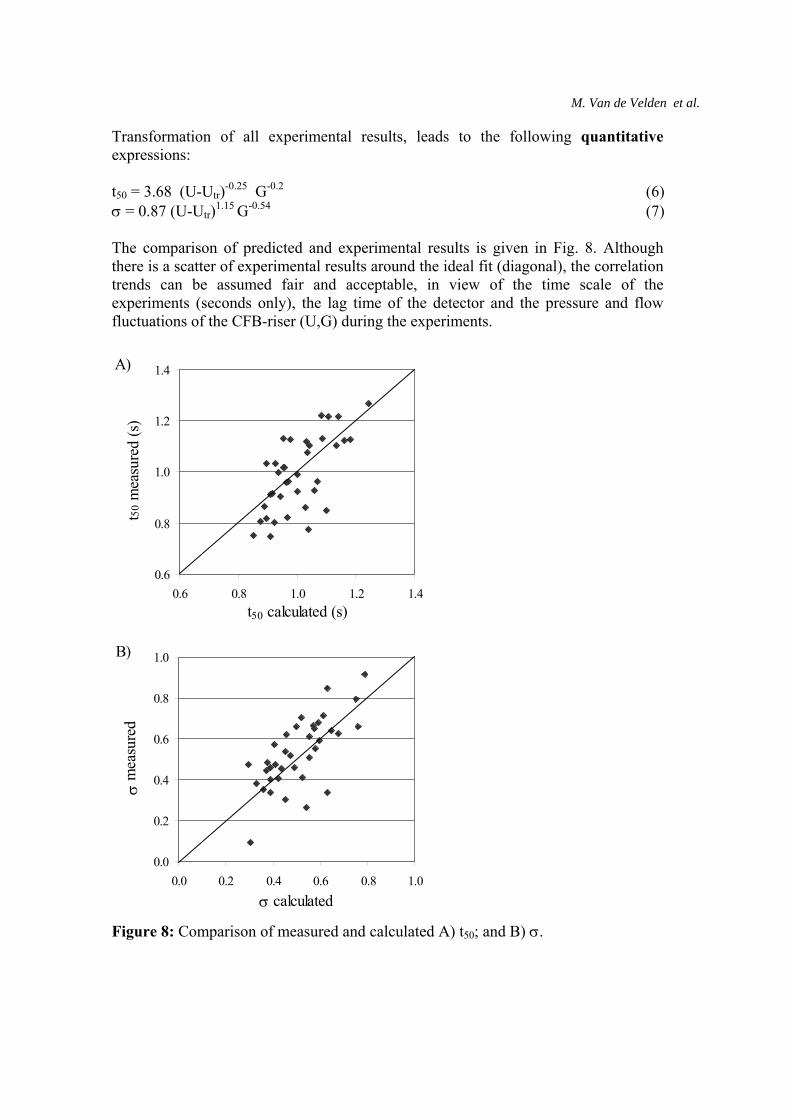
Transformation of all experimental results, leads to the following quantitative expressions: t50 = 3.68 (U-Utr)-0.25 G-0.2 (6) σ = 0.87 (U-Utr)1.15 G-0.54 (7) The comparison of predicted and experimental results is given in Fig. 8. Although there is a scatter of experimental results around the ideal fit (diagonal), the correlation trends can be assumed fair and acceptable, in view of the time scale of the experiments (seconds only), the lag time of the detector and the pressure and flow fluctuations of the CFB-riser (U,G) during the experiments.
Figure 8: Comparison of measured and calculated A) t50; and B) σ.
0.0
0.2
0.4
0.6
0.8
1.0
0.0 0.2 0.4 0.6 0.8 1.0
σ calculated
σ m
easu
red
0.6
0.8
1.0
1.2
1.4
0.6 0.8 1.0 1.2 1.4t50 calculated (s)
t50 m
easu
red
(s)
A)
B)
The residence time distribution of the gas phase in circulating fluidized beds (CFB) 17
It should moreover be remembered that experiments were performed for a riser with a distance of 6.45 m between injection of tracer and sampling. For any other riser height, the t50 values should be proportionally increased. It is therefore required to transform the previous t50 equation to its value per effective length (m) of riser: t50 = 0.57 (U-Utr)-0.25 G-0.2
with t50 in s/m riser height (8) Although no effect of height on σ is expected (provided the riser solid-gas flow is steady and fully developed), this parameter needs further investigation. Also the configuration of the riser exit (sharp, 90°, in the present rig) shall be evaluated (angle 45°, round) since this will undoubtedly affect the solids refluxing (and associated gas back mixing) at the top of the riser. The gas mixing mode in a riser of effective height H, at specific operating conditions is determined by t50 and σ. The plug flow residence time for gas flow alone, tpf,gas is defined as H/U. A further assessment of the gas phase mixing behavior can hence be conducted since the experimental F(t)-curve can - as first approximation - be linearized over a wide range of F(t)-values as:
(9)
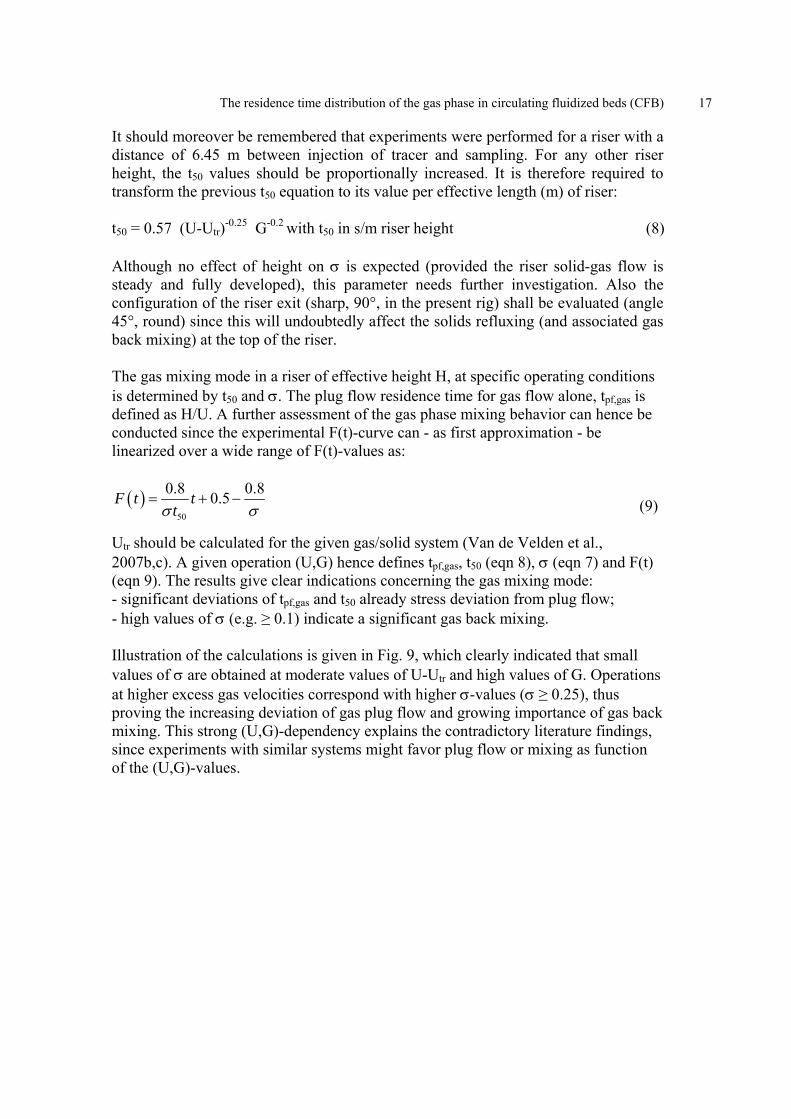
Utr should be calculated for the given gas/solid system (Van de Velden et al., 2007b,c). A given operation (U,G) hence defines tpf,gas, t50 (eqn 8), σ (eqn 7) and F(t) (eqn 9). The results give clear indications concerning the gas mixing mode: - significant deviations of tpf,gas and t50 already stress deviation from plug flow; - high values of σ (e.g. ≥ 0.1) indicate a significant gas back mixing. Illustration of the calculations is given in Fig. 9, which clearly indicated that small values of σ are obtained at moderate values of U-Utr and high values of G. Operations at higher excess gas velocities correspond with higher σ-values (σ ≥ 0.25), thus proving the increasing deviation of gas plug flow and growing importance of gas back mixing. This strong (U,G)-dependency explains the contradictory literature findings, since experiments with similar systems might favor plug flow or mixing as function of the (U,G)-values.
( )50
0.8 0.80.5F t ttσ σ
= + −
M. Van de Velden et al.
Figure 9: The occurrence of plug and mixed gas flow as function of operating conditions The t50, σ and F(t) values can moreover be used to assess the conversion of the gas in the riser, as illustrated for a simple first order reaction. The overall conversion can be calculated as: (k in 1/s)
(10)
whereby ti is stepwise increased from tF(t)=0 to tF(t)=1. This is illustrated in Fig. 10 for the first order reaction (k = 1 s-1) in a 20 m high riser. The calculations show that the reaction yields, for the specific case, are favored by high velocities, whereas higher G-values at a given U reduce the conversion.
( ) ( )( )1 exp iX F t kt= − −∑
0
200
400
600
800
1000
1200
1400
0 2 4 6 8 10 12
U - Utr (m/s)
G (k
g/m
²s)
s = 0.1s = 0.25s = 0.5
σσσ

The residence time distribution of the gas phase in circulating fluidized beds (CFB) 19
Figure 10: Illustration of conversion in a 20 m high riser with k = 1 s-1 in function of U and G To assess the validity of this approach, further experimental work will be conducted in a CFB-riser using a gas-catalytic process operating at moderate temperatures (<150°C).
6. Conclusions
A literature review on the gas mixing in the riser of a CFB showed contradictory results of previous investigations: some investigators neglected back-mixing of gas, whereas others report a considerable amount of back-mixing in CFB risers. In order to determine the gas residence time in the riser, a pulse of propane was injected at the bottom and detected at the riser exit. The cumulative response curves [F(t)] define:
- an average residence time (t50) obtained for F(t) = 0.5 - the different slope of the curves, with a steeper one corresponding with a more
pronounced plug flow, and expressed in terms of a deviation, σ.
These parameters (t50 and σ) define the gas flow mode. A quantitative comparison of experimental results with known RTD-models is inconclusive although the occurrence of both mixed flow and plug flow is evident, and (U,G)-dependent.
0.7
0.75
0.8
0.85
0.9
0.95
1
0 200 400 600 800 1000 1200
G (kg/m²s)
conv
ersio
n
U = 6 m/sU = 8 m/sU = 10 m/s
M. Van de Velden et al.
The experimental results were expressed in design equations. These equations were used to predict the gas flow, which indeed varied from plug mixed flow as function of the combined operating parameters U and G. Operations at higher excess gas velocities corresponded with higher σ-values (σ ≥ 0.25), thus proving the increasing deviation of gas plug flow and growing importance of gas back mixing. This strong (U,G)-dependency explains the contradictory literature findings, since experiments with similar systems might favor plug flow or mixing as function of the (U,G)-values. The approach were finally used to tentatively assess the conversion of the gas in the riser.
References
Amos, G., Rhodes, M.J. and Mineo, H., (1993) Chemical Engineering Science, 48, 943-949. Anders, R., Beisswenger, H. and Plass, L., Clean and low cost energy from atmospheric and pressurized Lurgi CFB systems. In: Circulating Fluidized Bed Technology III, Basu, P., Horo, M. and Hasatani, M. (Eds.), Pergamon Press, New York, 431-437 (1991). Avidan, A.A., Edwards, M. and Owen, H., (1990) Oil and Gas Journal, 88, 33-58. Bader, R., Findlay, J. and Knowlton, T.M., Gas/solids flow patterns in a 30.5 cm diameter circulating fluidized bed. In: Circulating Fluidized Bed Technology II, Basu, P. and Large, J.F. (Eds.), Pergamon Press, 133-137 (1988). Bartholomew, C.H., Recent developments in Fischer-Tropsch Catalysis, New Trends in CO Activation, In: Studies in Surface Science and Catalysis No. 64, Guczi, L. (Ed.), Elsevier, Amsterdam, The Netherlands, 158-224 (1991). Berruti, F., Chaouki, J., Godfroy, L., Pugsley, T.S. and Patience, G.S., (1995) Canadian Journal of Chemical Engineering, 73, 579-602. Beuther, H., Innes, R.A. and Swift, H.E., (1978) Process for preparing acrylonitrile, U.S. Patent 4, 102, 914 assigned to Gulf Research and Development Co., July 25 (1978). Blackadder, W., Morris, M., Rensfelt, E. and Waldheim, L., Development of an integrated gasification and hot gas cleaning process using circulating fluidized bed technology. In: Circulating Fluidized Bed Technology III, Basu, P., Horio, M. and Hasatani, M. (Eds.), Pergamon Press, Toronto, 511-518 (1991).
The residence time distribution of the gas phase in circulating fluidized beds (CFB) 21
Brereton, C.M.H., Grace, J.R. and Yu, J., In: Circulating Fluidized Bed Technology II, Basu, P. and Larege, J.F. (Eds.), Pergamon Press, 123-127 (1988). Cankurt, N.T. and Yerushalmi, J., Gas backmixing in high velocity fluidized beds. In: Fluidization, Davidson, J.F. and Kearns, D.L. (Eds.), Cambridge University Press, Cambridge, 387 (1978). Chanchlani, K.G., Hudgins, R.R. and Silveson, P.L., (1994) Canadian Journal of Chemical Engineering, 72, 657-671. Contractor, R.M., Patience, G.S., Garnett, D.I., Horowitz, H.S., Sisler, G.M. and Bergna, H.E., A new process for n-butane oxidation to maleic anhydride using a circulating fluidized bed reactor. In: Circulating Fluidized Bed Technology IV, Avidan, A.A. (Ed.), American Institute of Chemical Engineers, New York, 387-391 (1994). Coudurier, G., Decottignies, D., Loukah, M. and Vedrine, J.C., (1993) Vanadium and chromium based phosphates as catalysts for oxidative dehydrogenation of ethane. Presented at the 13th North American Meeting of the Catalysis Society, Pittsburgh PA, May 2 (1993). Dry, R.J. and Lanauze, R.D., (1990) Chemical Engineering Progress, 86, 31-47. Dry, R.J., (1986) Powder Technology, 49, 37-44. Dry, R.J., Christensen, I.N. and White, C.C., (1987) Powder Technology, 52, 243-250. Gianetto, A., Pagliolico, S., Rovero, G. and Ruggeri, B., (1990) Chemical Engineering Science, 45, 2219-2225. Grace, J.R., (1990) Chemical Engineering Science, 45, 1953-1966. Graf, R., First operating experience with a dry flue gas desulfurization (FGD) process using a circulating fluidized bed (FGD-CFB). In: Circulating Fluidized Bed Technology, Basu, P. (Ed.), Pergamon Press, Toronto, 317-327 (1986). Hallström, C. and Karlsson, R., Waste incineration in circulating fluidized bed boilers: test results and operating experiences. In: Circulating Fluidized Bed Technology III, Basu, P., Horio, M. and Hasatani, M. (Eds.), Pergamon Press, New York, 417-422 (1991). Helmrich, H., Schurgerl, K. and Janssen, K., Decomposition of NaHCO3 in laboratory and bench scale circulating fluidized bed reactors. In: Circulating Fluidized Bed Technology, Basu, P. (Ed.), Pergamon Press, Toronto, 161-166 (1986).
M. Van de Velden et al.
Hirsch, M., Janssen, K. and Serbent, H., The circulating fluidized bed as reactor for chemical and metallurgical processes. In: Circulating Fluidized Bed Technology, Basu, P. (Ed.), Pergamon Press, Toronto, 329-339 (1986). King, D., Fluidized catalytic crackers: an engineering review. In: Fluidization VII, Potter, O.E. and Nicklin, D.J. (Eds.), Engineering Foundation, New York, 15-26 (1992). Koenigsdorff, R. and Werther, J., (1995) Powder Technology, 82, 317-329. Kruse, M, Schönfelder, H. and Werther, J., (1995) Canadian Journal of Chemical Engineering, 73, 620-634. Levenspiel, O., Chemical reactor engineering, 2nd edition. Wiley, New York, (1972). Li, J. and Weinstein, H., (1989) Chemical Engineering Science, 44, 1697-1705. Li, Y. and Wu, P., Axial gas mixing in circulating fluidized beds. In: Circulating Fluidized Bed Technology III, Basu, P., Horio, M. and Hasatani, M. (Eds.), Pergamon Press, 6-7-1 preliminary (1991). Liu, J., Zhang, R., Luo, G. and Yang, G.L., (1989) Chemical Reaction Engineering and Technology, 5, 1-8 (1989). Liu, X., Xu, X. and Zhang, W., (2006) Journal of the University of Science and Technology of Bejing, Mineral, Metallurigys material 13(4), 301-307. Lyons, J.E., The molecular design, synthesis and application of new catalytic systems for the selective oxidation of hydrocarbons to fuels and chemical products, presented at the 13th North American Meeting of the Catalysis Society, Pittsburgh, PA. May 2 (1993). Nauman, E.B. and Buffham, B.A., Mixing in Continuous Flow Systems, John Wiley & Sons, New York (1983). Nauman, E.B., Chemical Reactor Design, John Wiley & Sons, New York (1987). Park, D.W. and Gau, G., (1986) Chemical Engineering Science, 41, 143-150. Patience, G.S. and Chaouki, J., (1993) Chemical Engineering Science, 48, 3195-3205 (1993). Patience, G.S. and Mills, P.L., Modelling of propylene oxidation in a circulating fluidized bed reactor. In: New Developments in Selective Oxidation II, Corberan V.C. and Vic Bellon S. (Eds.), Elsevier, New York, 1-18 (1994).
The residence time distribution of the gas phase in circulating fluidized beds (CFB) 23
Pugsley, T.S., Patience, G.S., Berruti, F. and Chaouki, J., (1992) Industrial and Engineering Chemical Research, 31, 2652-2660. Reh, L., (1971) Chemical Engineering Progress, 67, 58-63. Reh, L., (1995) Chemical Engineering & Technology, 18, 75-89. Schönfelder, H., Hinderer, J., Werther, J. and Keil, F.J., (1994a) Chemical Engineering Science, 49, 5377-5390. Schönfelder, H., Werther, J., Hinderer, J. and Keil, F., (1994b) AIChE Symposium Series, 90, (301) 92-104. Shingles, T.M. and McDonald; A.F., Commercial experience with synthol CFB reactors. In: Circulating Fluidized Bed Technology II, Basu, P. and Large, J.F. (Eds.), Pergamon Press, New York, 43-50 (1988). Smolders, K. and Baeyens, J., Operating parameters for the CFB processing of biomass. In: Pyrolysis and Gasification of Biomass and Waste, Bridgwater A.V. (Ed.), CPL-Press, Newbury, 631-640 (2003). Smolders, K. and Baeyens, J., (2001) Powder Technology, 119, 269-291. Squires, A.M., The story of fluid catalytic cracking: the first circulating fluidized bed. In: Circulating Fluidized Bed Technology, Basu, P. (Ed.) Pergamon Press, New York, 1-19 (1986). Suzuki, S., Kunitomo, K., Hayashi, Y., Egashira, T. and Yamamoto, T., Iron ore reduction in a circulating fluidized bed, Proceedings of the 2nd Asian Conference on fluidized bed and three-phase reators, Lu W.-M. and Leu L.-P. (Eds.), Chinese Inst. Chem. Engrs-Taipei, Taipei, 118-125 (1990). Van de Velden, M., Master of Bio-engineering Thesis, University of Antwerp, Belgium (2006). Van de Velden, M. and Baeyens, J., Fundamentals, kinetics and endothermicity of the biomass pyrolysis reaction. To be published in Biomass and Bioenergy (2007). Van de Velden, M., Baeyens, J., Dougan, B., McMurdo, A. and Smolders, K., Operating parameters for the industrial CFB combustion of coal, biomass and sludge. To be published in China Particuology (2007a) [available online]. Van de Velden, M., Baeyens, J. and Smolders, K., (2007b) Chemical Engineering Science, 62, 2139-2153.
M. Van de Velden et al.
Van de Velden, M., Baeyens, J., Seville, J.P.K. and Fan, X., The solids flow in the riser of a Circulating Fluidized Bed (CFB) viewed by Positron Emission Particle Tracking (PEPT). To be published in Powder Technology (2007c) [available online].. Van Gauwbergen, D. and Baeyens, J., (1997). Desalination, 110, 287-299. Van Gauwbergen, D., Jamar, S. and Baeyens, J., (2000). Filtration and Separation, 37, 59-64. Wainwright, M.S. and Hoffman, T.W., The oxidation of o-xylene in a transported bed reactor. In: Chemical Reaction Engineering II, Hulburt H.M. (Ed.), Advances in Chemistry Series No. 133 American Chemical Society, Washington DC, 669-685 (1974). Wang, Q., Zhou, J., Tu, J., Luo, Z., Li, X., Fang, M., Cheng, L., Ni, M. and Cen, K., Residence time in circulating fluidized bed. In: Circulating Fluidized Bed Technology V, DB20 preliminary (1996). Werther, J., Hartge, E.-U. and Kruse, M., (1992) Powder Technology, 70, 293-301. White, C.C. and Dry, R.J., (1989) Powder Technology, 57, 89-94. Zethræus, B., Adams, C. and Berge, N., (1992) Powder Technology, 69, 101-105. Zhiqing, U., Application Collocation. In: Advances in Chemical Engineering, Vol. 20. M. Kwauk (Ed.), Academic Press, New York, 39-83 (1994). Zhu, J.-X. and Bi, H.-T., (1995) Canadian Journal of Chemical Engineering, 73, 644-649.