Embed Size (px)
Citation preview

Acta Polytechnica Hungarica Vol. 11, No. 4, 2014
– 183 –
The Role of Individual Differences in Learning
Péter Tóth
Trefort Ágoston Centre for Endineering Education, Óbuda University
Népszínház u. 8, H-1081 Budapest, Hungary
Abstract: A precondition for the realization of the adaptive teaching process is a knowledge
of the individual characteristics of learning, an understanding of the individual methods of
learning and, through these, the selection and formation of a suitable teaching
environment. Therefore the differences between students must be taken into consideration
by the teacher. They are to be interpreted not only at the level of intellectual capacities but
also with respect to the most different individual characteristics of sensation, perception,
thought and learning. In the present empirical research the 12-item variant of Kolb's LSI
questionnaire is applied for this purpose. First Kolb's learning model is briefly surveyed,
then the objective of the research is stated, the results of the empirical research are shown
and, finally, the most important statements of the research are presented.
Keywords: adaptive teching process; learning strategies; Kolb’s learning styles
1 Preliminaries and Theoretical Background
In a former paper [1] the adaptive teaching process as well as the teaching
strategies in this process were explained. Strategy was interpreted as such a
complex system of procedures as organically combines method, work form and
teaching aids. The preferred individual patterns of strategies characteristic of the
individual were explained as style (of teaching and learning). Our former results
[1] showed that certain learning strategies (e.g. the preferred way of information
acquisition, perception modality [10]) reflect some kind of stability, whereas
others (e.g. the preferred way of information processing and its application) show
continuous variation.
A common feature of the many learning style theories is that students are
classified according to their cognitive characteristics, based on single- or multi-
dimensional bipolar (usually cognitive) scales. [2] Students' effective learning
methods, forms and teaching aids are to be concluded from the preferred strategies
that belong to learning style. The teaching strategies which elicit the most
preferred learning strategies are also to be defined, based on which the learning
environment or the learning process are to be designed.

P. Tóth The Role of Individual Differences in Learning
– 184 –
Coffield formed five groups of the existing sixty to seventy theories. [2] Of these
now the category is highlighted for the present research which interprets learning
style as a flexibly stable learning preference. [3] [4] [5]
From the point of view of our research, the theory examining the learning
preferences of the individual is to be highlighted. The most significant theory in
this group is associated with the name of David Kolb, who has been studying
learning style for more than 40 years. His Learning Style Inventory (LSI) is one of
the most widespread measuring instruments in the examination of learning styles.
His experimental theory of learning amalgamated the relevant and decisive
movements of the 20th Century (John Dewey, Kurt Lewin, Jean Piaget, William
James, Carl Jung, Paulo Freire, Carl Rogers, etc.) [6] [7]
His theory rests on six principles:
- Learning is interpreted as a relationship between the individual and the
environment.
- Learning is interpreted as the holistic process of adaptation to the
environment.
- Learning is to be regarded rather as a regulated process than an outcome
condition.
- The student’s existing knowledge and experience play a decisive role in
processing new information.
- Piaget’s adaptive theory is regarded as the basis of learning. Adaptation has
two forms, namely assimilation and accommodation.
- Learning is a process of constructing knowledge, the result of which presents
itself as a relationship between community knowledge and individual
knowledge.
Kolb gives two important dimensions of learning: perception and processing.
These dimensions are visualized as two intersecting axes, where each axis has two
poles: perception (information acquisition) ranges from concrete experience (CE)
to abstract conceptualization (AC), and information processing ranges from active
experimentation (AE) to reflective observation (RO). The two axes form a four-
quadrant field for mapping individual learning styles. On the basis of preferences
along axes four kinds of learning style were differentiated: Converger, Diverger,
Assimilator and Accommodator. [8] [9]

Acta Polytechnica Hungarica Vol. 11, No. 4, 2014
– 185 –
2 Aims and Means of Examination
David Kolb's LSI (Learning Style Inventory) underwent a lot of change and
development during the years. [7] In our former examination [1] the 9-item
questionnaire, whereas in the present research the 12-item one was used to decide
the learning style of the age group 14 to 18 in basic professional education. The
results were compared with those of the former longitudinal research.[1]
However, it was not possible to draw real conclusions, because this survey –
contrary to the previous one – was not representative (pilot test).
In adapting the questionnaire it was kept in mind that the participants were not
students at higher or adult education (as most of them are in Kolb's tests), but at
vocational secondary schools.
The questionnaire comprises 12 statements with 4 possible endings each. The
student has to rank the following possibilities: 4= most like you, 3= second most
like you, 2= third most like you, 1= least like you. They are worth 4, 3, 2 points or
1 point in that order. These points are added up as columns at the bottom of the
table. The four columns show the above mentioned four kinds of learning
variables and methods. [9]
The participants at the present pilot examination were grade 9, 10 and 11 classes
of 29, 25 and 25 persons respectively at a vocational secondary school of
informatics.
The basic purpose of the examination was, making use of the experience and
results of the former research, to test in basic professional education the 12-item
version of Kolb's questionnaire and thereby prepare a representative longitudinal
examination.
Based on all these the hypotheses and a question of the empirical research
focussing on vocational secondary school students who specialize in informatics
are created according to the following.
H1. Learning variables in both dimensions are not normally distributed (students
specializing in informatics have general preferences) and form a bipolar system.
H2. In the dimension of preferred information type and information acquisition,
perception the learning variables act similarly to attitudes. In this dimension the
preferred learning variable is experience acquisition based on concrete
experiences.
H3. In the dimension of preferred information processing learning variables vary
in a different way with a progress in studies. Productive application and
experimentation is a preferred learning variable.
Q1. How does the ranking of learning style change with the progress in studies?
Can any characteristic realignment or move be observed?

P. Tóth The Role of Individual Differences in Learning
– 186 –
3 Results of Empirical Examination
3.1 Description of Learning Variables
First the descriptive statistical and normality examination of Kolb's learning
variables (AC, RO, AC, CE) and difference variables (AE-RO, AC-CE) were
performed. Both the analysis of descriptive statistical data (Skewness / Std. Error
of Skewness, Kurtosis / Std. Error of Kurtosis; Table 1) and the Kolmogorov –
Szmirnov as well as the Shapiro – Wilk tests (Table 2) unanimously justify that
the less strict conditions of normality are fulfilled for all the variables while the
stricter ones are fulfilled for the majority of them (CE, AC, AC-CE; AE-RO). The
null hypothesis of the Kolmogorov – Szmirnov test is that the variable is not of
normal distribution and the distribution of data based on significance level and
marked by * does not differ from normal distribution.
Table 1
Descriptive statistical data of learning variables and difference variables
AE RO AE-RO AC CE AC-CE
Cases Valid 77 77 77 77 77 77
Missing 0 0 0 0 0 0
Mean 30.74 28.75 1.99 33.08 27.79 5.29
95%
Confidence
Interval for
Mean
Lower
Bound
29.66 27.77 0.32 31.87 26.61 3.27
Upper
Bound
31.82 29.74 3.66 34.29 28.97 7.30
Median 30 29 1 33 28 6
Modus 29 28* 0 32* 25 -4*
Std. Deviation 4.772 4.335 7.357 5.331 5.202 8.887
Skewness 0.259 -0.213 0.389 0.084 -0.164 -0.027
Std. Error of Skewness 0.274 0.274 0.274 0.274 0.274 0.274
Skewness / Std. Error of
Skewness
0.945 -0.777 1.420 0.307 -0.598 -0.100
Kurtosis -0.233 0.291 0.357 0.665 -0.442 0.720
Std. Error of Kurtosis 0.541 0.541 0.541 0.541 0.541 0.541
Kurtosis / Std. Error of
Kurtosis
-0.431 0.538 0.660 1.229 -0.817 1.331
Percentiles 33.33 28.00 27.00 -1.00 31.00 25.00 2.00
66.67 33.00 31.00 5.00 35.00 30.00 9.00
Note: Quotients of Skewness and Std. Error of Skewness as well as of Kurtosis and Std.
Error of Kurtosis also fall within the strict limit value of ±1,96, therefore the more
permissive conditions of normality are fulfilled.
* The smallest is given of the several modes.

Acta Polytechnica Hungarica Vol. 11, No. 4, 2014
– 187 –
As seen from the positive values of difference variables, students specialized in
informatics have a stronger preference for the productive application of what they
have acquired (AE), and even more so with respect to thought and concept
formation (AC), which may also harmonize with the character of the profession. If
these value pairs are compared with those gained at a former test [1], a more
significant difference will appear with respect to AC-CE mostly. To value pairs
(AE-RO;AC-CE) (+1;-2) were added at a former test, whereas (+1;+6) at the
present one. (See Table 1 for median value.) In Kolb's 2005 examination the cut-
points for learning style types were (+6;+7). [7]
Table 2
Test of Normality
Kolmogorov – Smirnova Shapiro – Wilk
Statistic df Sig. Statistic df Sig.
CE 0.081 77 0.200* 0.984 77 0.431
RO 0.093 77 0.094 0.982 77 0.364
AC 0.084 77 0.200* 0.982 77 0.342
AE 0.110 77 0.022 0.978 77 0.217
AE-RO 0.087 77 0.200* 0.979 77 0.220
AC-CE 0.059 77 0.200* 0.987 77 0.638
a. Lilliefors Significance Correction
* This is a lower bound of the true significance.
3.2 Learning Variables Through Time
The comparison of the statistical data of Kolb's learning variables was carried out
according to the cross sectional model for each grade, too. The results partly
coincide with and partly differ from the former ones. [1]
There is no difference from the former test results in the preferred mode of
information processing. The mean values and standard deviation values of AE és
RO variables are similar to the former ones. With the progress of studies a gap
opens, that is the preference difference between the two variables increases.
Standard deviation values are balanced with time (Fig. 1).
In the dimension of the preferred type of information acquisition, perception the
change in the mean as well as the standard deviation values of the variables
through time is also similar to the former change. However, the fact is not
negligible that formerly it was the preference for syllabus acquisition based on
concrete experience (CE) which was stronger than that for abstract
conceptualization, but now the situation is quite the contrary (Fig. 2). This may be
related to the syllabus specialities of the subject of informatics, which reinforces
learning preferences of this type.

P. Tóth The Role of Individual Differences in Learning
– 188 –
31.2
29.9
31.3
28.68
27.39
4.1
5.299 5.0134.798
3.891 3.928
15
17
19
21
23
25
27
29
31
33
35
Year 9 Year 10 Year 11
Means
0
2
4
6
8
10
12
14
Sta
ndard
Devia
tions
AE Mean RO Mean AE Std. Dev. RO Std. Dev.
Figure 1
Means and standard deviations of learning variables I
33.57
32.4433.24
27.7427.6427.97
3.4233.917
5.566 5.2934.8725.571
15
17
19
21
23
25
27
29
31
33
35
Year 9 Year 10 Year 11
Me
an
s
0
1
2
3
4
5
6
7
8
9
10
11
12
13
14
15
Sta
nd
ard
De
via
tio
ns
AC Mean CE Mean AC Std. Dev. CE Std. Dev.
Figure 2
Means and standard deviations of learning variables II
AC and CE variables hardly change through time and may be considered
attitudinal, whereas the same cannot be stated of AE and RO variables.
Tests of normality were performed for learning variables as well as difference
variables in each grade, too.

Acta Polytechnica Hungarica Vol. 11, No. 4, 2014
– 189 –
The results show that in grade 9 conditions of normality are fulfilled for all
variables while in grade 11 for almost none. From this the conclusion is to be
drawn that balanced distributions still present in grade 9 tend to polarize in higher
grades.
An analysis of variance was also carried out with the purpose of examining how
learning preferences change with the progress of studies. As seen earlier, a
precondition for variance analysis, the normal distribution of the learning
variables, is fulfilled whereas the second condition, that is the homogeneity of
variance, is justified by Levene-test, therefore there is no objection to performing
an analysis of variance.
The results justify the former statements according to which the averages of
variables AC and CE do not show a significant difference, while those of RO do,
that is the role in the learning process of reflective observation and understanding
(RO) changes (decreases) with the progress of studies, while that of active
experimentation or productive application (AE) slightly increases.
Scheffe's a priori contrast test also throws some light on which grades' averages
within a category have a significant or no deviation (p<0.05). The results prove
that with respect to variable RO grades 9 and 11 show most deviations.
Finally the change through time of difference variables was examined with the
progress of studies. Difference between these variables is seen to decrease
significantly with students specializing in informatics in higher grades. It is all
attributable to the increase in AE preference at the cost of RO, which means that
practical application continuously gains dominance over reflective observation,
the multi-aspectual examination of things and the search for their meaning. In its
background it may be found that there is an increased number of practical courses
such as for example computer programming or data base management in higher
grades. Among the requirements for the development of the general education
plan of the training is the improvement of students' skills at and familiarity with
- writing, running and testing the source code aiming at the solution of the
algorithm designed by them,
- the conscious application of programming items,
- problem solving in the various programming environments,
- the creation of data tables, relation formation and normalization,
- the application of the basic elements of data base management systems,
- generating queries.
These syllabuses certainly offer a favourable opportunity for active
experimentation, the application of skills in new situations which require different
learning methods of students, in other words the preferred information processing
methods alters.

P. Tóth The Role of Individual Differences in Learning
– 190 –
3.3 The Problem of Defining Learning Style
The definition of learning styles was done on the basis of both Kolb's original
values [8] and those of our own cut-points for learning style types. 72.73% of
students (56 persons) did not change their learning style type. Of the remaining 21
students 12 shifted from the accommodator learning style to the diverger one, 4
from converger to assimilator, 3 from converger to accommodator and 2 from
assimilator to diverger. In these cases the (AE-RO;AC-CE) value pairs apparently
approximated an axis. Table 3 suggests that the converger style seems to be the
most insensitive and the diverger style the most sensitive one to define the cut-
points for learning style types. All the students classified as converger on the basis
of our own results was ranked the same style according to Kolb's cut-points, too.
The ranking of 41.18% of diverger students would change on the basis of the
original Kolb's cut-points.
Table 3
Change in learning style classification
Classification of learning styles (own, 2013)
Converger Accommodator Assimilator Diverger
Lea
rnin
g
sty
le [
7]
Converger 10 0 0 0
Accommodator 3 8 0 0
Assimilator 4 0 18 0
Diverger 0 12 2 20
It was showed by Pearson Chi-square test (p<0.05) that the two types of learning
styles classification significantly correlated with each other (χ2=116.447; df=9)
and the Kolb's and my own classification coincide by the 63.2% of certainty
(λ=0.632, p<0.01).
The classification of learning styles – based on our own value pair (+1;+6) – was
compared according to grades as well (Figures 3-4). It is to be said that with the
progress of studies the proportion of converger students significantly increases
while that of assimilators, and even more of divergers, decreases.
The converger student is a real technical professional, who prefers logical thought
of which he makes most in performing activities of a practical sort. He uses data
founded on practical and tangible experience in order to construct his own system
of skills and information. In his judgements he relies only on concrete facts and is
not too keen on uncertain and inaccurate information. Being a „decision-maker”,
he enjoys problem situations. He is able to focus on the solution of problems by
first thinking them over and then solving them. He is characterized by deductive
thought, that is he readily applies the general skills, laws and rules to particular
situations during problem solving. He is a pragmatist, with a narrow scope of
interests and less flexible thought than that of his diverger companion. In case of
the overwhelming dominance of this learning style (there were altogether 3

Acta Polytechnica Hungarica Vol. 11, No. 4, 2014
– 191 –
students of this kind) he often makes unfounded and hasty decisions and makes a
mistake in the interpretation of the problem situation at hand. However, in a
contrary situation, he is unable to concentrate on and solve a problem or
adequately check his own ideas.
-16-14-12-10 -8 -6 -4 -2 0 2 4 6 8 10 12 14 16 18 20 22 24 26
AE-RO
-20
-16
-12
-8
-4
0
4
8
12
16
20
24
28
32
AC
-CE
Year
9
10
11
Assimilator
Accommodator
Converger
Diverger
Figure 3
The classification of learning styles according to grades I
As seen from the above, students' learning style shifted in the direction mostly
according to the specialities and requirements of subjects. Since learning style is
an individual characteristic, a longitudinal examination would be even more
precise in showing how this change took place from student to student. If this was
reinforced, the stable and attitudinal personality indicator property of learning
style could by all means be declared false.

P. Tóth The Role of Individual Differences in Learning
– 192 –
0%
10%
20%
30%
40%
50%
60%
70%
80%
90%
100%
Year 9 Year 10 Year 11
Converger Accommodator Assimilator Diverger
Figure 4
The classification of learning styles according to grades II
Figure 5
Learning styles in the nine-region model
Acta Polytechnica Hungarica Vol. 11, No. 4, 2014
– 193 –
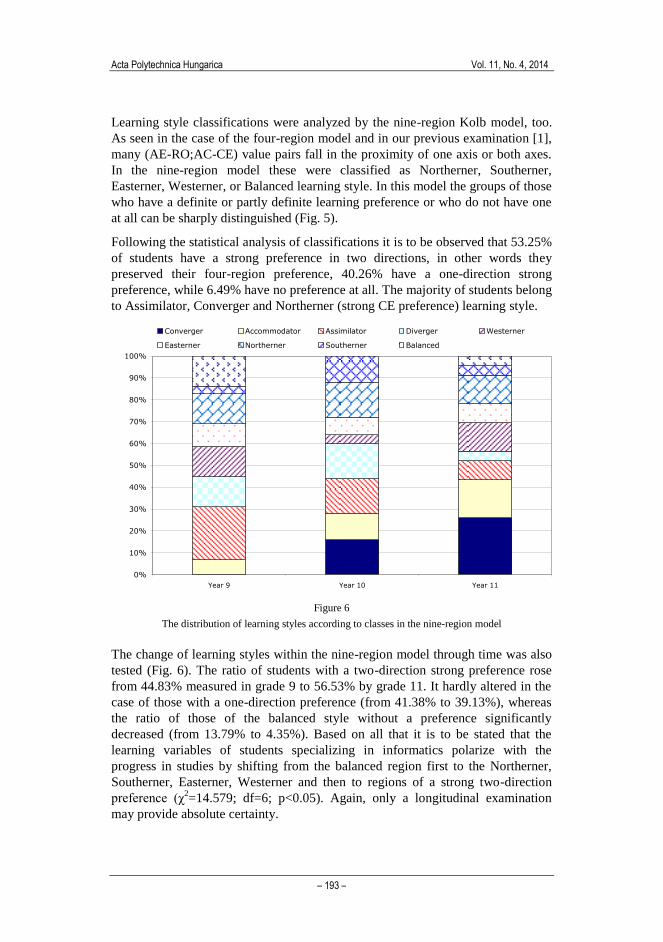
Learning style classifications were analyzed by the nine-region Kolb model, too.
As seen in the case of the four-region model and in our previous examination [1],
many (AE-RO;AC-CE) value pairs fall in the proximity of one axis or both axes.
In the nine-region model these were classified as Northerner, Southerner,
Easterner, Westerner, or Balanced learning style. In this model the groups of those
who have a definite or partly definite learning preference or who do not have one
at all can be sharply distinguished (Fig. 5).
Following the statistical analysis of classifications it is to be observed that 53.25%
of students have a strong preference in two directions, in other words they
preserved their four-region preference, 40.26% have a one-direction strong
preference, while 6.49% have no preference at all. The majority of students belong
to Assimilator, Converger and Northerner (strong CE preference) learning style.
0%
10%
20%
30%
40%
50%
60%
70%
80%
90%
100%
Year 9 Year 10 Year 11
Converger Accommodator Assimilator Diverger Westerner
Easterner Northerner Southerner Balanced
Figure 6
The distribution of learning styles according to classes in the nine-region model
The change of learning styles within the nine-region model through time was also
tested (Fig. 6). The ratio of students with a two-direction strong preference rose
from 44.83% measured in grade 9 to 56.53% by grade 11. It hardly altered in the
case of those with a one-direction preference (from 41.38% to 39.13%), whereas
the ratio of those of the balanced style without a preference significantly
decreased (from 13.79% to 4.35%). Based on all that it is to be stated that the
learning variables of students specializing in informatics polarize with the
progress in studies by shifting from the balanced region first to the Northerner,
Southerner, Easterner, Westerner and then to regions of a strong two-direction
preference (χ2=14.579; df=6; p<0.05). Again, only a longitudinal examination
may provide absolute certainty.

P. Tóth The Role of Individual Differences in Learning
– 194 –
In Fig. 7 the percentage distribution of our results in the nine-region model were
compared with the results of the research Kolb did among 288 first-grade
university students. [8] As can clearly be seen from the figure, with the exception
of students of the Assimilator and Converger style, there are significant
differences to be depicted. The results of 1286 MBA and 216 arts students in
higher education were also published. [8] Our results tend to approximate those in
the further regions.
Conclusions
In the course of our research among students specializing in informatics a latest
version of Kolb's questionnaire for the empirical learning-model was tested (LSI
3.1). Making use of the results of our former longitudinal examination three
hypotheses and one question were formed at the beginning of the research, the
answers to which are given below.
H1. Learning variables in both dimensions are not normally distributed (students
specializing in informatics have general preferences) and form a bipolar system.
Taking all students into consideration – in contrast to the results of the former
longitudinal examination [1] – Kolb's learning variables follow a normal
distribution, in other words, no speciality or preference generally typical of the
group is to be observed. Normality is supported by Skewness, Kurtosis as well
as the quotients of their faults together with the Kolmogorov – Szmirnov test.
The situation is, however, different if the various variables are compared in the
individual grades. In grade 9 almost all variables follow a changeable
normality distribution, while in year 11 almost none of them do. From this the
conclusion is to be drawn that with the progress of studies polarization is more
significant, that is the distinguished role of particular learning phases increases
in number.
H2. In the dimension of preferred information type and information acquisition,
perception the learning variables act similarly to attitudes. In this dimension the
preferred learning variable is experience acquisition based on concrete
experiences.
In the dimension of preferred information type and information acquisition,
perception the mean values of the abstract conceptualization (AC) and
concrete experience (CE) variables hardly change beside decreasing deviation
values between grades 9 and 11, in other words, these two variables are to be
regarded attitudinal. It is mainly the change in the mean values of CE that is
minimal. The change through time of the results is greatly similar to that of
former research.
However, there is considerable deviation in the (AC, CE) preference of these
two variables. In this dimension students who participated in the earlier
examination had a preference for experience acquisition, while those in the

Acta Polytechnica Hungarica Vol. 11, No. 4, 2014
– 195 –
present research preferred conceptualization and thought. If in both cases focus
falls only on students of informatics, deviation will be similar. To explore the
causes of this phenomenon it may be useful to have the same students fill in
both questionnaires and then, following the evaluation of the results, the
accuracy of either questionnaire is to be checked, too.
Note: Kolb and Kolb's results appear in brackets. First-grade students' in round brackets
and arts students' in square ones. [8]
Figure 7
The comparison of learning styles in the nine-region model
H3. In the dimension of preferred information processing learning variables vary
in a different way with a progress in studies. Productive application and
experimentation is a preferred learning variable.
In the dimension of information processing the mean values of the reflective
observation (RO) and active experimentation (AE) variables beside a slight
change in distribution show variations with the progress of studies. RO values
decrease, AE values increase, the mean values of the two variables deviate, the
two lines produce a gap between them, that is the variables of this dimension
do not show attitudinal tendencies.
Productive application and experimentation are increasingly becoming the
decisive elements of the learning process with the progress in studies. The
P. Tóth The Role of Individual Differences in Learning
– 196 –
behaviour of the variables of this dimension correspond to that seen in our
former examination.
Q1. How does the ranking of learning style change with the progress in studies?
Can any characteristic realignment or move be observed?
With the progress in studies the ratio of converger learning style students
significantly increases whereas that of assimilator and diverger learning style
students decreases. This is in agreement with Kolb's classification of the
informatics profession, since the characteristics of converger students are the
most suitable for studying this area.
Therefore the learning style of students moves in the direction most
appropriate for subject specialities and requirements. Learning style is an
individual characteristic, so it would take a longitudinal test to show how it
varies from student to student. If this was reinforced, the stable and attitudinal
personality indicator property of learning style could by all means be declared
false.
Analyzing classifications in the nine-region model it is to be seen that more
than 50% of students have a two-direction strong preference while almost 40%
has a single-direction and approximately 10% has no preference at all.
In summary it is to be said that H1 is not at all, H2 is partly, while H3 is
completely fulfilled, therefore the following theses are stated.
In the dimension of preferred information acquisition, perception learning
variables are attitudinal.
In the dimension of preferred information processing learning variables
(productive application, experimentation and reflective observation) vary with the
progress in studies. Productive application and experimentation are a preferred
learning variable.
References
[1] Tóth, P.: Learning Strategies and Styles in Vocational Education. Acta
Polytechnica Hungarica, Vol. 9, No. 3, 2012, pp. 195-216
[2] Coffield, F. – Moseley, D. – Hall, E. – Ecclestone, K.: Learning Styles and
Pedagogy in Post-16 Learning: A Systematic and Critical Review.
Cromwell Press, Trowbridge, 2004, p. 165
[3] Kolb, D.A. – Fry, R.: Toward an Applied Theory of Experiential Learning.
In: Cooper, C.L. (ed.) Theories of Group Processes. John Wiley, London,
1975, p. 277
[4] Honey, P. – Mumford, A.: The Learning Styles Helper’s Guide. Peter
Honey Publications, Maidenhead, 2000, p. 70

Acta Polytechnica Hungarica Vol. 11, No. 4, 2014
– 197 –
[5] McCarthy, B.: Using the 4MAT System to Bring Learning Styles to
Schools. Educational Leadership, Vol. 48, No. 2, 1990, pp. 31-37
[6] Kolb, D. A.: The Process of Experimental Learning. In: Kolb, D. A. (ed.)
The Experiential Learning: Experience as the Source of Learning and
Development. Prentice-Hall, Englewood Cliffs, 1984, p. 288
[7] Kolb, D. A. – Kolb, A. Y.: The Kolb Learning Style Inventory – Version
3.1. 2005 Technical Specifications, HayGroup, Boston, 2005, p. 72
[8] Kolb, D. A. – Kolb, A. Y.: Learning Styles and Learning Spaces:
Enhancing Experiential Learning in Higher Education. Academy of
Management Learning and Education, Vol. 4, No. 2, 2005, pp. 193-212
[9] Kolb, D. A.: LSI Learning Style Inventory: Self Scoring Inventory and
Interpretation Booklet. McBer and Company, Boston, 1985, p. 13
[10] Ősz, R. – Róbert, K.: The Use of Animations in Teaching Technical
Drawing. In: Szakál, A. (Ed.): Proceedings of the 7th
IEEE International
Symposium on Applied Computational Intelligence and Informatics,
Timisoara, 2012, pp. 311-314


![Individual Differences [Recovered]](https://img.pdfslide.net/doc/110x75/5695d4621a28ab9b02a147e9/individual-differences-recovered.jpg)