Embed Size (px)
Citation preview

The Toyota Case Study
Examining the Manufacturing Company’s
Impact on Growth and Development in
Scott County, Kentucky
Erran F. Persley
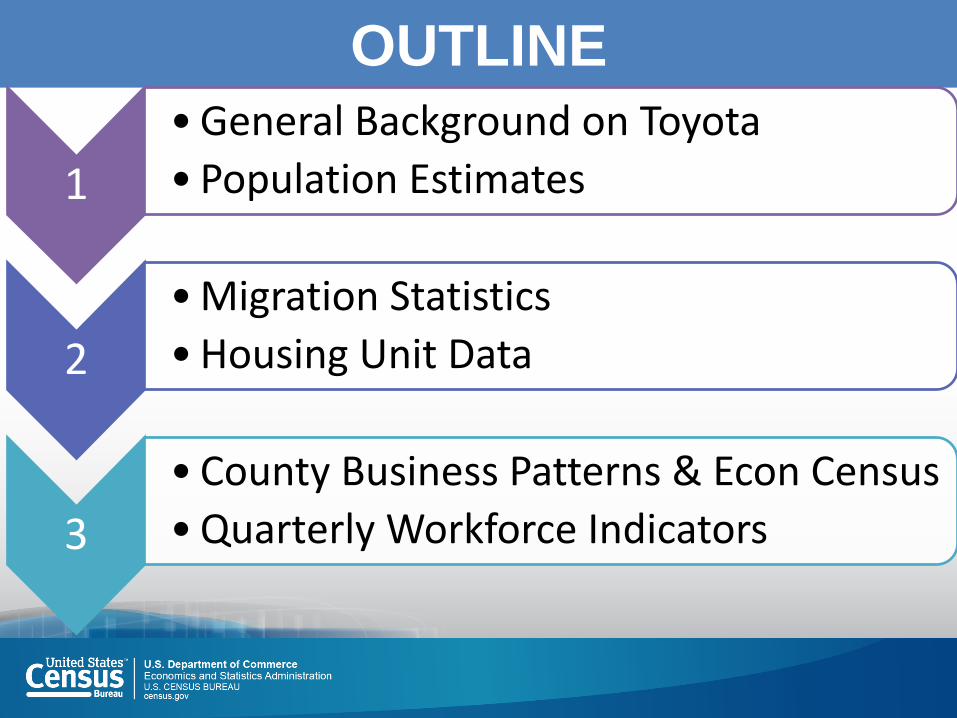
OUTLINE
1
• General Background on Toyota
• Population Estimates
2
• Migration Statistics
• Housing Unit Data
3
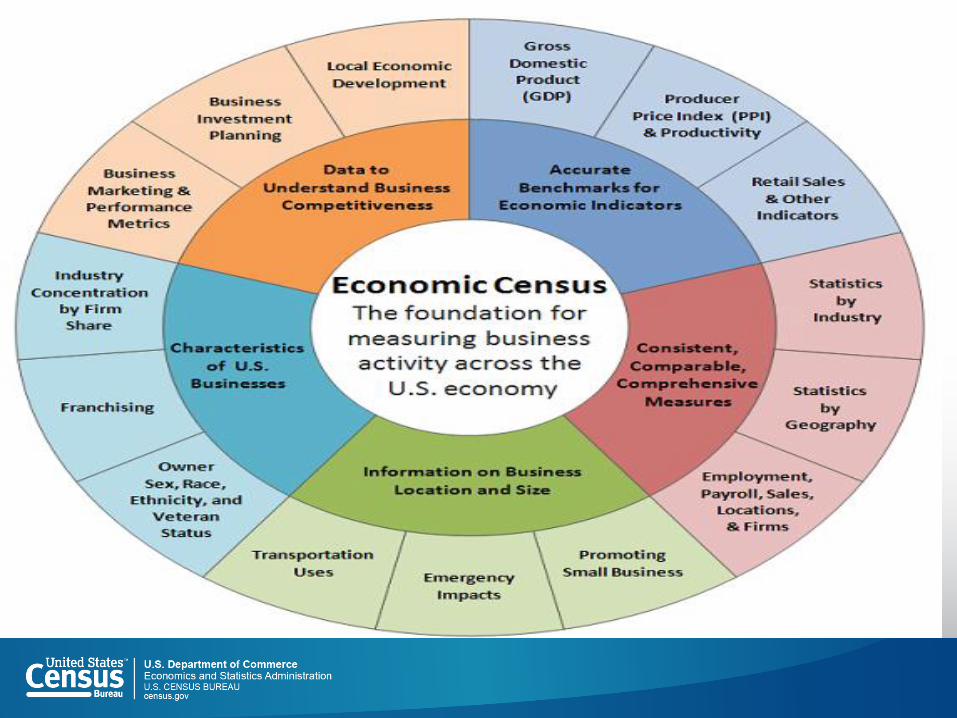
• County Business Patterns & Econ Census
• Quarterly Workforce Indicators
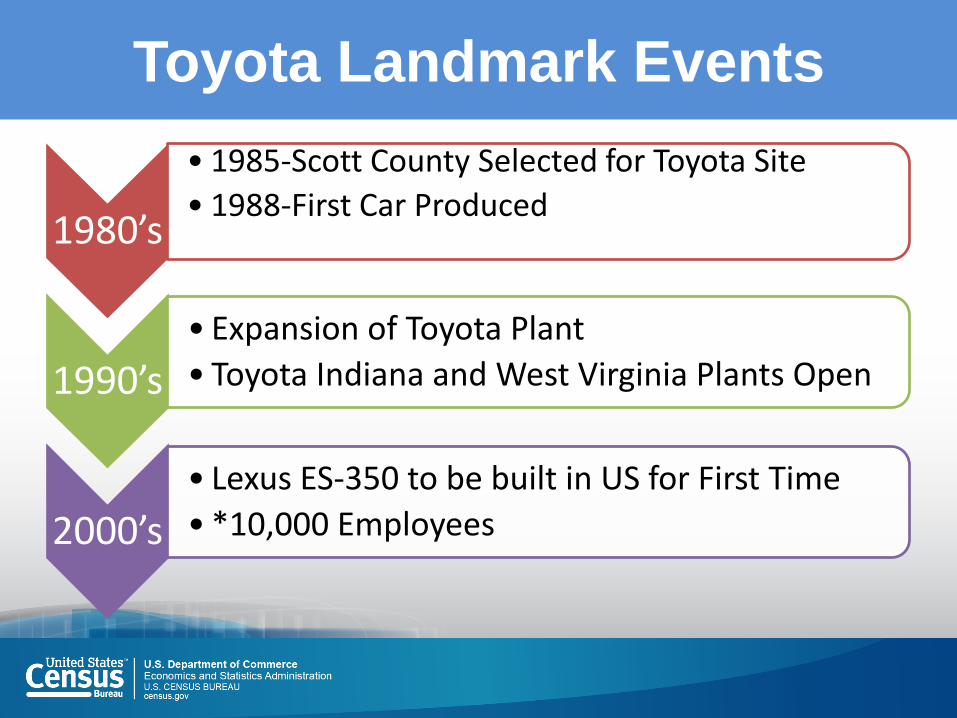
Toyota Landmark Events
1980’s
• 1985-Scott County Selected for Toyota Site
• 1988-First Car Produced
1990’s
• Expansion of Toyota Plant
• Toyota Indiana and West Virginia Plants Open
2000’s
• Lexus ES-350 to be built in US for First Time
• *10,000 Employees
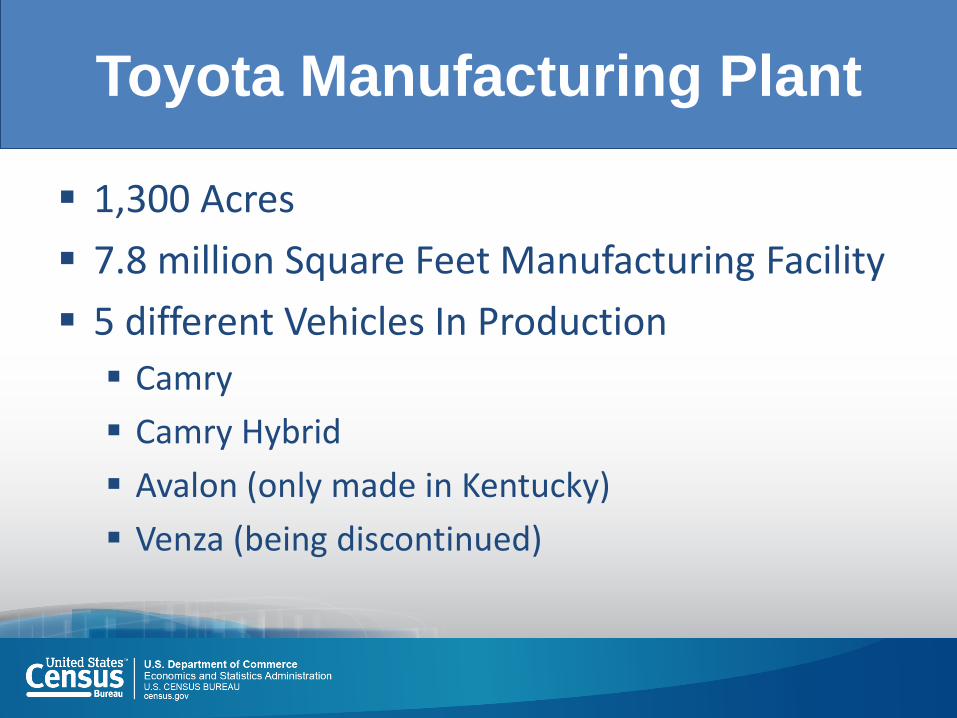
Toyota Manufacturing Plant
1,300 Acres
7.8 million Square Feet Manufacturing Facility
5 different Vehicles In Production
Camry
Camry Hybrid
Avalon (only made in Kentucky)
Venza (being discontinued)
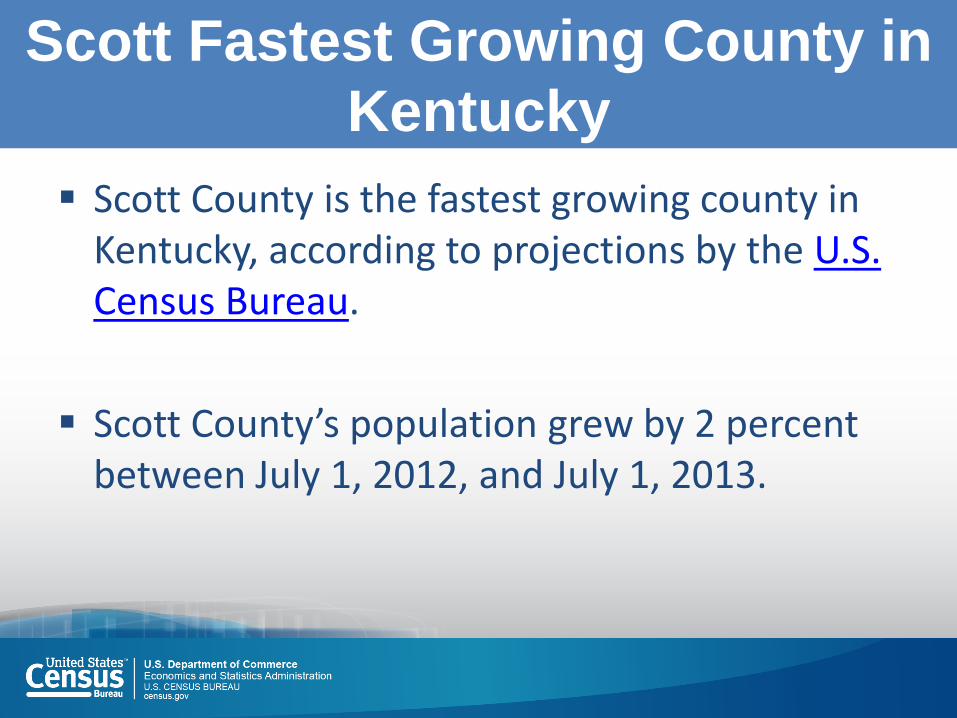
Scott Fastest Growing County in
Kentucky
Scott County is the fastest growing county in Kentucky, according to projections by the U.S. Census Bureau.
Scott County’s population grew by 2 percent between July 1, 2012, and July 1, 2013.
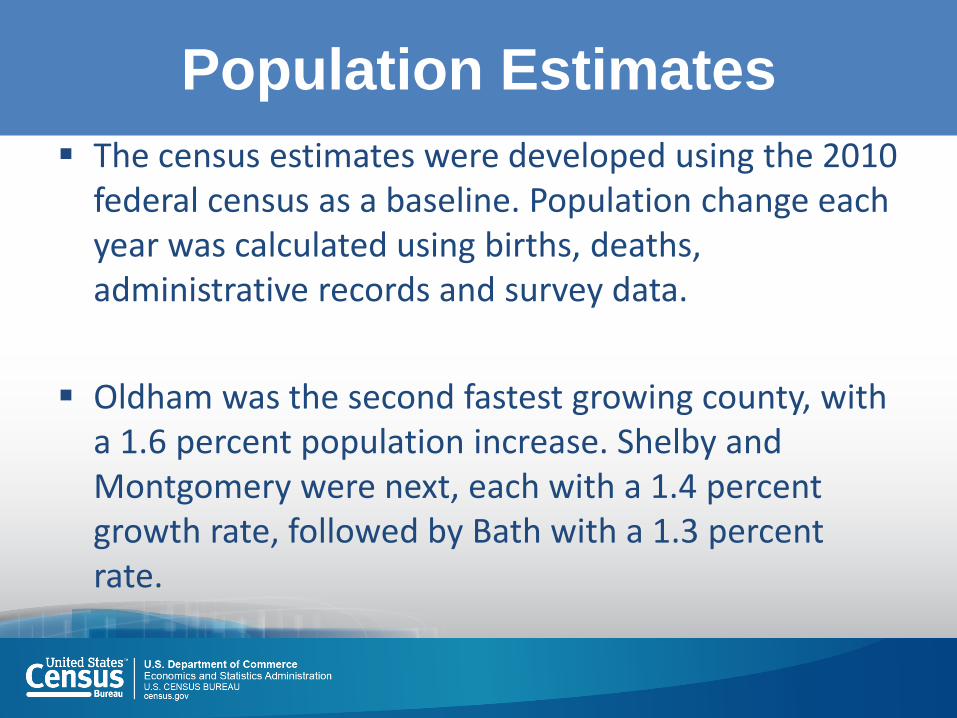
Population Estimates
The census estimates were developed using the 2010 federal census as a baseline. Population change each year was calculated using births, deaths, administrative records and survey data.
Oldham was the second fastest growing county, with a 1.6 percent population increase. Shelby and Montgomery were next, each with a 1.4 percent growth rate, followed by Bath with a 1.3 percent rate.
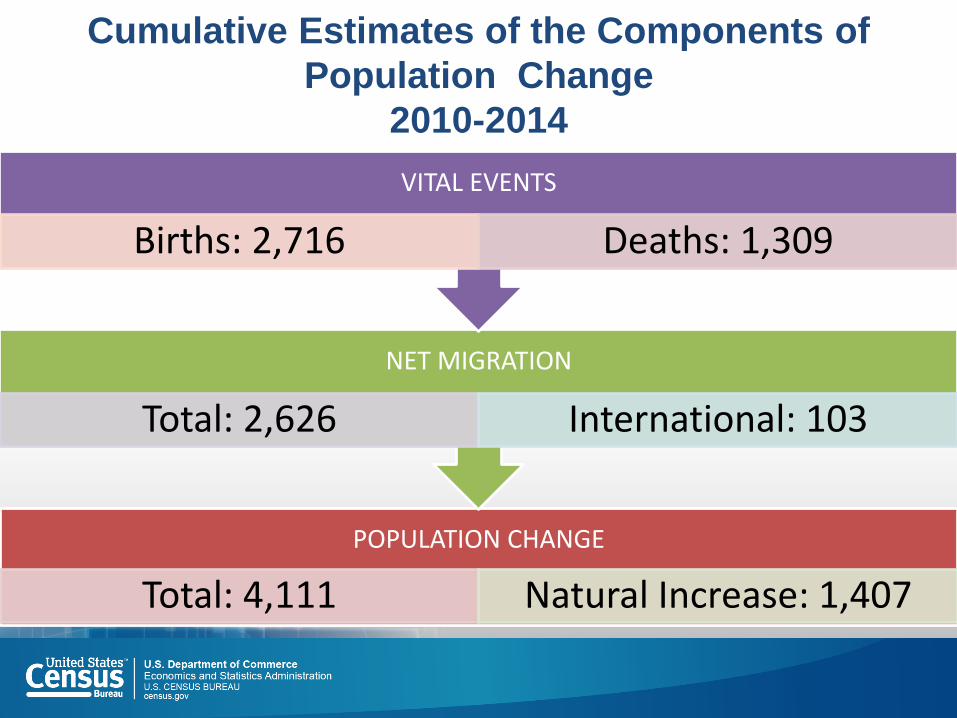
Cumulative Estimates of the Components of
Population Change
2010-2014
POPULATION CHANGE
Total: 4,111 Natural Increase: 1,407
NET MIGRATION
Total: 2,626 International: 103
VITAL EVENTS
Births: 2,716 Deaths: 1,309

American Fact Finder
Population Estimates
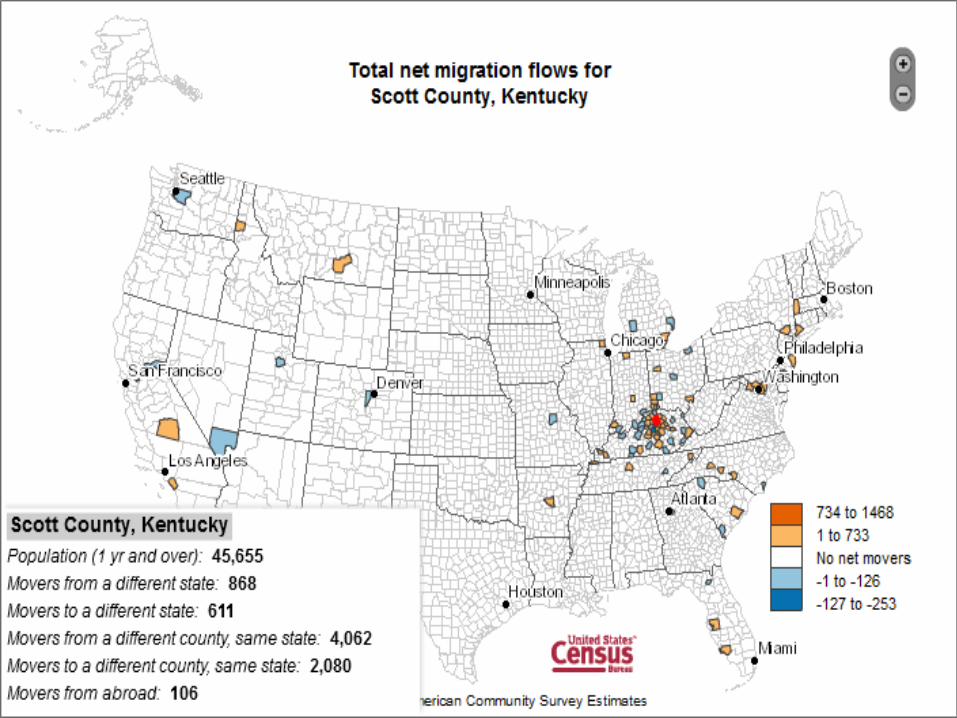
Census Flows Mapper
http://flowsmapper.geo.census.gov/flowsmapper/flowsmapper.html
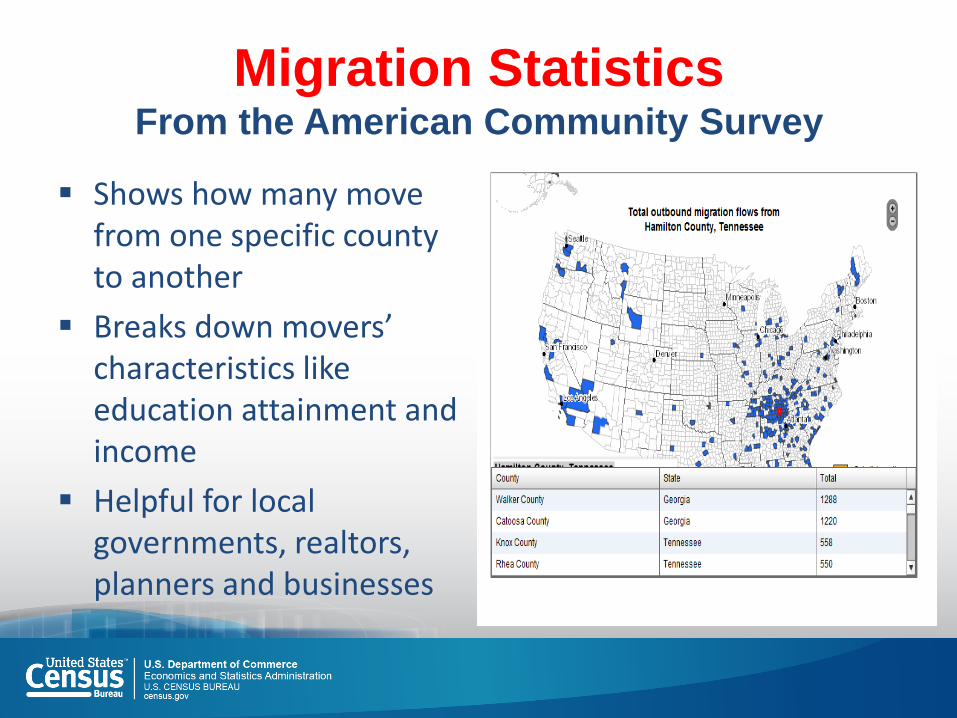
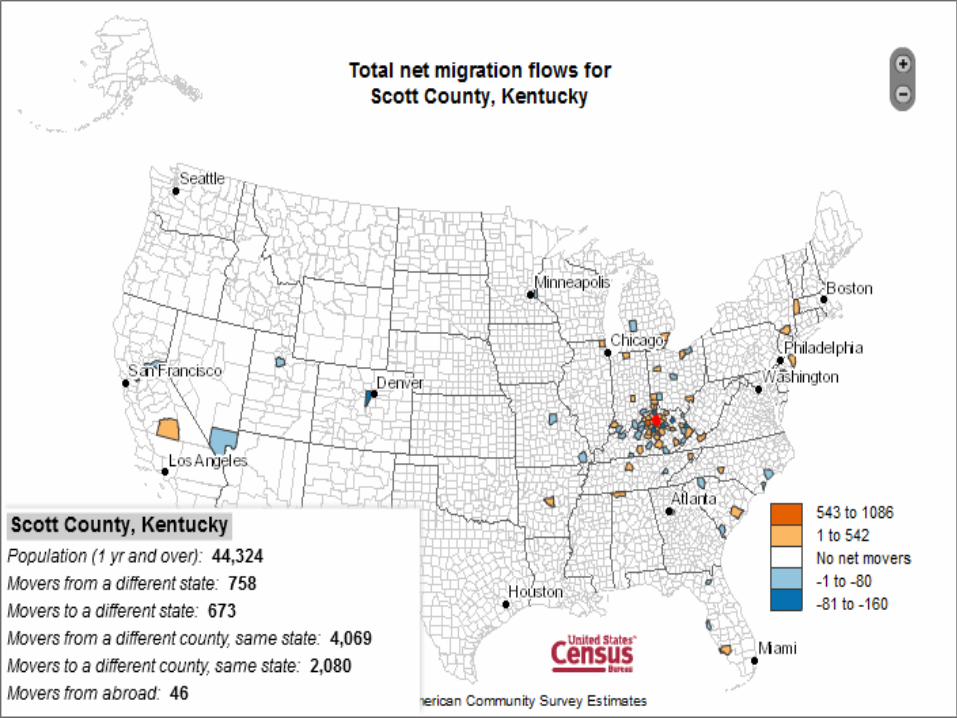
Migration Statistics From the American Community Survey
Shows how many move from one specific county to another
Breaks down movers’ characteristics like education attainment and income
Helpful for local governments, realtors, planners and businesses
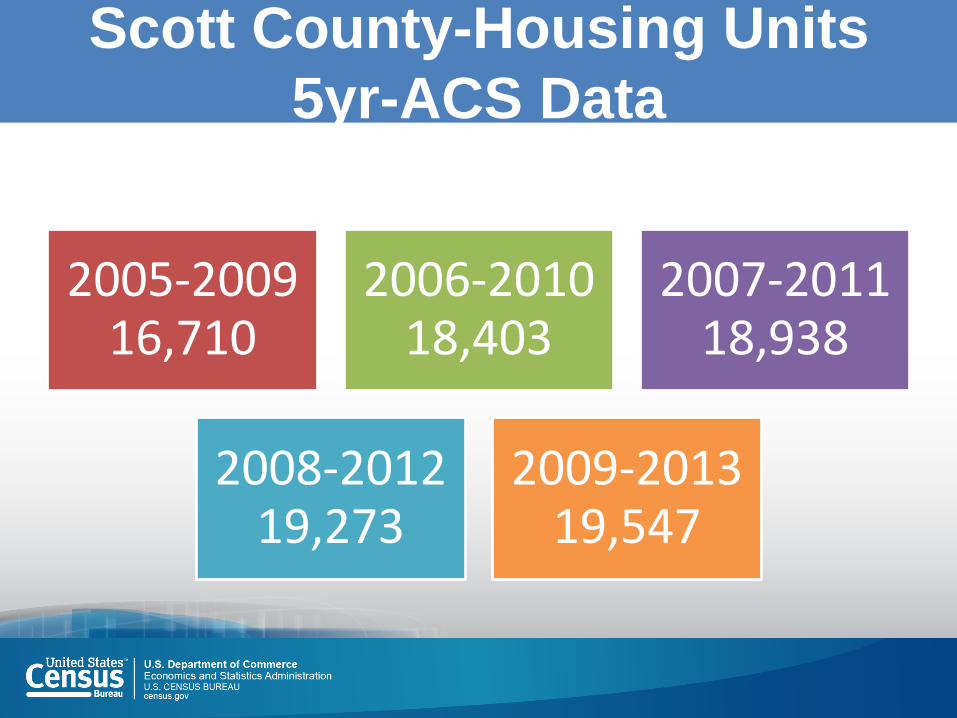
Scott County-Housing Units
5yr-ACS Data
2005-2009 16,710
2006-2010 18,403
2007-2011 18,938
2008-2012 19,273
2009-2013 19,547
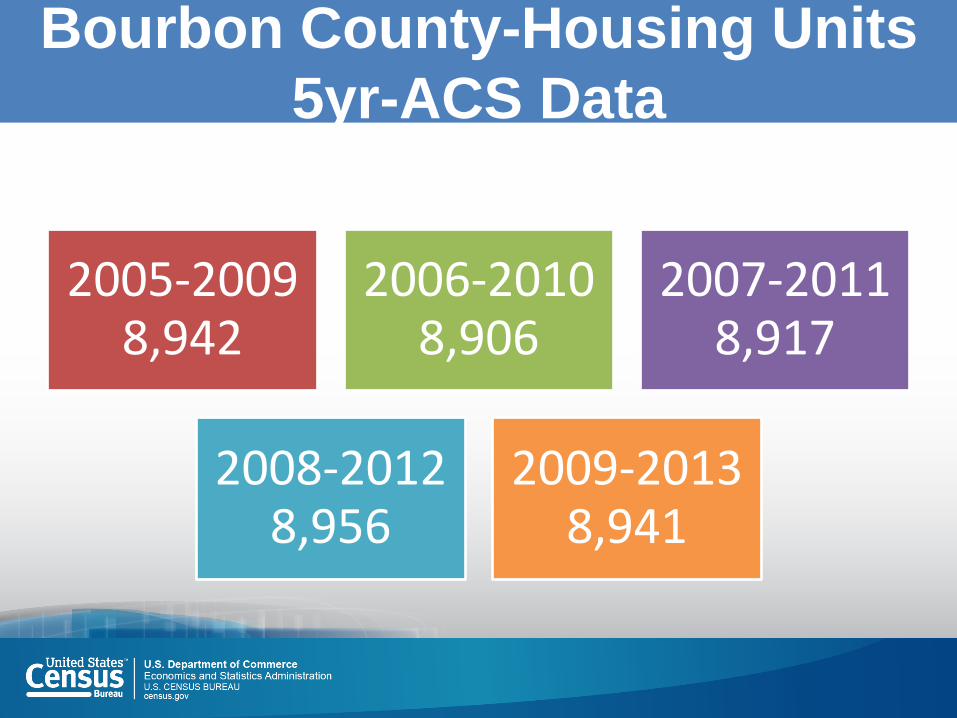
Bourbon County-Housing Units
5yr-ACS Data
2005-2009 8,942
2006-2010 8,906
2007-2011 8,917
2008-2012 8,956
2009-2013 8,941
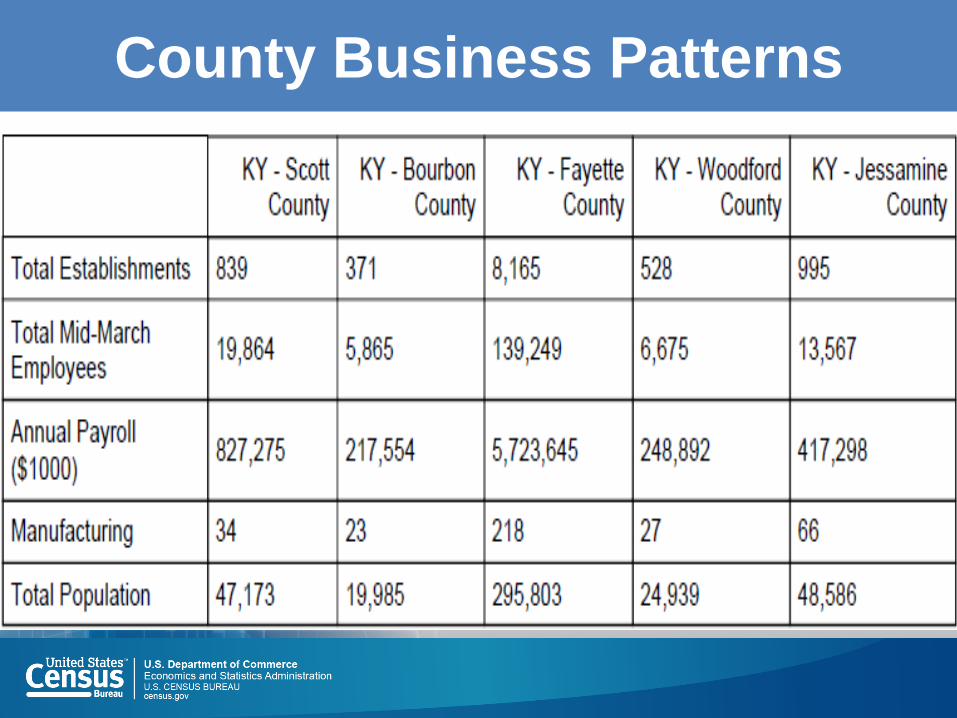
County Business Patterns

Quarterly Workforce Indicator Tool (QWI)
Erran F. Persley
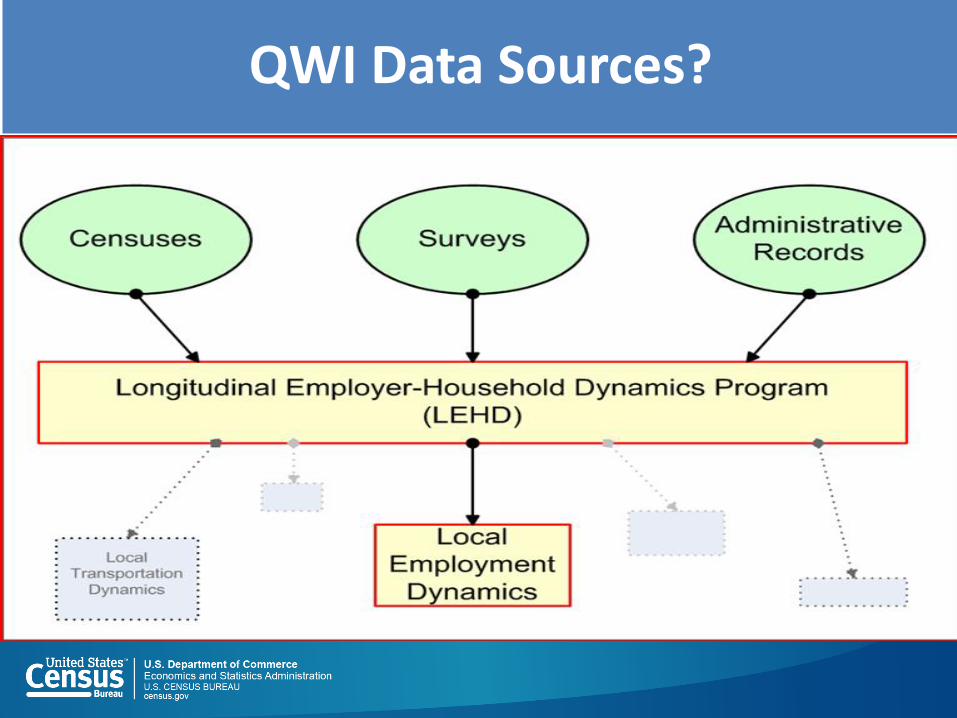
QWI Data Sources?
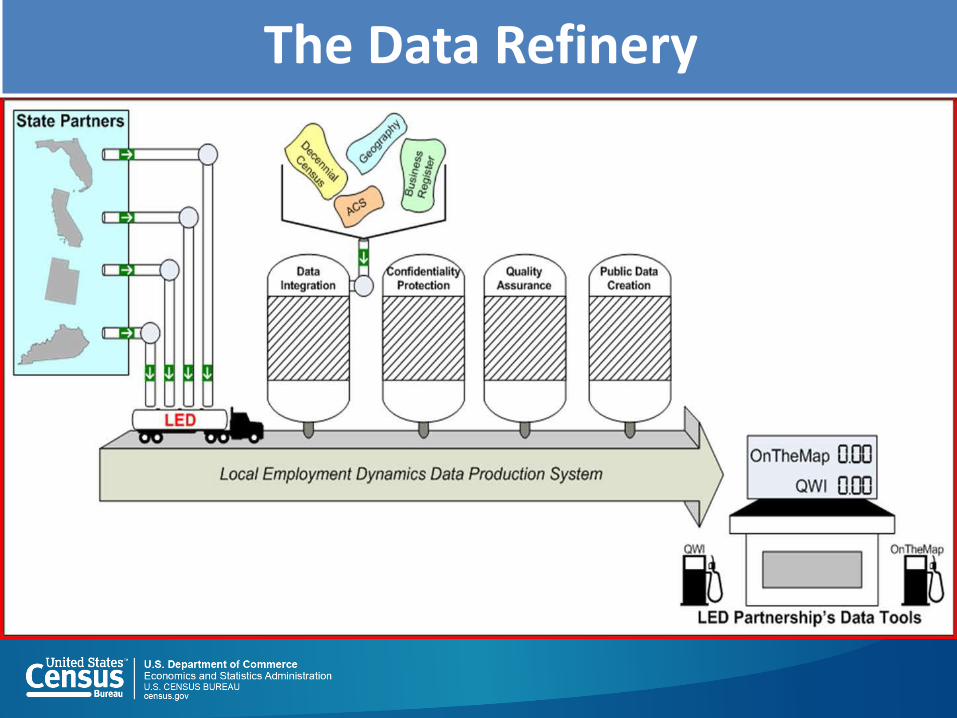
The Data Refinery

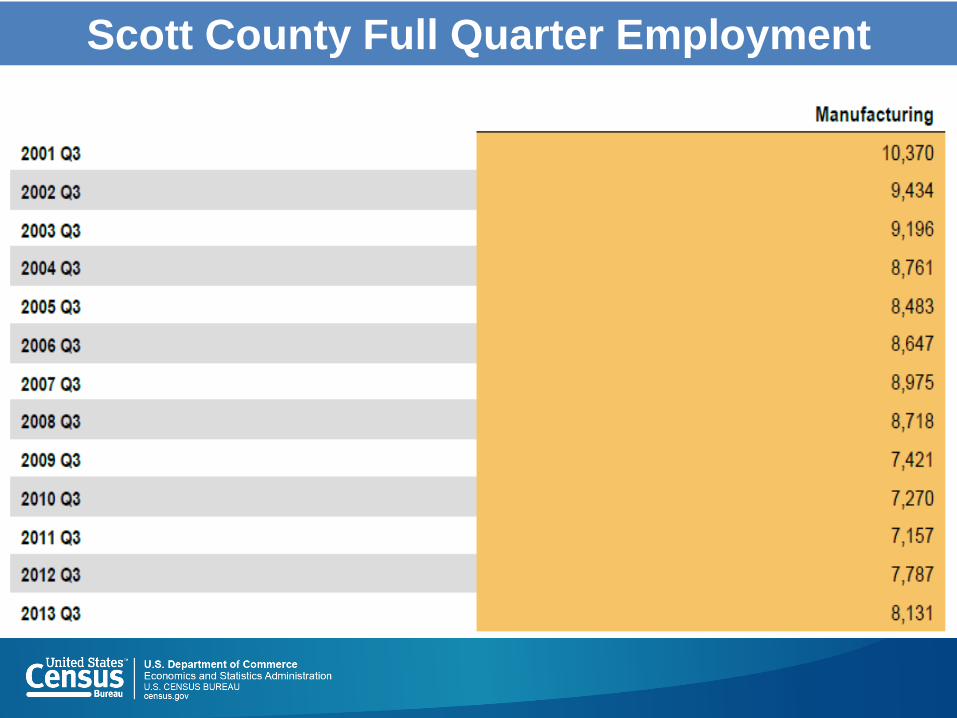
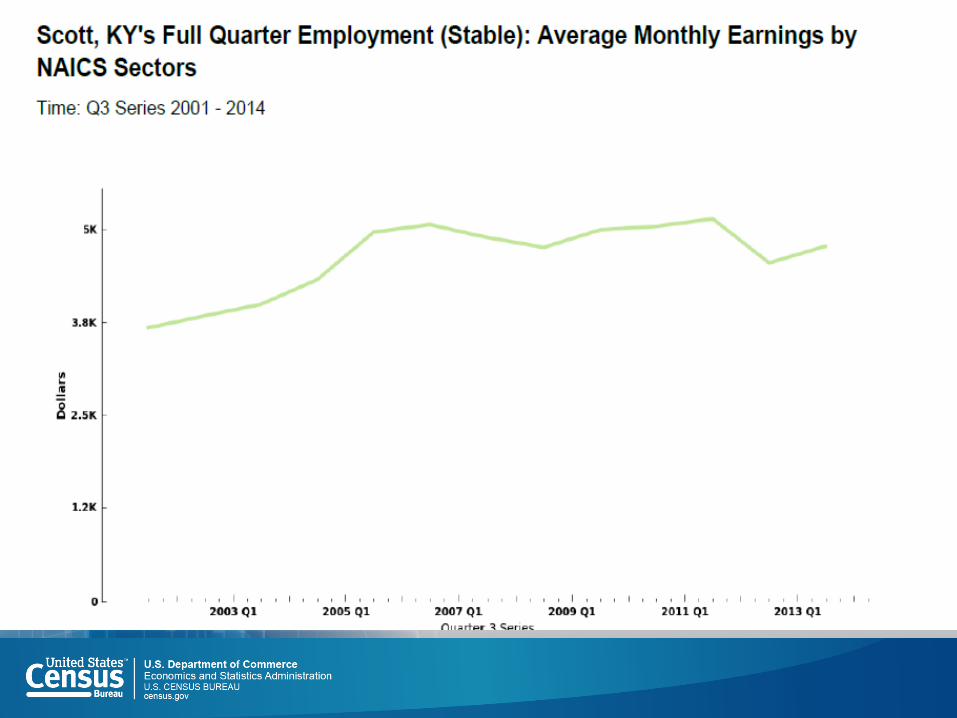
Scott County Full Quarter Employment
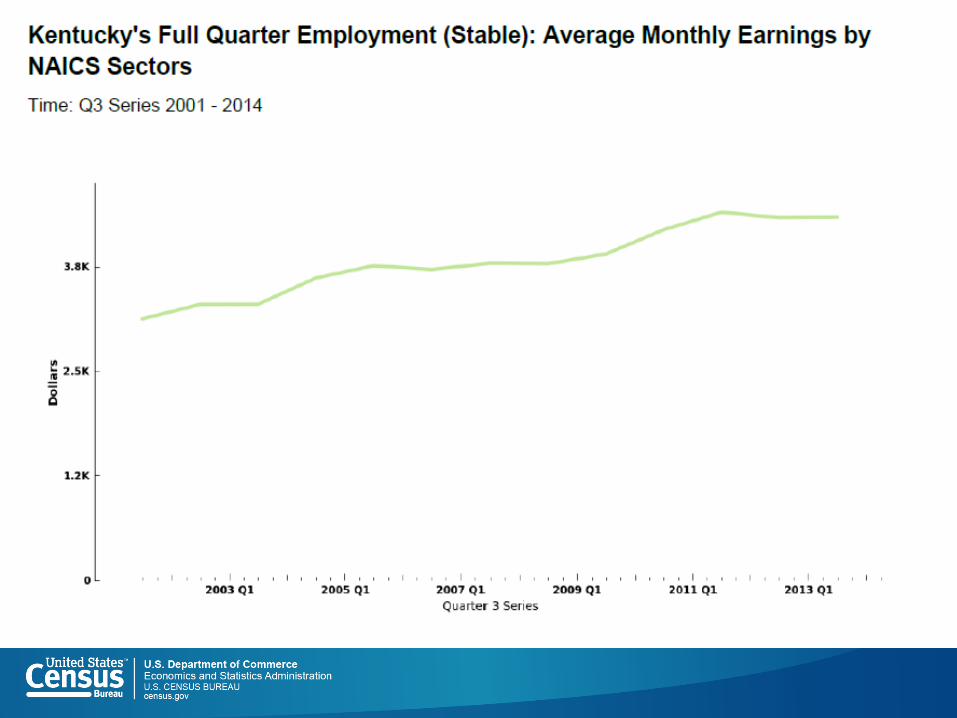
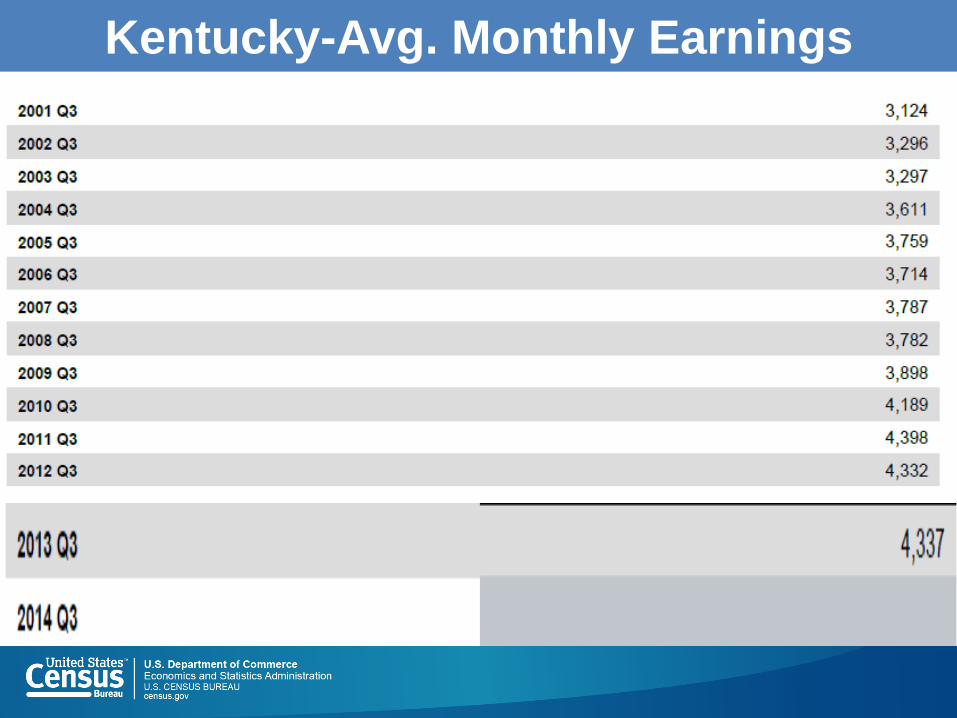
Kentucky-Avg. Monthly Earnings
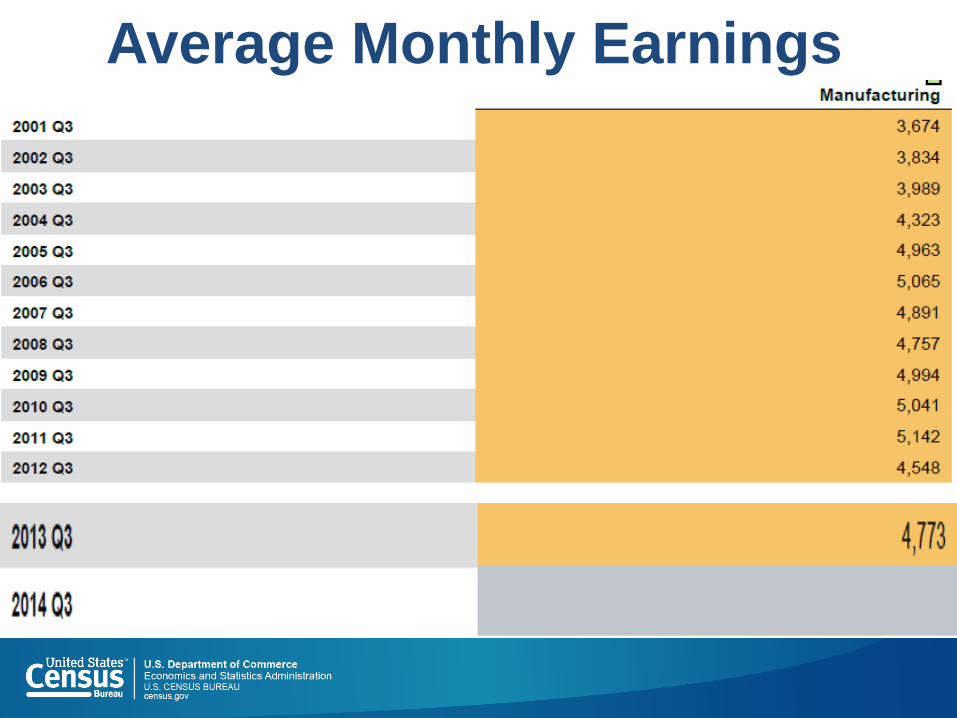
Average Monthly Earnings

Let’s Go On-line…
http://qwiexplorer.ces.census.gov/

Erran F. Persley Email: [email protected] Mobile: 615.499.0976