Embed Size (px)
Citation preview
EF
OR
E A
NN
UA
L R
EP
OR
T 20
15
THE TRUSTED POWER PARTNER
ANNUAL REPORT 2015
CONTENTS
EFORE GROUP
EFORE IN BRIEF 1
REVIEW BY THE PRESIDENT AND CEO 2
FINANCIAL YEAR 2015 IN BRIEF 4
EFORE MISSION AND VISION 6
STRATEGIC PLAN 2015–2018 7
MARKET AND PRODUCT OFFERING 8
RESPONSIBILITY
CORPORATE RESPONSIBILITY AN INTEGRAL PART OF ALL OPERATIONS 10
FINANCIAL STATEMENTS
REPORT OF THE BOARD OF DIRECTORS 14
CONSOLIDATED INCOME STATEMENT 19
CONSOLIDATED BALANCE SHEET 20
CONSOLIDATED CASH FLOW STATEMENT 22
CONSOLIDATED STATEMENT OF CHANGES IN EQUITY 23
NOTES TO THE CONSOLIDATED FINANCIAL STATEMENTS 24
INCOME STATEMENT FOR THE PARENT COMPANY 53
BALANCE SHEET FOR THE PARENT COMPANY 54
CASH FLOW STATEMENT FOR THE PARENT COMPANY 56
ACCOUNTING POLICIES FOR THE FINANCIAL STATEMENTS OF PARENT COMPANY 57
NOTES TO THE FINANCIAL STATEMENTS, PARENT COMPANY 58
GROUP KEY FIGURES 64
CALCULATION OF KEY FIGURES AND RATIOS 67
SHARES AND SHAREHOLDERS 68
SIGNATURES FOR THE FINANCIAL STATEMENTS AND THE REPORT BY THE BOARD OF DIRECTORS 73
AUDITOR’S REPORT 74
CORPORATE GOVERNANCE
CORPORATE GOVERNANCE STATEMENT 75
BOARD OF DIRECTORS 78
EXECUTIVE MANAGEMENT TEAM 80
INFORMATION FOR SHAREHOLDERS 82
CONTACT DETAILS 83
EFORE ANNUAL REPORT 2015
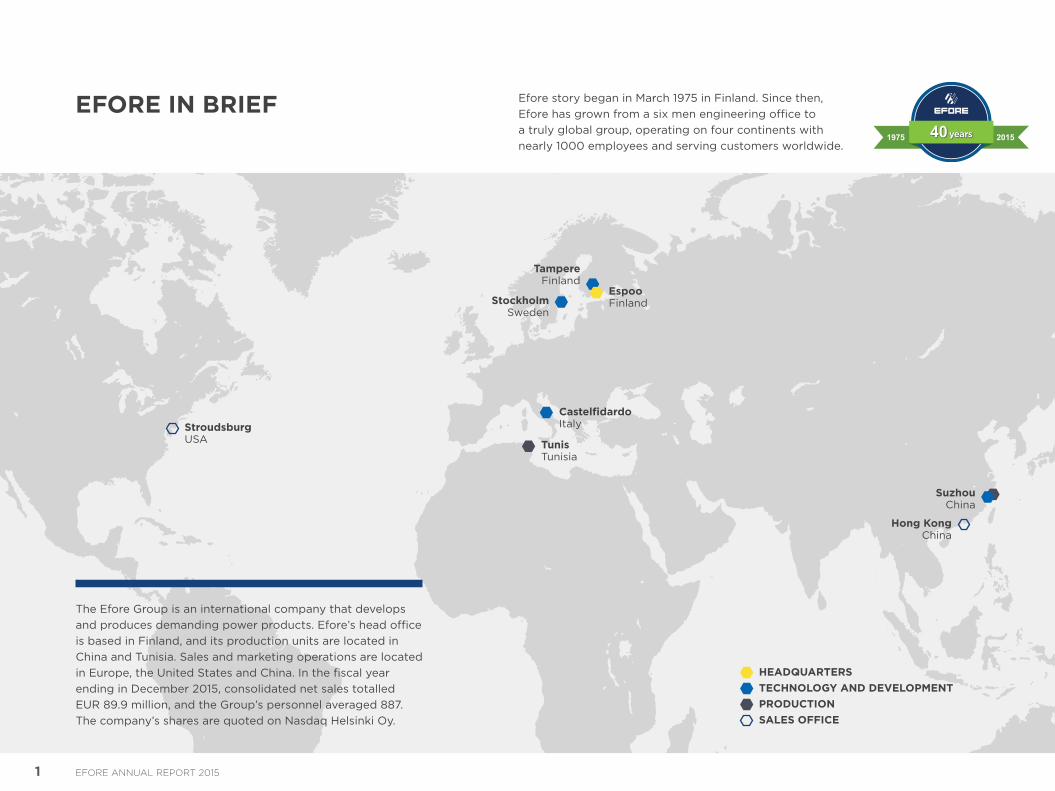
EspooFinland
CastelfidardoItaly
TunisTunisia
StroudsburgUSA
TampereFinland
StockholmSweden
SuzhouChina
Hong KongChina
The Efore Group is an international company that develops and produces demanding power products. Efore’s head office is based in Finland, and its production units are located in China and Tunisia. Sales and marketing operations are located in Europe, the United States and China. In the fiscal year ending in December 2015, consolidated net sales totalled EUR 89.9 million, and the Group’s personnel averaged 887. The company’s shares are quoted on Nasdaq Helsinki Oy.
Efore story began in March 1975 in Finland. Since then, Efore has grown from a six men engineering office to a truly global group, operating on four continents with nearly 1000 employees and serving customers worldwide.
EFORE IN BRIEF
HEADQUARTERS TECHNOLOGY AND DEVELOPMENT PRODUCTION SALES OFFICE
1 EFORE ANNUAL REPORT 2015
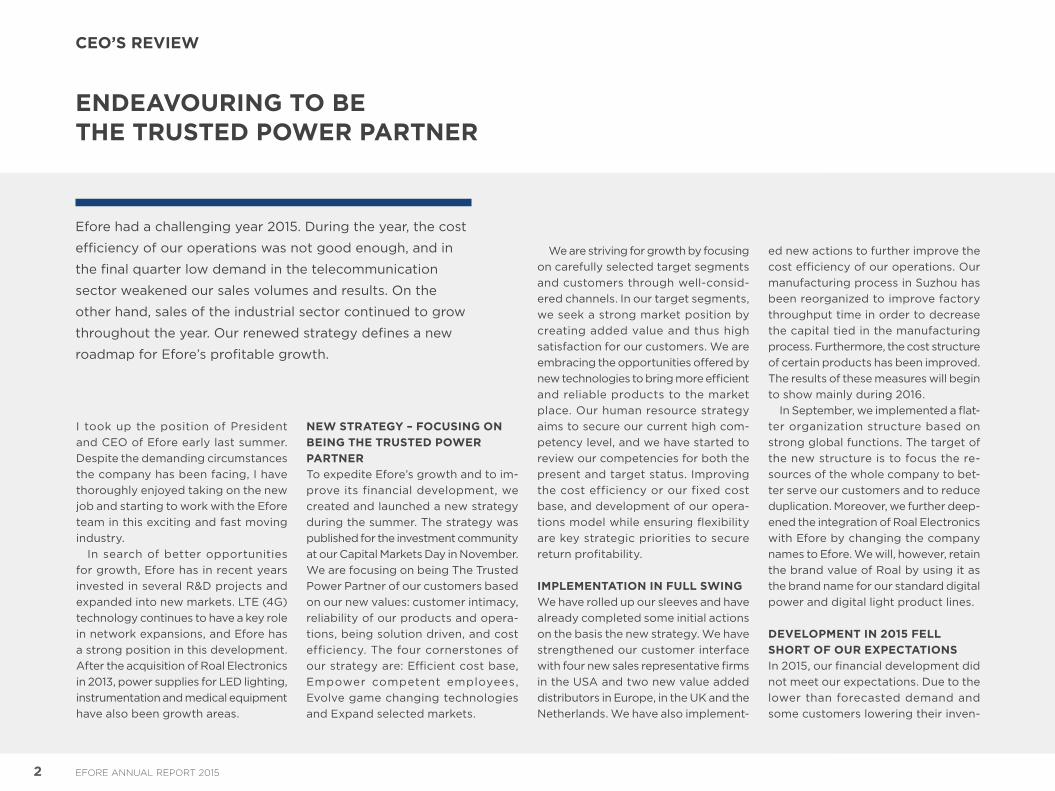
I took up the position of President and CEO of Efore early last summer. Despite the demanding circumstances the company has been facing, I have thoroughly enjoyed taking on the new job and starting to work with the Efore team in this exciting and fast moving industry.
In search of better opportunities for growth, Efore has in recent years invested in several R&D projects and expanded into new markets. LTE (4G) technology continues to have a key role in network expansions, and Efore has a strong position in this development. After the acquisition of Roal Electronics in 2013, power supplies for LED lighting, instrumentation and medical equipment have also been growth areas.
Efore had a challenging year 2015. During the year, the cost
efficiency of our operations was not good enough, and in
the final quarter low demand in the telecommunication
sector weakened our sales volumes and results. On the
other hand, sales of the industrial sector continued to grow
throughout the year. Our renewed strategy defines a new
roadmap for Efore’s profitable growth.
ENDEAVOURING TO BE THE TRUSTED POWER PARTNER
ed new actions to further improve the cost efficiency of our operations. Our manufacturing process in Suzhou has been reorganized to improve factory throughput time in order to decrease the capital tied in the manufacturing process. Furthermore, the cost structure of certain products has been improved. The results of these measures will begin to show mainly during 2016.
In September, we implemented a flat-ter organization structure based on strong global functions. The target of the new structure is to focus the re-sources of the whole company to bet-ter serve our customers and to reduce duplication. Moreover, we further deep-ened the integration of Roal Electronics with Efore by changing the company names to Efore. We will, however, retain the brand value of Roal by using it as the brand name for our standard digital power and digital light product lines.
DEVELOPMENT IN 2015 FELL SHORT OF OUR EXPECTATIONSIn 2015, our financial development did not meet our expectations. Due to the lower than forecasted demand and some customers lowering their inven-
We are striving for growth by focusing on carefully selected target segments and customers through well-consid-ered channels. In our target segments, we seek a strong market position by creating added value and thus high satisfaction for our customers. We are embracing the opportunities offered by new technologies to bring more efficient and reliable products to the market place. Our human resource strategy aims to secure our current high com-petency level, and we have started to review our competencies for both the present and target status. Improving the cost efficiency or our fixed cost base, and development of our opera-tions model while ensuring flexibility are key strategic priorities to secure return profitability.
IMPLEMENTATION IN FULL SWINGWe have rolled up our sleeves and have already completed some initial actions on the basis the new strategy. We have strengthened our customer interface with four new sales representative firms in the USA and two new value added distributors in Europe, in the UK and the Netherlands. We have also implement-
NEW STRATEGY – FOCUSING ON BEING THE TRUSTED POWER PARTNERTo expedite Efore’s growth and to im-prove its financial development, we created and launched a new strategy during the summer. The strategy was published for the investment community at our Capital Markets Day in November. We are focusing on being The TrustedPower Partner of our customers based on our new values: customer intimacy, reliability of our products and opera-tions, being solution driven, and cost efficiency. The four cornerstones of our strategy are: Efficient cost base, Empower competent employees, Evolve game changing technologies and Expand selected markets.
2 EFORE ANNUAL REPORT 2015
CEO’S REVIEW
tories, the net sales of the telecommu-nication sector went down significantly during the final quarter of the year lead-ing to a negative impact on our results. Furthermore, the results from operating activities were impacted by the write-offs of capitalized product development costs related to a product as a result of the customer’s decision not to continue the development of the product.
In order to progress on the path of profitable growth as rapidly as possible, further actions for implementing suc-cessfully our new strategy have been planned. We are focusing on two major areas for ensuring profitability as a part of growing our sales; simplifying our corporate structure and reducing our cost base in manufacturing.
My first months at Efore’s helm have been busy, but extremely interesting. I want to warmly thank our customers, shareholders, personnel, and partners for the productive and pleasant co-operation. I have full confidence in the Efore team and our new strategy, and I look forward to improving financial development during 2016.
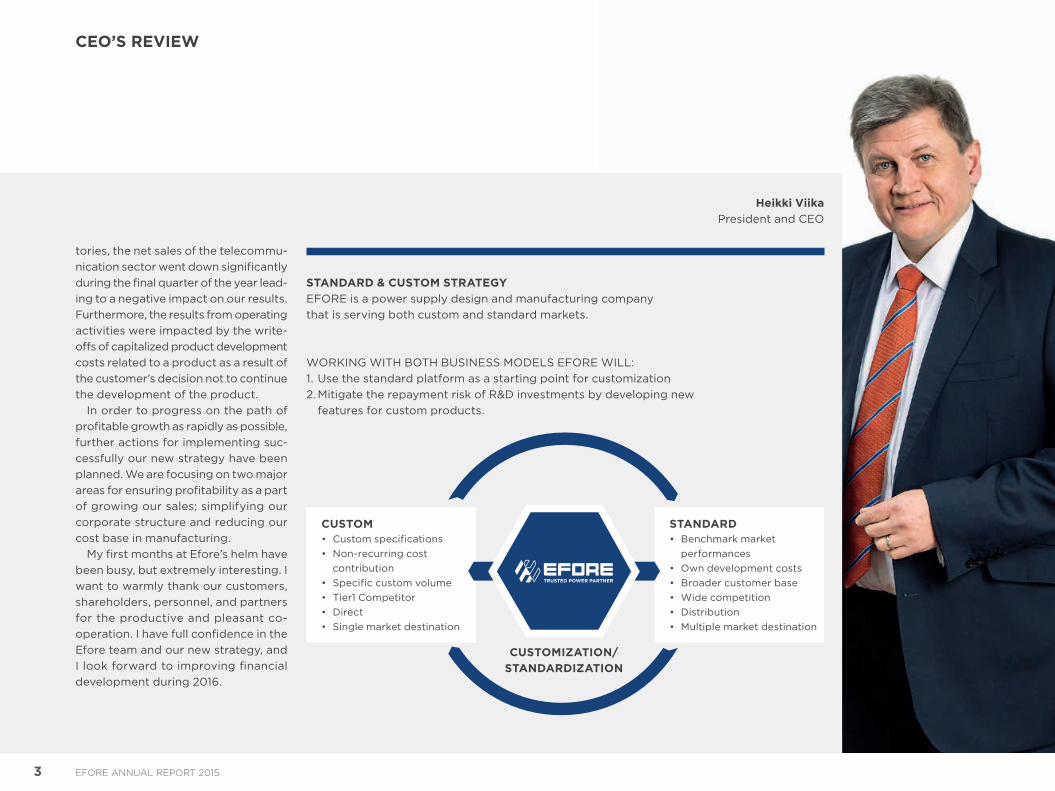
STANDARD & CUSTOM STRATEGYEFORE is a power supply design and manufacturing company that is serving both custom and standard markets.
WORKING WITH BOTH BUSINESS MODELS EFORE WILL:1. Use the standard platform as a starting point for customization2. Mitigate the repayment risk of R&D investments by developing new
features for custom products.
Heikki ViikaPresident and CEO
CUSTOM• Custom specifications• Non-recurring cost
contribution• Specific custom volume• Tier1 Competitor• Direct• Single market destination
STANDARD• Benchmark market
performances• Own development costs• Broader customer base• Wide competition• Distribution• Multiple market destination
CUSTOMIZATION/STANDARDIZATION
3 EFORE ANNUAL REPORT 2015
CEO’S REVIEW
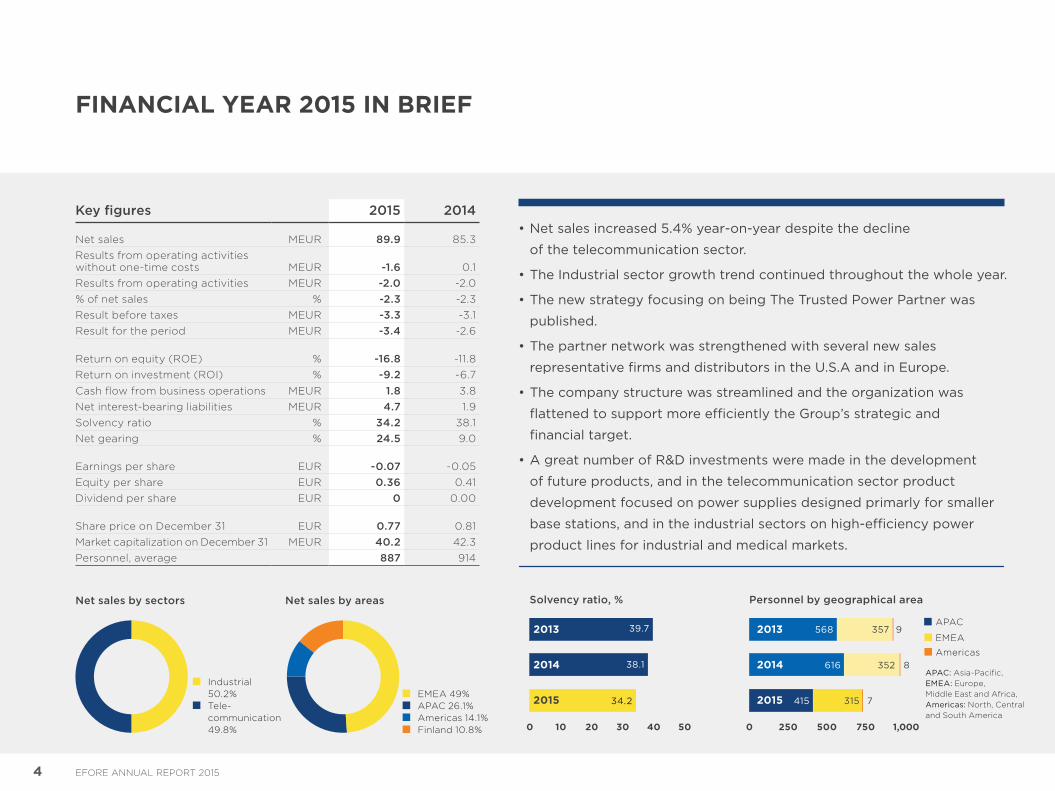
Industrial 50.2%
Telecommunication 49.8%
EMEA 49% APAC 26.1% Americas 14.1% Finland 10.8%
Solvency ratio, %
5020100 4030
2013
2014
2015
38.1
39.7
34.2
APAC
EMEA
Americas
APAC: AsiaPacific, EMEA: Europe, Middle East and Africa, Americas: North, Central and South America
Personnel by geographical area
1,0005002500 750
315
352
415
616
7
8
357 9568
Key figures 2015 2014
Net sales MEUR 89.9 85.3Results from operating activities without onetime costs MEUR -1.6 0.1Results from operating activities MEUR -2.0 2.0% of net sales % -2.3 2.3Result before taxes MEUR -3.3 3.1Result for the period MEUR -3.4 2.6
Return on equity (ROE) % -16.8 11.8Return on investment (ROI) % -9.2 6.7
Cash flow from business operations MEUR 1.8 3.8Net interestbearing liabilities MEUR 4.7 1.9Solvency ratio % 34.2 38.1Net gearing % 24.5 9.0
Earnings per share EUR -0.07 0.05Equity per share EUR 0.36 0.41Dividend per share EUR 0 0.00
Share price on December 31 EUR 0.77 0.81Market capitalization on December 31 MEUR 40.2 42.3Personnel, average 887 914
Net sales by areasNet sales by sectors
FINANCIAL YEAR 2015 IN BRIEF
• Net sales increased 5.4% year-on-year despite the decline
of the telecommunication sector.
• The Industrial sector growth trend continued throughout the whole year.
• The new strategy focusing on being The Trusted Power Partner was
published.
• The partner network was strengthened with several new sales
representative firms and distributors in the U.S.A and in Europe.
• The company structure was streamlined and the organization was
flattened to support more efficiently the Group’s strategic and
financial target.
• A great number of R&D investments were made in the development
of future products, and in the telecommunication sector product
development focused on power supplies designed primarly for smaller
base stations, and in the industrial sectors on high-efficiency power
product lines for industrial and medical markets.
2013
2014
2015
4 EFORE ANNUAL REPORT 2015
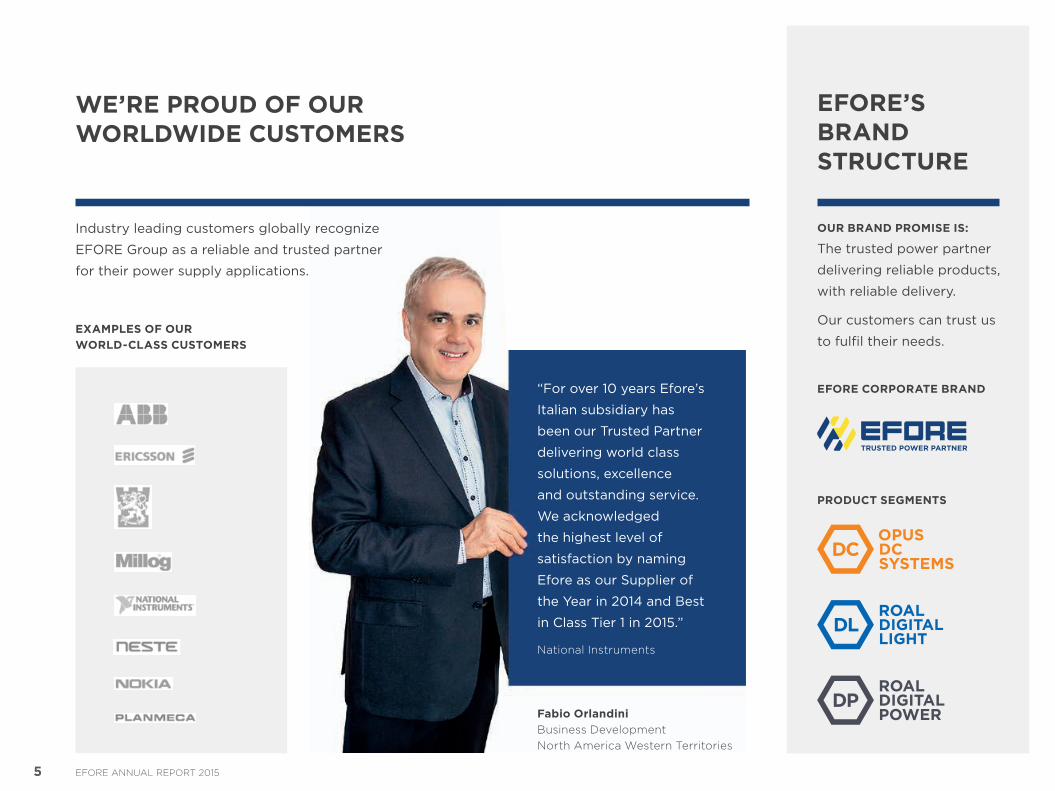
EFORE’S BRAND STRUCTURE
OUR BRAND PROMISE IS:
The trusted power partner
delivering reliable products,
with reliable delivery.
Our customers can trust us
to fulfil their needs.
EFORE CORPORATE BRAND
PRODUCT SEGMENTS
WE’RE PROUD OF OUR WORLDWIDE CUSTOMERS
Industry leading customers globally recognize
EFORE Group as a reliable and trusted partner
for their power supply applications.
EXAMPLES OF OUR WORLD-CLASS CUSTOMERS
“For over 10 years Efore’s
Italian subsidiary has
been our Trusted Partner
delivering world class
solutions, excellence
and outstanding service.
We acknowledged
the highest level of
satisfaction by naming
Efore as our Supplier of
the Year in 2014 and Best
in Class Tier 1 in 2015.”
National Instruments
Fabio Orlandini Business Development North America Western Territories
5 EFORE ANNUAL REPORT 2015
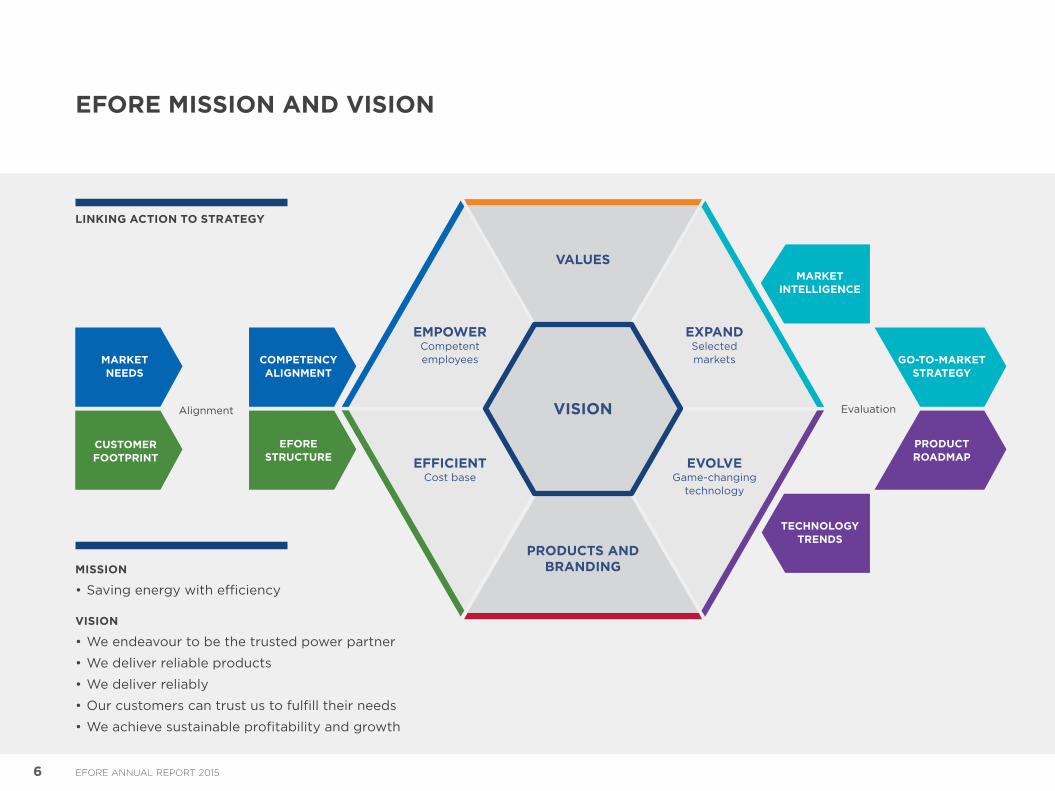
EFORE MISSION AND VISION
MISSION
• Saving energy with efficiency
VISION
• We endeavour to be the trusted power partner
• We deliver reliable products
• We deliver reliably
• Our customers can trust us to fulfill their needs
• We achieve sustainable profitability and growth
LINKING ACTION TO STRATEGY
COMPETENCY ALIGNMENT
GO-TO-MARKET STRATEGY
MARKET NEEDS
EFORE STRUCTURE
PRODUCT ROADMAP
CUSTOMER FOOTPRINT
Alignment Evaluation
MARKET INTELLIGENCE
TECHNOLOGY TRENDS
VALUES
EXPANDSelected markets
VISION
PRODUCTS AND BRANDING
EFFICIENTCost base
EVOLVEGame-changing
technology
EMPOWERCompetent employees
6 EFORE ANNUAL REPORT 2015
STRATEGIC PLAN 2015–2018
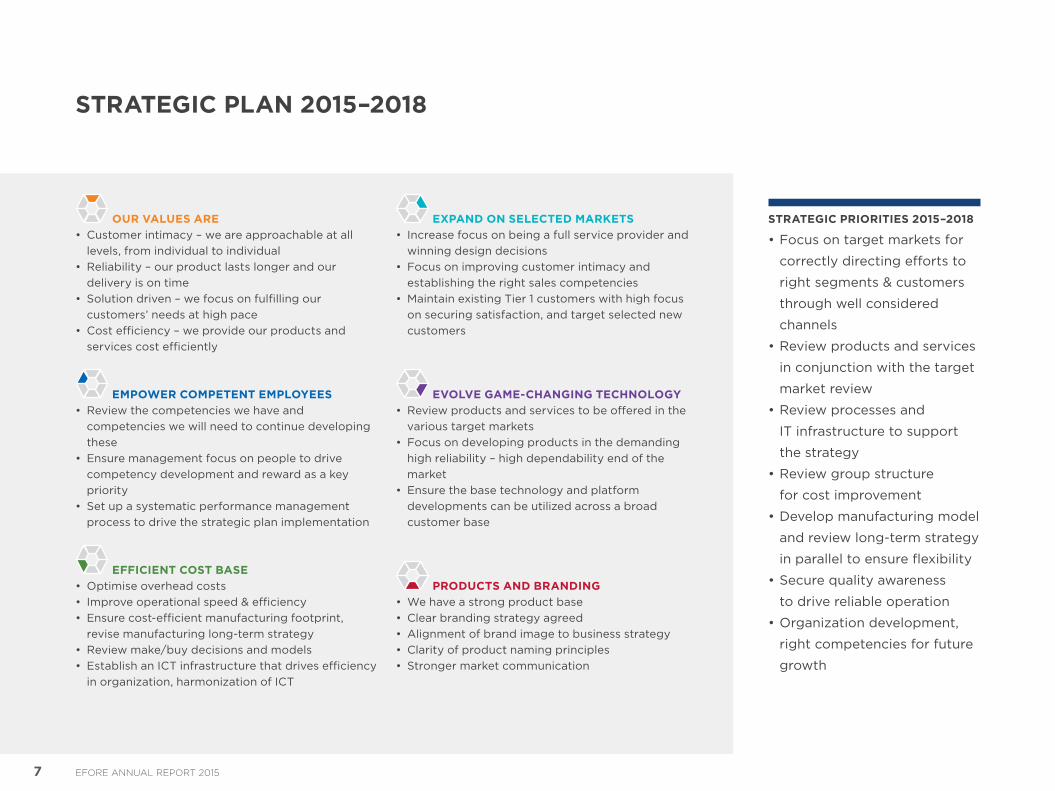
OUR VALUES ARE• Customer intimacy – we are approachable at all
levels, from individual to individual• Reliability – our product lasts longer and our
delivery is on time• Solution driven – we focus on fulfilling our
customers’ needs at high pace• Cost efficiency – we provide our products and
services cost efficiently
EMPOWER COMPETENT EMPLOYEES• Review the competencies we have and
competencies we will need to continue developing these
• Ensure management focus on people to drive competency development and reward as a key priority
• Set up a systematic performance management process to drive the strategic plan implementation
EFFICIENT COST BASE• Optimise overhead costs• Improve operational speed & efficiency• Ensure cost-efficient manufacturing footprint,
revise manufacturing long-term strategy• Review make/buy decisions and models• Establish an ICT infrastructure that drives efficiency
in organization, harmonization of ICT
EXPAND ON SELECTED MARKETS• Increase focus on being a full service provider and
winning design decisions• Focus on improving customer intimacy and
establishing the right sales competencies• Maintain existing Tier 1 customers with high focus
on securing satisfaction, and target selected new customers
EVOLVE GAME-CHANGING TECHNOLOGY• Review products and services to be offered in the
various target markets• Focus on developing products in the demanding
high reliability – high dependability end of the market
• Ensure the base technology and platform developments can be utilized across a broad customer base
PRODUCTS AND BRANDING• We have a strong product base• Clear branding strategy agreed• Alignment of brand image to business strategy• Clarity of product naming principles• Stronger market communication
STRATEGIC PRIORITIES 2015–2018
• Focus on target markets for
correctly directing efforts to
right segments & customers
through well considered
channels
• Review products and services
in conjunction with the target
market review
• Review processes and
IT infrastructure to support
the strategy
• Review group structure
for cost improvement
• Develop manufacturing model
and review long-term strategy
in parallel to ensure flexibility
• Secure quality awareness
to drive reliable operation
• Organization development,
right competencies for future
growth
7 EFORE ANNUAL REPORT 2015
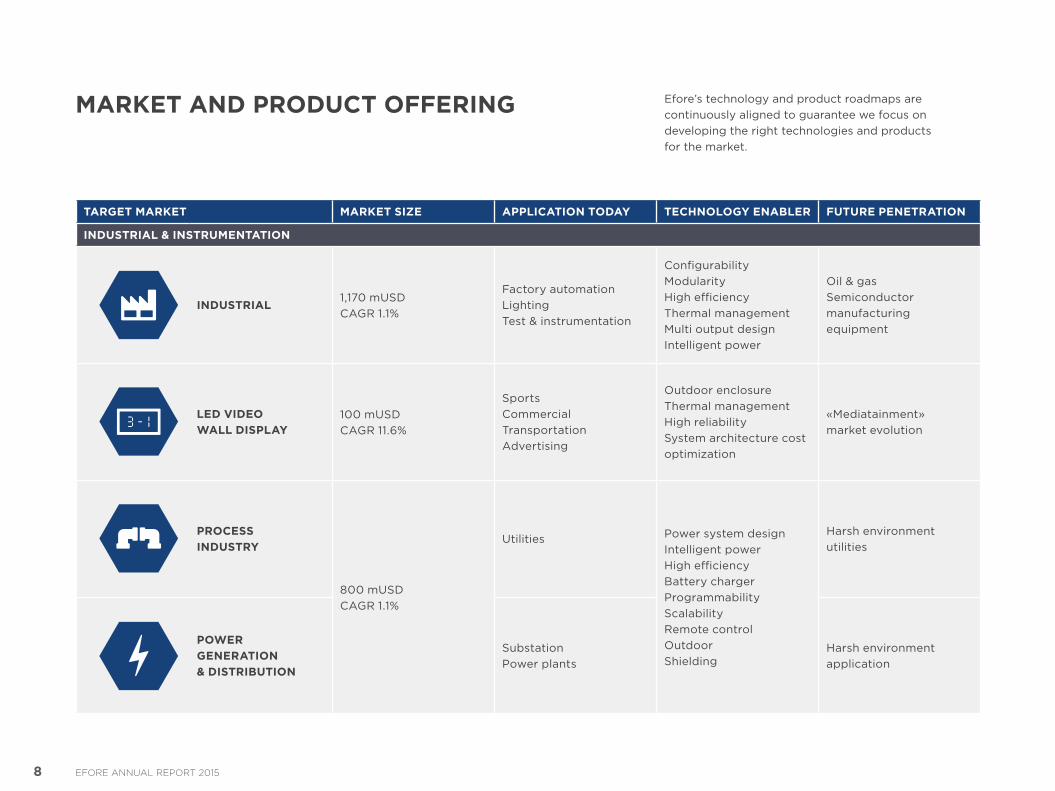
MARKET AND PRODUCT OFFERING
TARGET MARKET MARKET SIZE APPLICATION TODAY TECHNOLOGY ENABLER FUTURE PENETRATION
INDUSTRIAL & INSTRUMENTATION
INDUSTRIAL1,170 mUSD CAGR 1.1%
Factory automationLightingTest & instrumentation
ConfigurabilityModularityHigh efficiencyThermal managementMulti output designIntelligent power
Oil & gasSemiconductor manufacturing equipment
LED VIDEOWALL DISPLAY
100 mUSD CAGR 11.6%
SportsCommercialTransportationAdvertising
Outdoor enclosureThermal managementHigh reliabilitySystem architecture cost optimization
«Mediatainment» market evolution
PROCESS INDUSTRY
800 mUSD CAGR 1.1%
Utilities Power system designIntelligent powerHigh efficiencyBattery chargerProgrammabilityScalabilityRemote controlOutdoorShielding
Harsh environment utilities
POWER GENERATION & DISTRIBUTION
SubstationPower plants
Harsh environment application
Efore’s technology and product roadmaps are continuously aligned to guarantee we focus on developing the right technologies and products for the market.
8 EFORE ANNUAL REPORT 2015
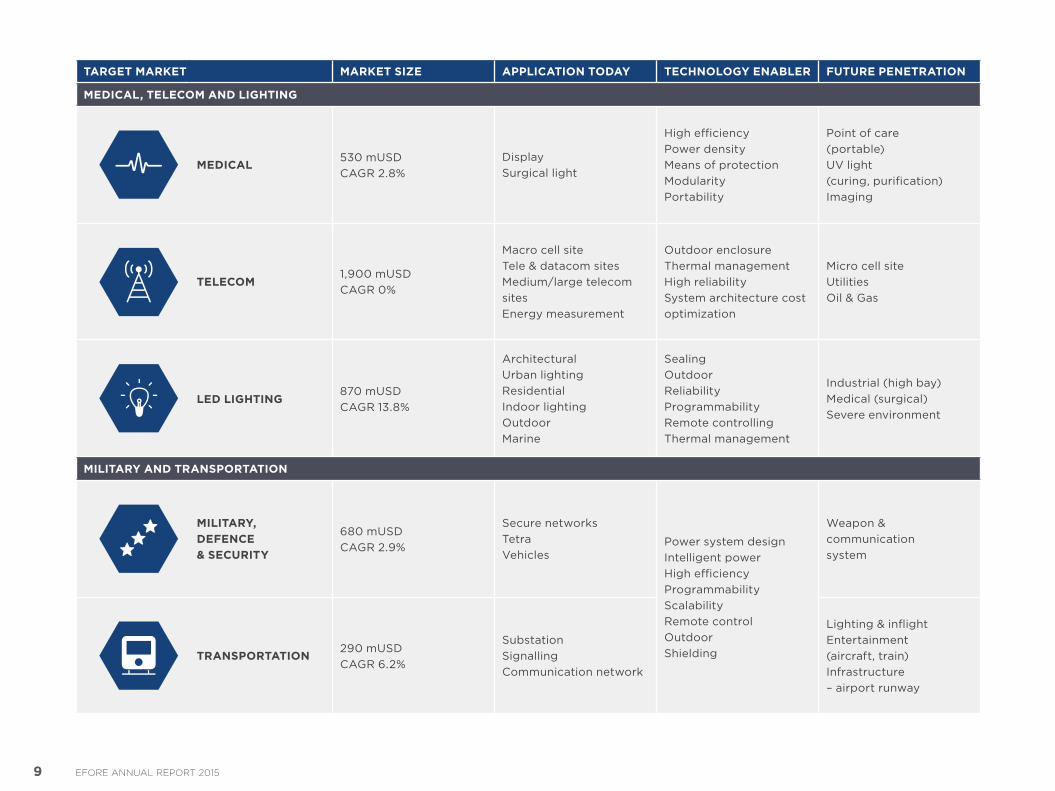
TARGET MARKET MARKET SIZE APPLICATION TODAY TECHNOLOGY ENABLER FUTURE PENETRATION
MEDICAL, TELECOM AND LIGHTING
MEDICAL530 mUSD CAGR 2.8%
DisplaySurgical light
High efficiencyPower densityMeans of protectionModularityPortability
Point of care (portable)UV light (curing, purification)Imaging
TELECOM1,900 mUSD CAGR 0%
Macro cell siteTele & datacom sitesMedium/large telecom sitesEnergy measurement
Outdoor enclosureThermal managementHigh reliabilitySystem architecture cost optimization
Micro cell siteUtilitiesOil & Gas
LED LIGHTING870 mUSD CAGR 13.8%
ArchitecturalUrban lightingResidentialIndoor lightingOutdoorMarine
SealingOutdoorReliabilityProgrammabilityRemote controllingThermal management
Industrial (high bay)Medical (surgical)Severe environment
MILITARY AND TRANSPORTATION
MILITARY, DEFENCE & SECURITY
680 mUSD CAGR 2.9%
Secure networksTetraVehicles
Power system designIntelligent powerHigh efficiencyProgrammabilityScalabilityRemote controlOutdoorShielding
Weapon & communication system
TRANSPORTATION290 mUSD CAGR 6.2%
SubstationSignallingCommunication network
Lighting & inflight Entertainment (aircraft, train)Infrastructure – airport runway
9 EFORE ANNUAL REPORT 2015
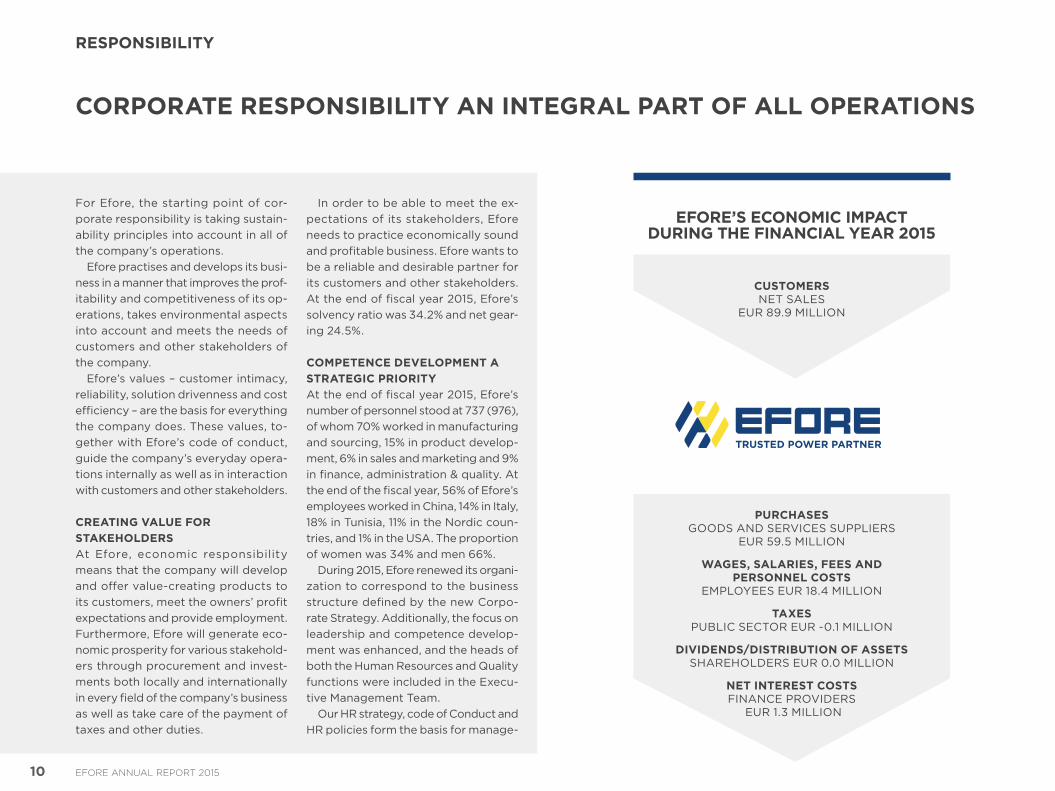
CORPORATE RESPONSIBILITY AN INTEGRAL PART OF ALL OPERATIONS
CUSTOMERSNET SALES
EUR 89.9 MILLION
PURCHASES GOODS AND SERVICES SUPPLIERS
EUR 59.5 MILLION
WAGES, SALARIES, FEES AND PERSONNEL COSTS
EMPLOYEES EUR 18.4 MILLION
TAXES PUBLIC SECTOR EUR -0.1 MILLION
DIVIDENDS/DISTRIBUTION OF ASSETS SHAREHOLDERS EUR 0.0 MILLION
NET INTEREST COSTS FINANCE PROVIDERS
EUR 1.3 MILLION
EFORE’S ECONOMIC IMPACTDURING THE FINANCIAL YEAR 2015
For Efore, the starting point of cor-porate responsibility is taking sustain-ability principles into account in all of the company’s operations.
Efore practises and develops its busi-ness in a manner that improves the prof-itability and competitiveness of its op-erations, takes environmental aspects into account and meets the needs of customers and other stakeholders of the company.
Efore’s values – customer intimacy, reliability, solution drivenness and cost efficiency – are the basis for everything the company does. These values, to-gether with Efore’s code of conduct, guide the company’s everyday opera-tions internally as well as in interaction with customers and other stakeholders.
CREATING VALUE FOR STAKEHOLDERSAt Efore, economic responsibility means that the company will develop and offer value-creating products to its customers, meet the owners’ profit expectations and provide employment. Furthermore, Efore will generate eco-nomic prosperity for various stakehold-ers through procurement and invest-ments both locally and internationally in every field of the company’s business as well as take care of the payment of taxes and other duties.
In order to be able to meet the ex-pectations of its stakeholders, Efore needs to practice economically sound and profitable business. Efore wants to be a reliable and desirable partner for its customers and other stakeholders. At the end of fiscal year 2015, Efore’s solvency ratio was 34.2% and net gear-ing 24.5%.
COMPETENCE DEVELOPMENT A STRATEGIC PRIORITYAt the end of fiscal year 2015, Efore’s number of personnel stood at 737 (976), of whom 70% worked in manufacturing and sourcing, 15% in product develop-ment, 6% in sales and marketing and 9% in finance, administration & quality. At the end of the fiscal year, 56% of Efore’s employees worked in China, 14% in Italy, 18% in Tunisia, 11% in the Nordic coun-tries, and 1% in the USA. The proportion of women was 34% and men 66%.
During 2015, Efore renewed its organi-zation to correspond to the business structure defined by the new Corpo-rate Strategy. Additionally, the focus on leadership and competence develop-ment was enhanced, and the heads of both the Human Resources and Quality functions were included in the Execu-tive Management Team.
Our HR strategy, code of Conduct and HR policies form the basis for manage-
10 EFORE ANNUAL REPORT 2015
RESPONSIBILITY
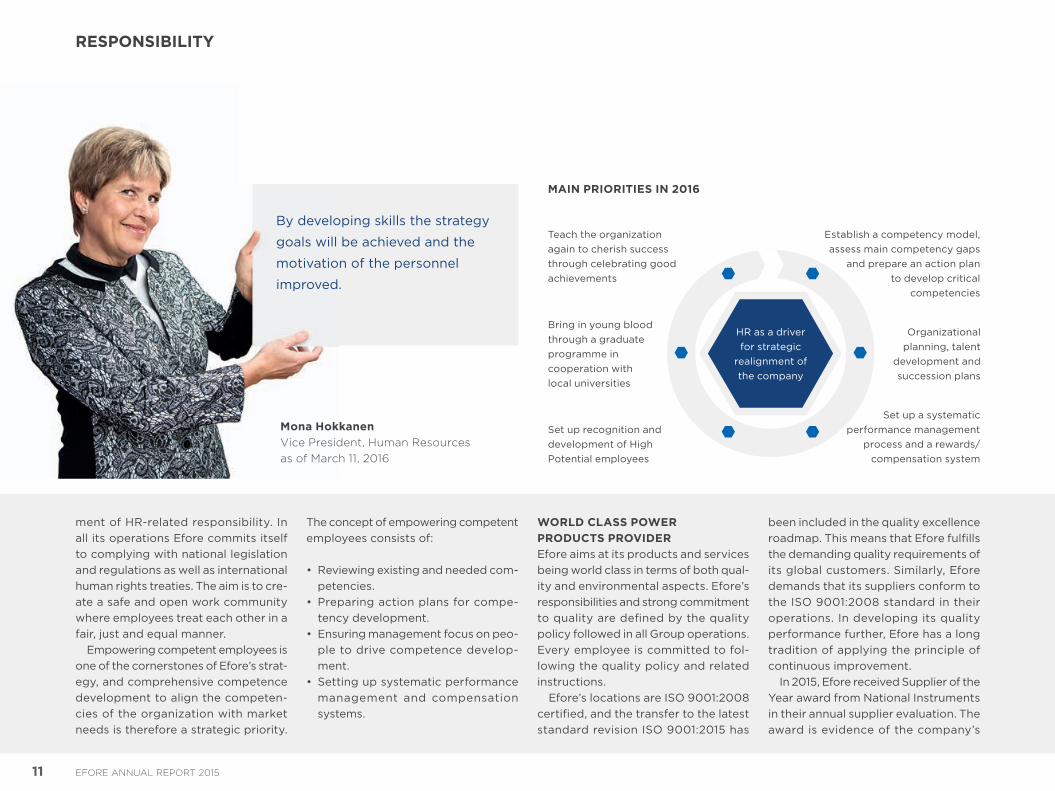
By developing skills the strategy
goals will be achieved and the
motivation of the personnel
improved.
Establish a competency model, assess main competency gaps
and prepare an action plan to develop critical
competencies
Teach the organizationagain to cherish successthrough celebrating goodachievements
Set up a systematic performance management
process and a rewards/compensation system
Set up recognition and development of High Potential employees
Bring in young blood through a graduate programme in cooperation with local universities
Organizational planning, talent
development and succession plans
HR as a driver for strategic
realignment of the company
MAIN PRIORITIES IN 2016
ment of HR-related responsibility. In all its operations Efore commits itself to complying with national legislation and regulations as well as international human rights treaties. The aim is to cre-ate a safe and open work community where employees treat each other in a fair, just and equal manner.
Empowering competent employees is one of the cornerstones of Efore’s strat-egy, and comprehensive competence development to align the competen-cies of the organization with market needs is therefore a strategic priority.
The concept of empowering competent employees consists of:
• Reviewing existing and needed com-petencies.
• Preparing action plans for compe-tency development.
• Ensuring management focus on peo-ple to drive competence develop-ment.
• Setting up systematic performance management and compensation systems.
WORLD CLASS POWER PRODUCTS PROVIDEREfore aims at its products and services being world class in terms of both qual-ity and environmental aspects. Efore’s responsibilities and strong commitment to quality are defined by the quality policy followed in all Group operations. Every employee is committed to fol-lowing the quality policy and related instructions.
Efore’s locations are ISO 9001:2008 certified, and the transfer to the latest standard revision ISO 9001:2015 has
Mona Hokkanen Vice President, Human Resources as of March 11, 2016
been included in the quality excellence roadmap. This means that Efore fulfills the demanding quality requirements of its global customers. Similarly, Efore demands that its suppliers conform to the ISO 9001:2008 standard in their operations. In developing its quality performance further, Efore has a long tradition of applying the principle of continuous improvement.
In 2015, Efore received Supplier of the Year award from National Instruments in their annual supplier evaluation. The award is evidence of the company’s
11 EFORE ANNUAL REPORT 2015
RESPONSIBILITY
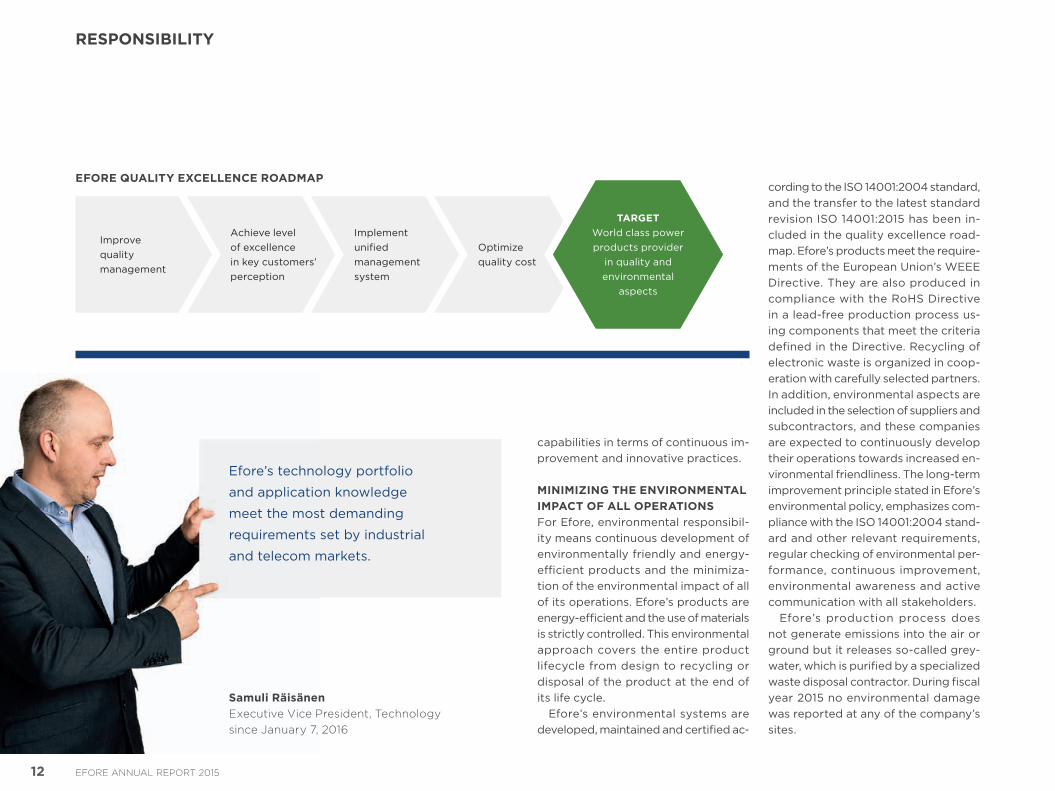
Efore’s technology portfolio
and application knowledge
meet the most demanding
requirements set by industrial
and telecom markets.
cording to the ISO 14001:2004 standard, and the transfer to the latest standard revision ISO 14001:2015 has been in-cluded in the quality excellence road-map. Efore’s products meet the require-ments of the European Union’s WEEE Directive. They are also produced in compliance with the RoHS Directive in a lead-free production process us-ing components that meet the criteria defined in the Directive. Recycling of electronic waste is organized in coop-eration with carefully selected partners. In addition, environmental aspects are included in the selection of suppliers and subcontractors, and these companies are expected to continuously develop their operations towards increased en-vironmental friendliness. The long-term improvement principle stated in Efore’s environmental policy, emphasizes com-pliance with the ISO 14001:2004 stand-ard and other relevant requirements, regular checking of environmental per-formance, continuous improvement, environmental awareness and active communication with all stakeholders.
Efore’s production process does not generate emissions into the air or ground but it releases so-called grey-water, which is purified by a specialized waste disposal contractor. During fiscal year 2015 no environmental damage was reported at any of the company’s sites.
RESPONSIBILITY
TARGETWorld class power products provider
in quality and environmental
aspects
Improve quality management
Achieve level of excellence in key customers’ perception
Implement unified management system
Optimize quality cost
capabilities in terms of continuous im-provement and innovative practices.
MINIMIZING THE ENVIRONMENTAL IMPACT OF ALL OPERATIONSFor Efore, environmental responsibil-ity means continuous development of environmentally friendly and energy-efficient products and the minimiza-tion of the environmental impact of all of its operations. Efore’s products are energy-efficient and the use of materials is strictly controlled. This environmental approach covers the entire product lifecycle from design to recycling or disposal of the product at the end of its life cycle.
Efore’s environmental systems are developed, maintained and certified ac-
Samuli Räisänen Executive Vice President, Technology since January 7, 2016
EFORE QUALITY EXCELLENCE ROADMAP
12 EFORE ANNUAL REPORT 2015
FINANCIAL STATEMENTS 2015
FINANCIAL STATEMENTS
REPORT OF THE BOARD OF DIRECTORS 14
CONSOLIDATED INCOME STATEMENT 19
CONSOLIDATED BALANCE SHEET 20
CONSOLIDATED CASH FLOW STATEMENT 22
CONSOLIDATED STATEMENT OF CHANGES IN EQUITY 23
NOTES TO THE CONSOLIDATED FINANCIAL STATEMENTS 24
INCOME STATEMENT FOR THE PARENT COMPANY 53
BALANCE SHEET FOR THE PARENT COMPANY 54
PARENT COMPANY’S CASH FLOW STATEMENT 56
ACCOUNTING POLICIES FOR THE FINANCIAL STATEMENTS OF PARENT COMPANY 57
NOTES TO THE FINANCIAL STATEMENTS, PARENT COMPANY 58
GROUP KEY FIGURES 64
CALCULATION OF KEY FIGURES AND RATIOS 67
SHARES AND SHAREHOLDERS 68
SIGNATURES FOR THE FINANCIAL STATEMENTS AND THE REPORT BY THE BOARD OF DIRECTORS 73
AUDITOR’S REPORT 74
CORPORATE GOVERNANCE
CORPORATE GOVERNANCE STATEMENT 75
BOARD OF DIRECTORS 78
EXECUTIVE MANAGEMENT TEAM 80
INFORMATION FOR SHAREHOLDERS 82
CONTACT DETAILS 83
13 EFORE ANNUAL REPORT 2015
REPORT OF THE BOARD OF DIRECTORS
Efore Group is an international company which develops and produces demanding power electronics products. In 2015 Efore complied with the Insider Guidelines issued by the NASDAX OMX Helsinki Oy and the Finnish Corporate Governance Code 2010 for Listed Companies issued by Securities Market Association. From January 1, 2016 Efore applies to the Governance Code 2015 for Listed Finnish Companies issued by the Finnish Securities Market Association.
The Corporate Governance Code is publicly available, e.g. on the website of the Securities Market Association, address www.cgfinland.fi.
GROUP STRUCTUREAt the end the financial year Efore Group consisted of the parent company Efore Plc and its directly or indirectly wholly owned subsidiaries Efore (USA) Inc. in the United States, Efore(Suzhou)
Electronics Co. Ltd in China, Efore (Suzhou) Automotive Technology Co., Ltd in China, Efore OU in Estonia, Efore AB in Sweden, Efore (HongKong) Co. Ltd in China and FISystems Oy in Finland as well as Roal Electronics S.p.A. in Italy (since January 13, 2016 Efore S.p.A.) , Efore Sarl (until December 14, 2015 Roal Electronics Sarl) in Tunis and Roal Electronics USA, Inc. (since January 7, 2016 Efore Inc.) in the U.S.A.
The liquidation of Efore Management Oy, a company owned by the members of the Efore Group Executive Management Team, was made on January 19, 2015.
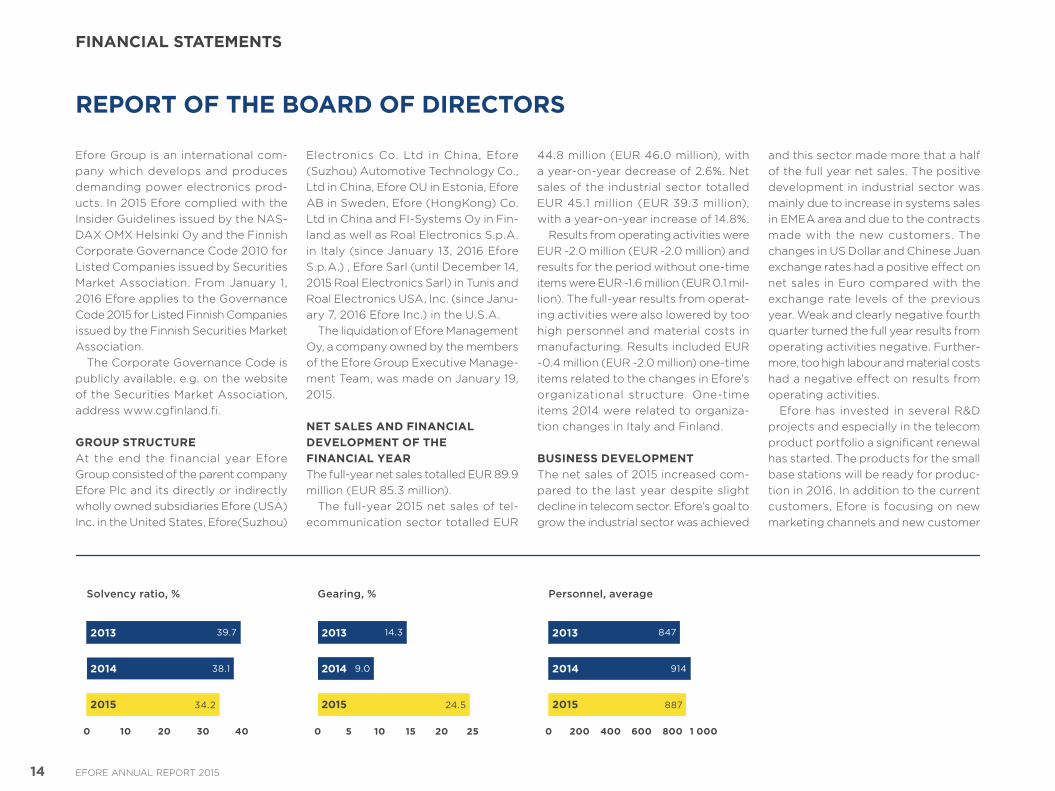
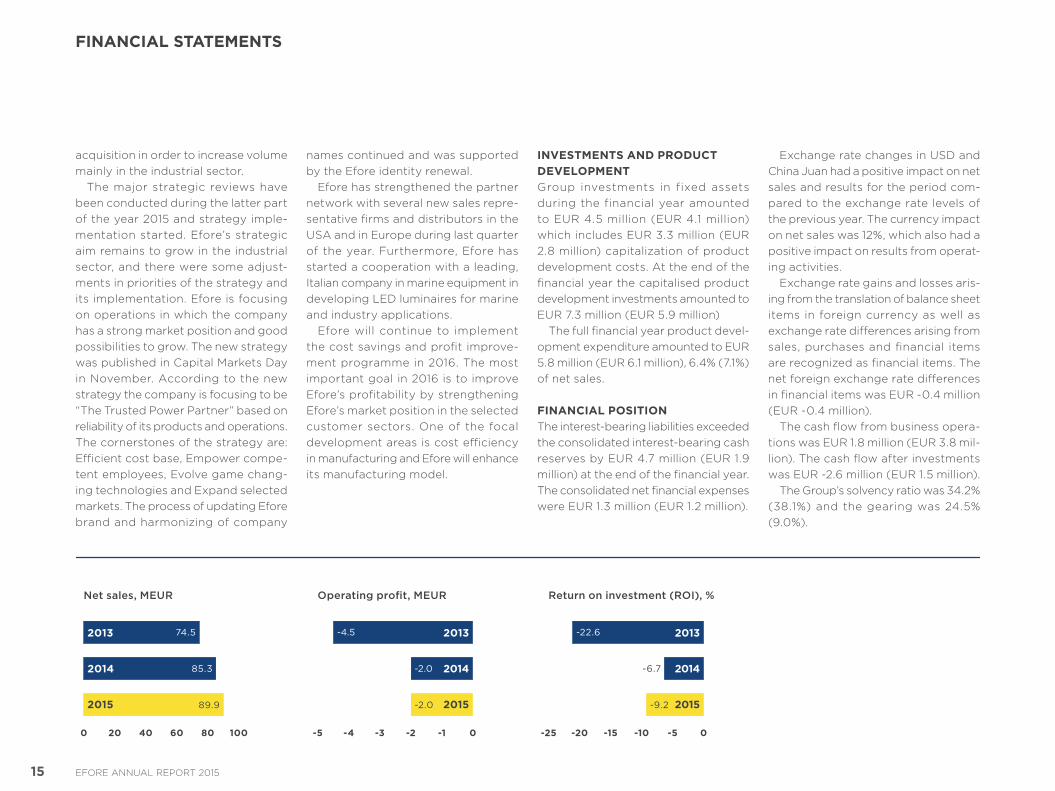
NET SALES AND FINANCIAL DEVELOPMENT OF THE FINANCIAL YEARThe fullyear net sales totalled EUR 89.9 million (EUR 85.3 million).
The fullyear 2015 net sales of telecommunication sector totalled EUR
44.8 million (EUR 46.0 million), with a yearonyear decrease of 2.6%. Net sales of the industrial sector totalled EUR 45.1 million (EUR 39.3 million), with a yearonyear increase of 14.8%.
Results from operating activities were EUR 2.0 million (EUR 2.0 million) and results for the period without onetime items were EUR 1.6 million (EUR 0.1 million). The fullyear results from operating activities were also lowered by too high personnel and material costs in manufacturing. Results included EUR 0.4 million (EUR 2.0 million) onetime items related to the changes in Efore’s organizational structure. Onetime items 2014 were related to organization changes in Italy and Finland.
BUSINESS DEVELOPMENT The net sales of 2015 increased compared to the last year despite slight decline in telecom sector. Efore’s goal to grow the industrial sector was achieved
and this sector made more that a half of the full year net sales. The positive development in industrial sector was mainly due to increase in systems sales in EMEA area and due to the contracts made with the new customers. The changes in US Dollar and Chinese Juan exchange rates had a positive effect on net sales in Euro compared with the exchange rate levels of the previous year. Weak and clearly negative fourth quarter turned the full year results from operating activities negative. Furthermore, too high labour and material costs had a negative effect on results from operating activities.
Efore has invested in several R&D projects and especially in the telecom product portfolio a significant renewal has started. The products for the small base stations will be ready for production in 2016. In addition to the current customers, Efore is focusing on new marketing channels and new customer
Personnel, average
1 000200 400 6000 800
2013
2014
2015
914
887
847
Solvency ratio, %
4020100 30
2013
2014
2015
39.7
Gearing, %
38.1
34.2
2515 201050
2013
2014
2015
9.0
24.5
14.3
14 EFORE ANNUAL REPORT 2015
FINANCIAL STATEMENTS
acquisition in order to increase volume mainly in the industrial sector.
The major strategic reviews have been conducted during the latter part of the year 2015 and strategy implementation started. Efore’s strategic aim remains to grow in the industrial sector, and there were some adjustments in priorities of the strategy and its implementation. Efore is focusing on operations in which the company has a strong market position and good possibilities to grow. The new strategy was published in Capital Markets Day in November. According to the new strategy the company is focusing to be “The Trusted Power Partner” based on reliability of its products and operations. The cornerstones of the strategy are: Efficient cost base, Empower competent employees, Evolve game changing technologies and Expand selected markets. The process of updating Efore brand and harmonizing of company
names continued and was supported by the Efore identity renewal.
Efore has strengthened the partner network with several new sales representative firms and distributors in the USA and in Europe during last quarter of the year. Furthermore, Efore has started a cooperation with a leading, Italian company in marine equipment in developing LED luminaires for marine and industry applications.
Efore will continue to implement the cost savings and profit improvement programme in 2016. The most important goal in 2016 is to improve Efore’s profitability by strengthening Efore’s market position in the selected customer sectors. One of the focal development areas is cost efficiency in manufacturing and Efore will enhance its manufacturing model.
INVESTMENTS AND PRODUCT DEVELOPMENTGroup investments in fixed assets during the financial year amounted to EUR 4.5 million (EUR 4.1 million) which includes EUR 3.3 million (EUR 2.8 million) capitalization of product development costs. At the end of the financial year the capitalised product development investments amounted to EUR 7.3 million (EUR 5.9 million)
The full financial year product development expenditure amounted to EUR 5.8 million (EUR 6.1 million), 6.4% (7.1%) of net sales.
FINANCIAL POSITIONThe interestbearing liabilities exceeded the consolidated interestbearing cash reserves by EUR 4.7 million (EUR 1.9 million) at the end of the financial year. The consolidated net financial expenses were EUR 1.3 million (EUR 1.2 million).
Exchange rate changes in USD and China Juan had a positive impact on net sales and results for the period compared to the exchange rate levels of the previous year. The currency impact on net sales was 12%, which also had a positive impact on results from operating activities.
Exchange rate gains and losses arising from the translation of balance sheet items in foreign currency as well as exchange rate differences arising from sales, purchases and financial items are recognized as financial items. The net foreign exchange rate differences in financial items was EUR 0.4 million (EUR 0.4 million).
The cash flow from business operations was EUR 1.8 million (EUR 3.8 million). The cash flow after investments was EUR 2.6 million (EUR 1.5 million).
The Group’s solvency ratio was 34.2% (38.1%) and the gearing was 24.5% (9.0%).
Return on investment (ROI), %
0-10 -5-25 -15-20
Operating profit, MEUR
-2 -1 0-5 -4 -3
-2.0
-2.0 -9.2
-4.5
-6.7
-22.62013
2014
2015
2013
2014
2015
Net sales, MEUR
85.3
89.9
74.5
10020 40 600 80
2013
2014
2015
15 EFORE ANNUAL REPORT 2015
FINANCIAL STATEMENTS
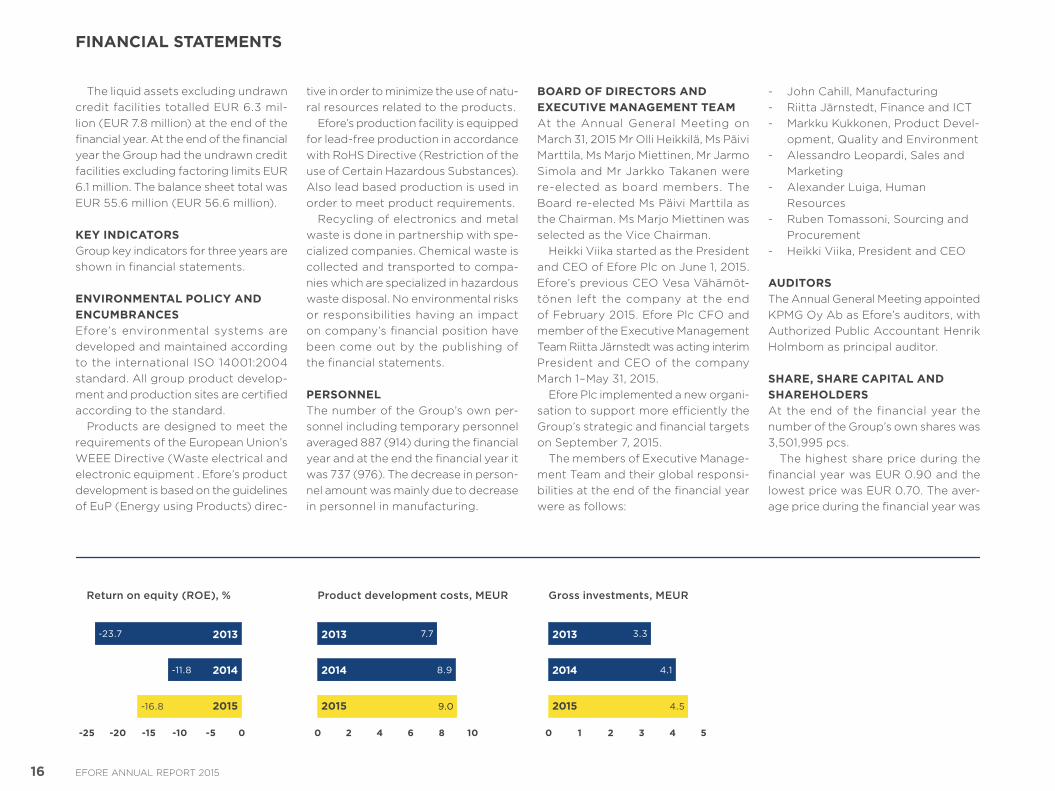
The liquid assets excluding undrawn credit facilities totalled EUR 6.3 million (EUR 7.8 million) at the end of the financial year. At the end of the financial year the Group had the undrawn credit facilities excluding factoring limits EUR 6.1 million. The balance sheet total was EUR 55.6 million (EUR 56.6 million).
KEY INDICATORSGroup key indicators for three years are shown in financial statements.
ENVIRONMENTAL POLICY AND ENCUMBRANCES Efore’s environmental systems are developed and maintained according to the international ISO 14001:2004 standard. All group product development and production sites are certified according to the standard.
Products are designed to meet the requirements of the European Union’s WEEE Directive (Waste electrical and electronic equipment . Efore’s product development is based on the guidelines of EuP (Energy using Products) direc
tive in order to minimize the use of natural resources related to the products.
Efore’s production facility is equipped for leadfree production in accordance with RoHS Directive (Restriction of the use of Certain Hazardous Substances). Also lead based production is used in order to meet product requirements.
Recycling of electronics and metal waste is done in partnership with specialized companies. Chemical waste is collected and transported to companies which are specialized in hazardous waste disposal. No environmental risks or responsibilities having an impact on company’s financial position have been come out by the publishing of the financial statements.
PERSONNELThe number of the Group’s own personnel including temporary personnel averaged 887 (914) during the financial year and at the end the financial year it was 737 (976). The decrease in personnel amount was mainly due to decrease in personnel in manufacturing.
BOARD OF DIRECTORS AND EXECUTIVE MANAGEMENT TEAMAt the Annual General Meeting on March 31, 2015 Mr Olli Heikkilä, Ms Päivi Marttila, Ms Marjo Miettinen, Mr Jarmo Simola and Mr Jarkko Takanen were reelected as board members. The Board reelected Ms Päivi Marttila as the Chairman. Ms Marjo Miettinen was selected as the Vice Chairman.
Heikki Viika started as the President and CEO of Efore Plc on June 1, 2015. Efore’s previous CEO Vesa Vähämöttönen left the company at the end of February 2015. Efore Plc CFO and member of the Executive Management Team Riitta Järnstedt was acting interim President and CEO of the company March 1–May 31, 2015.
Efore Plc implemented a new organisation to support more efficiently the Group’s strategic and financial targets on September 7, 2015.
The members of Executive Management Team and their global responsibilities at the end of the financial year were as follows:
John Cahill, Manufacturing Riitta Järnstedt, Finance and ICT Markku Kukkonen, Product Devel
opment, Quality and Environment Alessandro Leopardi, Sales and
Marketing Alexander Luiga, Human
Resources Ruben Tomassoni, Sourcing and
Procurement Heikki Viika, President and CEO
AUDITORSThe Annual General Meeting appointed KPMG Oy Ab as Efore’s auditors, with Authorized Public Accountant Henrik Holmbom as principal auditor.
SHARE, SHARE CAPITAL AND SHAREHOLDERSAt the end of the financial year the number of the Group’s own shares was 3,501,995 pcs.
The highest share price during the financial year was EUR 0.90 and the lowest price was EUR 0.70. The average price during the financial year was
Product development costs, MEUR
108420 6
2013
2014
2015
Gross investments, MEUR
5210 43
2013
2014
2015
Return on equity (ROE), %
0-5-10-15-20-25
2013
2014
2015
-11.8
-23.7
-16.8
8.9
9.0 4.5
7.7
4.1
3.3
16 EFORE ANNUAL REPORT 2015
FINANCIAL STATEMENTS
EUR 0.78 and the closing price was EUR 0.77. The market capitalization calculated at the final trading price during the financial year was EUR 40.2 million.
The total number of Efore shares traded on the Nasdaq Helsinki during the financial year was 11.2 million pcs and their turnover value was EUR 8.7 million. This accounted for 20.0% of the total number of shares 55,772,891 pcs. The number of shareholders totalled 2,704 (2,819) at the end of the financial year.
NOTIFICATIONS OF CHANGE IN SHARE HOLDINGSThere have been no disclosed notifications on changes in major holdings during 2015.
BOARD AUTHORIZATIONS
Authorizing the Board of Directors to resolve on the acquisition of the company’s own sharesEfore’s Annual General Meeting on March 31, 2015 decided in accordance with the proposal of the Board of Directors, to authorize the Board of Directors to resolve on the acquisition of the company’s own shares or their acceptance as pledge, in one or several instalments, on the following terms and conditions:
Based on the authorization an aggregate maximum of 4,000,000 own shares corresponding to approximately 7,2% of all the shares in the company may be acquired. Shares in the company may be acquired only by using the company’s unrestricted equity. The
shares may be acquired in public trading arranged by the NASDAQ Helsinki Oy at the prevailing market price on the date of acquisition, or at a price otherwise formed on the market. The Board of Directors resolves the manner in which own shares are acquired or accepted as a pledge. The acquisition may be made using, inter alia, derivatives. Shares may be acquired otherwise than in proportion to the holdings of the shareholders (directed acquisition).
The authorization cancels the authorization given by the Annual General Meeting on April 10, 2014 to resolve on the acquisition of the company’s own shares.
The authorization is valid until June 30, 2016.
The Board did not use the authorization in 2015.
Authorizing the Board of Directors to decide on the issue of shares as well as the issue of options and other special rights entitling to sharesEfore’s Annual General Meeting on March 31, 2015 decided in accordance with the proposal of the Board of Directors, to authorize the Board of Directors to, in one or more transactions, decide on the issuance of shares and the issuance of options and other special rights entitling to shares referred to in chapter 10 section 1 of the Companies Act as follows:
The number of shares to be issued based on the authorization may in total amount to a maximum of 5,000,000
shares, corresponding to approximately 9.0% of all the shares in the company.
The Board of Directors decides on all the terms and conditions of the issuances of shares and special rights entitling to shares. The authorization concerns both the issuance of new shares as well as the transfer of treasury shares. The issuance of shares and special rights entitling to shares may be carried out in deviation from the shareholders’ preemptive rights (directed issue).
The authorization cancels the authorization given by the Annual General Meeting on April 10, 2014 to decide on the issuance of shares and special rights entitling to shares.
The authorization is valid until June 30, 2016.
The Board of Directors did not use the authorization in 2015.
ACCOUNTING POLICIESThe report has been drawn up in accordance with IAS 34 Standard on Interim Financial Reporting and the Group’s accounting principles presented in the 2014 annual report. In addition, Efore Plc has adopted new and or amended IFRSstandards. These changes have no major effect on the report. The information in this release is unaudited.
All the figures in the report have been rounded up/down, for which reason the total of the individual figures when added together may be different from the total shown.
SHORT-TERM RISKS AND FACTORS OF UNCERTAINTY The market typical fluctuation in demand can cause rapid changes in Efore’s business. Business risks are related to the success of key customers in their markets and to Efore’s delivery capability for the key customers.
Progress of Efore’s product development projects depends on the customers’ own project schedules and the establishment of the whole market.
Expanding the company’s product range to standard products in industrial sector means growth of product liability risk. It has been recognized that global economic development may have an effect on Efore’s business environment.
The company actively monitors possible impacts of risks on both financing and liquidity.
A more comprehensive report on risk management is presented on the company’s websites.
RISK MANAGEMENTThe purpose of Efore’s risk management system is to identify the strategic, operational and financial risks faced by the company and any conventional risks of loss. The risks that Efore takes in its operations are risks that are encountered in pursuit of the company’s strategy and goals. Risk management seeks to control these risks in a proactive and comprehensive manner. The measures taken can include risk avoidance, risk reduction, and risk transfer by insurance or agreement.
17 EFORE ANNUAL REPORT 2015
FINANCIAL STATEMENTS

MANAGEMENT OF BUSINESS RISKSIn accordance with Efore’s operating principles, risk management forms an integral part of the company’s business processes in all its operational units. Efore Group and its operational units assess the risks of their own operations, prepare risk management plans, and report risks in accordance with the organizational structure. Efore group defines Business Continuity plan, which is reviewed yearly.
Efore’s operational units have longestablished training and development programs for reducing occupational accidents and improving overall safety levels. Environmental management systems based on the ISO 14001:2004 standard and quality management tools based on ISO 9001/2000 are applied in the Group’s different business locations and form the basis for the management of environmental risks.
There are separate guidelines for data and corporate security. Risk management in procurement is based on harmonized purchasing guidelines, contract clauses, and advanced data systems.
RISK OF LOSSEfore aims to prevent losses by observing the highest standards in its operations and taking proactive risk management measures. Risks that Efore cannot manage itself are insured. The aim is to have appropriate insurance cover for all risks of loss, such as those concerning assets, business interruption, and operational and product liability.
MANAGEMENT OF FINANCING RISKS The principles and aims of the Group’s management of financing risks is determined in the financing risk policy, which, if necessary is updated and confirmed by the Board of Directors. The management of financing risks aims at avoiding risks and costeffective arrangements for protecting the Group from factors that may affect its performance and cash flow.
Financing risks are managed through exchangerate and interestrate hedging using only financial instruments with a market value and risk profile that can be reliably monitored. Management of financing risks can be found on Notes to the consolidated financial statements, 27.
LONG-TERM TARGETSEfore Group’s long term financial target is to reach 10% EBIT level and an average annual net sales growth of 5–10%. Target is to grow especially in industrial sector. Market driven product platforms and efficient R&D investment utilization are key factors to support group’s target to improve profitability.
Efore does not consider the long term targets as market guidance for any given year. It will issue separate financial estimate.
CHANGES IN REPORTING PRACTICEAs a consequence of the new stock exchange rules valid from December 1, 2015, Efore changes its reporting prac
tice and will not prepare three and nine month interim reports from now on.
Efore Plc will disclose the following financial reports in 2016: Financial Statements Bulletin 2015:
February 12, 2016 Half year 2016 (January 1, 2016–June
30, 2016): August 10, 2016The Annual General Meeting will be held on March 30, 2016. The Annual Report for 2015 will be published during week 10 in 2016.
OUTLOOK During the last years the group has reached in to new markets enabling better opportunities for growth. The products based on the LTE (4G) technology are in a key role in network expansions and Efore has a strong position in this development. The network market is predicted to remain stable in 2016. There is a trend towards smaller base stations where Efore also focuses product development investments.
Power supplies for LED lighting, instrumentation, medical equipment and infrastructure offer several growth areas for Efore in the industrial sector. Efore focuses on expanding its product selection and on increasing its customer base especially in the segments where high reliability is required, where market fluctuations are lower and product lifecycles are longer.
Factors of uncertainty have been presented in the section “Shortterm risks and factors of uncertainty”.
BOARD OF DIRECTORS’ PROPOSAL FOR THE ANNUAL GENERAL MEETINGThe Board of Directors will propose to the Annual General Meeting on March 30, 2016 that no dividend will be distributed.
18 EFORE ANNUAL REPORT 2015
FINANCIAL STATEMENTS
CONSOLIDATED INCOME STATEMENT, EUR 1,000Note Jan. 1,–Dec. 31, 2015 Jan. 1,–Dec. 31, 2014
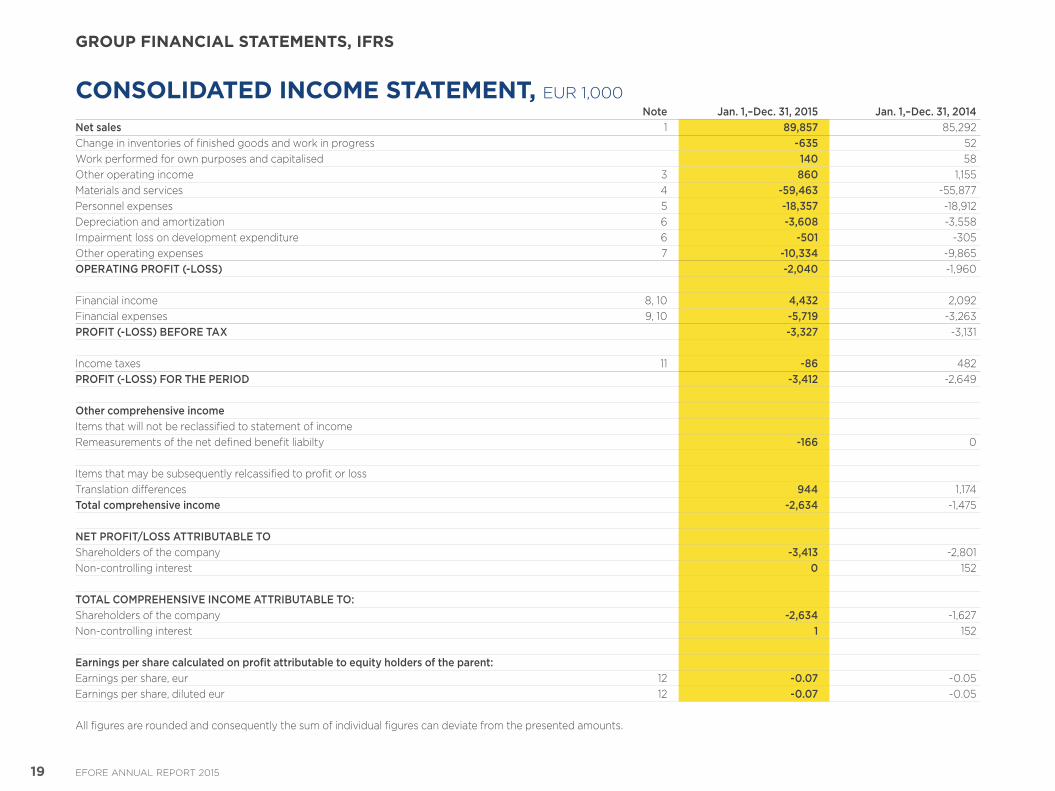
Net sales 1 89,857 85,292Change in inventories of finished goods and work in progress -635 52Work performed for own purposes and capitalised 140 58Other operating income 3 860 1,155Materials and services 4 -59,463 55,877Personnel expenses 5 -18,357 18,912Depreciation and amortization 6 -3,608 3,558Impairment loss on development expenditure 6 -501 305Other operating expenses 7 -10,334 9,865OPERATING PROFIT (-LOSS) -2,040 1,960
Financial income 8, 10 4,432 2,092Financial expenses 9, 10 -5,719 3,263PROFIT (-LOSS) BEFORE TAX -3,327 3,131
Income taxes 11 -86 482PROFIT (-LOSS) FOR THE PERIOD -3,412 2,649
Other comprehensive incomeItems that will not be reclassified to statement of incomeRemeasurements of the net defined benefit liabilty -166 0
Items that may be subsequently relcassified to profit or lossTranslation differences 944 1,174Total comprehensive income -2,634 1,475
NET PROFIT/LOSS ATTRIBUTABLE TOShareholders of the company -3,413 2,801Noncontrolling interest 0 152
TOTAL COMPREHENSIVE INCOME ATTRIBUTABLE TO:Shareholders of the company -2,634 1,627Noncontrolling interest 1 152
Earnings per share calculated on profit attributable to equity holders of the parent:Earnings per share, eur 12 -0.07 0.05Earnings per share, diluted eur 12 -0.07 0.05
All figures are rounded and consequently the sum of individual figures can deviate from the presented amounts.
19 EFORE ANNUAL REPORT 2015
GROUP FINANCIAL STATEMENTS, IFRS
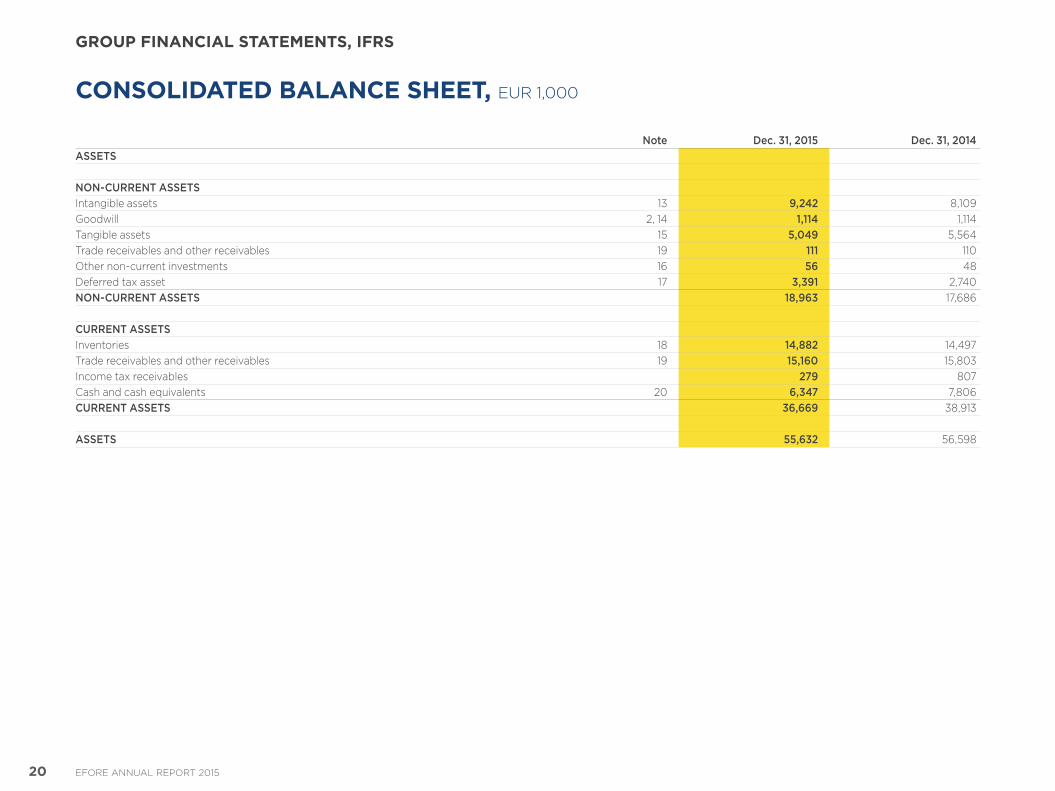
CONSOLIDATED BALANCE SHEET, EUR 1,000
Note Dec. 31, 2015 Dec. 31, 2014ASSETS
NON-CURRENT ASSETSIntangible assets 13 9,242 8,109Goodwill 2, 14 1,114 1,114Tangible assets 15 5,049 5,564Trade receivables and other receivables 19 111 110Other noncurrent investments 16 56 48Deferred tax asset 17 3,391 2,740NON-CURRENT ASSETS 18,963 17,686
CURRENT ASSETSInventories 18 14,882 14,497Trade receivables and other receivables 19 15,160 15,803Income tax receivables 279 807Cash and cash equivalents 20 6,347 7,806CURRENT ASSETS 36,669 38,913
ASSETS 55,632 56,598
20 EFORE ANNUAL REPORT 2015
GROUP FINANCIAL STATEMENTS, IFRS
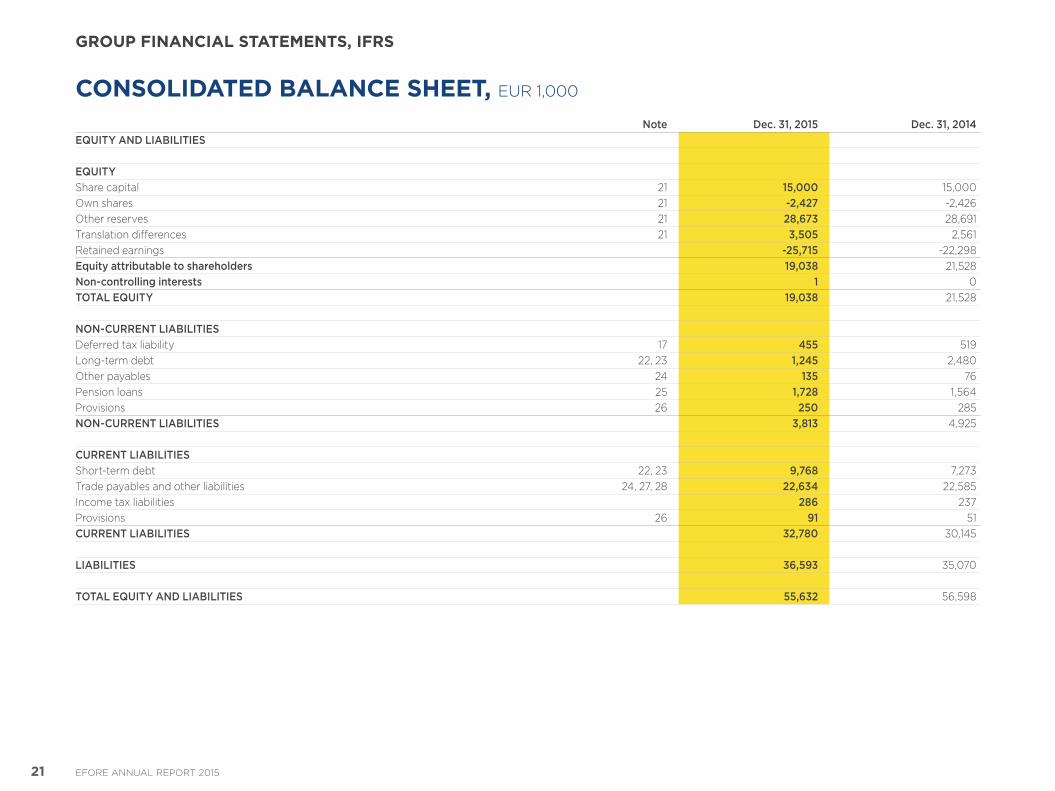
CONSOLIDATED BALANCE SHEET, EUR 1,000
Note Dec. 31, 2015 Dec. 31, 2014EQUITY AND LIABILITIES
EQUITYShare capital 21 15,000 15,000Own shares 21 -2,427 2,426Other reserves 21 28,673 28,691Translation differences 21 3,505 2,561Retained earnings -25,715 22,298Equity attributable to shareholders 19,038 21,528Non-controlling interests 1 0TOTAL EQUITY 19,038 21,528
NON-CURRENT LIABILITIESDeferred tax liability 17 455 519Longterm debt 22, 23 1,245 2,480Other payables 24 135 76Pension loans 25 1,728 1,564Provisions 26 250 285NON-CURRENT LIABILITIES 3,813 4,925
CURRENT LIABILITIESShortterm debt 22, 23 9,768 7,273Trade payables and other liabilities 24, 27, 28 22,634 22,585Income tax liabilities 286 237Provisions 26 91 51CURRENT LIABILITIES 32,780 30,145
LIABILITIES 36,593 35,070
TOTAL EQUITY AND LIABILITIES 55,632 56,598
21 EFORE ANNUAL REPORT 2015
GROUP FINANCIAL STATEMENTS, IFRS
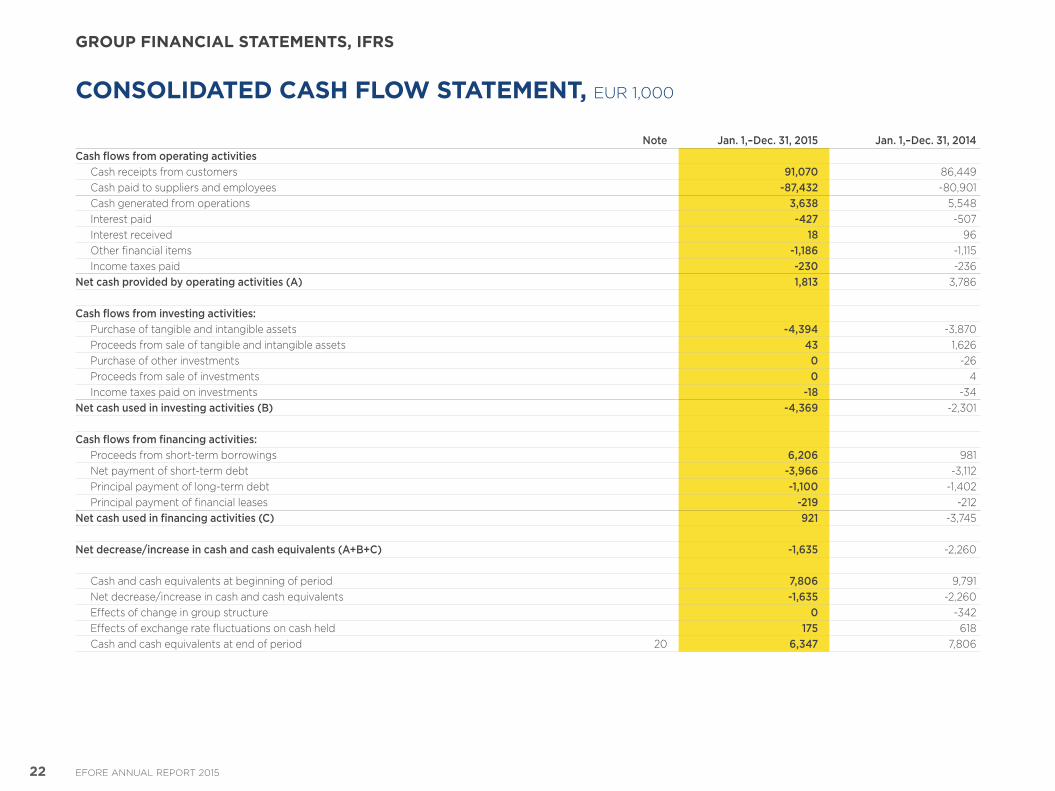
CONSOLIDATED CASH FLOW STATEMENT, EUR 1,000
Note Jan. 1,–Dec. 31, 2015 Jan. 1,–Dec. 31, 2014 Cash flows from operating activities
Cash receipts from customers 91,070 86,449Cash paid to suppliers and employees -87,432 80,901Cash generated from operations 3,638 5,548Interest paid -427 507Interest received 18 96Other financial items -1,186 1,115Income taxes paid -230 236
Net cash provided by operating activities (A) 1,813 3,786
Cash flows from investing activities:Purchase of tangible and intangible assets -4,394 3,870Proceeds from sale of tangible and intangible assets 43 1,626Purchase of other investments 0 26Proceeds from sale of investments 0 4Income taxes paid on investments -18 34
Net cash used in investing activities (B) -4,369 2,301
Cash flows from financing activities:Proceeds from shortterm borrowings 6,206 981Net payment of shortterm debt -3,966 3,112Principal payment of longterm debt -1,100 1,402Principal payment of financial leases -219 212
Net cash used in financing activities (C) 921 3,745
Net decrease/increase in cash and cash equivalents (A+B+C) -1,635 2,260
Cash and cash equivalents at beginning of period 7,806 9,791Net decrease/increase in cash and cash equivalents -1,635 2,260Effects of change in group structure 0 342Effects of exchange rate fluctuations on cash held 175 618Cash and cash equivalents at end of period 20 6,347 7,806
22 EFORE ANNUAL REPORT 2015
GROUP FINANCIAL STATEMENTS, IFRS
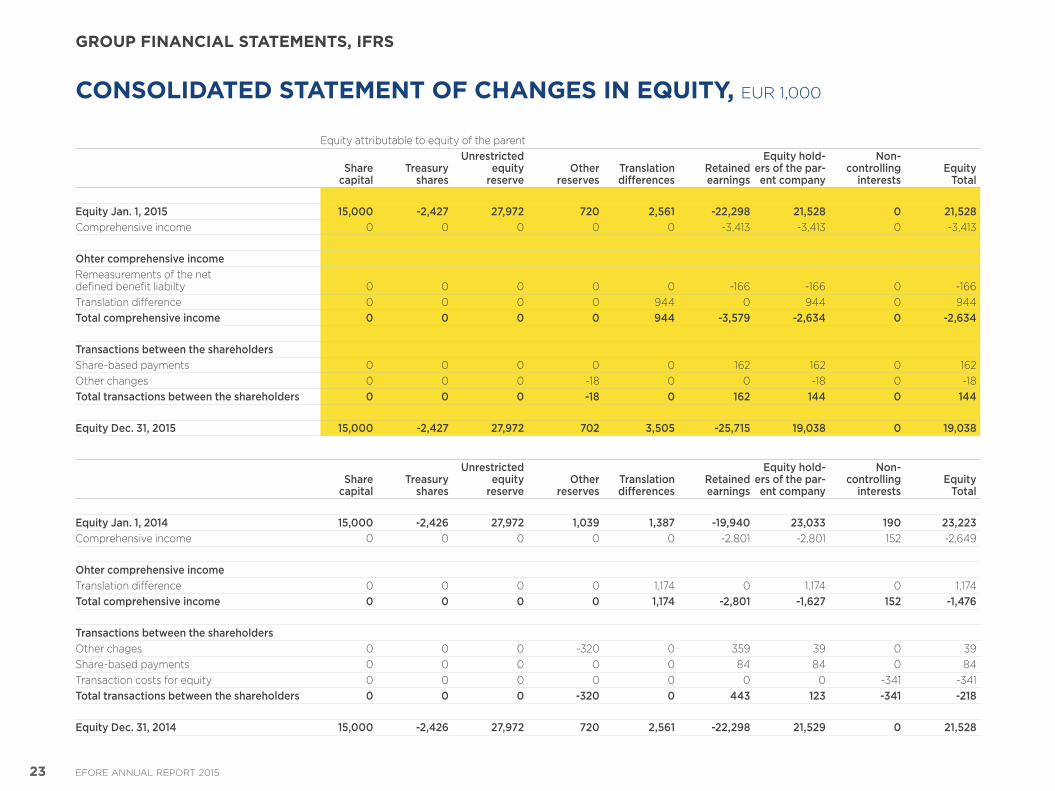
CONSOLIDATED STATEMENT OF CHANGES IN EQUITY, EUR 1,000
Equity attributable to equity of the parent
Share capital
Treasury shares
Unrestricted equity
reserveOther
reservesTranslation differences
Retained earnings
Equity hold-ers of the par-ent company
Non- controlling
interestsEquity
Total
Equity Jan. 1, 2015 15,000 -2,427 27,972 720 2,561 -22,298 21,528 0 21,528Comprehensive income 0 0 0 0 0 3,413 3,413 0 3,413
Ohter comprehensive income Remeasurements of the net defined benefit liabilty 0 0 0 0 0 166 166 0 166Translation difference 0 0 0 0 944 0 944 0 944Total comprehensive income 0 0 0 0 944 -3,579 -2,634 0 -2,634
Transactions between the shareholdersSharebased payments 0 0 0 0 0 162 162 0 162Other changes 0 0 0 18 0 0 18 0 18Total transactions between the shareholders 0 0 0 -18 0 162 144 0 144
Equity Dec. 31, 2015 15,000 -2,427 27,972 702 3,505 -25,715 19,038 0 19,038
Share capital
Treasury shares
Unrestricted equity
reserveOther
reservesTranslation differences
Retained earnings
Equity hold-ers of the par-ent company
Non- controlling
interestsEquity
Total
Equity Jan. 1, 2014 15,000 -2,426 27,972 1,039 1,387 -19,940 23,033 190 23,223Comprehensive income 0 0 0 0 0 2,801 2,801 152 2,649
Ohter comprehensive income Translation difference 0 0 0 0 1,174 0 1,174 0 1,174Total comprehensive income 0 0 0 0 1,174 -2,801 -1,627 152 -1,476
Transactions between the shareholdersOther chages 0 0 0 320 0 359 39 0 39Sharebased payments 0 0 0 0 0 84 84 0 84Transaction costs for equity 0 0 0 0 0 0 0 341 341Total transactions between the shareholders 0 0 0 -320 0 443 123 -341 -218
Equity Dec. 31, 2014 15,000 -2,426 27,972 720 2,561 -22,298 21,529 0 21,528
23 EFORE ANNUAL REPORT 2015
GROUP FINANCIAL STATEMENTS, IFRS
NOTES TO THE CONSOLIDATED FINANCIAL STATEMENTS
BASIC INFORMATION Efore Group is an international company providing services for the ICT and industrial automation industries. Its operations comprise customdesigned power supply solutions, power systems, manufacturing of demanding electronics, and related service and maintenance.
Efore has its headquarters in Espoo, Finland. The Group has product development and marketing units in Finland, China, Sweden, United States and Italy. The production units in the Group are located in China and Tunisia. The parent company Efore Plc and the head office is in Espoo, Finland (registered address Linnoitustie 4 B, 02600 Espoo, Finland). The shares of Efore Plc have been quoted on the NASDAQ OMX Helsinki Stock Exchange since 1989. Copies of the consolidated financial statements are available online at www.efore.com or from the parent company headquarters at the address above.
The consolidated financial statements were authorized for issue by the Board of Directors of Efore Plc on February 11th 2016. In accordance with Finnish Company Law the shareholders can either approve, amend or reject the financial statements in the Annual General Meeting held after publishing the financial statements.
ACCOUNTING PRINCIPLES FOR THE CONSOLIDATED FINANCIAL STATEMENTS
BASIS FOR PREPARATIONThe consolidated financial statements for the financial period January 1,2015 to December 31, 2015 are prepared in accordance with the International Financial Reporting Standards (IFRSs) complying with the IAS and IFRS standards as well as the SIC and IFRIC interpretations in force on December 31, 2015. In the Finnish Accounting legislation based on the provisions of the Act, IFRSs refer to the standards and to their interpretations adopted in accordance with the procedures laid down in the EU regulation (EC) No 1606/2002. Notes to the consolidated financial statements are also in accordance with the Finnish accounting and company legislation.
At the time for preparing the financial statements there are no commercial nor financial risks that, when realized, would risk the continuity of the operations.
The consolidated financial statements are prepared under the historical cost convention except for financial assets and financial liabilities, which are recognized at fair value through profit or loss, derivative financial instruments and sharebased payments are measured at fair value at the grant date. Unless otherwise stated, all the figures in these
financial statements are presented in thousands of euros.
NEW AND AMENDED STANDARDS APPLIED IN FINANCIAL YEAR ENDEDEfore Group has applied as from 1 January 2015 the following new and amended standards that have come into effect: • Amendments to IAS 19 Employee
Benefits Defined Benefit Plans: Employee Contributions (effective for financial years beginning on or after 1 July 2014): The amendments clarify the accounting treatment under IAS 19 in respect of defined benefit plans that involve contributions from employees or third parties towards the cost of benefits. The amendments are not assessed to have an impact on the consolidated financial statements of Efore.
• Annual Improvements to IFRSs (2011–2013 cycle and 2010–2012 cycle) (effective for financial years beginning on or after 1 July 2014): The annual improvements process provides a mechanism for minor and nonurgent amendments to IFRSs to be grouped together and issued in one package annually. The amendments cover in total four (2011–2013 cycle) and seven (2010–2012 cycle) standards. Their
impacts vary standard by standard but are not significant.
• IFRIC 21 Levies (effective for financial years beginning on or after 1 January 2014; in the EU to be applied at the latest, as from the commencement date of its first financial year starting on or after 17 June 2014): The interpretation clarifies the accounting treatment of levies. A liability for a levy is recognized when the activity that triggers payment, as identified by the relevant legislation, occurs. The interpretation is applicable to all levies other than income taxes, fines, penalties and outflows that are in scope of other standards. The interpretation had no significant impact on the consolidated financial statements of Efore.
SUBSIDIARIESThe consolidated financial statements includes the financial statements of the parent company Efore Plc and its subsidiaries. Subsidiaries are companies in which Efore Plc holds, through direct or indirect shareholding, over 50% of the voting rights or in which it has the position to govern the financial and operating policies (control). Potential voting rights have been taken into account in assessment whether the control exists, when such instruments are exercisable at the balance sheet date.
24 EFORE ANNUAL REPORT 2015
NOTES TO THE GROUP FINANCIAL STATEMENTS, IFRS
Mutual shareholdings are eliminated using the acquisition method. Subsidiaries are consolidated from the date when the Group acquired control commences and are included upto the date control ceases.
All intercompany transactions, receivables, liabilities, unrealized gains or losses on intercompany transactions and distribution of profits within the Group are eliminated in the consolidation process. Unrealized losses due to impairment are not eliminated. The distribution of profit or loss for the financial period to the shareholders of the parent company is disclosed in the statement of income.
ASSOCIATED COMPANIESAssociated companies, in which the Group holds, through direct or indirect shareholding, usually between 20% and 50% of the voting rights and in which it exercises significant influence but not control, are consolidated using the equity method. If the Group’s share of the associated company’s losses exceeds the acquisition cost of the company, the investment has no value in the balance sheet. No consideration is given to losses in excess of the acquisition amount unless the Group has other obligations relating to the associated company. Unrealized profits between Efore and its associates are eliminated in proportion to the share ownership. The profit or loss for the associated companies in the Group is presented as a separate line below operating profit. In the end of the fis
cal year 31th December 2015 and 31th December 2014 there were no associated companies in the group.
FOREIGN CURRENCY TRANSLATIONFigures for the performance and financial position of the Group entities are recorded at the currency that is primary used in the operating environment of the entities (functional currency). The consolidated financial statements are presented in euros, which is the functional and presentation currency for the parent company.
Foreign currency transactionsForeign currency transactions are translated into the respective functional currencies using the exchange rates at the date of the transaction. In practice, an exchange rate that approximates the rate at the date of the transaction is often used. Monetary foreign currency balances at the balance sheet date are translated into functional currency using the exchange rates prevailing at the balance sheet date. Nonmonetary foreign currency item recognised at fair value are translated into functional currency using the exchange rates at the dates when the fair value was calculated. Otherwise nonmonetary items are translated using the exchange rate at the transaction date. Gains and losses arising from foreign currency transactions and translation of monetary balances are recognized in profit or loss.
Exchange rate differences arising from the translation of balance sheet
items in foreign currency and sales, purchases, expenses and financial items as well as from intragroup receivables and liabilities are recognised as exchange rate gains and losses in financial income and expenses. Exchange rate differences arising from the hedging of net positions in foreign currency are recognised as financial items.
Translation of the financial statements of the foreign group companiesThe statements of income of the foreign group companies are translated into euro at the average exchange rate of the average rates of the European Central Bank for the calendar months in the financial period, while the balance sheets are translated at the exchange rates at the balance sheet date. The use of different exchange rates for translating the result for income statement and balance sheet results in translation differences, which are recognized in equity. Translation differences arising from the elimination of the cost of foreign subsidiaries and from the translation of the accumulated postacquisition equity balances are recognized in equity. At disposal of a subsidiary, the relevant accumulated translation differences are transferred to profit or loss as part of the gain or loss on the sale. Translation differences due to consolidation are presented in equity as a separate item.
Property, plant and equipmentProperty, plant and equipment are stated at historical cost less accumulated depreciation and impairment losses.
At disposal of an item of the property, plant and equipment may consist of several parts with different useful lives, that are in accounting treated as separate items. In such cases, replacement of such an item is capitalized and the carrying amount of the replaced parts is expensed. In other situations subsequent costs are recognised in the carrying amount of the property, plant and equipment only if it is probable that the future income of the item will profit the Group and the cost of the item can be determined reliably. Normal maintenance, repair and renewal costs are expensed as incurred. Land and water are not depreciated.
Property, plant and equipment are depreciated on a straightline basis over the estimated economic lives of the assets. The estimated useful lives are as follows:Buildings and constructions 20–40 yearsMachinery and equipment 3–10 yearsOther tangible assets 5 years
Other tangible assets includes improvement expenditure in rental premises. The residual values and useful lives are reviewed at least annually at yearend and where they differ from previous estimates, depreciation periods are changed accordingly to reflect changes
25 EFORE ANNUAL REPORT 2015
NOTES TO THE GROUP FINANCIAL STATEMENTS, IFRS
in the expectations of future economic lives.
Gains and losses on scrapping and disposal of property, plant and equipment is recorded in other operating income or expenses.
Depreciation ends when the item of property, plant or equipment is classified as a noncurrent asset held for sale in accordance with IFRS 5 Noncurrent Assets Held for Sale and Discontinued Operations.
GOVERNMENT GRANTSThe recognition method for grants received from the Government or other entities subject to public law depends on the nature of the grant. Grants relating to expenses incurred are recognised as revenue in other operating income when the expenses occur. Grants relating to the acquisition of property, plant and equipment are deducted from the cost of the asset. The latter grants are recognised as income through lower depreciation and amortization charge during the useful lives of the asset. Government grants are recognised when there is reasonable assurance that the grants are received and the Group company complies with the conditions associated with them.
INTANGIBLE ASSETS
GoodwillGoodwill from business combinations is the excess of the cost over the net identifiable assets, liabilities and con
tingent liabilities measured at fair value. Goodwill is not amortized, it is subject to an annual procedure of impairment testing. The testing is done more frequent if there is indications that it might be impaired. For this purpose goodwill is allocated to the cash generating units “CGU” it relates to. An impairment loss is recognized in the consolidated income statement, if the impairment test shows that the carrying amount of the goodwill exceeds the estimated recoverable amount, and the carrying amount is reduced to the recoverable amount. Impairment losses on goodwill cannot be reversed.
Research and development costResearch cost is recognized as an expense in profit or loss. Development expenditure arising from designing new or more advanced products are capitalized in the balance sheet as intangible assets from the moment the product is technically feasible, it can be applied commercially and it is expected to generate future economic benefits. Capitalized development costs comprise the material, labour and testing cost that are directly attributable to the process of completing the product for its intended use.
The development process proceeds gradually including seven predefined milestones and four gate assessments. The gate assessments are approved by the management team. The capitalization of development costs in Efore starts when the management team
concludes that the capitalization conditions in IAS 38 are met.
An asset is amortized from the date it is available for use. An asset that is not yet available for use is tested annually for impairment. Capitalized development costs are recognised subsequently at cost less accumulated amortization and impairment. Capitalized development costs are amortised on a straightline basis over their useful life of 3–5 years.
INTANGIBLE RIGHTSThe intangible rights included licences concerning for IT software .
Intangible assets (finance lease)Intangible assets finance lease consists of the capitalized value of finance lease for IT software.
Other intangible assetsOther intangible assets comprise the capitalized costs concerning IT projects. An intangible asset is initially stated at cost if the cost can be recorded reliably, and the expected future profits are probable.
Intangible assets are amortized on a straightline basis over their expected useful lives. Intangible assets with indefinite useful lives are not amortized but tested annually for impairment.
Other intangible assets may also contain intangible assets acquired through business acquisitions such as intangible assets related to customer relations and product rights.
Amortisation periods for the other intangible assets are as follows:Customer relationships 7 yearsProduct rights 7 yearsDevelopment expenditure 3–5 yearsIntangible rights 5 yearsIntangible assets, financial lease 5 yearsOther intangible assets 3 years
NON-CURRENT ASSETS CLASSIFIED AS HELD FOR SALENoncurrent assets, and the disposal groups, as well as assets and liabilities relating to discontinued operations are classified as held for sale if their carrying amount will be recovered principally through a sale transaction rather than through continuing use. An asset is classified as held for sale when a disposal is highly probable and the asset , or the disposal group, is available for immediate sale in its present condition subject to usual and customary terms, when the management is committed to sell the asset and the sale is expected to be completed within one year from the date of classification. The assets held for sale, or the disposal group, is recognised at the lower of their carrying amount and disposable value. Depreciation and amortisation on these assets ends at the date of classification. Where IFRS 5 is not applicable on assets and liabilities in disposal groups the items are treated accordance to the applicable IFRS.
Assets classified as held for sale, disposal groups, items recognised directly
26 EFORE ANNUAL REPORT 2015
NOTES TO THE GROUP FINANCIAL STATEMENTS, IFRS
into equity and relating to the assets held for sale as well as liabilities relating to disposal groups are presented separately in the balance sheet.
INVENTORIESInventories are stated at the lower of historical cost or net realizable value. The cost of raw materials is calculated on the weighted average cost basis. The cost for finished goods and work in progress consists of raw materials, direct labour, other direct cost and an appropriate part of the variable and fixed production overheads based on the normal operating capacity. The net realizable value is the estimated sales price in the normal course of business less the cost of completion and realization. An allowance for excess inventory and obsolescence is recorded when the impairment occurs.
LEASES
Group as lesseeLeases of tangible and intangible assets, where the Group has substantially all the risks and rewards of the ownership are classified as finance leases. Finance leases are capitalized in the balance sheet at the fair value of the leased asset at the inception of the lease term or the lower present value of the minimum lease payments. An item acquired through of finance lease is depreciated or amortised over the shorter of the item’s useful life and the lease term. Lease payments are allocated between finance costs and reductions of the
lease liability during the lease term. The interest on the remaining liability is constant in each financial period. Lease obligations are included in the interestbearing liabilities.
Leases where the lessor retains the risks and rewards of the ownership are treated as operating leases. Payments under operating lease are expensed on a straightline basis during the lease term.
IMPAIRMENTS
Tangible and intangible assetsThe carrying values of assets are tested annually at the balance sheet date to identify any impairment. If indications of impairment exist, the recoverable amount of the asset is estimated. Estimation is also made concerning the recoverable amount for the following assets at least annually irrespective of whether there are any indications of impairment: intangible assets with indefinite useful lives and capitalized development expenditure (unfinished intangible assets). The need for impairment is considered at the lowest unit level for which separately identifiable, mainly independent, cash inflows and outflows can be defined the cashgenerating unit level.
The recoverable amount of the asset is the disposal value or the value in use. The value in use represents the discounted future net cash flows expected to be derived from an asset or a cashgenerating unit . The rate to discount is a pretax discount rate that reflecting
current market assessments and the risks specific to the asset.
Impairment loss is recognized when the carrying amount of an asset exceeds its recoverable amount. An impairment loss is recorded immediately in profit or loss. At recognition of the impairment loss the useful life of a depreciable or amortizable asset is reviewed. An impairment loss recognized on other assets than goodwill is reversed subsequently if there are changes in the estimates concerning the recoverable amount of the asset. The impairment loss to be reversed may, however, not exceed the carrying value the asset had before recognition of the impairment loss.
EMPLOYEE BENEFITS
Pension obligationsThe Group has entered into several pension schemes in different countries according to local regulations and practices. The pension schemes are classified as defined contribution plans. The Group pays fixed contributions to a separate entity and will have no legal or constructive obligation to pay further contributions if the payee of the contributions does not have sufficient assets to pay the pension benefits in question. Payments made into defined contribution pension plans are expensed in the period to which they apply.
Defined benefit obligationsThe group has as a result of the acquisition of the Italian subsidiary a defined
benefit obligation, which is due when employment of the employees covered ceases in the future. The related liability is recognised in the consolidated balance sheet. The valuation of this liability is based on actuarial calculations. The contributions to the fund are recognised as personnel expenses in the income statement and the interest cost as financial expense. Remeasurements of the fund are recognized in equity.
Share-based paymentsThe sharebased incentive programmes are recognized at fair value on the grant date and expensed on a straightline basis over the vesting period with corresponding entry in retained earnings in equity. The effect on profit or loss is included in employee benefit expenses in the personnel expenses line. The expense determined on the grant date is based on an estimate of the number of options to be vested at the end of the vesting period. The fair value is determined using the BlackScholes optionpricing model. The estimate of the final number of options is revised at each balance sheet date. The effect of changes in estimates is recognized in profit or loss. The assumptions and estimates made when determining the fair value relate to expected dividend yield, volatility and maturity of the options among other conditions. Nonmarket conditions such as profitability and certain targets for profit growth are not taken into account when estimating the fair value of an option, but they do
27 EFORE ANNUAL REPORT 2015
NOTES TO THE GROUP FINANCIAL STATEMENTS, IFRS
affect the estimates of the final number of options.
When option rights are exercised, the subscriptionbased payments, adjusted by possible transaction costs, are recognized in equity. Payments received for subscriptions of shares, based on options granted prior to the new Limited Liability Companies Act in force since September 1, 2006, have been recognized according to the terms of the programme in share capital and share premium account. On June 17, 2014 the Board of Directors issued a new stock option plan. Each stock option entitles the holder to subscribe for one (1) new share in Efore Plc. The share subscription periods for the stock options issued are the following: Option A: August 1, 2016–July 31, 2018 (500,000 options), Option B: August 1, 2017–July 31, 2019 (500,000 options), Option C: August 1, 2018–July 31, 2020 (500,000 options). The shares subscribed for with the stock options equals to a maximum of 2.69 per cent of the total number of shares in the company.
In connection to the acquisition of the Italian subsidiary a sharebased incentive program was established for the key management in the acquired subsidiary. Any rewards based on this program are settled in both shares and cash. The vesting period in the program began on July,11 2013 and ends on June,30 2016 and the performance criteria is the share price development of Efore plc during the period. Further information concerning this program is
presented in note 20 to consolidated financial statements.
FINANCIAL ASSETS AND LIABILITIESThe financial assets are classified into the following categories: financial assets at fair value through profit or loss as well as loans and receivables. Financial assets are classified when initially acquired on the basis of the intended use. Acquisitions and sales of financial assets are recognized at the trade date. In the case of financial assets not held at fair value through profit or loss, the transaction cost is included in the cost. When a financial assets no longer generates income or when all the risks and rewards of the item are transferred substantially to an external party it is derecognized.
Financial assets at fair value through profit or lossIn Efore financial assets held for trading are classified into this category. Financial assets held for trading comprise quoted shares and funds acquired primarily for profit making from the shortterm fluctuations in market prices. Derivative financial instruments that neither are financial guarantees contracts nor qualify for hedge accounting are classified as held for trading. Both realized and unrealized gains and losses arising from fluctuations in market value are recognized in profit or loss as incurred. Financial assets held for trading are included in the current assets.
Loans and receivablesLoans and receivables are nonderivative financial assets with fixed or determinable payments. These are not quoted in an active market and the Group does not hold them for trading. Loans and receivables are valued at amortized cost. They are included in current or noncurrent financial assets depending on their maturity. At each balance sheet date the Group reviews objective evidence for the need for impairment recognition regarding both individual receivables and groups of receivables. The unrecoverable amount is assessed primarily on the basis of the risk involved in each item. An impairment loss is recognized as expense in profit or loss.
Trade receivables are recognised in the balance sheet at their original invoicing value and stated less any credit losses. The assessment of the amount of unrecoverable receivables and any need for impairment is based on the risk involved in each item. Trade receivables are recognised at their fair value at the highest. An impairment on trade receivables is recognized if there is objective evidence that the Group will not recover the receivables on original terms. The group recognizes impairment from trade receivables, when there is objective evidence that the receivable cannot be collected to full amount. Significant economic difficulties, probability of liquidation, default in payments or over 90 days delays in payment are evidence of impairment in trade receivables. The impairment
is recognized in income statement amounting to the difference between the carrying amount of the receivable and the present value of the estimated future cash discounted at the effective interest rate.
Credit losses recognized as an expense are included in other operating expenses.
Cash and cash equivalentsCash and cash equivalents comprise cash in hand, call deposits and other highly liquid current investments convertible to known amounts of cash, without significant risk of changes in value. Items qualifying as cash and cash equivalents have initial maturities of three months or less. Bank overdrafts relating to the cash pool accounts in the Group are included in current liabilities.
Financial liabilitiesEfore’s financial liabilities are classified into the following categories: financial liabilities at fair value through profit or loss and financial liabilities valuated at amortized cost. The firstmentioned category includes derivative financial liabilities and the latter loans from credit institutions. Financial liabilities are initially recognized at fair value. Transaction costs are included in the initial cost of the financial liabilities valuated at amortized cost. Financial liabilities are included in both noncurrent and current liabilities and can be either interestbearing or noninterestbearing. Financial liabilities are classified as current if the Group does not have an
28 EFORE ANNUAL REPORT 2015
NOTES TO THE GROUP FINANCIAL STATEMENTS, IFRS
unconditional right to defer the settlement of the liability for at least twelve months after the balance sheet date.
Both realized and unrealised exchange rate gains and losses are recognized in profit or loss in financial income and expenses as incurred. Financial costs concerning liabilities are expensed as incurred.
DERIVATIVE FINANCIAL INSTRUMENTSDerivative financial instruments are recognised both initially and subsequently at fair value. Derivatives are used in the group as hedges of risks related to the currency positions in the balance sheet. The Group does not, however, apply hedge accounting as specified in IAS 39. All gains and losses, both realised and unrealised, arising from the fair value changes of derivatives are recognised in profit or loss as incurred regardless of the fact that the hedged item has not an effect on profit or loss until in the future period. Changes in the fair value are reported in financial items in the income statement. Derivatives used for hedging against exchange rate risks are recorded as current receivables or liabilities in the balance sheet.
TRADE PAYABLESTrade payables are recognized to the initial invoiced amount, which reflects their fair value due to the short maturity of these payables.
PROVISIONSProvisions are recognized in the balance sheet when the Group has, as a result of a past event, a present legal or constructive obligation and the settlement is expected to occur and the amount of the obligation can be estimated reliably. Provisions may relate to restructuring costs, onerous contracts, legal cases and warranty costs, among other costs. A reimbursement from a third party relating to a part of the provision is recognised as a separate asset only when the reimbursement is virtually certain.
A warranty provision is recognized when the underlying product is sold. The amount of the provision is based on historical warranty information. Warranty provisions are expected to be used within two years. A restructuring provision is recognized when the Group has drawn up a detailed restructuring plan and the implementation of the plan has started or the plan is announced. A provision for onerous contracts is recognised when the minimum costs for meeting the contract obligation exceeds the expected income from the contract.
CONTINGENT ASSETS AND LIABILITIESContingent liabilities are potential obligations arising from past events where the existence will be confirmed at the occurrence of an uncertain event uncontrolled by the Group. Contingent liabilities are also the present obligations, even if a settlement will not prob
ably be required or the amount of the obligation cannot be estimated with sufficient certainty. Contingent liabilities are presented in the notes to the financial statement.
A contingent asset is a potential asset arising from past events where the existence of the asset will be confirmed at the occurrence of an uncertain event uncontrolled by the Group. A contingent assets is presented in the notes to the financial statements, if the settled income can be estimated with sufficient certainty.
INCOME TAXESAccrualbased taxes based on the taxable income are calculated in accordance with the local tax legislation and present tax rate in force for each company. Tax adjustments for prior years and changes in deferred taxes are recognized as income taxes in the consolidated income statement. Income tax relating to items charged or credited directly in equity is recognised in equity, respectively.
Deferred tax liabilities and assets are recognized due to the temporary differences between the carrying amounts in the balance sheet and tax bases of assets and liabilities of the Group companies and on the differences arising from Group eliminations. The tax rate used for determining the deferred tax liabilities and assets is the prevailing tax rate at the balance sheet date for the following year in the country in question. The most significant part of the total deferred tax receivable in
the Group consists of the tax losses in two subsidiaries. No deferred taxes are recognized for the undistributed profits in the subsidiaries, as this will unlikely affect group accounts in the foreseeable future.
Deferred tax liabilities are recognized at the full amount. Deferred tax assets are recognised only to the extent they are estimated to generate taxable income in future periods, and can be utilized against the temporary difference.
PRINCIPLES FOR REVENUE RECOGNITION Revenue from product sales is recognized when the significant risks and rewards of ownership are transferred to the buyer and the Group is no longer in possession of the products or has no control over them. Revenue is mainly recognised upon delivery in accordance with the terms of delivery of the products. Revenue from services is recognized in the financial period the services are rendered to the customer. Net sales is the revenue from sales deducted by discounts granted ans indirect taxes.
Interest income is recognized using effective interest rate method and dividend income is recorded when the right to receive dividend is appropriately authorized.
NON-RECURRING ITEMSNonrecurring items are highly infrequent and extraordinary income or expenses with material effect on the financial statements. Revaluations and reassessments are not treated as non
29 EFORE ANNUAL REPORT 2015
NOTES TO THE GROUP FINANCIAL STATEMENTS, IFRS
recurring items. Reassessments are for instance changes in depreciation plans or principles.
OPERATING PROFITThe Presentation of Financial Statements in IAS 1 does not define Operating Profit. The Group has the following definition: The operating profit is total net sales and other operating income deducted by expenses for materials and services adjusted by change in work in progress, manufacturing for own use, personnel costs, depreciation and amortization, impairment losses charges on noncurrent assets and other operating expenses. All other items in income statement are presented below operating profit.
CRITICAL ACCOUNTING JUDGMENTS AND ESTIMATES The management of the group makes decisions concerning the adoption and application of accounting principles. This concerns specially cases, where applicable IFRS standards allow alternative recognition, valuation or presentation. Decisions made by the management that relate e.g. to credit losses, deferred tax assets, obsolescence of inventories and provisions for guarantees are based on generally applied models and case by case estimates. Historical information and present management views of the markets are used in the models. Assessments of individual events are based on the best
available information when the financial statements are prepared.
Estimates made in the preparation of financial statements are based on the best view of the management at the balance sheet date. The estimates are based on experience and assumptions at the balance sheet date that relate to e.g. expected development of sales and cost levels in the economic environment of the group. The group follows the actual outcome of estimates and assumptions as well as changes in factors on a regular basis together with the business using several internal and external information sources. Potential adjustments in estimates and assumptions are recognized during the period of reassumption as well as in the following periods.
The major judgments and estimates relating to the uncertainties at the balance sheet date that have a significant risk of resulting in a material adjustment to the carrying amounts of assets and liabilities within the next financial year are presented below.
The management of the group has assessed that the following areas are most important concerning the accounting principles as the applicable accounting principles concerning these are the most complex and the application requires use of significant estimates and assessments, e,g. valuation of assets. Additionally, the effect of the estimates and assessments concerning these items are expected to be the most significant.
• useful life, and thus total depreciation / amortization periods, for different categories of intangible and tangible noncurrent assets,
• probability of future taxable profits against which tax deductible temporary differences can be utilized,
• net realizable value of inventories,• fair value (collectable amount) of
trade receivables,• fair value of assets acquired in busi
ness combinations and• future business estimates and other
elements of impairment testing.
Adoption of new and amended standards and interpretations applicable in future financial years
Efore has not yet adopted the following new and amended standards and interpretations already issued by the IASB. The Group will adopt them as of the effective date or, if the date is other than the first day of the financial year, from the beginning of the subsequent financial year. * = not yet endorsed for use by the European Union as of 31 December 2015.• Amendment to IAS 1 Presentation
of Financial Statements: Disclosure Initiative (effective for financial years beginning on or after 1 January 2016). The amendments are designed to encourage companies to apply judgement in determining what information to disclose in the financial statements. For example, the amendments clarify the application of the materiality concept and judgement when determin
ing where and in what order information is presented in the financial disclosures. The interpretation had no significant impact on the consolidated financial statements of Efore.
• Amendments to IFRS 10 Consolidated Financial Statements, IFRS 12 Disclosure of Interests in Other Entities and IAS 28 Investments in Associates and Joint Ventures: Investment Entities: Applying the Consolidation Exception* (the amendments can be applied immediately; mandatory for financial years beginning on or after 1 January 2016): The narrowscope amendments to IFRS 10, IFRS 12 and IAS 28 clarify the requirements when accounting for investment entities. The amendments also provide relief in particular circumstances, which will reduce the costs of applying the Standards. The amendments will not have an impact on the consolidated financial statements of Efore.
• Amendments to IFRS 11 Joint Arrangements Accounting for Acquisitions of Interests in Joint Operations (effective for financial years beginning on or after 1 January 2016): The amendments add new guidance to IFRS 11 on how to account for the acquisition of an interest in a joint operation that constitutes a business, i.e. business combination accounting is required to be applied. The amendments are not assessed to have an impact on the consolidated financial statements of Efore.
30 EFORE ANNUAL REPORT 2015
NOTES TO THE GROUP FINANCIAL STATEMENTS, IFRS
• Annual Improvements to IFRSs (2012–2014 cycle) (effective for financial years beginning on or after 1 January 2016): The annual improvements process provides a mechanism for minor and nonurgent amendments to IFRSs to be grouped together and issued in one package annually. The amendments cover in four standards. Their impacts vary standard by standard but are not significant.
• New IFRS 15 Revenue from Contracts with Customers* (effective for financial years beginning on or after 1 January 2018): IFRS 15 establishes a comprehensive framework for determining whether, how much and when revenue is recognised. It replaces existing revenue guidance, including IAS 18 Revenue, IAS 11 Construction Contracts and IFRIC 13 Customer Loyalty Programmes. Under IFRS 15 an entity shall recognise revenue in an amount that reflects the consideration to which the entity expects to be entitled in exchange for those goods or services. The Group is currently assessing the impact of IFRS 15.
• New IFRS 9 Financial Instruments* (effective for financial years beginning on or after 1 January 2018): IFRS 9 replaces the existing guidance in IAS 39 Financial Instruments: Recognition and Measurement. IFRS 9 includes revised guidance on the classification and measurement of financial instruments, including a new expected credit loss model for calculating impairment on financial
assets, and the new general hedge accounting requirements. It also carries forward the guidance on recognition and derecognition of financial instruments from IAS 39. The Group is assessing the impact of IFRS 9.
Other changes in IFRSstandards and IFRICinterpretations or new IFRIC interpretations are not expected to have significant effect on the future consolidated financial statements of Efore.
31 EFORE ANNUAL REPORT 2015
NOTES TO THE GROUP FINANCIAL STATEMENTS, IFRS
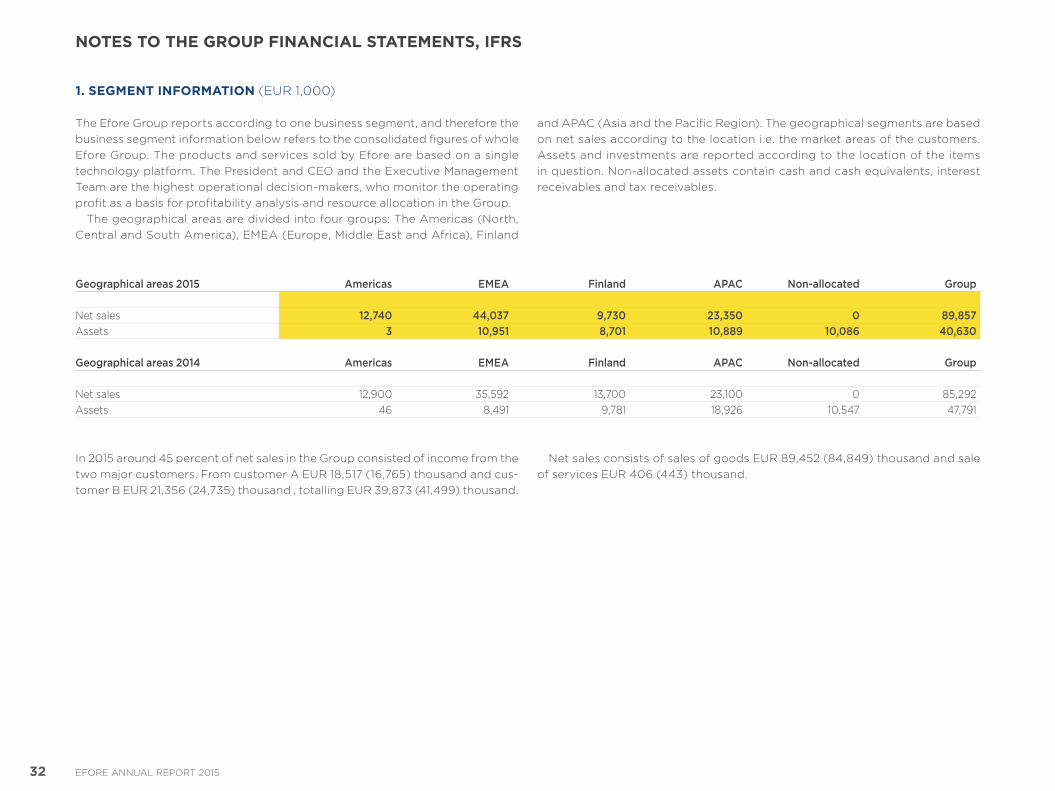
1. SEGMENT INFORMATION (EUR 1,000)
The Efore Group reports according to one business segment, and therefore the business segment information below refers to the consolidated figures of whole Efore Group. The products and services sold by Efore are based on a single technology platform. The President and CEO and the Executive Management Team are the highest operational decisionmakers, who monitor the operating profit as a basis for profitability analysis and resource allocation in the Group.
The geographical areas are divided into four groups: The Americas (North, Central and South America), EMEA (Europe, Middle East and Africa), Finland
and APAC (Asia and the Pacific Region). The geographical segments are based on net sales according to the location i.e. the market areas of the customers. Assets and investments are reported according to the location of the items in question. Nonallocated assets contain cash and cash equivalents, interest receivables and tax receivables.
Geographical areas 2015 Americas EMEA Finland APAC Non-allocated Group
Net sales 12,740 44,037 9,730 23,350 0 89,857Assets 3 10,951 8,701 10,889 10,086 40,630
Geographical areas 2014 Americas EMEA Finland APAC Non-allocated Group
Net sales 12,900 35,592 13,700 23,100 0 85,292Assets 46 8,491 9,781 18,926 10,547 47,791
In 2015 around 45 percent of net sales in the Group consisted of income from the two major customers. From customer A EUR 18,517 (16,765) thousand and customer B EUR 21,356 (24,735) thousand , totalling EUR 39,873 (41,499) thousand.
Net sales consists of sales of goods EUR 89,452 (84,849) thousand and sale of services EUR 406 (443) thousand.
32 EFORE ANNUAL REPORT 2015
NOTES TO THE GROUP FINANCIAL STATEMENTS, IFRS
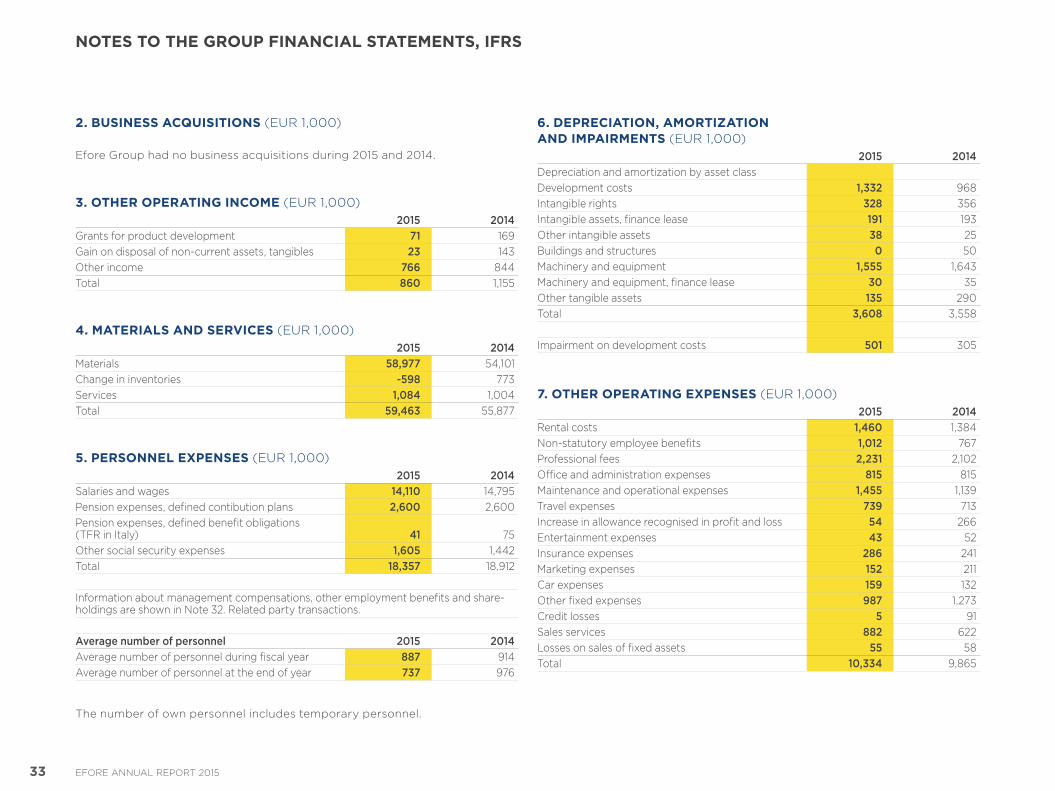
2. BUSINESS ACQUISITIONS (EUR 1,000)
Efore Group had no business acquisitions during 2015 and 2014.
3. OTHER OPERATING INCOME (EUR 1,000)2015 2014
Grants for product development 71 169Gain on disposal of noncurrent assets, tangibles 23 143Other income 766 844Total 860 1,155
4. MATERIALS AND SERVICES (EUR 1,000)2015 2014
Materials 58,977 54,101Change in inventories -598 773Services 1,084 1,004Total 59,463 55,877
5. PERSONNEL EXPENSES (EUR 1,000)2015 2014
Salaries and wages 14,110 14,795Pension expenses, defined contibution plans 2,600 2,600Pension expenses, defined benefit obligations (TFR in Italy) 41 75Other social security expenses 1,605 1,442Total 18,357 18,912
Information about management compensations, other employment benefits and shareholdings are shown in Note 32. Related party transactions.
Average number of personnel 2015 2014Average number of personnel during fiscal year 887 914Average number of personnel at the end of year 737 976
The number of own personnel includes temporary personnel.
6. DEPRECIATION, AMORTIZATION AND IMPAIRMENTS (EUR 1,000)
2015 2014Depreciation and amortization by asset classDevelopment costs 1,332 968Intangible rights 328 356Intangible assets, finance lease 191 193Other intangible assets 38 25Buildings and structures 0 50Machinery and equipment 1,555 1,643Machinery and equipment, finance lease 30 35Other tangible assets 135 290Total 3,608 3,558
Impairment on development costs 501 305
7. OTHER OPERATING EXPENSES (EUR 1,000)2015 2014
Rental costs 1,460 1,384Nonstatutory employee benefits 1,012 767Professional fees 2,231 2,102Office and administration expenses 815 815Maintenance and operational expenses 1,455 1,139Travel expenses 739 713Increase in allowance recognised in profit and loss 54 266Entertainment expenses 43 52Insurance expenses 286 241Marketing expenses 152 211Car expenses 159 132Other fixed expenses 987 1,273Credit losses 5 91Sales services 882 622Losses on sales of fixed assets 55 58Total 10,334 9,865
33 EFORE ANNUAL REPORT 2015
NOTES TO THE GROUP FINANCIAL STATEMENTS, IFRS
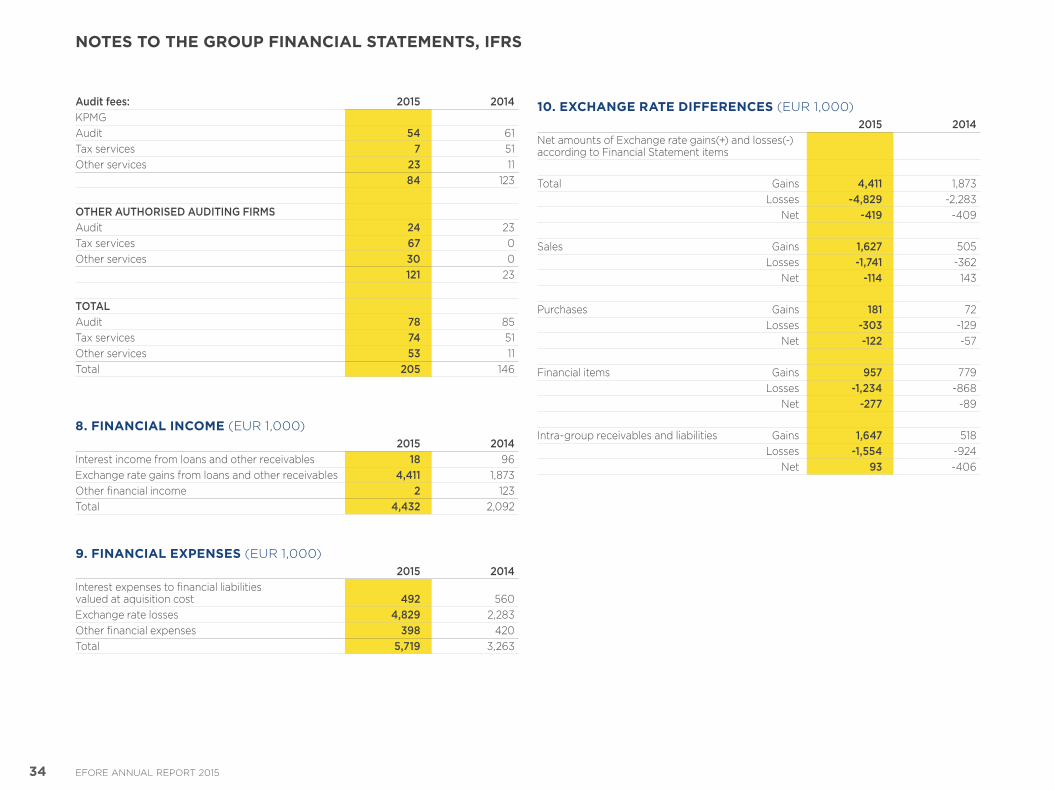
Audit fees: 2015 2014KPMGAudit 54 61Tax services 7 51Other services 23 11
84 123
OTHER AUTHORISED AUDITING FIRMSAudit 24 23Tax services 67 0Other services 30 0
121 23
TOTALAudit 78 85Tax services 74 51Other services 53 11Total 205 146
8. FINANCIAL INCOME (EUR 1,000)2015 2014
Interest income from loans and other receivables 18 96Exchange rate gains from loans and other receivables 4,411 1,873Other financial income 2 123Total 4,432 2,092
9. FINANCIAL EXPENSES (EUR 1,000)2015 2014
Interest expenses to financial liabilities valued at aquisition cost 492 560Exchange rate losses 4,829 2,283Other financial expenses 398 420Total 5,719 3,263
10. EXCHANGE RATE DIFFERENCES (EUR 1,000)2015 2014
Net amounts of Exchange rate gains(+) and losses() according to Financial Statement items
Total Gains 4,411 1,873Losses -4,829 2,283
Net -419 409
Sales Gains 1,627 505Losses -1,741 362
Net -114 143
Purchases Gains 181 72Losses -303 129
Net -122 57
Financial items Gains 957 779Losses -1,234 868
Net -277 89
Intragroup receivables and liabilities Gains 1,647 518Losses -1,554 924
Net 93 406
34 EFORE ANNUAL REPORT 2015
NOTES TO THE GROUP FINANCIAL STATEMENTS, IFRS
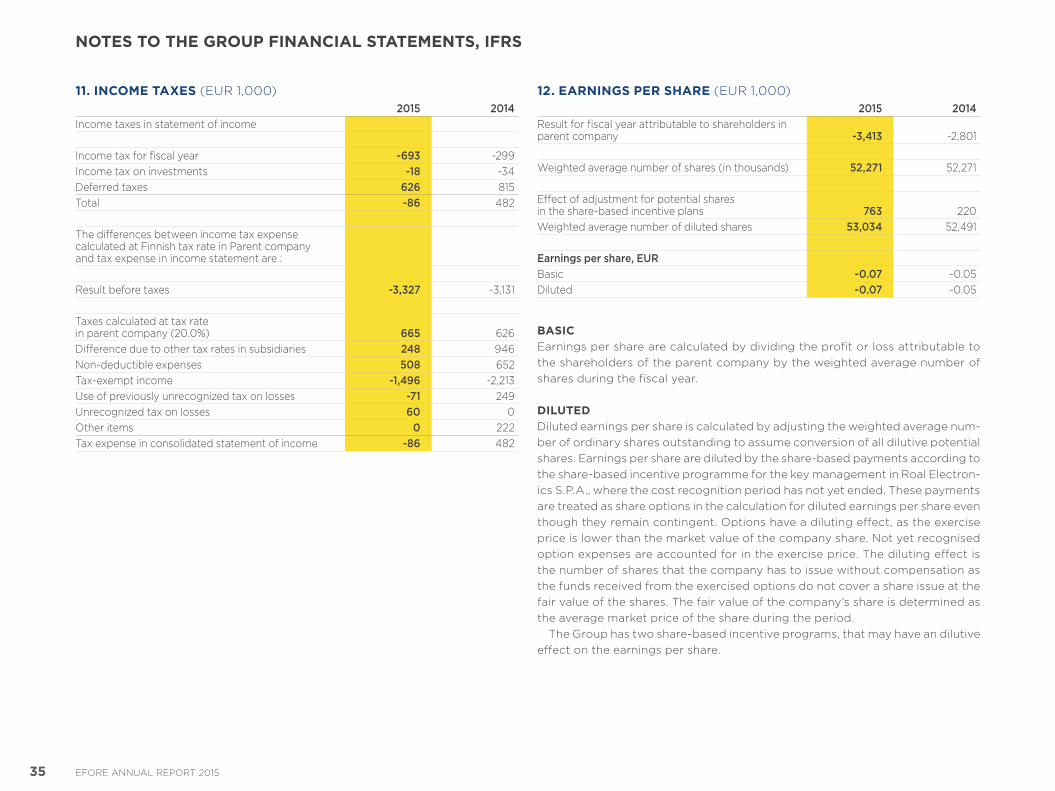
11. INCOME TAXES (EUR 1,000)2015 2014
Income taxes in statement of income
Income tax for fiscal year -693 299Income tax on investments -18 34Deferred taxes 626 815Total -86 482
The differences between income tax expense calculated at Finnish tax rate in Parent company and tax expense in income statement are :
Result before taxes -3,327 3,131
Taxes calculated at tax rate in parent company (20.0%) 665 626Difference due to other tax rates in subsidiaries 248 946Nondeductible expenses 508 652Taxexempt income -1,496 2,213Use of previously unrecognized tax on losses -71 249Unrecognized tax on losses 60 0Other items 0 222Tax expense in consolidated statement of income -86 482
12. EARNINGS PER SHARE (EUR 1,000)2015 2014
Result for fiscal year attributable to shareholders in parent company -3,413 2,801
Weighted average number of shares (in thousands) 52,271 52,271
Effect of adjustment for potential shares in the sharebased incentive plans 763 220Weighted average number of diluted shares 53,034 52,491
Earnings per share, EURBasic -0.07 0.05Diluted -0.07 0.05
BASICEarnings per share are calculated by dividing the profit or loss attributable to the shareholders of the parent company by the weighted average number of shares during the fiscal year.
DILUTEDDiluted earnings per share is calculated by adjusting the weighted average number of ordinary shares outstanding to assume conversion of all dilutive potential shares. Earnings per share are diluted by the sharebased payments according to the sharebased incentive programme for the key management in Roal Electronics S.P.A., where the cost recognition period has not yet ended. These payments are treated as share options in the calculation for diluted earnings per share even though they remain contingent. Options have a diluting effect, as the exercise price is lower than the market value of the company share. Not yet recognised option expenses are accounted for in the exercise price. The diluting effect is the number of shares that the company has to issue without compensation as the funds received from the exercised options do not cover a share issue at the fair value of the shares. The fair value of the company’s share is determined as the average market price of the share during the period.
The Group has two sharebased incentive programs, that may have an dilutive effect on the earnings per share.
35 EFORE ANNUAL REPORT 2015
NOTES TO THE GROUP FINANCIAL STATEMENTS, IFRS
1. Stock option programStock options have a dilutive effect, as the exercise price is lower than the market value of the company share. Not yet recognised option expenses are accounted for in the exercise price. The diluting effect is the number of shares that the company has to issue without compensation as the funds received from the exercised options do not cover a share issue at the fair value of the shares. The fair value of the company’s share is determined as the average market price of the share during the period. The stock option plan was issued on June 17, 2014 and a the total amount of stock options according to the program are 1,500,000 pcs. The subscription period for the stock options ended on July 31, 2015. Each option entitles the holder to subscribe for one (1) new share in Efore Plc. The share subscription periods for the stock options issued are the following: Option A:
August 1, 2016–July 31, 2018 (500,000 options), Option B: August 1, 2017–July 31, 2019 (500,000 options), Option C: August 1, 2018–July 31, 2020 (500,000 options). The shares subscribed for with the stock options equals to a maximum of 2.69 per cent of the total number of shares in the company.
2. Share-based incentive programThe earnings per share are diluted by the incentives to be settled as shares in the sharebased incentive program concerning the key management in Roal Electronics S.P.A., where the performance period has not yet ended. The shares are taken into account as stock options in the calculation of the dilutive earnings per share, although the settlement concerning the shares is contingent.
36 EFORE ANNUAL REPORT 2015
NOTES TO THE GROUP FINANCIAL STATEMENTS, IFRS
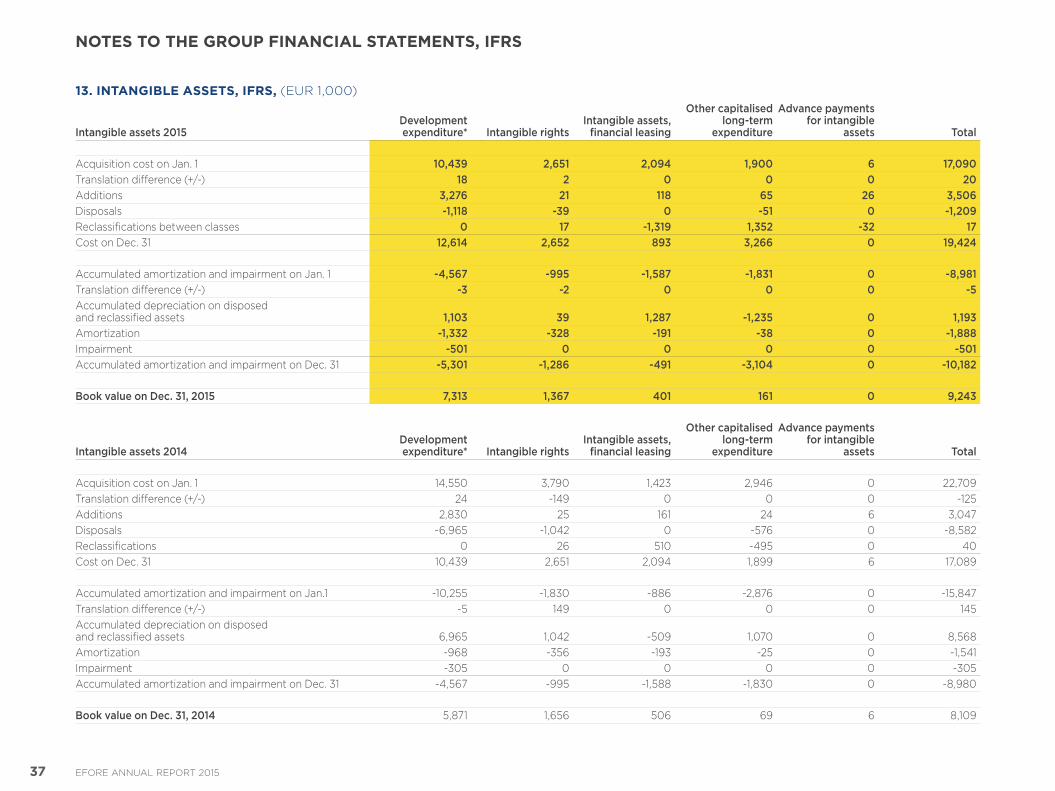
13. INTANGIBLE ASSETS, IFRS, (EUR 1,000)
Intangible assets 2015Development expenditure* Intangible rights
Intangible assets, financial leasing
Other capitalised long-term
expenditure
Advance payments for intangible
assets Total
Acquisition cost on Jan. 1 10,439 2,651 2,094 1,900 6 17,090Translation difference (+/) 18 2 0 0 0 20Additions 3,276 21 118 65 26 3,506Disposals -1,118 -39 0 -51 0 -1,209Reclassifications between classes 0 17 -1,319 1,352 -32 17Cost on Dec. 31 12,614 2,652 893 3,266 0 19,424 Accumulated amortization and impairment on Jan. 1 -4,567 -995 -1,587 -1,831 0 -8,981Translation difference (+/) -3 -2 0 0 0 -5Accumulated depreciation on disposed and reclassified assets 1,103 39 1,287 -1,235 0 1,193Amortization -1,332 -328 -191 -38 0 -1,888Impairment -501 0 0 0 0 -501Accumulated amortization and impairment on Dec. 31 -5,301 -1,286 -491 -3,104 0 -10,182
Book value on Dec. 31, 2015 7,313 1,367 401 161 0 9,243
Intangible assets 2014Development expenditure* Intangible rights
Intangible assets, financial leasing
Other capitalised long-term
expenditure
Advance payments for intangible
assets Total
Acquisition cost on Jan. 1 14,550 3,790 1,423 2,946 0 22,709Translation difference (+/) 24 149 0 0 0 125Additions 2,830 25 161 24 6 3,047Disposals 6,965 1,042 0 576 0 8,582Reclassifications 0 26 510 495 0 40Cost on Dec. 31 10,439 2,651 2,094 1,899 6 17,089 Accumulated amortization and impairment on Jan.1 10,255 1,830 886 2,876 0 15,847Translation difference (+/) 5 149 0 0 0 145Accumulated depreciation on disposed and reclassified assets 6,965 1,042 509 1,070 0 8,568Amortization 968 356 193 25 0 1,541Impairment 305 0 0 0 0 305Accumulated amortization and impairment on Dec. 31 4,567 995 1,588 1,830 0 8,980
Book value on Dec. 31, 2014 5,871 1,656 506 69 6 8,109
37 EFORE ANNUAL REPORT 2015
NOTES TO THE GROUP FINANCIAL STATEMENTS, IFRS
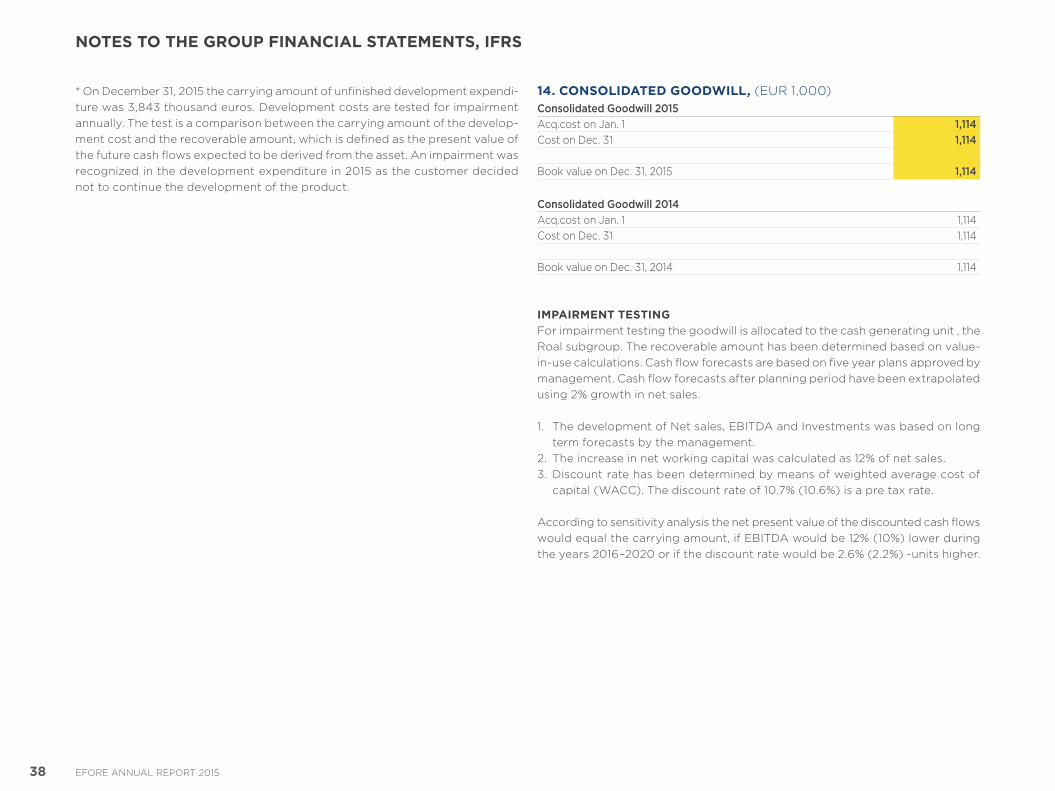
* On December 31, 2015 the carrying amount of unfinished development expenditure was 3,843 thousand euros. Development costs are tested for impairment annually. The test is a comparison between the carrying amount of the development cost and the recoverable amount, which is defined as the present value of the future cash flows expected to be derived from the asset. An impairment was recognized in the development expenditure in 2015 as the customer decided not to continue the development of the product.
14. CONSOLIDATED GOODWILL, (EUR 1,000)Consolidated Goodwill 2015Acq.cost on Jan. 1 1,114Cost on Dec. 31 1,114
Book value on Dec. 31, 2015 1,114
Consolidated Goodwill 2014Acq.cost on Jan. 1 1,114Cost on Dec. 31 1,114
Book value on Dec. 31, 2014 1,114
IMPAIRMENT TESTINGFor impairment testing the goodwill is allocated to the cash generating unit , the Roal subgroup. The recoverable amount has been determined based on valueinuse calculations. Cash flow forecasts are based on five year plans approved by management. Cash flow forecasts after planning period have been extrapolated using 2% growth in net sales.
1. The development of Net sales, EBITDA and Investments was based on long term forecasts by the management.
2. The increase in net working capital was calculated as 12% of net sales.3. Discount rate has been determined by means of weighted average cost of
capital (WACC). The discount rate of 10.7% (10.6%) is a pre tax rate.
According to sensitivity analysis the net present value of the discounted cash flows would equal the carrying amount, if EBITDA would be 12% (10%) lower during the years 2016–2020 or if the discount rate would be 2.6% (2.2%) units higher.
38 EFORE ANNUAL REPORT 2015
NOTES TO THE GROUP FINANCIAL STATEMENTS, IFRS
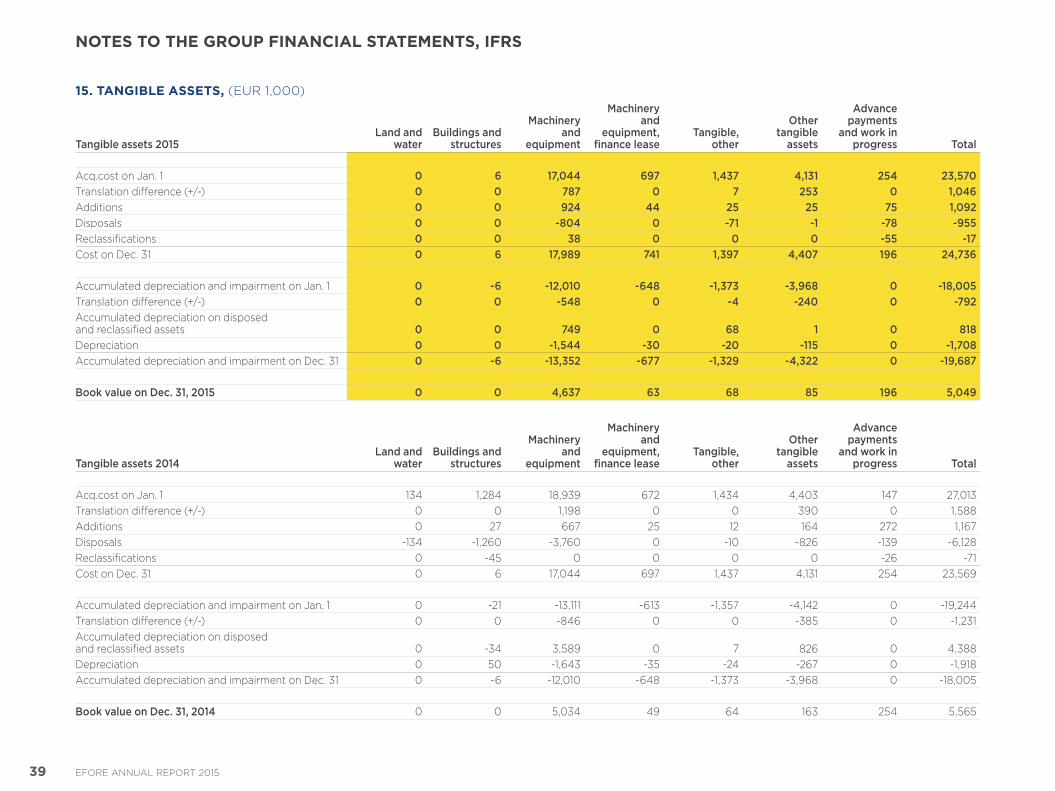
15. TANGIBLE ASSETS, (EUR 1,000)
Tangible assets 2015Land and
waterBuildings and
structures
Machinery and
equipment
Machinery and
equipment, finance lease
Tangible, other
Other tangible
assets
Advance payments
and work in progress Total
Acq.cost on Jan. 1 0 6 17,044 697 1,437 4,131 254 23,570Translation difference (+/) 0 0 787 0 7 253 0 1,046Additions 0 0 924 44 25 25 75 1,092Disposals 0 0 -804 0 -71 -1 -78 -955Reclassifications 0 0 38 0 0 0 -55 -17Cost on Dec. 31 0 6 17,989 741 1,397 4,407 196 24,736
Accumulated depreciation and impairment on Jan. 1 0 -6 -12,010 -648 -1,373 -3,968 0 -18,005Translation difference (+/) 0 0 -548 0 -4 -240 0 -792Accumulated depreciation on disposed and reclassified assets 0 0 749 0 68 1 0 818Depreciation 0 0 -1,544 -30 -20 -115 0 -1,708Accumulated depreciation and impairment on Dec. 31 0 -6 -13,352 -677 -1,329 -4,322 0 -19,687
Book value on Dec. 31, 2015 0 0 4,637 63 68 85 196 5,049
Tangible assets 2014Land and
waterBuildings and
structures
Machinery and
equipment
Machinery and
equipment, finance lease
Tangible, other
Other tangible
assets
Advance payments
and work in progress Total
Acq.cost on Jan. 1 134 1,284 18,939 672 1,434 4,403 147 27,013Translation difference (+/) 0 0 1,198 0 0 390 0 1,588Additions 0 27 667 25 12 164 272 1,167Disposals 134 1,260 3,760 0 10 826 139 6,128Reclassifications 0 45 0 0 0 0 26 71Cost on Dec. 31 0 6 17,044 697 1,437 4,131 254 23,569
Accumulated depreciation and impairment on Jan. 1 0 21 13,111 613 1,357 4,142 0 19,244Translation difference (+/) 0 0 846 0 0 385 0 1,231Accumulated depreciation on disposed and reclassified assets 0 34 3,589 0 7 826 0 4,388Depreciation 0 50 1,643 35 24 267 0 1,918Accumulated depreciation and impairment on Dec. 31 0 6 12,010 648 1,373 3,968 0 18,005
Book value on Dec. 31, 2014 0 0 5,034 49 64 163 254 5,565
39 EFORE ANNUAL REPORT 2015
NOTES TO THE GROUP FINANCIAL STATEMENTS, IFRS
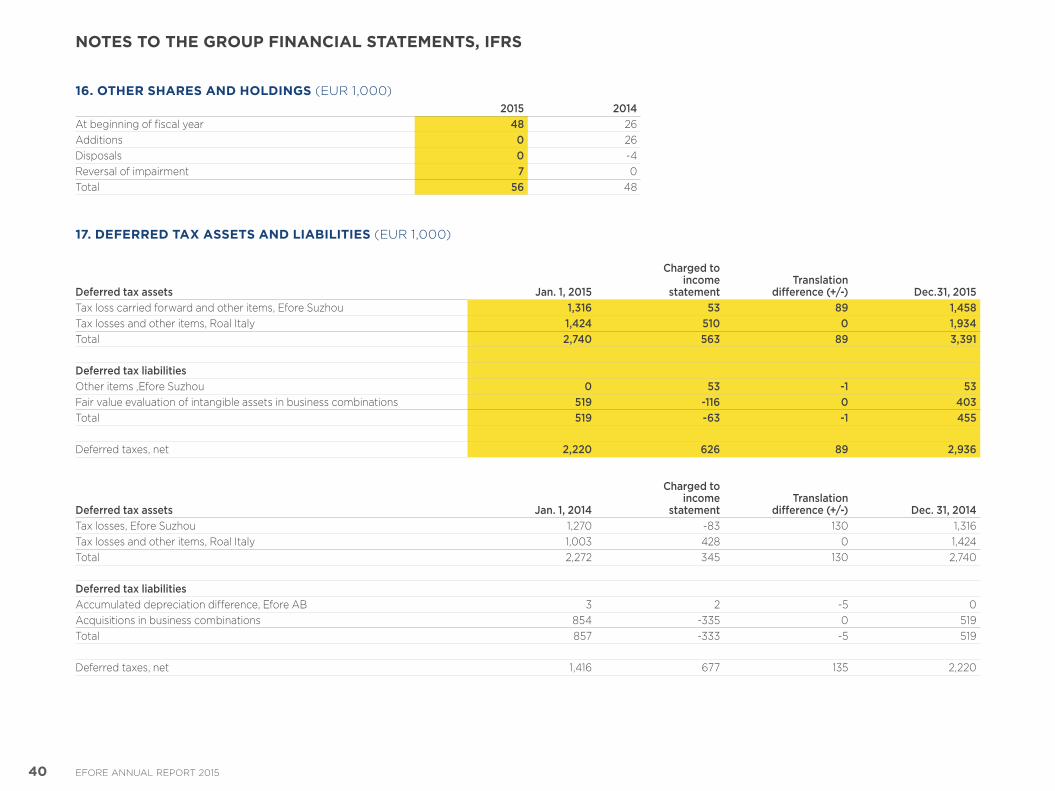
16. OTHER SHARES AND HOLDINGS (EUR 1,000)2015 2014
At beginning of fiscal year 48 26Additions 0 26Disposals 0 4Reversal of impairment 7 0Total 56 48
17. DEFERRED TAX ASSETS AND LIABILITIES (EUR 1,000)
Deferred tax assets Jan. 1, 2015
Charged to income
statementTranslation
difference (+/-) Dec.31, 2015Tax loss carried forward and other items, Efore Suzhou 1,316 53 89 1,458Tax losses and other items, Roal Italy 1,424 510 0 1,934Total 2,740 563 89 3,391
Deferred tax liabilitiesOther items ,Efore Suzhou 0 53 -1 53Fair value evaluation of intangible assets in business combinations 519 -116 0 403Total 519 -63 -1 455
Deferred taxes, net 2,220 626 89 2,936
Deferred tax assets Jan. 1, 2014
Charged to income
statementTranslation
difference (+/-) Dec. 31, 2014Tax losses, Efore Suzhou 1,270 83 130 1,316Tax losses and other items, Roal Italy 1,003 428 0 1,424Total 2,272 345 130 2,740
Deferred tax liabilitiesAccumulated depreciation difference, Efore AB 3 2 5 0Acquisitions in business combinations 854 335 0 519Total 857 333 5 519
Deferred taxes, net 1,416 677 135 2,220
40 EFORE ANNUAL REPORT 2015
NOTES TO THE GROUP FINANCIAL STATEMENTS, IFRS
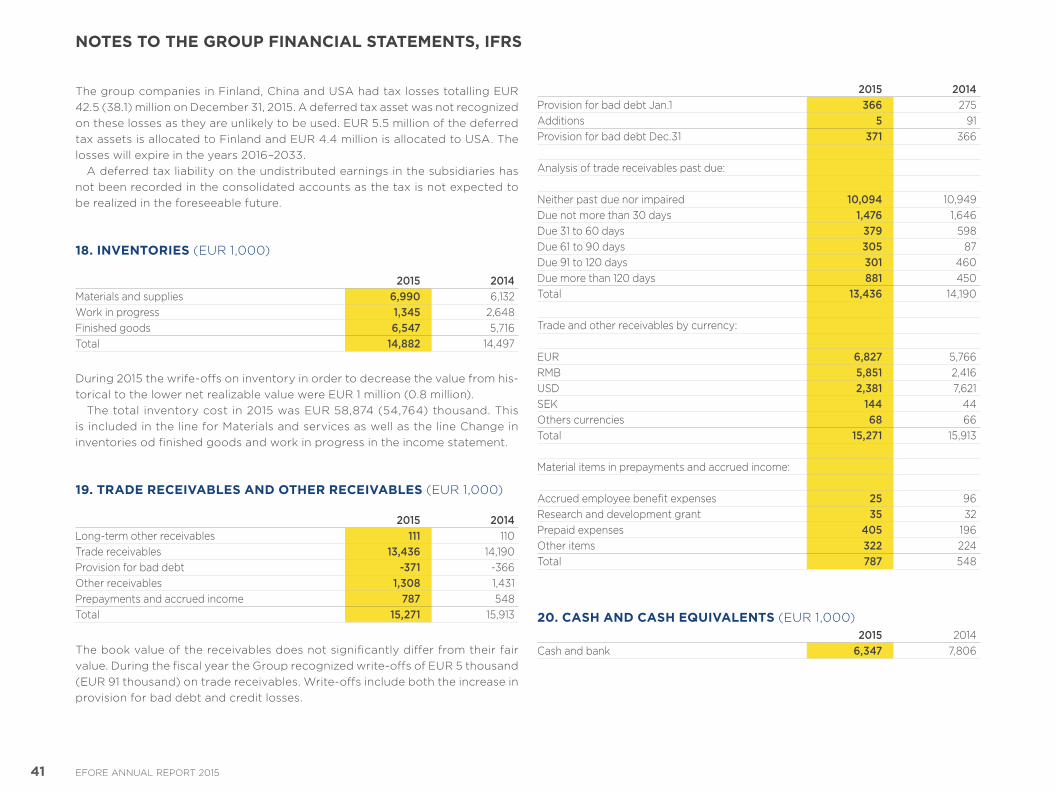
The group companies in Finland, China and USA had tax losses totalling EUR 42.5 (38.1) million on December 31, 2015. A deferred tax asset was not recognized on these losses as they are unlikely to be used. EUR 5.5 million of the deferred tax assets is allocated to Finland and EUR 4.4 million is allocated to USA. The losses will expire in the years 2016–2033.
A deferred tax liability on the undistributed earnings in the subsidiaries has not been recorded in the consolidated accounts as the tax is not expected to be realized in the foreseeable future.
18. INVENTORIES (EUR 1,000)
2015 2014Materials and supplies 6,990 6,132Work in progress 1,345 2,648Finished goods 6,547 5,716Total 14,882 14,497
During 2015 the wrifeoffs on inventory in order to decrease the value from historical to the lower net realizable value were EUR 1 million (0.8 million).
The total inventory cost in 2015 was EUR 58,874 (54,764) thousand. This is included in the line for Materials and services as well as the line Change in inventories od finished goods and work in progress in the income statement.
19. TRADE RECEIVABLES AND OTHER RECEIVABLES (EUR 1,000)
2015 2014Longterm other receivables 111 110Trade receivables 13,436 14,190Provision for bad debt -371 366Other receivables 1,308 1,431Prepayments and accrued income 787 548Total 15,271 15,913
The book value of the receivables does not significantly differ from their fair value. During the fiscal year the Group recognized writeoffs of EUR 5 thousand (EUR 91 thousand) on trade receivables. Writeoffs include both the increase in provision for bad debt and credit losses.
2015 2014Provision for bad debt Jan.1 366 275Additions 5 91Provision for bad debt Dec.31 371 366
Analysis of trade receivables past due:
Neither past due nor impaired 10,094 10,949Due not more than 30 days 1,476 1,646Due 31 to 60 days 379 598Due 61 to 90 days 305 87Due 91 to 120 days 301 460Due more than 120 days 881 450Total 13,436 14,190
Trade and other receivables by currency:
EUR 6,827 5,766RMB 5,851 2,416USD 2,381 7,621SEK 144 44Others currencies 68 66Total 15,271 15,913
Material items in prepayments and accrued income:
Accrued employee benefit expenses 25 96Research and development grant 35 32Prepaid expenses 405 196Other items 322 224Total 787 548
20. CASH AND CASH EQUIVALENTS (EUR 1,000)2015 2014
Cash and bank 6,347 7,806
41 EFORE ANNUAL REPORT 2015
NOTES TO THE GROUP FINANCIAL STATEMENTS, IFRS
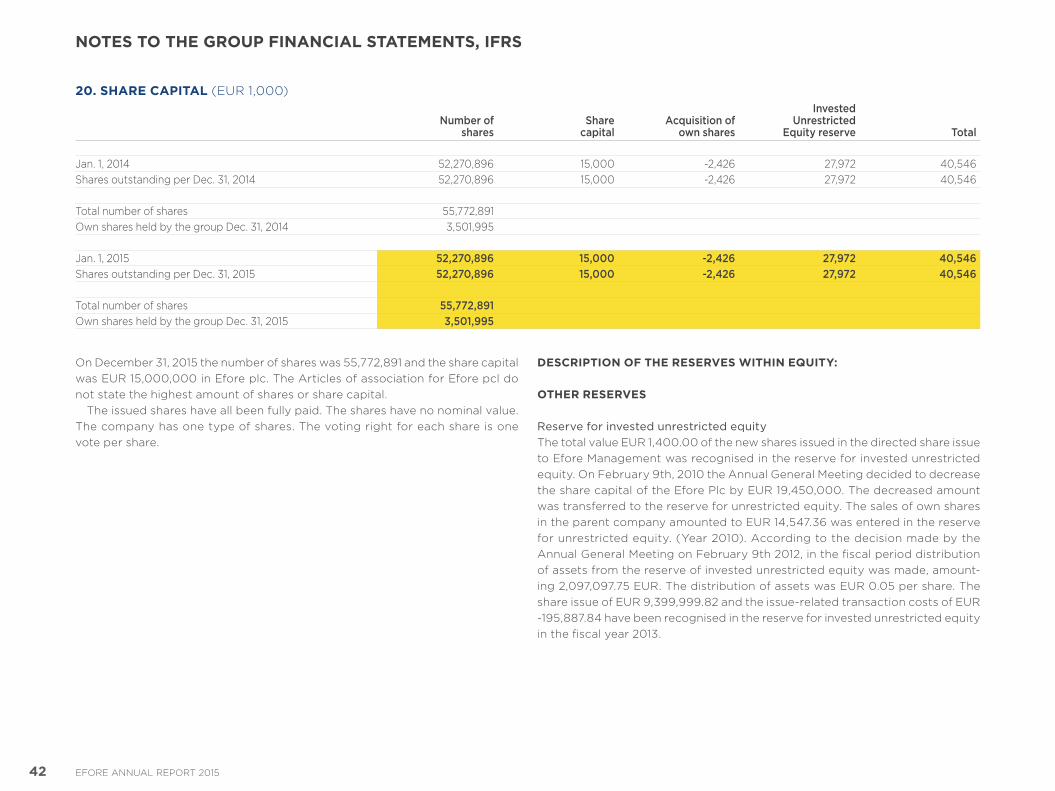
20. SHARE CAPITAL (EUR 1,000)
Number ofshares
Sharecapital
Acquisition of own shares
InvestedUnrestricted
Equity reserve Total
Jan. 1, 2014 52,270,896 15,000 2,426 27,972 40,546Shares outstanding per Dec. 31, 2014 52,270,896 15,000 2,426 27,972 40,546
Total number of shares 55,772,891Own shares held by the group Dec. 31, 2014 3,501,995
Jan. 1, 2015 52,270,896 15,000 -2,426 27,972 40,546Shares outstanding per Dec. 31, 2015 52,270,896 15,000 -2,426 27,972 40,546
Total number of shares 55,772,891Own shares held by the group Dec. 31, 2015 3,501,995
On December 31, 2015 the number of shares was 55,772,891 and the share capital was EUR 15,000,000 in Efore plc. The Articles of association for Efore pcl do not state the highest amount of shares or share capital.
The issued shares have all been fully paid. The shares have no nominal value. The company has one type of shares. The voting right for each share is one vote per share.
DESCRIPTION OF THE RESERVES WITHIN EQUITY:
OTHER RESERVES
Reserve for invested unrestricted equity The total value EUR 1,400.00 of the new shares issued in the directed share issue to Efore Management was recognised in the reserve for invested unrestricted equity. On February 9th, 2010 the Annual General Meeting decided to decrease the share capital of the Efore Plc by EUR 19,450,000. The decreased amount was transferred to the reserve for unrestricted equity. The sales of own shares in the parent company amounted to EUR 14,547.36 was entered in the reserve for unrestricted equity. (Year 2010). According to the decision made by the Annual General Meeting on February 9th 2012, in the fiscal period distribution of assets from the reserve of invested unrestricted equity was made, amounting 2,097,097.75 EUR. The distribution of assets was EUR 0.05 per share. The share issue of EUR 9,399,999.82 and the issuerelated transaction costs of EUR 195,887.84 have been recognised in the reserve for invested unrestricted equity in the fiscal year 2013.
42 EFORE ANNUAL REPORT 2015
NOTES TO THE GROUP FINANCIAL STATEMENTS, IFRS
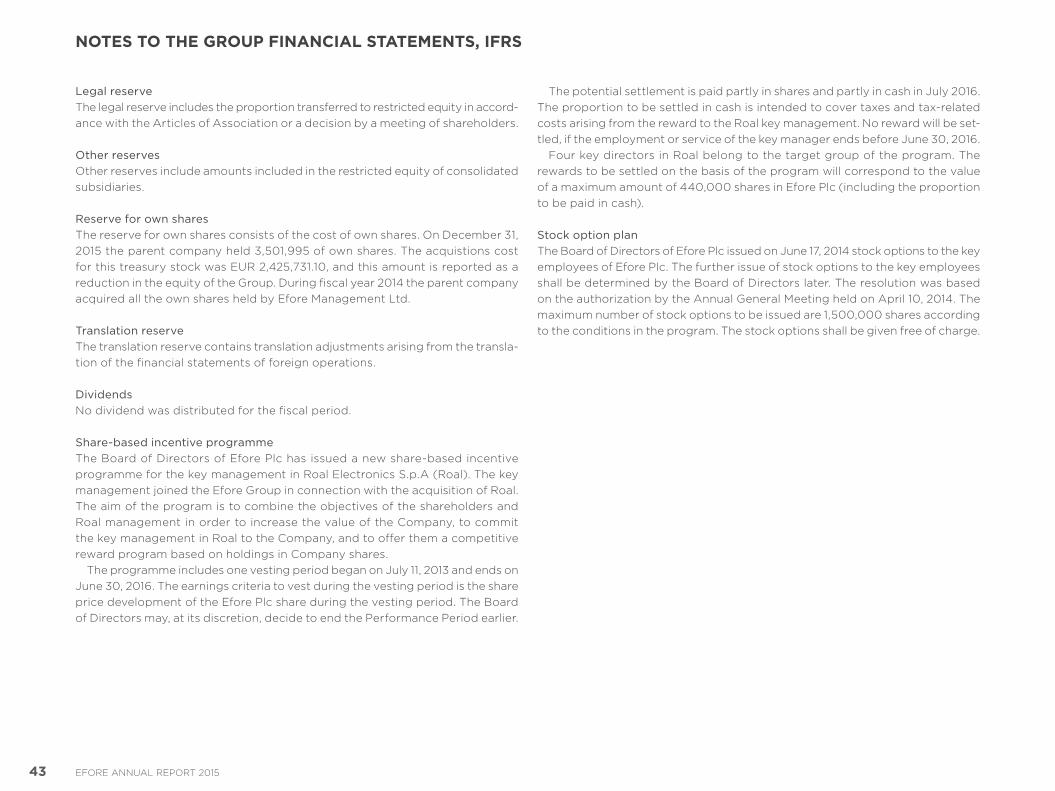
Legal reserveThe legal reserve includes the proportion transferred to restricted equity in accordance with the Articles of Association or a decision by a meeting of shareholders.
Other reserves Other reserves include amounts included in the restricted equity of consolidated subsidiaries.
Reserve for own sharesThe reserve for own shares consists of the cost of own shares. On December 31, 2015 the parent company held 3,501,995 of own shares. The acquistions cost for this treasury stock was EUR 2,425,731.10, and this amount is reported as a reduction in the equity of the Group. During fiscal year 2014 the parent company acquired all the own shares held by Efore Management Ltd.
Translation reserveThe translation reserve contains translation adjustments arising from the translation of the financial statements of foreign operations.
DividendsNo dividend was distributed for the fiscal period.
Share-based incentive programmeThe Board of Directors of Efore Plc has issued a new sharebased incentive programme for the key management in Roal Electronics S.p.A (Roal). The key management joined the Efore Group in connection with the acquisition of Roal. The aim of the program is to combine the objectives of the shareholders and Roal management in order to increase the value of the Company, to commit the key management in Roal to the Company, and to offer them a competitive reward program based on holdings in Company shares.
The programme includes one vesting period began on July 11, 2013 and ends on June 30, 2016. The earnings criteria to vest during the vesting period is the share price development of the Efore Plc share during the vesting period. The Board of Directors may, at its discretion, decide to end the Performance Period earlier.
The potential settlement is paid partly in shares and partly in cash in July 2016. The proportion to be settled in cash is intended to cover taxes and taxrelated costs arising from the reward to the Roal key management. No reward will be settled, if the employment or service of the key manager ends before June 30, 2016.
Four key directors in Roal belong to the target group of the program. The rewards to be settled on the basis of the program will correspond to the value of a maximum amount of 440,000 shares in Efore Plc (including the proportion to be paid in cash).
Stock option planThe Board of Directors of Efore Plc issued on June 17, 2014 stock options to the key employees of Efore Plc. The further issue of stock options to the key employees shall be determined by the Board of Directors later. The resolution was based on the authorization by the Annual General Meeting held on April 10, 2014. The maximum number of stock options to be issued are 1,500,000 shares according to the conditions in the program. The stock options shall be given free of charge.
43 EFORE ANNUAL REPORT 2015
NOTES TO THE GROUP FINANCIAL STATEMENTS, IFRS
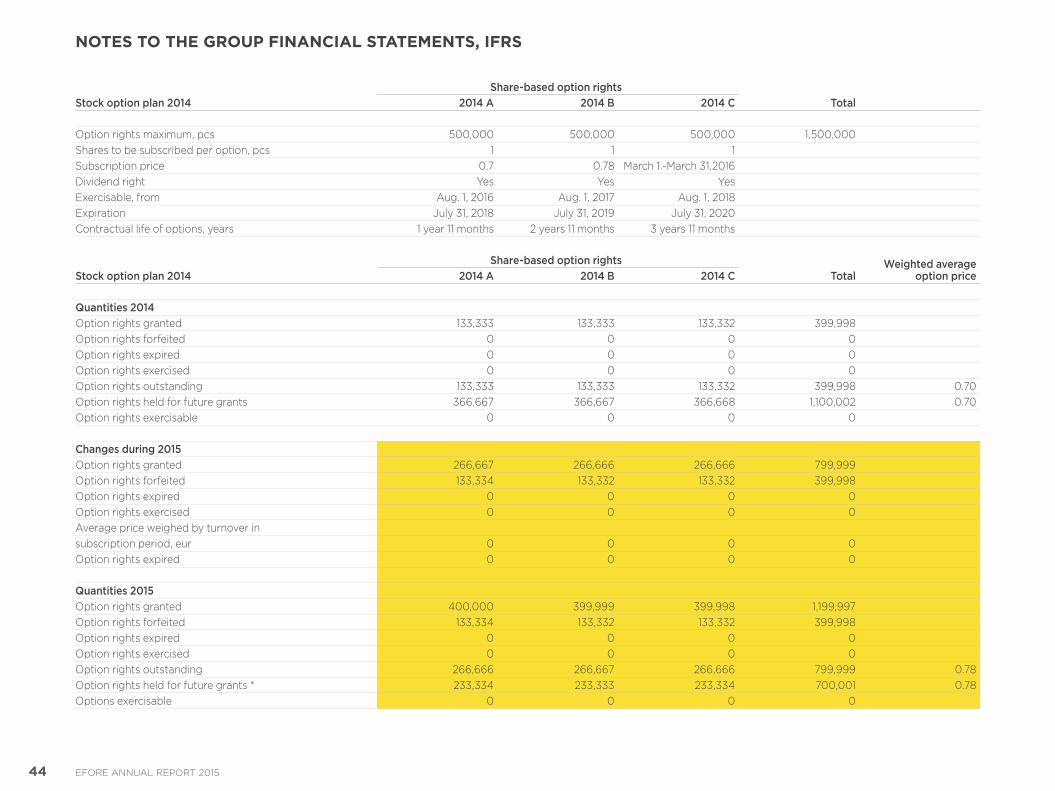
Share-based option rightsStock option plan 2014 2014 A 2014 B 2014 C Total
Option rights maximum, pcs 500,000 500,000 500,000 1,500,000Shares to be subscribed per option, pcs 1 1 1Subscription price 0.7 0.78 March 1.March 31,2016Dividend right Yes Yes YesExercisable, from Aug. 1, 2016 Aug. 1, 2017 Aug. 1, 2018Expiration July 31, 2018 July 31, 2019 July 31, 2020Contractual life of options, years 1 year 11 months 2 years 11 months 3 years 11 months
Share-based option rights Weighted averageoption priceStock option plan 2014 2014 A 2014 B 2014 C Total
Quantities 2014Option rights granted 133,333 133,333 133,332 399,998Option rights forfeited 0 0 0 0Option rights expired 0 0 0 0Option rights exercised 0 0 0 0Option rights outstanding 133,333 133,333 133,332 399,998 0.70Option rights held for future grants 366,667 366,667 366,668 1,100,002 0.70Option rights exercisable 0 0 0 0
Changes during 2015Option rights granted 266,667 266,666 266,666 799,999Option rights forfeited 133,334 133,332 133,332 399,998Option rights expired 0 0 0 0Option rights exercised 0 0 0 0Average price weighed by turnover insubscription period, eur 0 0 0 0Option rights expired 0 0 0 0
Quantities 2015Option rights granted 400,000 399,999 399,998 1,199,997Option rights forfeited 133,334 133,332 133,332 399,998Option rights expired 0 0 0 0Option rights exercised 0 0 0 0Option rights outstanding 266,666 266,667 266,666 799,999 0.78Option rights held for future grants * 233,334 233,333 233,334 700,001 0.78Options exercisable 0 0 0 0
44 EFORE ANNUAL REPORT 2015
NOTES TO THE GROUP FINANCIAL STATEMENTS, IFRS
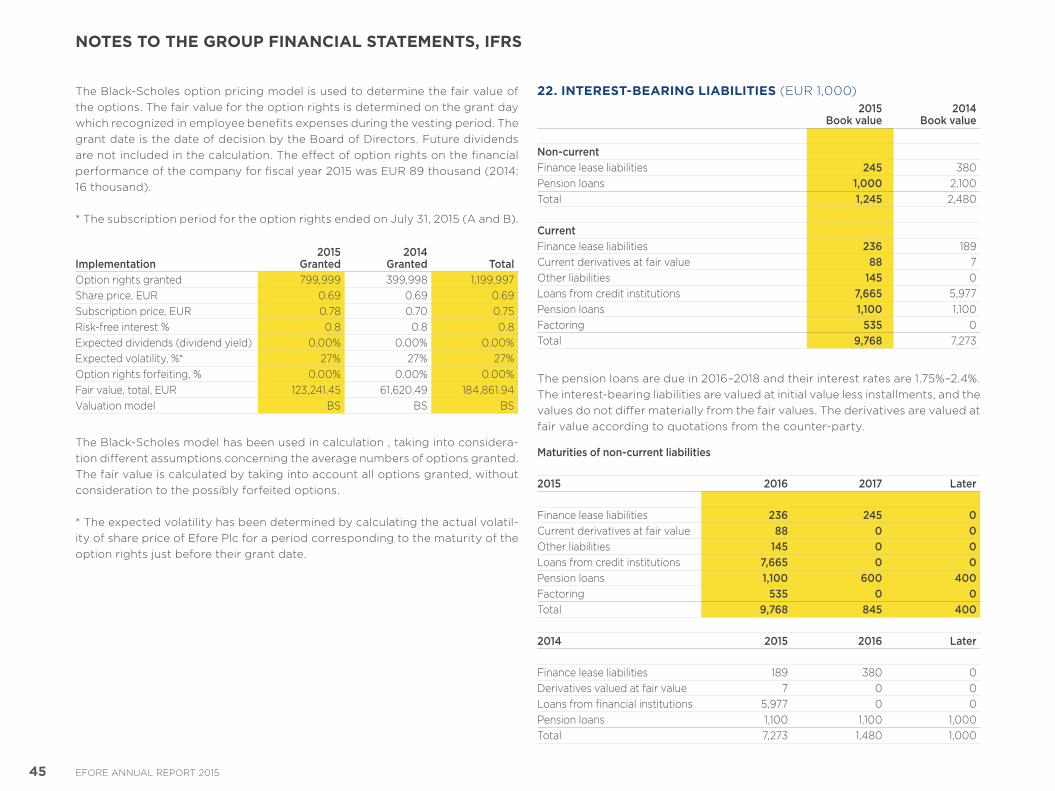
The BlackScholes option pricing model is used to determine the fair value of the options. The fair value for the option rights is determined on the grant day which recognized in employee benefits expenses during the vesting period. The grant date is the date of decision by the Board of Directors. Future dividends are not included in the calculation. The effect of option rights on the financial performance of the company for fiscal year 2015 was EUR 89 thousand (2014: 16 thousand).
* The subscription period for the option rights ended on July 31, 2015 (A and B).
Implementation2015
Granted2014
Granted TotalOption rights granted 799,999 399,998 1,199,997Share price, EUR 0.69 0.69 0.69Subscription price, EUR 0.78 0.70 0.75Riskfree interest % 0.8 0.8 0.8Expected dividends (dividend yield) 0.00% 0.00% 0.00%Expected volatility, %* 27% 27% 27%Option rights forfeiting, % 0.00% 0.00% 0.00%Fair value, total, EUR 123,241.45 61,620.49 184,861.94Valuation model BS BS BS
The BlackScholes model has been used in calculation , taking into consideration different assumptions concerning the average numbers of options granted.The fair value is calculated by taking into account all options granted, without consideration to the possibly forfeited options.
* The expected volatility has been determined by calculating the actual volatility of share price of Efore Plc for a period corresponding to the maturity of the option rights just before their grant date.
22. INTEREST-BEARING LIABILITIES (EUR 1,000)2015
Book value2014
Book value
Non-currentFinance lease liabilities 245 380Pension loans 1,000 2,100Total 1,245 2,480
CurrentFinance lease liabilities 236 189Current derivatives at fair value 88 7Other liabilities 145 0Loans from credit institutions 7,665 5,977Pension loans 1,100 1,100Factoring 535 0Total 9,768 7,273
The pension loans are due in 2016–2018 and their interest rates are 1.75%–2.4%. The interestbearing liabilities are valued at initial value less installments, and the values do not differ materially from the fair values. The derivatives are valued at fair value according to quotations from the counterparty.
Maturities of non-current liabilities
2015 2016 2017 Later
Finance lease liabilities 236 245 0Current derivatives at fair value 88 0 0Other liabilities 145 0 0Loans from credit institutions 7,665 0 0Pension loans 1,100 600 400Factoring 535 0 0Total 9,768 845 400
2014 2015 2016 Later
Finance lease liabilities 189 380 0Derivatives valued at fair value 7 0 0Loans from financial institutions 5,977 0 0Pension loans 1,100 1,100 1,000Total 7,273 1,480 1,000
45 EFORE ANNUAL REPORT 2015
NOTES TO THE GROUP FINANCIAL STATEMENTS, IFRS
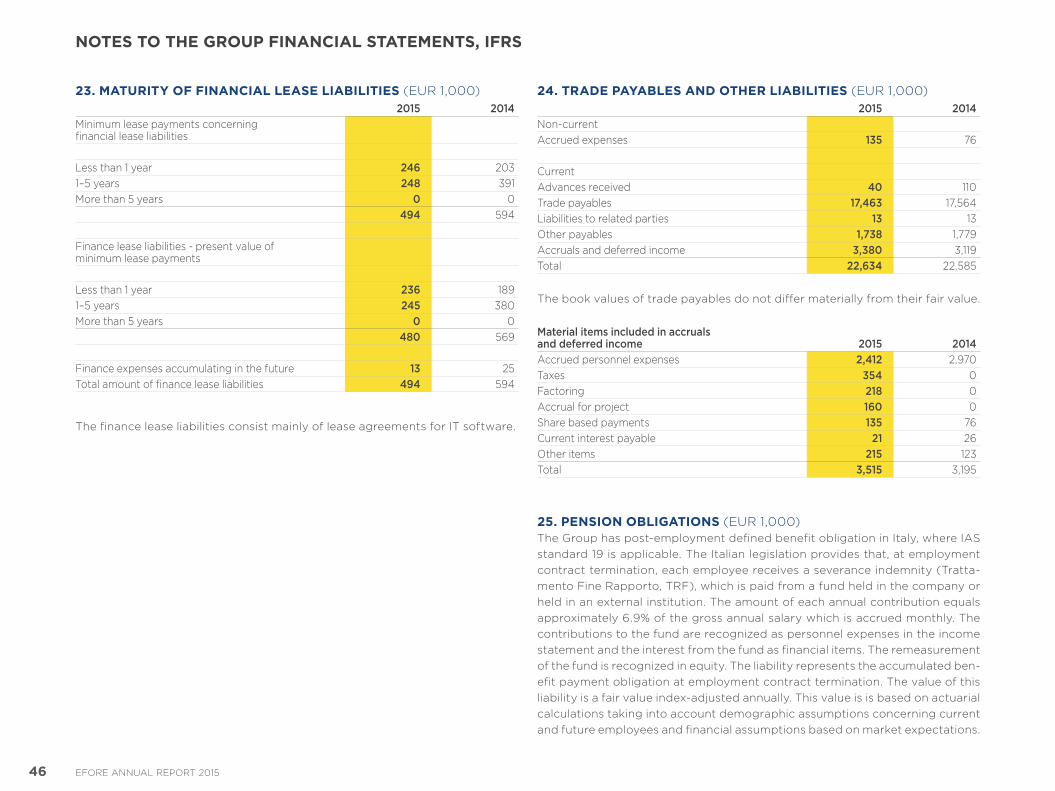
23. MATURITY OF FINANCIAL LEASE LIABILITIES (EUR 1,000)2015 2014
Minimum lease payments concerning financial lease liabilities
Less than 1 year 246 2031–5 years 248 391More than 5 years 0 0
494 594
Finance lease liabilities present value of minimum lease payments
Less than 1 year 236 1891–5 years 245 380More than 5 years 0 0
480 569
Finance expenses accumulating in the future 13 25Total amount of finance lease liabilities 494 594
The finance lease liabilities consist mainly of lease agreements for IT software.
24. TRADE PAYABLES AND OTHER LIABILITIES (EUR 1,000)2015 2014
Noncurrent Accrued expenses 135 76
CurrentAdvances received 40 110Trade payables 17,463 17,564Liabilities to related parties 13 13Other payables 1,738 1,779Accruals and deferred income 3,380 3,119Total 22,634 22,585
The book values of trade payables do not differ materially from their fair value.
Material items included in accruals and deferred income 2015 2014Accrued personnel expenses 2,412 2,970Taxes 354 0Factoring 218 0Accrual for project 160 0Share based payments 135 76Current interest payable 21 26Other items 215 123Total 3,515 3,195
25. PENSION OBLIGATIONS (EUR 1,000)The Group has postemployment defined benefit obligation in Italy, where IAS standard 19 is applicable. The Italian legislation provides that, at employment contract termination, each employee receives a severance indemnity (Trattamento Fine Rapporto, TRF), which is paid from a fund held in the company or held in an external institution. The amount of each annual contribution equals approximately 6.9% of the gross annual salary which is accrued monthly. The contributions to the fund are recognized as personnel expenses in the income statement and the interest from the fund as financial items. The remeasurement of the fund is recognized in equity. The liability represents the accumulated benefit payment obligation at employment contract termination. The value of this liability is a fair value indexadjusted annually. This value is is based on actuarial calculations taking into account demographic assumptions concerning current and future employees and financial assumptions based on market expectations.
46 EFORE ANNUAL REPORT 2015
NOTES TO THE GROUP FINANCIAL STATEMENTS, IFRS
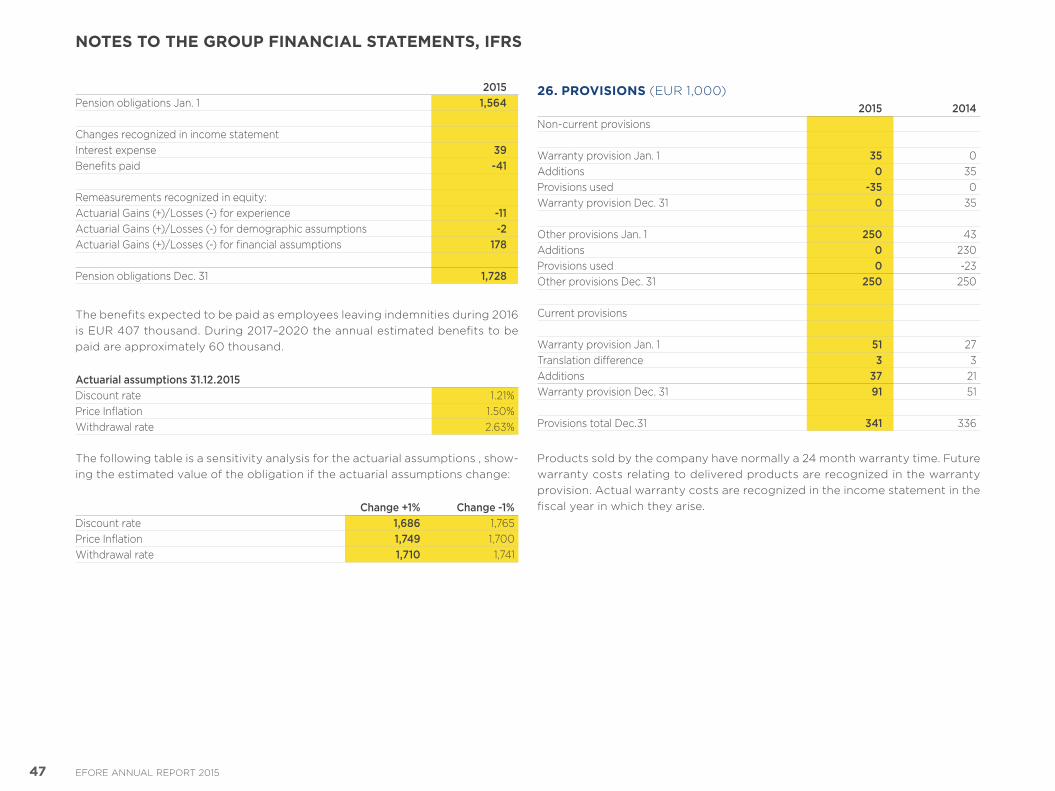
2015Pension obligations Jan. 1 1,564
Changes recognized in income statementInterest expense 39Benefits paid -41
Remeasurements recognized in equity:Actuarial Gains (+)/Losses () for experience -11Actuarial Gains (+)/Losses () for demographic assumptions -2Actuarial Gains (+)/Losses () for financial assumptions 178
Pension obligations Dec. 31 1,728
The benefits expected to be paid as employees leaving indemnities during 2016 is EUR 407 thousand. During 2017–2020 the annual estimated benefits to be paid are approximately 60 thousand.
Actuarial assumptions 31.12.2015Discount rate 1.21%Price Inflation 1.50%Withdrawal rate 2.63%
The following table is a sensitivity analysis for the actuarial assumptions , showing the estimated value of the obligation if the actuarial assumptions change:
Change +1% Change -1%Discount rate 1,686 1,765Price Inflation 1,749 1,700Withdrawal rate 1,710 1,741
26. PROVISIONS (EUR 1,000)2015 2014
Noncurrent provisions
Warranty provision Jan. 1 35 0Additions 0 35Provisions used -35 0Warranty provision Dec. 31 0 35
Other provisions Jan. 1 250 43Additions 0 230Provisions used 0 23Other provisions Dec. 31 250 250
Current provisions
Warranty provision Jan. 1 51 27Translation difference 3 3Additions 37 21Warranty provision Dec. 31 91 51
Provisions total Dec.31 341 336
Products sold by the company have normally a 24 month warranty time. Future warranty costs relating to delivered products are recognized in the warranty provision. Actual warranty costs are recognized in the income statement in the fiscal year in which they arise.
47 EFORE ANNUAL REPORT 2015
NOTES TO THE GROUP FINANCIAL STATEMENTS, IFRS
27. FINANCIAL RISK MANAGEMENT The principles and objectives of the Group’s financial risk management are determined in the financing risk policy, which is updated when necessary, and approved by the Board of Directors. The financial risk management aims at avoiding risks and providing costeffective arrangements for protecting the Group from factors that may affect its performance and cash flows in a negative way.
The longterm pension loans have fixed interest rates.
Financial risks are managed by foreign exchange and interest rate hedging using only financial instruments with a market value and risk profile that can be reliably monitored.
Approximately 45% of Group Net Sales comes from the two major customers. The total amount of trade receivables from these two key customers were EUR 2.9 million, from which EUR 0.8 million was overdue.
The maturity analysis of trade receivables and currency exposure of trade and other receivables are presented in note 19, Trade and other receivables.
FOREIGN EXCHANGE RISKForeign exchange risk refer to the risks caused by changes in foreign exchange rates which can affect business performance or Group solvency. Most of the Group’s sales are denominated in euro, Renminbi and US dollar. The operating expenses are generated in euro, US dollar, Swedish krona and Renminbi. The material foreign currency surpluses and deficits are hedged according to the Group hedging policy.
In 2015 the primary hedging method has been matching of foreign currency income and expence flows. Material net currency positions are hedged. The currency derivatives used in fiscal year 2015 had a maturity of 1 to 4 months. During fiscal year 2014 no derivative financial instruments were used for currency hedging.
In the financial statements the equity of foreign subsidiaries is translated at the European Central Bank’s average exchange rate on the balance sheet date. Exchange rate differences are presented in the consolidated financial statements as translation differences. The net investments in foreign operations has not been hedged.
The instrument used for hedging against exchangerate risks and their nominal values at the end of the fiscal year are specified in note 28, Fair values of derivative financial instruments.
INTEREST RATE RISKInterest rate risks are caused by fluctuations in interest rates affecting the loan portfolio and cash reserves in the Group. Interest rate risks are also dependent on whether financing is made by fixedrate or variable rate agreements. Interest rate risks are managed by making correct decisions concerning the interest periods of the liabilities and by using different types of derivative financial instruments to hedge interest rate risks. On the balance sheet date, the Group had no interest rate derivatives.
LIQUIDITY RISKAccording to the financing policy, liquidity risk management, funding and efficient cash management of the Group are responsibilities of the parent company. The liquidity risk is managed by adequate cash assets, partial sale of trade receivables, credit limits and
by monitoring the maturities of loans. The financial position of the group has weakened. At Dec. 31, 2015 the gearing was 24.5% (9%) and solvency ratio was 34.2% (38.1%).
At the end of the fiscal year the Group’s liquid assets totalled EUR 6.3 million (EUR 7.8 million). The Group’s interestbearing liabilities totalled EUR 11.0 million (EUR 9.8 million). The financial reserves in the Group comprised unused credit limits totalling EUR 6.1 million on December 31, 2015, from which 4.7 will expire within one year and is 1.4 valid for an unspecified term. Credit limits were utilized EUR 3.8 milj on December 2015, on December 31, 2014 the utilized credit limits were EUR 0.2 milj. The Group may in the future have difficulties in making agreements on external financing to the present extent and at same terms.
48 EFORE ANNUAL REPORT 2015
NOTES TO THE GROUP FINANCIAL STATEMENTS, IFRS
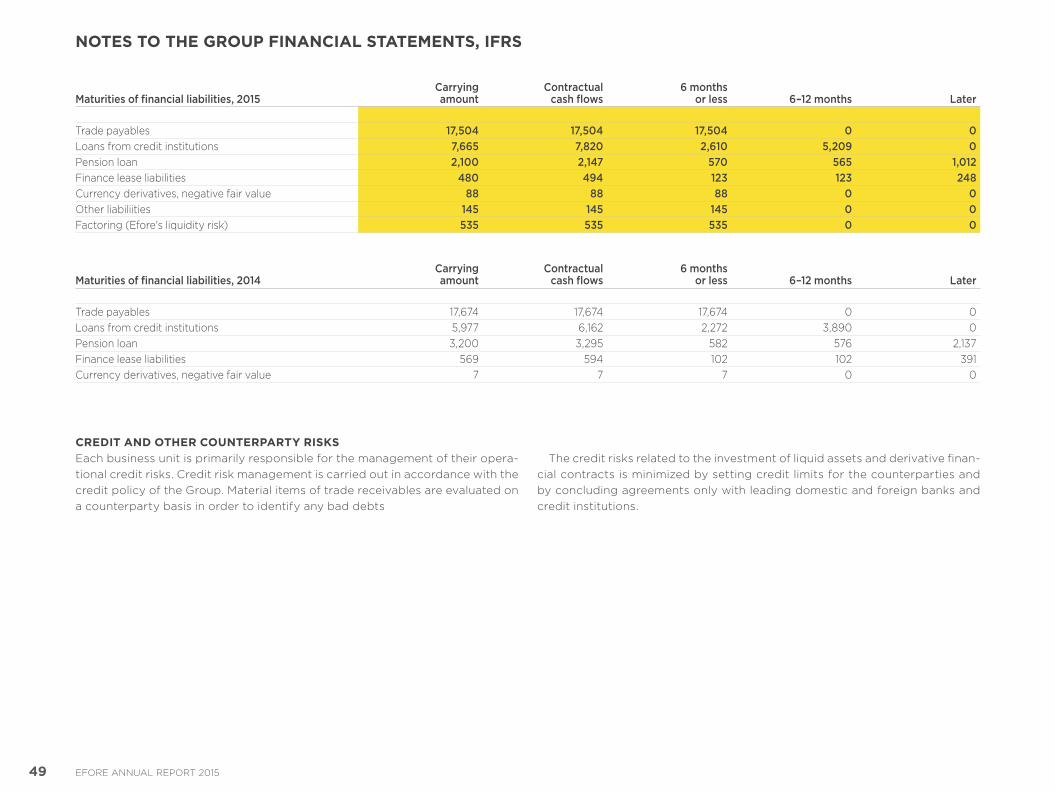
Maturities of financial liabilities, 2015Carryingamount
Contractualcash flows
6 months or less 6–12 months Later
Trade payables 17,504 17,504 17,504 0 0Loans from credit institutions 7,665 7,820 2,610 5,209 0Pension loan 2,100 2,147 570 565 1,012Finance lease liabilities 480 494 123 123 248Currency derivatives, negative fair value 88 88 88 0 0Other liabiliities 145 145 145 0 0Factoring (Efore's liquidity risk) 535 535 535 0 0
Maturities of financial liabilities, 2014Carryingamount
Contractualcash flows
6 months or less 6–12 months Later
Trade payables 17,674 17,674 17,674 0 0Loans from credit institutions 5,977 6,162 2,272 3,890 0Pension loan 3,200 3,295 582 576 2,137Finance lease liabilities 569 594 102 102 391Currency derivatives, negative fair value 7 7 7 0 0
CREDIT AND OTHER COUNTERPARTY RISKSEach business unit is primarily responsible for the management of their operational credit risks. Credit risk management is carried out in accordance with the credit policy of the Group. Material items of trade receivables are evaluated on a counterparty basis in order to identify any bad debts
The credit risks related to the investment of liquid assets and derivative financial contracts is minimized by setting credit limits for the counterparties and by concluding agreements only with leading domestic and foreign banks and credit institutions.
49 EFORE ANNUAL REPORT 2015
NOTES TO THE GROUP FINANCIAL STATEMENTS, IFRS
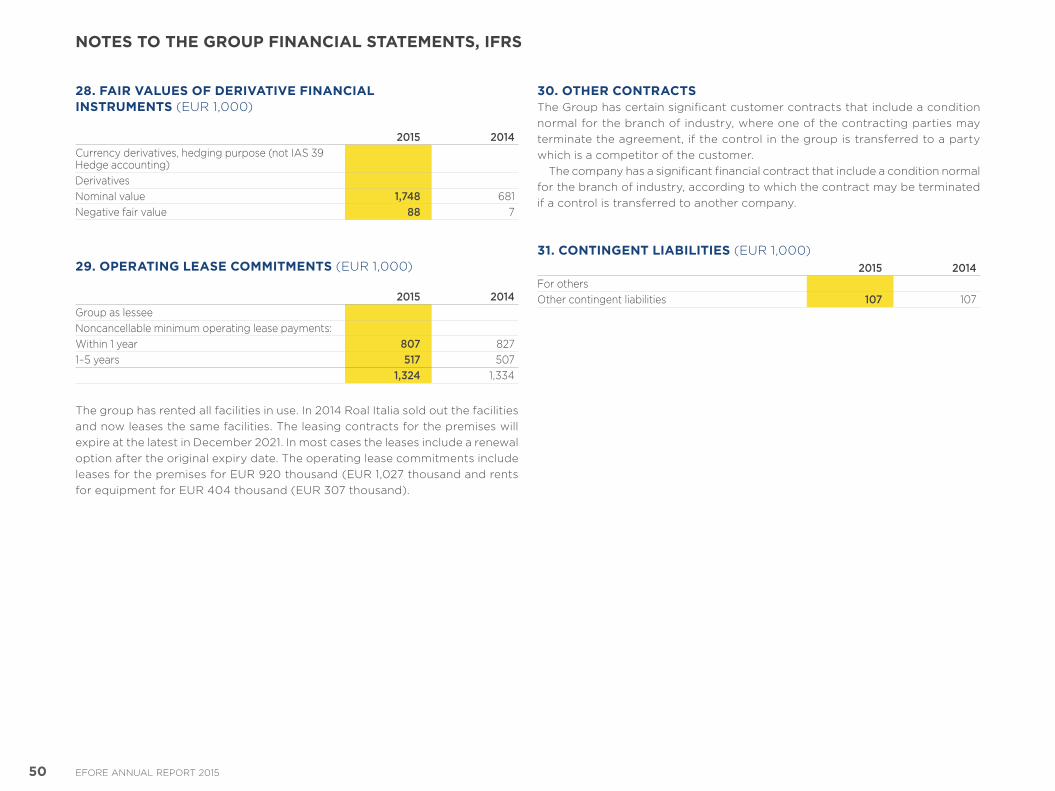
28. FAIR VALUES OF DERIVATIVE FINANCIAL INSTRUMENTS (EUR 1,000)
2015 2014Currency derivatives, hedging purpose (not IAS 39 Hedge accounting)DerivativesNominal value 1,748 681Negative fair value 88 7
29. OPERATING LEASE COMMITMENTS (EUR 1,000)
2015 2014Group as lesseeNoncancellable minimum operating lease payments:Within 1 year 807 8271–5 years 517 507
1,324 1,334
The group has rented all facilities in use. In 2014 Roal Italia sold out the facilities and now leases the same facilities. The leasing contracts for the premises will expire at the latest in December 2021. In most cases the leases include a renewal option after the original expiry date. The operating lease commitments include leases for the premises for EUR 920 thousand (EUR 1,027 thousand and rents for equipment for EUR 404 thousand (EUR 307 thousand).
30. OTHER CONTRACTSThe Group has certain significant customer contracts that include a condition normal for the branch of industry, where one of the contracting parties may terminate the agreement, if the control in the group is transferred to a party which is a competitor of the customer.
The company has a significant financial contract that include a condition normal for the branch of industry, according to which the contract may be terminated if a control is transferred to another company.
31. CONTINGENT LIABILITIES (EUR 1,000)2015 2014
For othersOther contingent liabilities 107 107
50 EFORE ANNUAL REPORT 2015
NOTES TO THE GROUP FINANCIAL STATEMENTS, IFRS
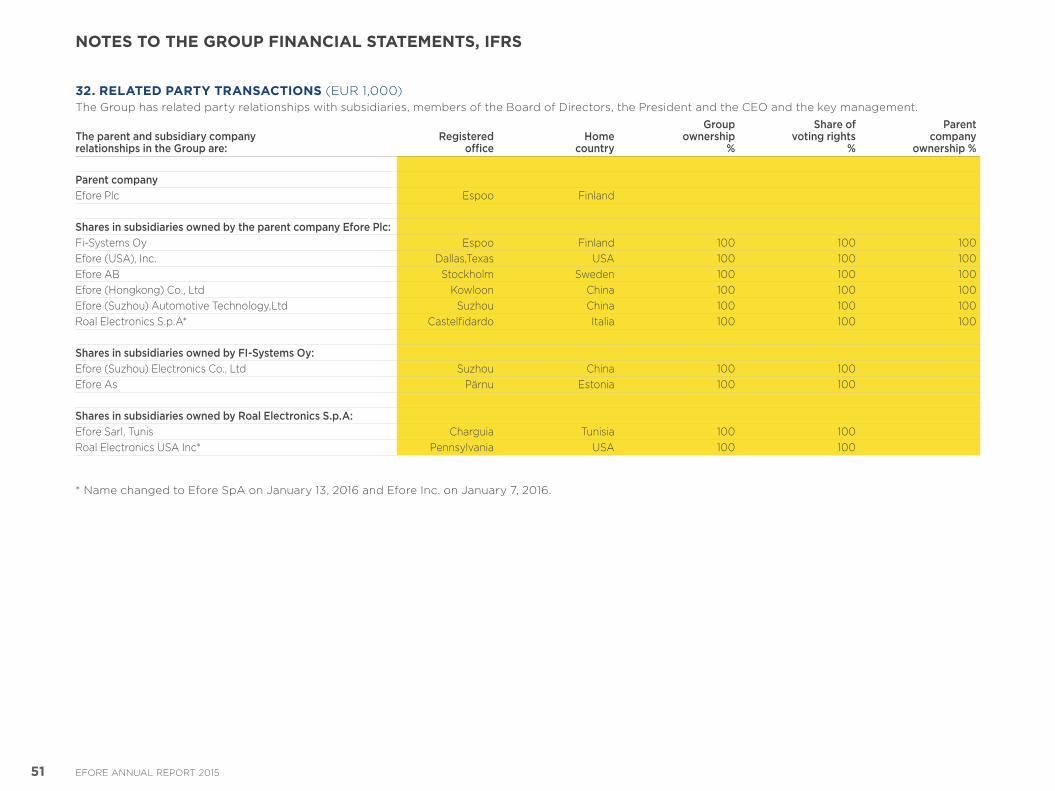
32. RELATED PARTY TRANSACTIONS (EUR 1,000)The Group has related party relationships with subsidiaries, members of the Board of Directors, the President and the CEO and the key management.
The parent and subsidiary company relationships in the Group are:
Registeredoffice
Home country
Group ownership
%
Share of voting rights
%
Parent company
ownership %
Parent companyEfore Plc Espoo Finland
Shares in subsidiaries owned by the parent company Efore Plc:FiSystems Oy Espoo Finland 100 100 100Efore (USA), Inc. Dallas,Texas USA 100 100 100Efore AB Stockholm Sweden 100 100 100Efore (Hongkong) Co., Ltd Kowloon China 100 100 100Efore (Suzhou) Automotive Technology,Ltd Suzhou China 100 100 100Roal Electronics S.p.A* Castelfidardo Italia 100 100 100
Shares in subsidiaries owned by FI-Systems Oy:Efore (Suzhou) Electronics Co., Ltd Suzhou China 100 100Efore As Pärnu Estonia 100 100
Shares in subsidiaries owned by Roal Electronics S.p.A:Efore Sarl, Tunis Charguia Tunisia 100 100Roal Electronics USA Inc* Pennsylvania USA 100 100
* Name changed to Efore SpA on January 13, 2016 and Efore Inc. on January 7, 2016.
51 EFORE ANNUAL REPORT 2015
NOTES TO THE GROUP FINANCIAL STATEMENTS, IFRS
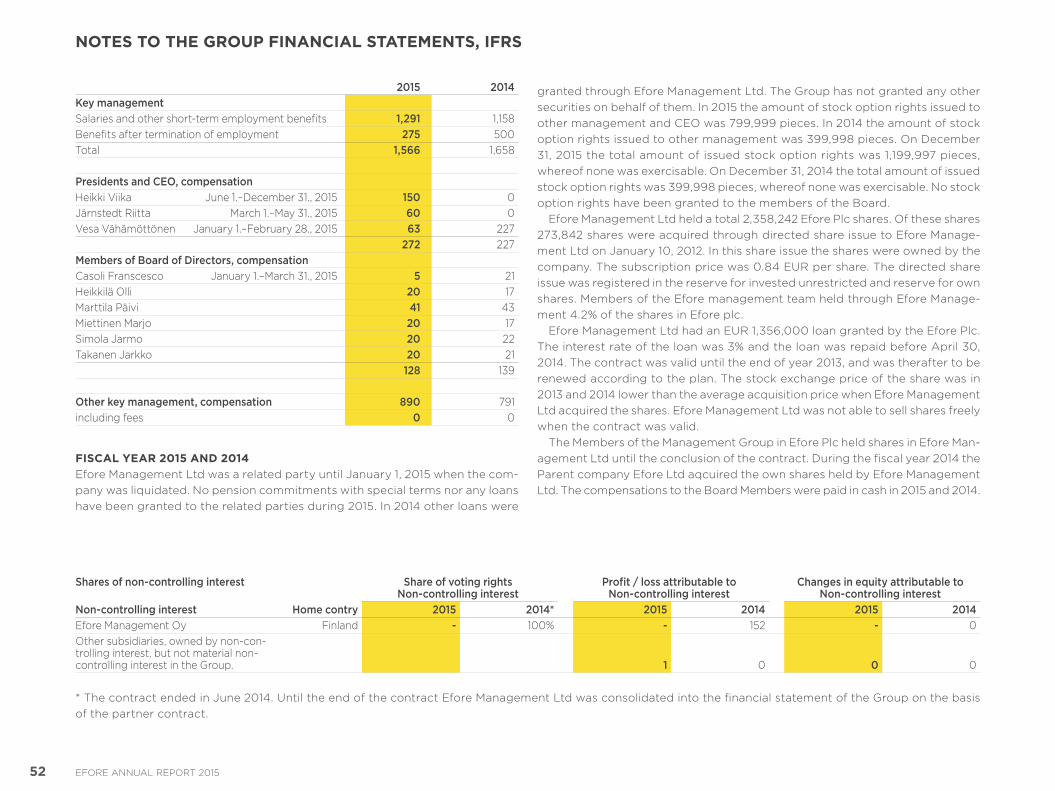
2015 2014Key managementSalaries and other shortterm employment benefits 1,291 1,158Benefits after termination of employment 275 500Total 1,566 1,658
Presidents and CEO, compensationHeikki Viika June 1.–December 31., 2015 150 0Järnstedt Riitta March 1.–May 31., 2015 60 0Vesa Vähämöttönen January 1.–February 28., 2015 63 227
272 227Members of Board of Directors, compensationCasoli Franscesco January 1.–March 31., 2015 5 21Heikkilä Olli 20 17Marttila Päivi 41 43Miettinen Marjo 20 17Simola Jarmo 20 22Takanen Jarkko 20 21
128 139
Other key management, compensation 890 791including fees 0 0
FISCAL YEAR 2015 AND 2014Efore Management Ltd was a related party until January 1, 2015 when the company was liquidated. No pension commitments with special terms nor any loans have been granted to the related parties during 2015. In 2014 other loans were
granted through Efore Management Ltd. The Group has not granted any other securities on behalf of them. In 2015 the amount of stock option rights issued to other management and CEO was 799,999 pieces. In 2014 the amount of stock option rights issued to other management was 399,998 pieces. On December 31, 2015 the total amount of issued stock option rights was 1,199,997 pieces, whereof none was exercisable. On December 31, 2014 the total amount of issued stock option rights was 399,998 pieces, whereof none was exercisable. No stock option rights have been granted to the members of the Board.
Efore Management Ltd held a total 2,358,242 Efore Plc shares. Of these shares 273,842 shares were acquired through directed share issue to Efore Management Ltd on January 10, 2012. In this share issue the shares were owned by the company. The subscription price was 0.84 EUR per share. The directed share issue was registered in the reserve for invested unrestricted and reserve for own shares. Members of the Efore management team held through Efore Management 4.2% of the shares in Efore plc.
Efore Management Ltd had an EUR 1,356,000 loan granted by the Efore Plc. The interest rate of the loan was 3% and the loan was repaid before April 30, 2014. The contract was valid until the end of year 2013, and was therafter to be renewed according to the plan. The stock exchange price of the share was in 2013 and 2014 lower than the average acquisition price when Efore Management Ltd acquired the shares. Efore Management Ltd was not able to sell shares freely when the contract was valid.
The Members of the Management Group in Efore Plc held shares in Efore Management Ltd until the conclusion of the contract. During the fiscal year 2014 the Parent company Efore Ltd aqcuired the own shares held by Efore Management Ltd. The compensations to the Board Members were paid in cash in 2015 and 2014.
Shares of non-controlling interest Share of voting rightsNon-controlling interest
Profit / loss attributable toNon-controlling interest
Changes in equity attributable toNon-controlling interest
Non-controlling interest Home contry 2015 2014* 2015 2014 2015 2014Efore Management Oy Finland - 100% - 152 - 0Other subsidiaries, owned by noncontrolling interest, but not material noncontrolling interest in the Group. 1 0 0 0
* The contract ended in June 2014. Until the end of the contract Efore Management Ltd was consolidated into the financial statement of the Group on the basis of the partner contract.
52 EFORE ANNUAL REPORT 2015
NOTES TO THE GROUP FINANCIAL STATEMENTS, IFRS
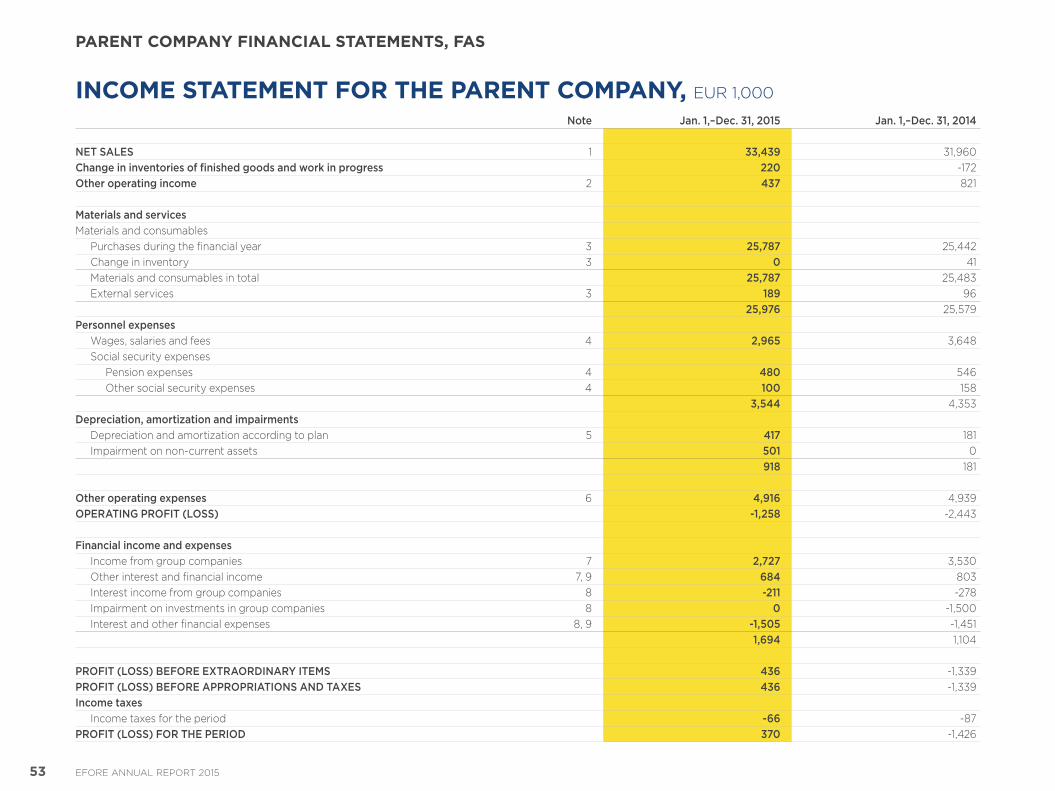
INCOME STATEMENT FOR THE PARENT COMPANY, EUR 1,000
Note Jan. 1,–Dec. 31, 2015 Jan. 1,–Dec. 31, 2014
NET SALES 1 33,439 31,960Change in inventories of finished goods and work in progress 220 172Other operating income 2 437 821
Materials and servicesMaterials and consumables
Purchases during the financial year 3 25,787 25,442Change in inventory 3 0 41Materials and consumables in total 25,787 25,483External services 3 189 96
25,976 25,579Personnel expenses
Wages, salaries and fees 4 2,965 3,648Social security expenses
Pension expenses 4 480 546Other social security expenses 4 100 158
3,544 4,353Depreciation, amortization and impairments
Depreciation and amortization according to plan 5 417 181Impairment on noncurrent assets 501 0
918 181
Other operating expenses 6 4,916 4,939OPERATING PROFIT (LOSS) -1,258 2,443 Financial income and expenses
Income from group companies 7 2,727 3,530Other interest and financial income 7, 9 684 803Interest income from group companies 8 -211 278Impairment on investments in group companies 8 0 1,500Interest and other financial expenses 8, 9 -1,505 1,451
1,694 1,104
PROFIT (LOSS) BEFORE EXTRAORDINARY ITEMS 436 1,339PROFIT (LOSS) BEFORE APPROPRIATIONS AND TAXES 436 1,339Income taxes
Income taxes for the period -66 87PROFIT (LOSS) FOR THE PERIOD 370 1,426
53 EFORE ANNUAL REPORT 2015
PARENT COMPANY FINANCIAL STATEMENTS, FAS
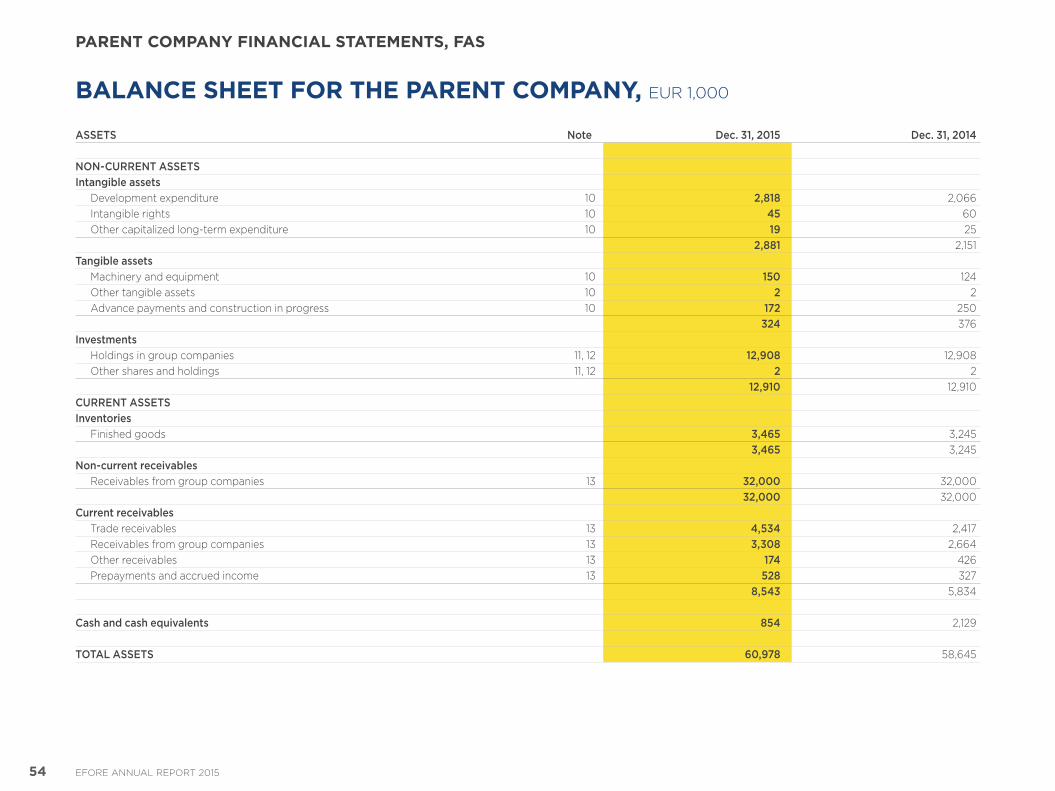
BALANCE SHEET FOR THE PARENT COMPANY, EUR 1,000
ASSETS Note Dec. 31, 2015 Dec. 31, 2014
NON-CURRENT ASSETSIntangible assets
Development expenditure 10 2,818 2,066Intangible rights 10 45 60Other capitalized longterm expenditure 10 19 25
2,881 2,151Tangible assets
Machinery and equipment 10 150 124Other tangible assets 10 2 2Advance payments and construction in progress 10 172 250
324 376Investments
Holdings in group companies 11, 12 12,908 12,908Other shares and holdings 11, 12 2 2
12,910 12,910CURRENT ASSETSInventories
Finished goods 3,465 3,2453,465 3,245
Non-current receivablesReceivables from group companies 13 32,000 32,000
32,000 32,000Current receivables
Trade receivables 13 4,534 2,417Receivables from group companies 13 3,308 2,664Other receivables 13 174 426Prepayments and accrued income 13 528 327
8,543 5,834
Cash and cash equivalents 854 2,129
TOTAL ASSETS 60,978 58,645
54 EFORE ANNUAL REPORT 2015
PARENT COMPANY FINANCIAL STATEMENTS, FAS
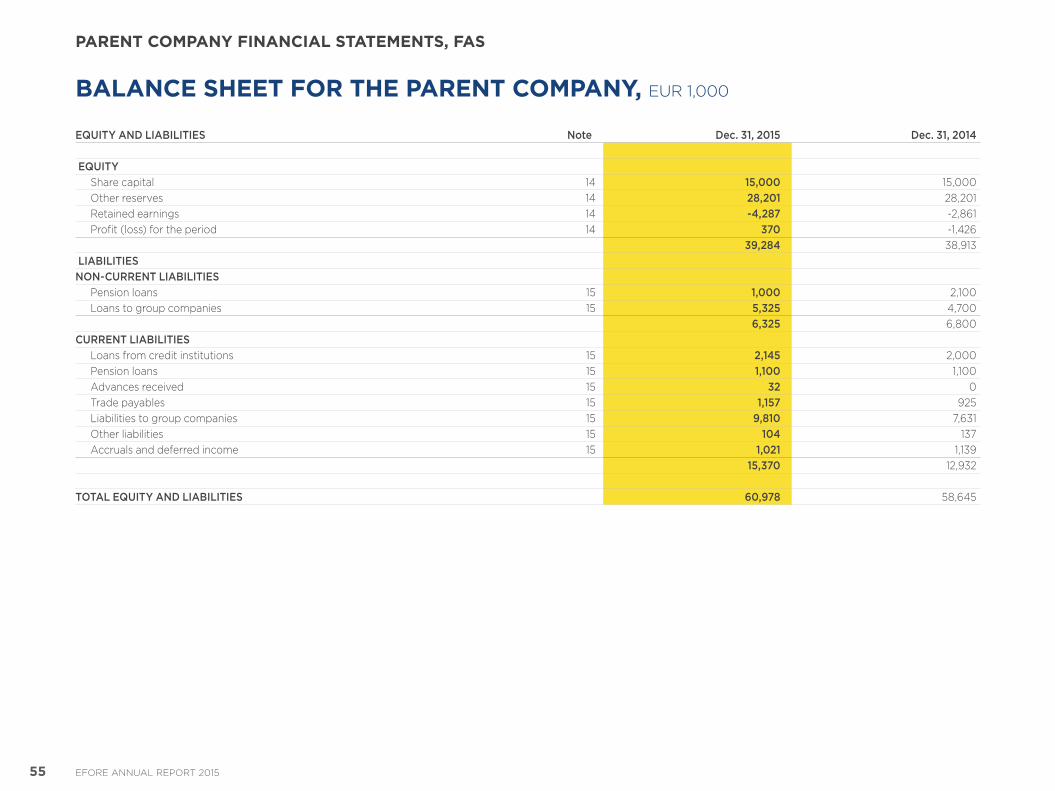
BALANCE SHEET FOR THE PARENT COMPANY, EUR 1,000
EQUITY AND LIABILITIES Note Dec. 31, 2015 Dec. 31, 2014
EQUITYShare capital 14 15,000 15,000Other reserves 14 28,201 28,201Retained earnings 14 -4,287 2,861Profit (loss) for the period 14 370 1,426
39,284 38,913 LIABILITIESNON-CURRENT LIABILITIES
Pension loans 15 1,000 2,100Loans to group companies 15 5,325 4,700
6,325 6,800CURRENT LIABILITIES
Loans from credit institutions 15 2,145 2,000Pension loans 15 1,100 1,100Advances received 15 32 0Trade payables 15 1,157 925Liabilities to group companies 15 9,810 7,631Other liabilities 15 104 137Accruals and deferred income 15 1,021 1,139
15,370 12,932
TOTAL EQUITY AND LIABILITIES 60,978 58,645
55 EFORE ANNUAL REPORT 2015
PARENT COMPANY FINANCIAL STATEMENTS, FAS
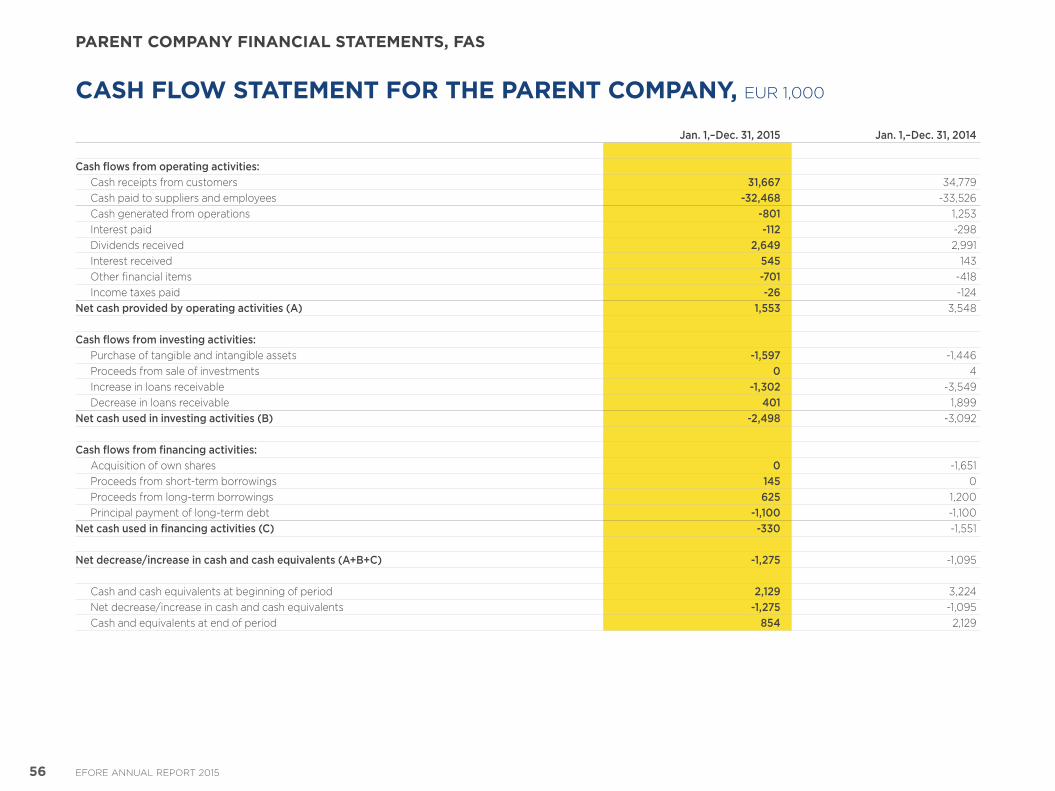
CASH FLOW STATEMENT FOR THE PARENT COMPANY, EUR 1,000
Jan. 1,–Dec. 31, 2015 Jan. 1,–Dec. 31, 2014
Cash flows from operating activities:Cash receipts from customers 31,667 34,779Cash paid to suppliers and employees -32,468 33,526Cash generated from operations -801 1,253Interest paid -112 298Dividends received 2,649 2,991Interest received 545 143Other financial items -701 418Income taxes paid -26 124
Net cash provided by operating activities (A) 1,553 3,548
Cash flows from investing activities:Purchase of tangible and intangible assets -1,597 1,446Proceeds from sale of investments 0 4Increase in loans receivable -1,302 3,549Decrease in loans receivable 401 1,899
Net cash used in investing activities (B) -2,498 3,092
Cash flows from financing activities:Acquisition of own shares 0 1,651Proceeds from shortterm borrowings 145 0Proceeds from longterm borrowings 625 1,200Principal payment of longterm debt -1,100 1,100
Net cash used in financing activities (C) -330 1,551
Net decrease/increase in cash and cash equivalents (A+B+C) -1,275 1,095
Cash and cash equivalents at beginning of period 2,129 3,224Net decrease/increase in cash and cash equivalents -1,275 1,095Cash and equivalents at end of period 854 2,129
56 EFORE ANNUAL REPORT 2015
PARENT COMPANY FINANCIAL STATEMENTS, FAS
ACCOUNTING POLICIES FOR THE FINANCIAL STATEMENTS OF PARENT COMPANYGENERALThe financial statements of Efore Plc (registered office in Espoo, Finland), are prepared and presented in accordance with the Finnish Accounting Act and other applicable laws and regulations in effect in Finland (Finnish Accounting Standards, FAS).
FOREIGN CURRENCY ITEMSTransactions in foreign currencies are recognized at the exchange rate valid on the date of transaction. Foreign currency receivables and liabilities on the balance sheet date are valued at the exchange rates on the balance sheet date. Exchange rate differences arising from the translation of balance sheet items in foreign currency and sales, purchases, expenses and financial items as well as from receivables and liabilities are recognised as exchange rate gains and losses in financial income and expenses. The presentation in the parent corresponds with the presentation in the consolidated financial statements.
Derivatives for hedging currency positions in balance sheet items are recognized at fair value and the change in fair value changes is recorded in financial items.
EVALUATION OF NON-CURRENT ASSETSIntangible and tangible assets are stated at historical cost less accumulated amortization, depreciation and impairment losses. Planned depreciation on intangible and tangible assets is made on a straightline basis over their estimated useful lives. Gains and losses on sale of intangible and tangible assets are included in the operating result.
The estimated useful lives for different groups of assets are as follows:Development expenditure 3–5 yearsIntangible rights 3–5 yearsOther capitalized longterm expenditure 5–10 yearsMachinery and equipment 3–10 yearsOther tangible assets 5 years
An impairment is recognized on the book value of an item in intangible and tangible assets, if it is evident that earnings expectations do not cover the book value of the asset.
Development expenditure relating to the largest projects are capitalized as intangible assets. The capitalized development expenditure is amortized over the financial periods in which income is generated.
Investments and receivables with a useful life of over one year are presented in noncurrent investments and receivables.
INVENTORIESInventories are stated at the lowest of historical cost, net realizable value or replacement cost.
In addition to variable costs for purchase and production, the cost of finished goods includes a proportion of the fixed purchasing and production costs. The weighted average cost is used in evaluation of raw materials.
PROVISIONSFuture expenditure and losses that the company is committed to cover but which have not yet realized are presented as provisions in the balance sheet. The provision includes warranty costs and other items. Changes in the provisions are recognized in the relevant expenses in the income statement.
NET SALESNet sales is the calculated by deducting from revenue discounts granted, indirect taxes and exchange rate differences from trade receivables.
LEASING All leasing charges are treated as rental expenses The unpaid leasing commitments related to future financial periods are presented as lease obligations in the notes to the financial statements.
PENSIONSThe pension cover of the company’s employees is arranged through insurance policies in pension insurance companies. Pension costs are expensed as incurred.
INCOME TAXESThe taxes of the fiscal year and the tax adjustments for previous fiscal years are recognized as income taxes in the profit and loss statement.
57 EFORE ANNUAL REPORT 2015
PARENT COMPANY FINANCIAL STATEMENTS, FAS
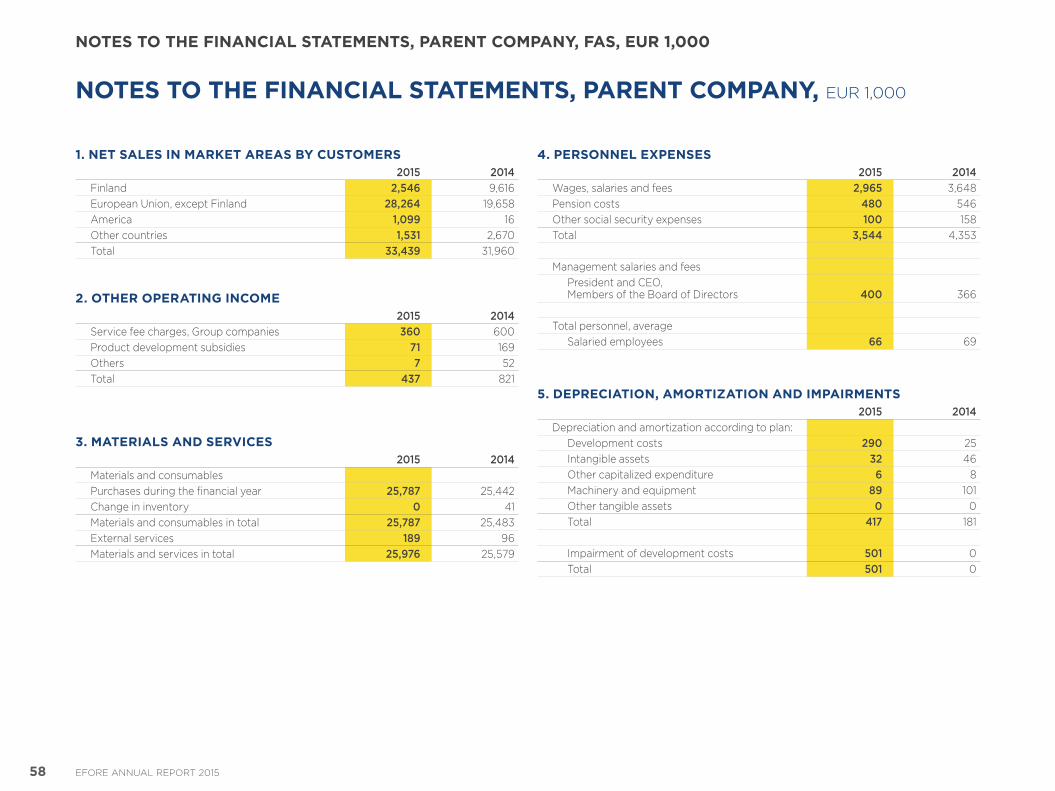
NOTES TO THE FINANCIAL STATEMENTS, PARENT COMPANY, EUR 1,000
1. NET SALES IN MARKET AREAS BY CUSTOMERS2015 2014
Finland 2,546 9,616European Union, except Finland 28,264 19,658America 1,099 16Other countries 1,531 2,670Total 33,439 31,960
2. OTHER OPERATING INCOME 2015 2014
Service fee charges, Group companies 360 600Product development subsidies 71 169Others 7 52Total 437 821
3. MATERIALS AND SERVICES2015 2014
Materials and consumablesPurchases during the financial year 25,787 25,442Change in inventory 0 41Materials and consumables in total 25,787 25,483External services 189 96Materials and services in total 25,976 25,579
4. PERSONNEL EXPENSES2015 2014
Wages, salaries and fees 2,965 3,648Pension costs 480 546Other social security expenses 100 158Total 3,544 4,353
Management salaries and feesPresident and CEO, Members of the Board of Directors 400 366
Total personnel, averageSalaried employees 66 69
5. DEPRECIATION, AMORTIZATION AND IMPAIRMENTS2015 2014
Depreciation and amortization according to plan:Development costs 290 25Intangible assets 32 46Other capitalized expenditure 6 8Machinery and equipment 89 101Other tangible assets 0 0Total 417 181
Impairment of development costs 501 0Total 501 0
58 EFORE ANNUAL REPORT 2015
NOTES TO THE FINANCIAL STATEMENTS, PARENT COMPANY, FAS, EUR 1,000
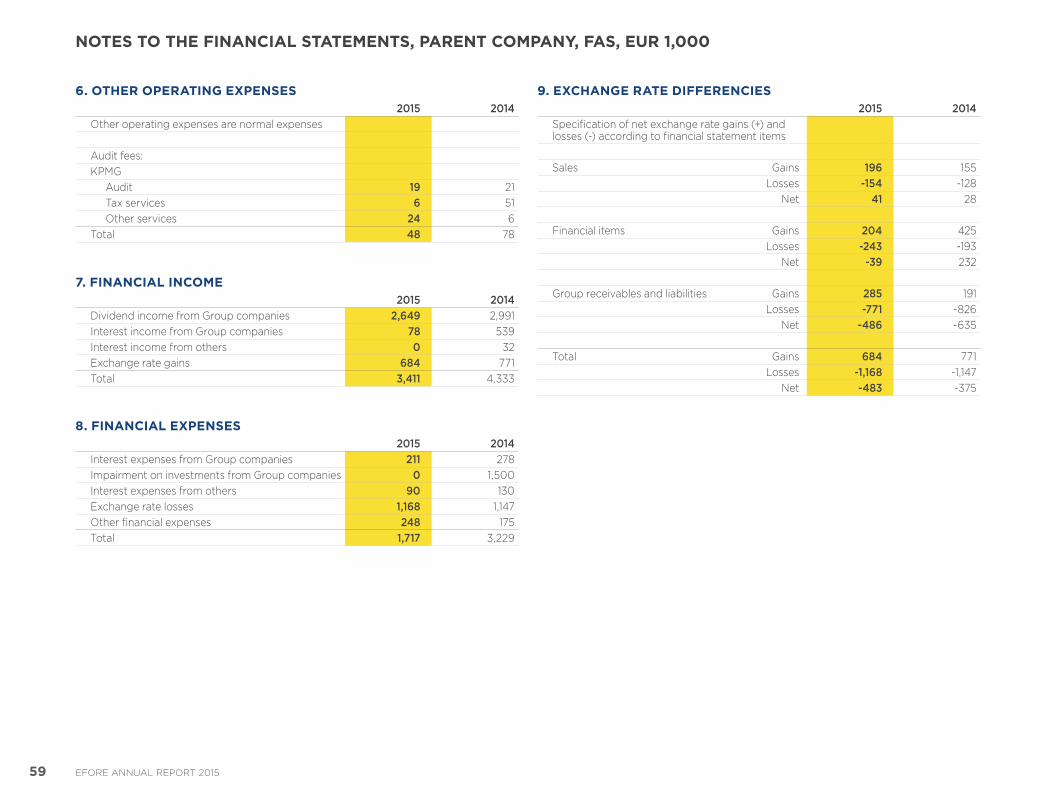
6. OTHER OPERATING EXPENSES2015 2014
Other operating expenses are normal expenses
Audit fees:KPMG
Audit 19 21Tax services 6 51Other services 24 6
Total 48 78
7. FINANCIAL INCOME2015 2014
Dividend income from Group companies 2,649 2,991Interest income from Group companies 78 539Interest income from others 0 32Exchange rate gains 684 771Total 3,411 4,333
8. FINANCIAL EXPENSES2015 2014
Interest expenses from Group companies 211 278Impairment on investments from Group companies 0 1,500Interest expenses from others 90 130Exchange rate losses 1,168 1,147Other financial expenses 248 175Total 1,717 3,229
9. EXCHANGE RATE DIFFERENCIES2015 2014
Specification of net exchange rate gains (+) and losses () according to financial statement items
Sales Gains 196 155 Losses -154 128 Net 41 28
Financial items Gains 204 425 Losses -243 193 Net -39 232
Group receivables and liabilities Gains 285 191 Losses -771 826 Net -486 635
Total Gains 684 771 Losses -1,168 1,147 Net -483 375
59 EFORE ANNUAL REPORT 2015
NOTES TO THE FINANCIAL STATEMENTS, PARENT COMPANY, FAS, EUR 1,000
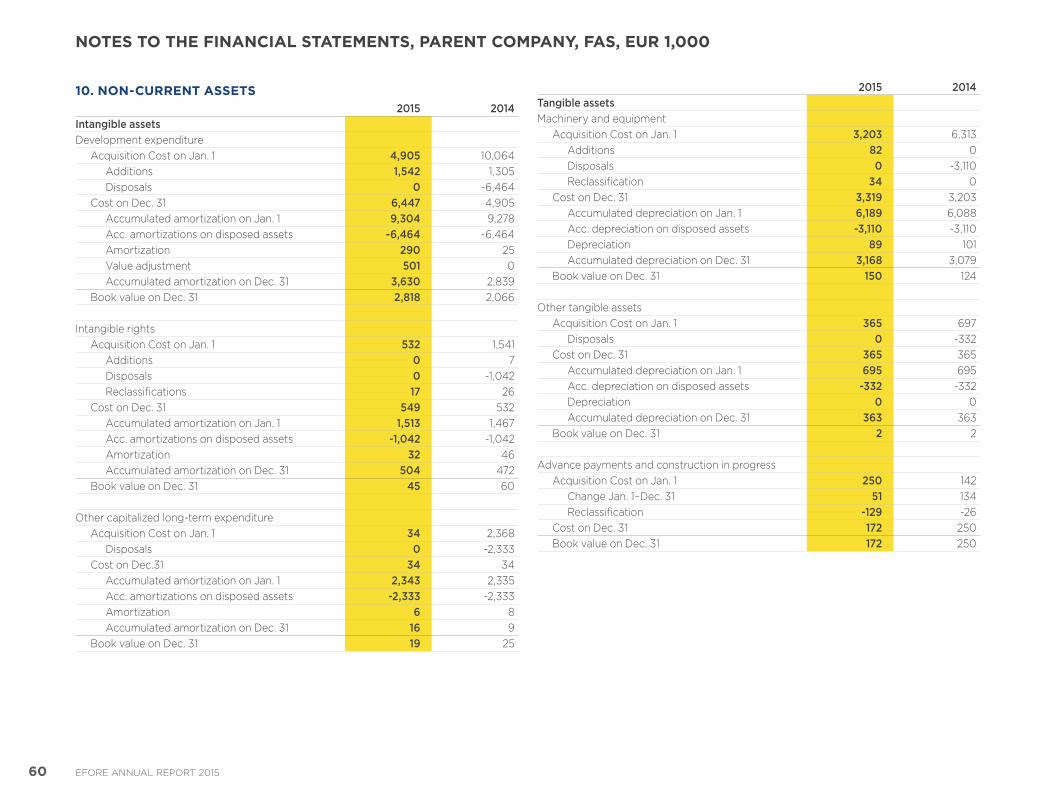
10. NON-CURRENT ASSETS2015 2014
Intangible assetsDevelopment expenditure
Acquisition Cost on Jan. 1 4,905 10,064Additions 1,542 1,305Disposals 0 6,464
Cost on Dec. 31 6,447 4,905Accumulated amortization on Jan. 1 9,304 9,278Acc. amortizations on disposed assets -6,464 6,464Amortization 290 25Value adjustment 501 0Accumulated amortization on Dec. 31 3,630 2,839
Book value on Dec. 31 2,818 2,066
Intangible rightsAcquisition Cost on Jan. 1 532 1,541
Additions 0 7Disposals 0 1,042Reclassifications 17 26
Cost on Dec. 31 549 532Accumulated amortization on Jan. 1 1,513 1,467Acc. amortizations on disposed assets -1,042 1,042Amortization 32 46Accumulated amortization on Dec. 31 504 472
Book value on Dec. 31 45 60
Other capitalized longterm expenditureAcquisition Cost on Jan. 1 34 2,368
Disposals 0 2,333Cost on Dec.31 34 34
Accumulated amortization on Jan. 1 2,343 2,335Acc. amortizations on disposed assets -2,333 2,333Amortization 6 8Accumulated amortization on Dec. 31 16 9
Book value on Dec. 31 19 25
2015 2014Tangible assetsMachinery and equipment
Acquisition Cost on Jan. 1 3,203 6,313Additions 82 0Disposals 0 3,110Reclassification 34 0
Cost on Dec. 31 3,319 3,203Accumulated depreciation on Jan. 1 6,189 6,088Acc. depreciation on disposed assets -3,110 3,110Depreciation 89 101Accumulated depreciation on Dec. 31 3,168 3,079
Book value on Dec. 31 150 124
Other tangible assetsAcquisition Cost on Jan. 1 365 697
Disposals 0 332Cost on Dec. 31 365 365
Accumulated depreciation on Jan. 1 695 695Acc. depreciation on disposed assets -332 332Depreciation 0 0Accumulated depreciation on Dec. 31 363 363
Book value on Dec. 31 2 2
Advance payments and construction in progressAcquisition Cost on Jan. 1 250 142
Change Jan. 1–Dec. 31 51 134Reclassification -129 26
Cost on Dec. 31 172 250Book value on Dec. 31 172 250
60 EFORE ANNUAL REPORT 2015
NOTES TO THE FINANCIAL STATEMENTS, PARENT COMPANY, FAS, EUR 1,000
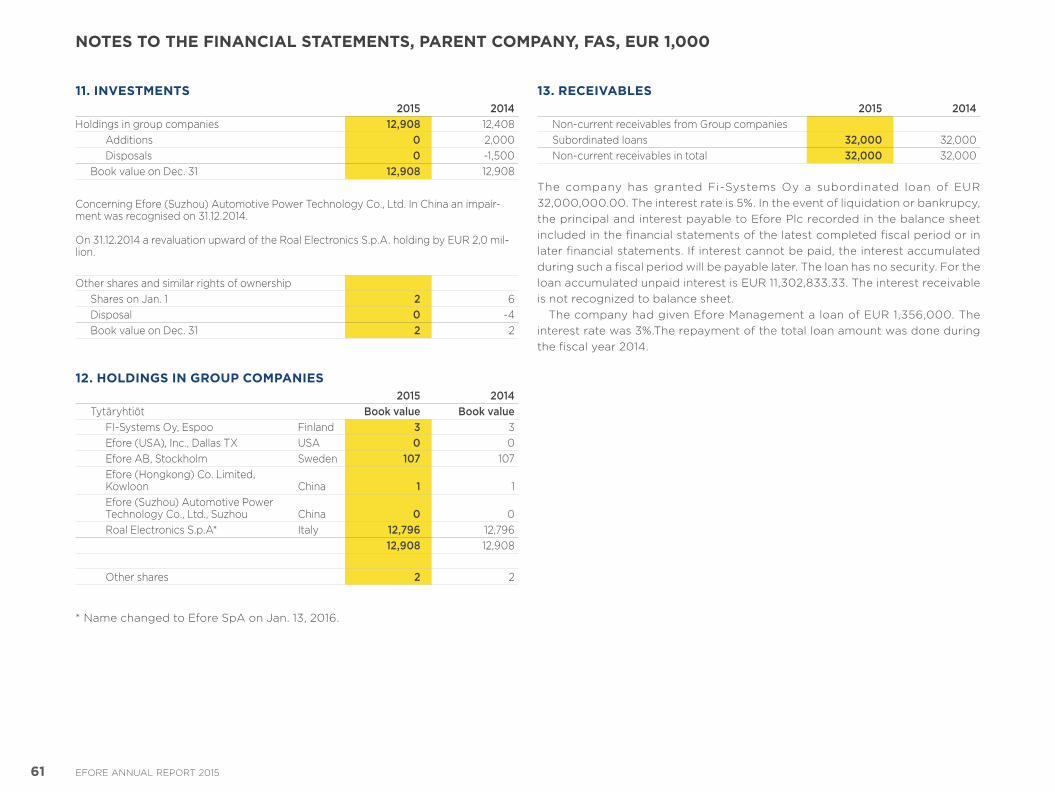
11. INVESTMENTS2015 2014
Holdings in group companies 12,908 12,408Additions 0 2,000Disposals 0 1,500
Book value on Dec. 31 12,908 12,908
Concerning Efore (Suzhou) Automotive Power Technology Co., Ltd. In China an impairment was recognised on 31.12.2014.
On 31.12.2014 a revaluation upward of the Roal Electronics S.p.A. holding by EUR 2,0 million.
Other shares and similar rights of ownershipShares on Jan. 1 2 6Disposal 0 4Book value on Dec. 31 2 2
12. HOLDINGS IN GROUP COMPANIES2015 2014
Tytäryhtiöt Book value Book valueFISystems Oy, Espoo Finland 3 3Efore (USA), Inc., Dallas TX USA 0 0Efore AB, Stockholm Sweden 107 107Efore (Hongkong) Co. Limited, Kowloon China 1 1Efore (Suzhou) Automotive Power Technology Co., Ltd., Suzhou China 0 0Roal Electronics S.p.A* Italy 12,796 12,796
12,908 12,908
Other shares 2 2
* Name changed to Efore SpA on Jan. 13, 2016.
13. RECEIVABLES 2015 2014
Noncurrent receivables from Group companiesSubordinated loans 32,000 32,000Noncurrent receivables in total 32,000 32,000
The company has granted FiSystems Oy a subordinated loan of EUR 32,000,000.00. The interest rate is 5%. In the event of liquidation or bankrupcy, the principal and interest payable to Efore Plc recorded in the balance sheet included in the financial statements of the latest completed fiscal period or in later financial statements. If interest cannot be paid, the interest accumulated during such a fiscal period will be payable later. The loan has no security. For the loan accumulated unpaid interest is EUR 11,302,833.33. The interest receivable is not recognized to balance sheet.
The company had given Efore Management a loan of EUR 1,356,000. The interest rate was 3%.The repayment of the total loan amount was done during the fiscal year 2014.
61 EFORE ANNUAL REPORT 2015
NOTES TO THE FINANCIAL STATEMENTS, PARENT COMPANY, FAS, EUR 1,000
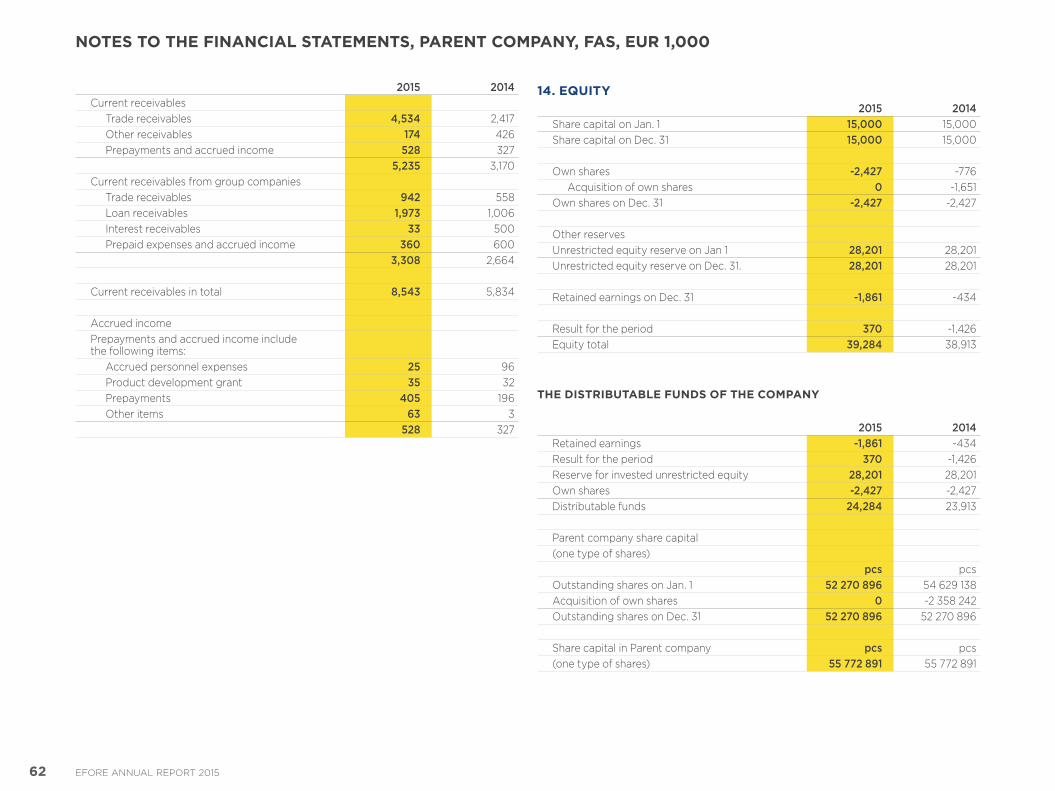
2015 2014Current receivables
Trade receivables 4,534 2,417Other receivables 174 426Prepayments and accrued income 528 327
5,235 3,170Current receivables from group companies
Trade receivables 942 558Loan receivables 1,973 1,006Interest receivables 33 500Prepaid expenses and accrued income 360 600
3,308 2,664
Current receivables in total 8,543 5,834
Accrued incomePrepayments and accrued income include the following items:
Accrued personnel expenses 25 96Product development grant 35 32Prepayments 405 196Other items 63 3
528 327
14. EQUITY2015 2014
Share capital on Jan. 1 15,000 15,000Share capital on Dec. 31 15,000 15,000
Own shares -2,427 776Acquisition of own shares 0 1,651
Own shares on Dec. 31 -2,427 2,427
Other reservesUnrestricted equity reserve on Jan 1 28,201 28,201Unrestricted equity reserve on Dec. 31. 28,201 28,201
Retained earnings on Dec. 31 -1,861 434
Result for the period 370 1,426Equity total 39,284 38,913
THE DISTRIBUTABLE FUNDS OF THE COMPANY
2015 2014Retained earnings -1,861 434Result for the period 370 1,426Reserve for invested unrestricted equity 28,201 28,201Own shares -2,427 2,427Distributable funds 24,284 23,913
Parent company share capital (one type of shares)
pcs pcsOutstanding shares on Jan. 1 52 270 896 54 629 138Acquisition of own shares 0 2 358 242Outstanding shares on Dec. 31 52 270 896 52 270 896
Share capital in Parent company pcs pcs(one type of shares) 55 772 891 55 772 891
62 EFORE ANNUAL REPORT 2015
NOTES TO THE FINANCIAL STATEMENTS, PARENT COMPANY, FAS, EUR 1,000
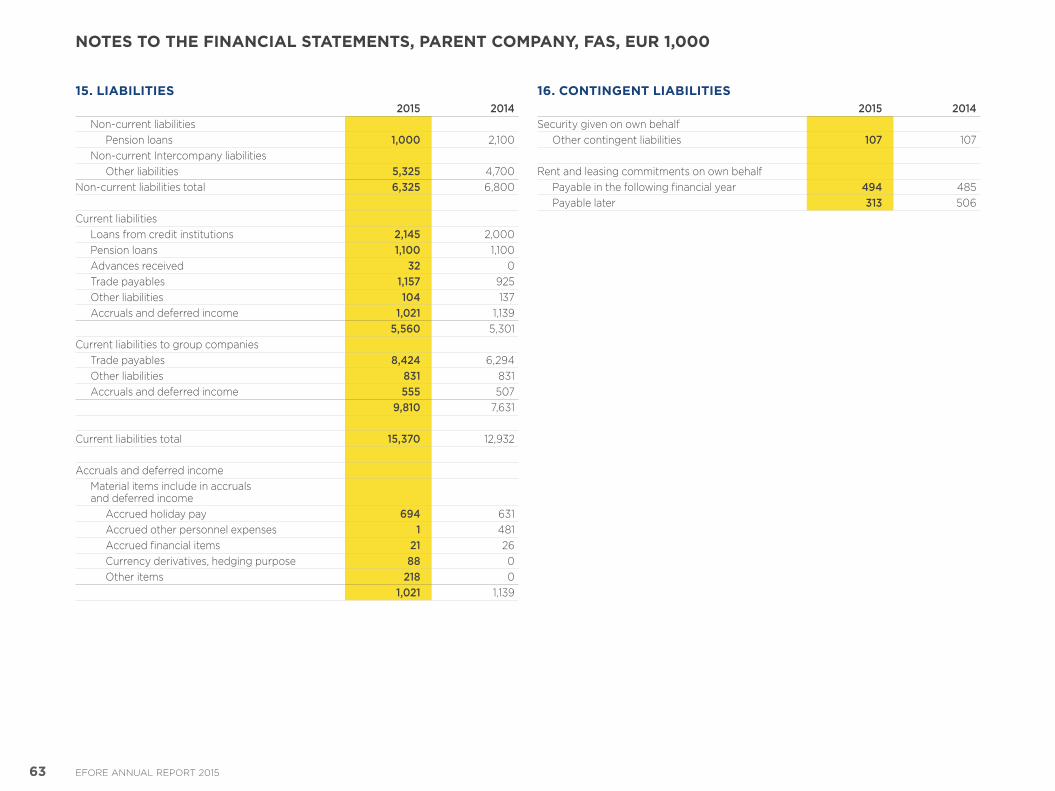
15. LIABILITIES2015 2014
Noncurrent liabilitiesPension loans 1,000 2,100
Noncurrent Intercompany liabilitiesOther liabilities 5,325 4,700
Noncurrent liabilities total 6,325 6,800
Current liabilitiesLoans from credit institutions 2,145 2,000Pension loans 1,100 1,100Advances received 32 0Trade payables 1,157 925Other liabilities 104 137Accruals and deferred income 1,021 1,139
5,560 5,301Current liabilities to group companies
Trade payables 8,424 6,294Other liabilities 831 831Accruals and deferred income 555 507
9,810 7,631
Current liabilities total 15,370 12,932
Accruals and deferred incomeMaterial items include in accruals and deferred income
Accrued holiday pay 694 631Accrued other personnel expenses 1 481Accrued financial items 21 26Currency derivatives, hedging purpose 88 0Other items 218 0
1,021 1,139
16. CONTINGENT LIABILITIES2015 2014
Security given on own behalfOther contingent liabilities 107 107
Rent and leasing commitments on own behalfPayable in the following financial year 494 485Payable later 313 506
63 EFORE ANNUAL REPORT 2015
NOTES TO THE FINANCIAL STATEMENTS, PARENT COMPANY, FAS, EUR 1,000
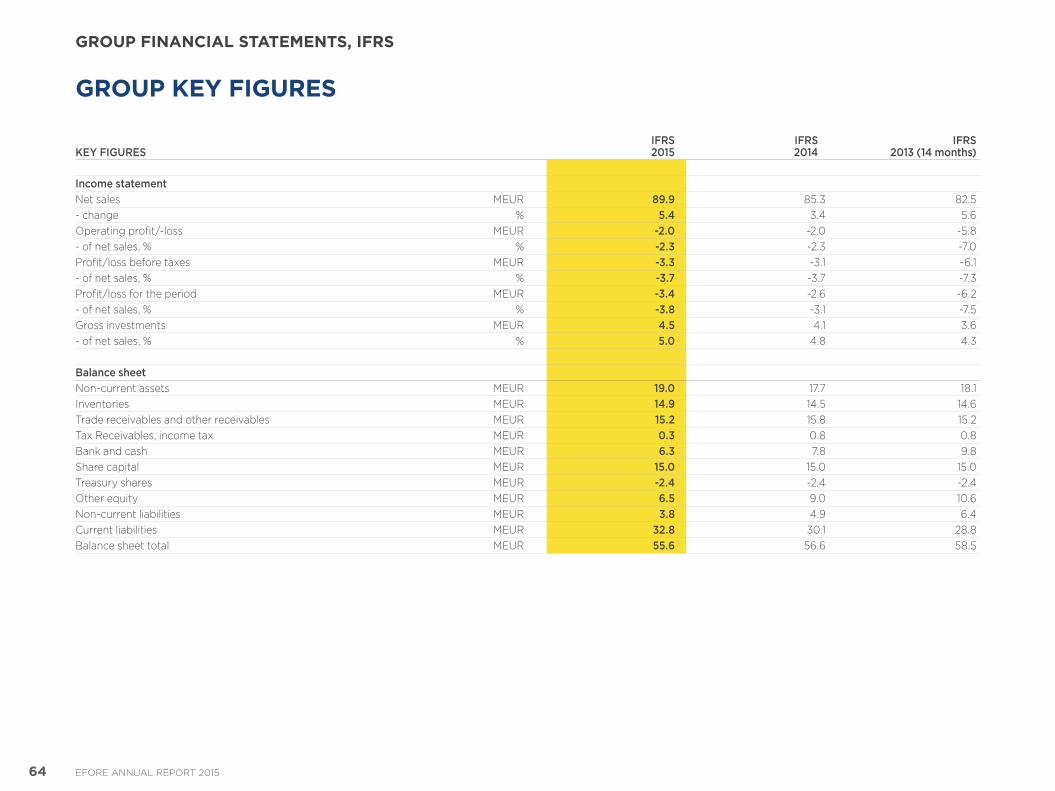
GROUP KEY FIGURES
KEY FIGURESIFRS 2015
IFRS 2014
IFRS2013 (14 months)
Income statementNet sales MEUR 89.9 85.3 82.5 change % 5.4 3.4 5.6Operating profit/loss MEUR -2.0 2.0 5.8 of net sales, % % -2.3 2.3 7.0Profit/loss before taxes MEUR -3.3 3.1 6.1 of net sales, % % -3.7 3.7 7.3Profit/loss for the period MEUR -3.4 2.6 6.2 of net sales, % % -3.8 3.1 7.5Gross investments MEUR 4.5 4.1 3.6 of net sales, % % 5.0 4.8 4.3
Balance sheetNoncurrent assets MEUR 19.0 17.7 18.1Inventories MEUR 14.9 14.5 14.6Trade receivables and other receivables MEUR 15.2 15.8 15.2Tax Receivables, income tax MEUR 0.3 0.8 0.8Bank and cash MEUR 6.3 7.8 9.8Share capital MEUR 15.0 15.0 15.0Treasury shares MEUR -2.4 2.4 2.4Other equity MEUR 6.5 9.0 10.6Noncurrent liabilities MEUR 3.8 4.9 6.4Current liabilities MEUR 32.8 30.1 28.8Balance sheet total MEUR 55.6 56.6 58.5
64 EFORE ANNUAL REPORT 2015
GROUP FINANCIAL STATEMENTS, IFRS
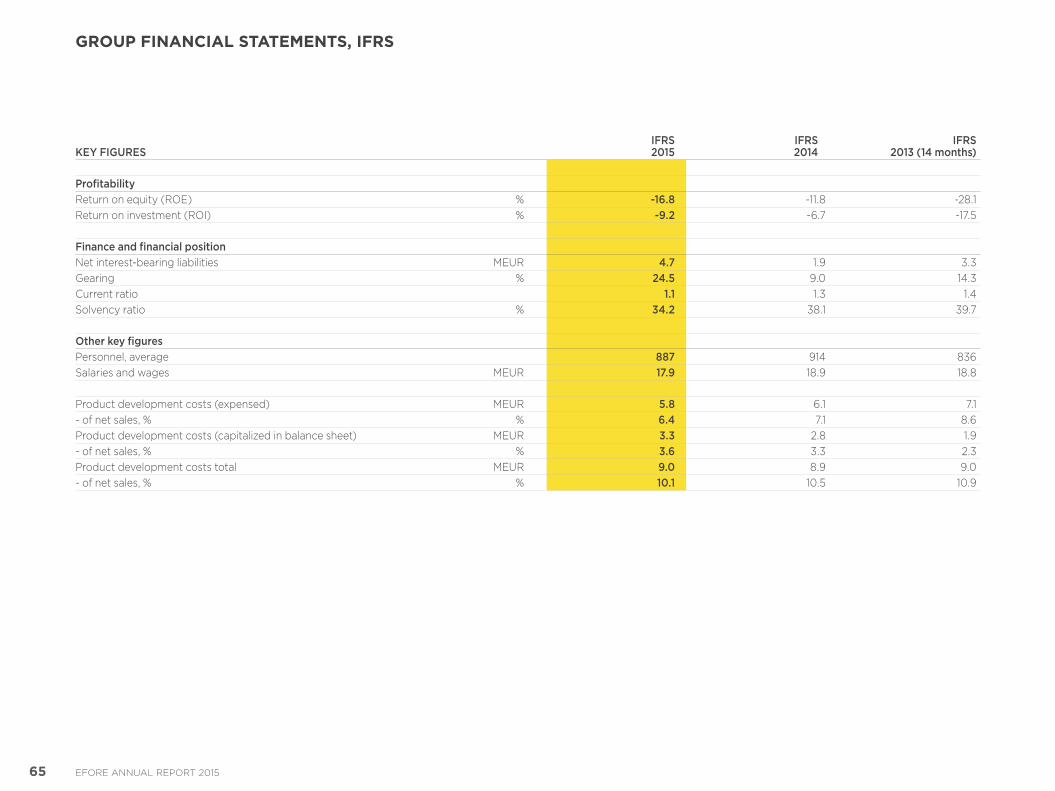
KEY FIGURESIFRS 2015
IFRS 2014
IFRS2013 (14 months)
ProfitabilityReturn on equity (ROE) % -16.8 11.8 28.1Return on investment (ROI) % -9.2 6.7 17.5
Finance and financial positionNet interestbearing liabilities MEUR 4.7 1.9 3.3Gearing % 24.5 9.0 14.3Current ratio 1.1 1.3 1.4Solvency ratio % 34.2 38.1 39.7
Other key figuresPersonnel, average 887 914 836Salaries and wages MEUR 17.9 18.9 18.8
Product development costs (expensed) MEUR 5.8 6.1 7.1 of net sales, % % 6.4 7.1 8.6Product development costs (capitalized in balance sheet) MEUR 3.3 2.8 1.9 of net sales, % % 3.6 3.3 2.3Product development costs total MEUR 9.0 8.9 9.0 of net sales, % % 10.1 10.5 10.9
65 EFORE ANNUAL REPORT 2015
GROUP FINANCIAL STATEMENTS, IFRS
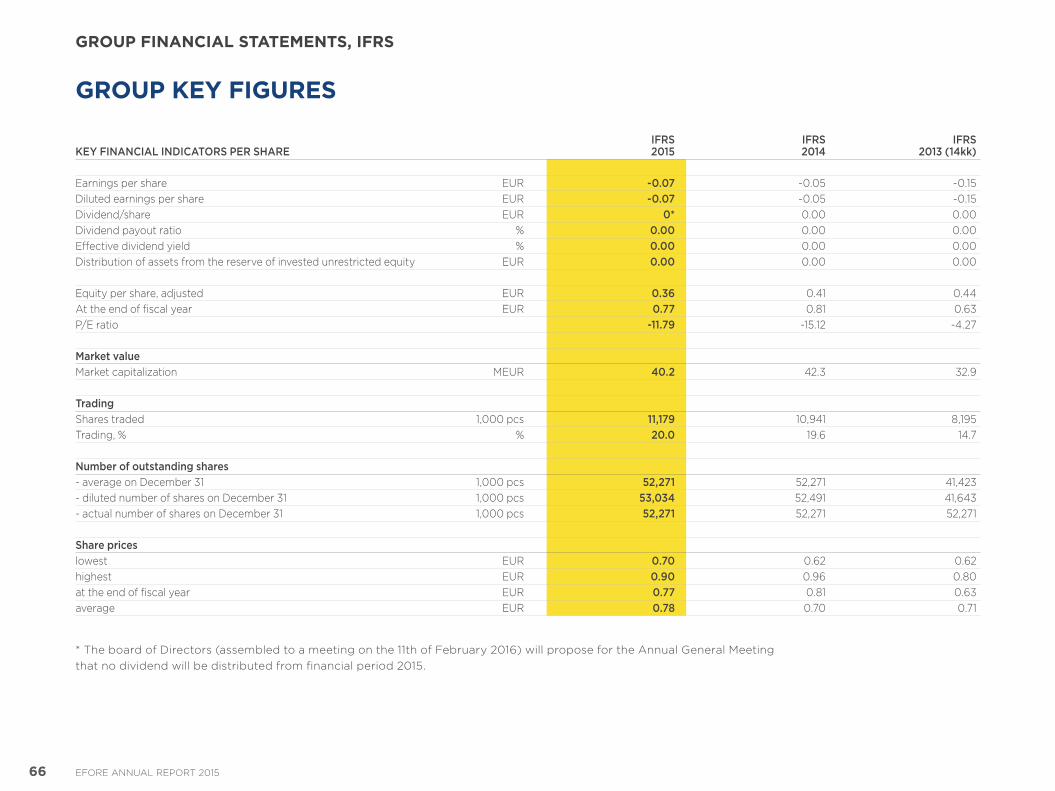
KEY FINANCIAL INDICATORS PER SHAREIFRS2015
IFRS2014
IFRS2013 (14kk)
Earnings per share EUR -0.07 0.05 0.15Diluted earnings per share EUR -0.07 0.05 0.15Dividend/share EUR 0* 0.00 0.00Dividend payout ratio % 0.00 0.00 0.00Effective dividend yield % 0.00 0.00 0.00Distribution of assets from the reserve of invested unrestricted equity EUR 0.00 0.00 0.00
Equity per share, adjusted EUR 0.36 0.41 0.44At the end of fiscal year EUR 0.77 0.81 0.63P/E ratio -11.79 15.12 4.27
Market value Market capitalization MEUR 40.2 42.3 32.9
TradingShares traded 1,000 pcs 11,179 10,941 8,195Trading, % % 20.0 19.6 14.7
Number of outstanding shares average on December 31 1,000 pcs 52,271 52,271 41,423 diluted number of shares on December 31 1,000 pcs 53,034 52,491 41,643 actual number of shares on December 31 1,000 pcs 52,271 52,271 52,271
Share priceslowest EUR 0.70 0.62 0.62highest EUR 0.90 0.96 0.80at the end of fiscal year EUR 0.77 0.81 0.63average EUR 0.78 0.70 0.71
* The board of Directors (assembled to a meeting on the 11th of February 2016) will propose for the Annual General Meeting that no dividend will be distributed from financial period 2015.
GROUP KEY FIGURES
66 EFORE ANNUAL REPORT 2015
GROUP FINANCIAL STATEMENTS, IFRS
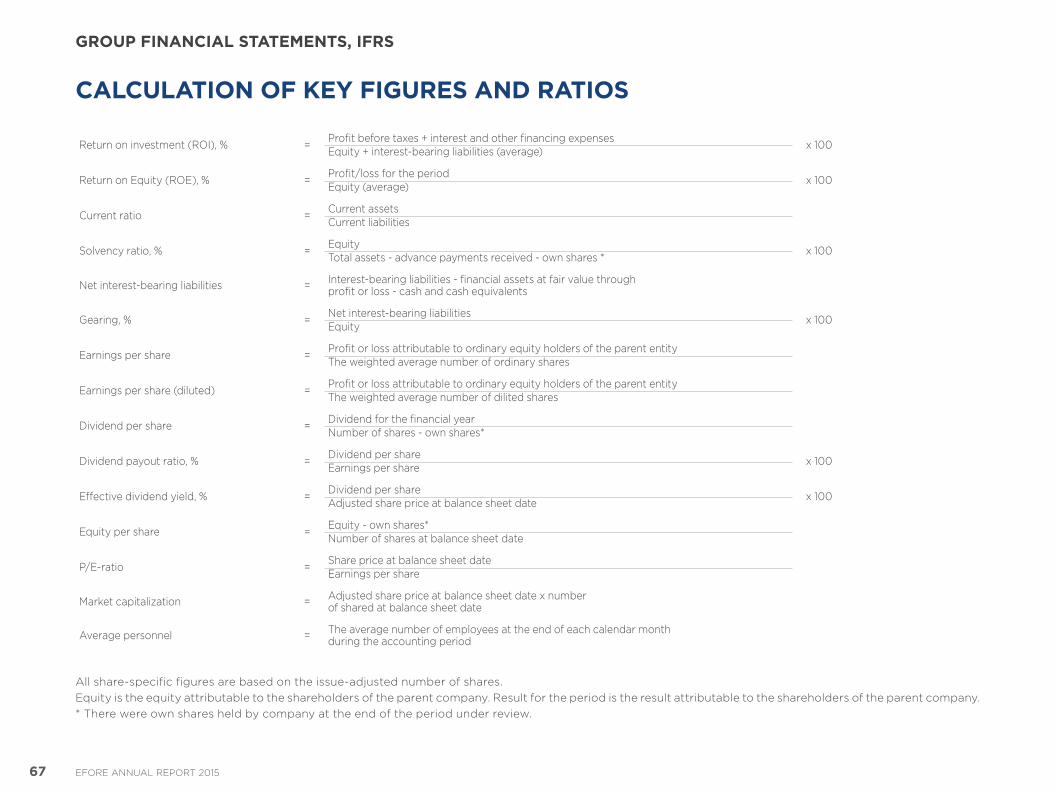
CALCULATION OF KEY FIGURES AND RATIOS
Return on investment (ROI), % = Profit before taxes + interest and other financing expenses x 100Equity + interestbearing liabilities (average)
Return on Equity (ROE), % = Profit/loss for the period x 100Equity (average)
Current ratio = Current assetsCurrent liabilities
Solvency ratio, % = Equity x 100Total assets advance payments received own shares *
Net interestbearing liabilities = Interestbearing liabilities financial assets at fair value through profit or loss cash and cash equivalents
Gearing, % = Net interestbearing liabilities x 100Equity
Earnings per share = Profit or loss attributable to ordinary equity holders of the parent entityThe weighted average number of ordinary shares
Earnings per share (diluted) = Profit or loss attributable to ordinary equity holders of the parent entityThe weighted average number of dilited shares
Dividend per share = Dividend for the financial yearNumber of shares own shares*
Dividend payout ratio, % = Dividend per share x 100Earnings per share
Effective dividend yield, % = Dividend per share x 100Adjusted share price at balance sheet date
Equity per share = Equity own shares*Number of shares at balance sheet date
P/Eratio = Share price at balance sheet dateEarnings per share
Market capitalization = Adjusted share price at balance sheet date x number of shared at balance sheet date
Average personnel = The average number of employees at the end of each calendar month during the accounting period
All sharespecific figures are based on the issueadjusted number of shares.Equity is the equity attributable to the shareholders of the parent company. Result for the period is the result attributable to the shareholders of the parent company.* There were own shares held by company at the end of the period under review.
67 EFORE ANNUAL REPORT 2015
GROUP FINANCIAL STATEMENTS, IFRS
SHARES AND SHAREHOLDERS
SHARE CAPITAL AND SHARESEfore share is quoted at Nasdaq Helsinki Oy (Small Cap) under the corporate identifier EFO1V. The trading lot is one share. The total number of shares is 55,772,891. Efore’s registered share capital on December 31, 2015 stood at EUR 15,000,000.00. The shares have been entered in the bookentry securities system.
At the end of fiscal year the number of the Group’s own shares was 3,501,995.
BOARD AUTHORIZATIONS
Authorizing the Board of Directors to resolve on the acquisition of the company’s own sharesEfore’s Annual General Meeting on March 31, 2015 decided in accordance with the proposal of the Board of Directors, to authorize the Board of Directors to resolve on the acquisition of the company’s own shares or their acceptance as pledge, in one or several instalments, on the following terms and conditions:
Based on the authorization an aggregate maximum of 4,000,000 own shares corresponding to approximately 7.2% of all the shares in the company may be acquired. Shares in the company may be acquired only by using the company’s unrestricted equity. The shares may be acquired in public trading arranged by the Nasdaq Helsinki Oy at the prevailing market price on the date of acquisition, or at a price
otherwise formed on the market. The Board of Directors resolves the manner in which own shares are acquired or accepted as a pledge. The acquisition may be made using, inter alia, derivatives. Shares may be acquired otherwise than in proportion to the holdings of the shareholders (directed acquisition).
The authorization cancels the authorization given by the Annual General Meeting on April 10, 2014 to resolve on the acquisition of the company’s own shares.
The authorization is valid until June 30, 2016.
The Board did not use the authorization in 2015.
Authorizing the Board of Directors to decide on the issue of shares as well as the issue of options and other special rights entitling to sharesEfore’s Annual General Meeting on March 31, 2015 decided in accordance with the proposal of the Board of Directors, to authorize the Board of Directors to, in one or more transactions, decide on the issuance of shares and the issuance of options and other special rights entitling to shares referred to in chapter 10 section 1 of the Companies Act as follows:
The number of shares to be issued based on the authorization may in total amount to a maximum of 5,000,000 shares, corresponding to approximately 9.0% of all the shares in the company.
The Board of Directors decides on all the terms and conditions of the issuances of shares and special rights entitling to shares. The authorization concerns both the issuance of new shares as well as the transfer of treasury shares. The issuance of shares and special rights entitling to shares may be carried out in deviation from the shareholders’ preemptive rights (directed issue).
The authorization cancels the authorization given by the Annual General Meeting on April 10, 2014 to decide on the issuance of shares and special rights entitling to shares.
The authorization is valid until June 30, 2016.
The Board of Directors did not use the authorization in 2015.
SHARE PRICE AND TRADINGThe highest share price during the financial year was EUR 0.90 and the lowest price was EUR 0.70. The average price during the financial year was EUR 0.78 and the closing price was EUR 0.77. The market capitalization calculated at the final trading price during the financial year was EUR 40.2 million.
The total number of Efore shares traded on the Nasdaq Helsinki during the financial year was 11.2 million pcs and their turnover value was EUR 8.7 million. This accounted for 20.0% of the total number of shares 55,772,891 pcs. The number of shareholders totalled
2704 (2819) at the end of the financial year.
MANAGEMENT SHAREHOLDINGThe total share ownership, of Efore Plc’s Board members stood at 1,301,642 pcs on December 31, 2015, which is equivalent to 2.3% of the total number of shares and votes. The President and CEO owns 10,000 pcs Efore shares, 200,000 pcs option rights A, 200,000 pcs option rights B and 200,000 pcs option rights C. The Board members do not own option rights.
68 EFORE ANNUAL REPORT 2015
FINANCIAL STATEMENTS
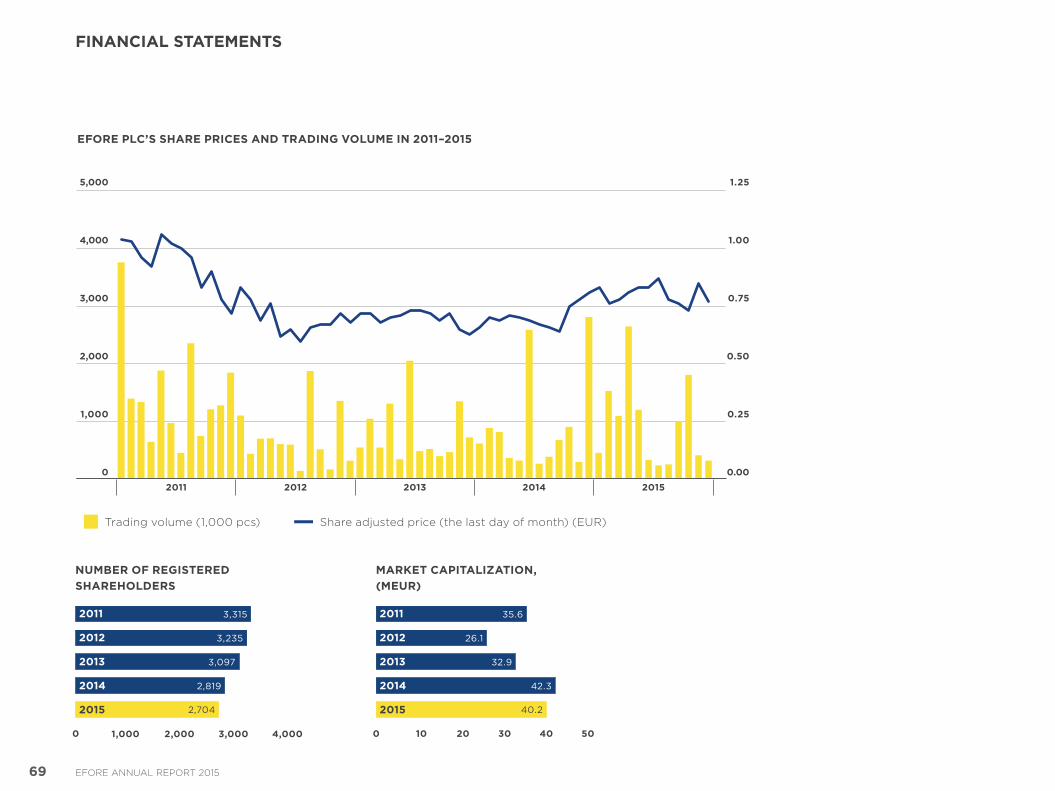
EFORE PLC’S SHARE PRICES AND TRADING VOLUME IN 2011–2015
Trading volume (1,000 pcs) Share adjusted price (the last day of month) (EUR)
5,000
4,000
3,000
2,000
1,000
0
1.25
1.00
0.75
0.50
0.25
0.002012 2013 2014 20152011
MARKET CAPITALIZATION, (MEUR)
NUMBER OF REGISTERED SHAREHOLDERS
0 502010 300 4,0001,000 2,000 3,000
2011
2012
2013
2014
2015
40
2011
2012
2013
2014
2015
3,315 35.6
26.1
32.9
42.3
3,235
3,097
2,819
2,704 40.2
69 EFORE ANNUAL REPORT 2015
FINANCIAL STATEMENTS
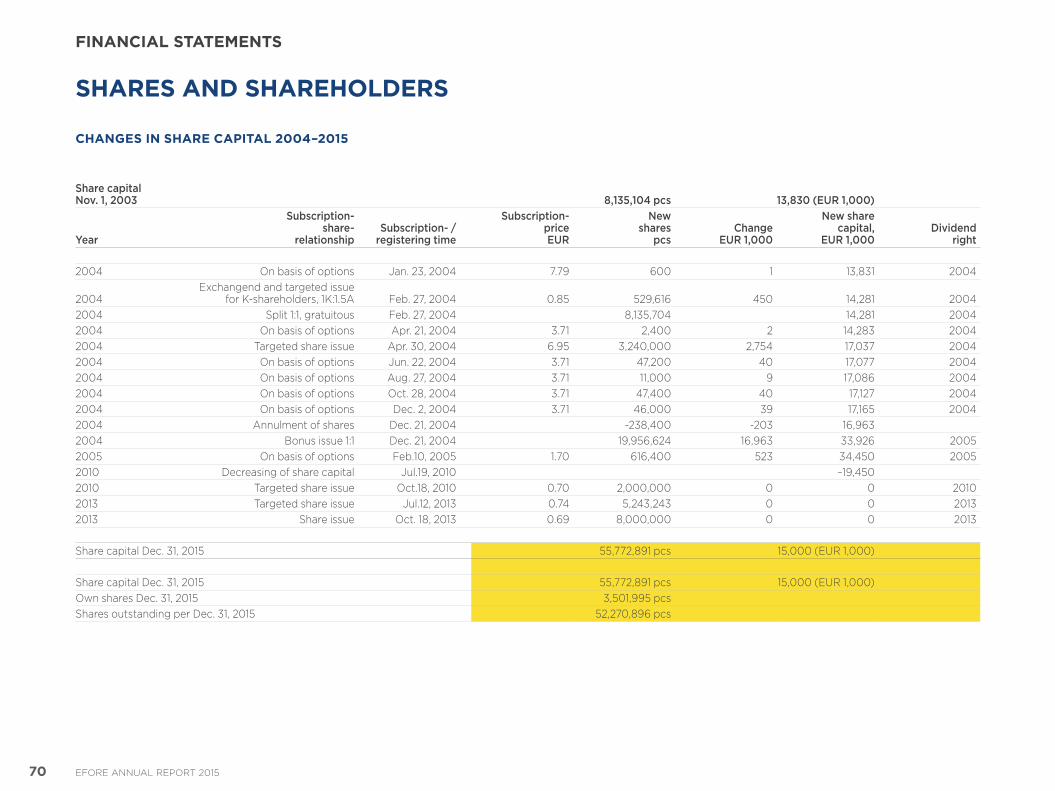
SHARES AND SHAREHOLDERS CHANGES IN SHARE CAPITAL 2004–2015
Share capital Nov. 1, 2003 8,135,104 pcs 13,830 (EUR 1,000)
Year
Subscription- share-
relationshipSubscription- /
registering time
Subscription- priceEUR
New shares
pcsChange
EUR 1,000
New share capital,
EUR 1,000Dividend
right
2004 On basis of options Jan. 23, 2004 7.79 600 1 13,831 2004
2004Exchangend and targeted issue
for Kshareholders, 1K:1.5A Feb. 27, 2004 0.85 529,616 450 14,281 20042004 Split 1:1, gratuitous Feb. 27, 2004 8,135,704 14,281 20042004 On basis of options Apr. 21, 2004 3.71 2,400 2 14,283 20042004 Targeted share issue Apr. 30, 2004 6.95 3,240,000 2,754 17,037 20042004 On basis of options Jun. 22, 2004 3.71 47,200 40 17,077 20042004 On basis of options Aug. 27, 2004 3.71 11,000 9 17,086 20042004 On basis of options Oct. 28, 2004 3.71 47,400 40 17,127 20042004 On basis of options Dec. 2, 2004 3.71 46,000 39 17,165 20042004 Annulment of shares Dec. 21, 2004 238,400 203 16,9632004 Bonus issue 1:1 Dec. 21, 2004 19,956,624 16,963 33,926 20052005 On basis of options Feb.10, 2005 1.70 616,400 523 34,450 20052010 Decreasing of share capital Jul.19, 2010 –19,4502010 Targeted share issue Oct.18, 2010 0.70 2,000,000 0 0 20102013 Targeted share issue Jul.12, 2013 0.74 5,243,243 0 0 20132013 Share issue Oct. 18, 2013 0.69 8,000,000 0 0 2013
Share capital Dec. 31, 2015 55,772,891 pcs 15,000 (EUR 1,000)
Share capital Dec. 31, 2015 55,772,891 pcs 15,000 (EUR 1,000)Own shares Dec. 31, 2015 3,501,995 pcsShares outstanding per Dec. 31, 2015 52,270,896 pcs
70 EFORE ANNUAL REPORT 2015
FINANCIAL STATEMENTS
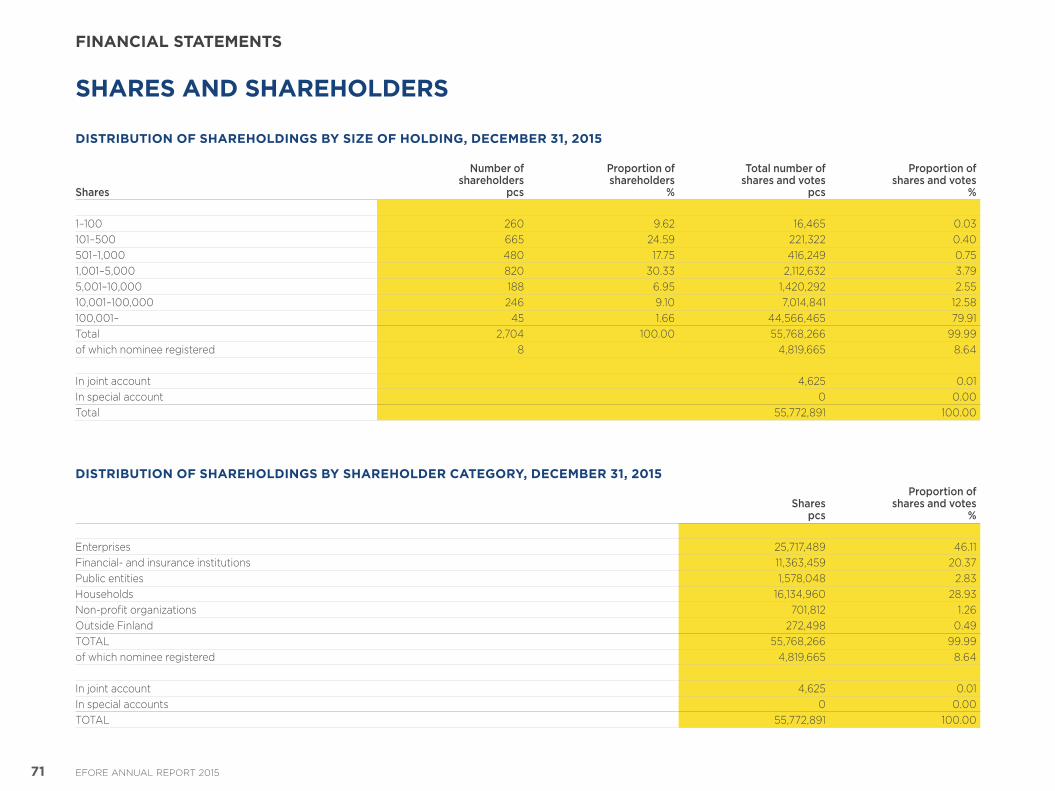
DISTRIBUTION OF SHAREHOLDINGS BY SIZE OF HOLDING, DECEMBER 31, 2015
Shares
Number ofshareholders
pcs
Proportion ofshareholders
%
Total number of shares and votes
pcs
Proportion of shares and votes
%
1–100 260 9.62 16,465 0.03101–500 665 24.59 221,322 0.40501–1,000 480 17.75 416,249 0.751,001–5,000 820 30.33 2,112,632 3.795,001–10,000 188 6.95 1,420,292 2.5510,001–100,000 246 9.10 7,014,841 12.58100,001– 45 1.66 44,566,465 79.91Total 2,704 100.00 55,768,266 99.99of which nominee registered 8 4,819,665 8.64
In joint account 4,625 0.01In special account 0 0.00Total 55,772,891 100.00
DISTRIBUTION OF SHAREHOLDINGS BY SHAREHOLDER CATEGORY, DECEMBER 31, 2015
Shares pcs
Proportion of shares and votes
%
Enterprises 25,717,489 46.11Financial and insurance institutions 11,363,459 20.37Public entities 1,578,048 2.83Households 16,134,960 28.93Nonprofit organizations 701,812 1.26Outside Finland 272,498 0.49TOTAL 55,768,266 99.99of which nominee registered 4,819,665 8.64
In joint account 4,625 0.01In special accounts 0 0.00TOTAL 55,772,891 100.00
SHARES AND SHAREHOLDERS
71 EFORE ANNUAL REPORT 2015
FINANCIAL STATEMENTS
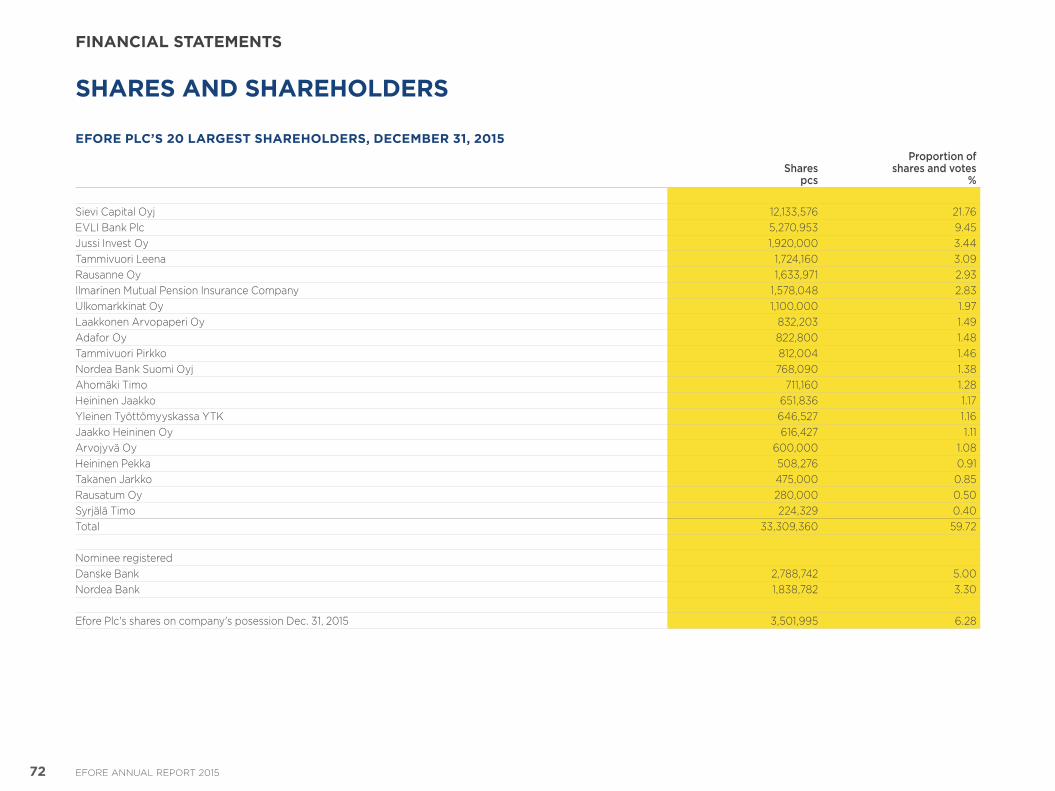
EFORE PLC’S 20 LARGEST SHAREHOLDERS, DECEMBER 31, 2015
Shares pcs
Proportion of shares and votes
%
Sievi Capital Oyj 12,133,576 21.76EVLI Bank Plc 5,270,953 9.45Jussi Invest Oy 1,920,000 3.44Tammivuori Leena 1,724,160 3.09Rausanne Oy 1,633,971 2.93Ilmarinen Mutual Pension Insurance Company 1,578,048 2.83Ulkomarkkinat Oy 1,100,000 1.97Laakkonen Arvopaperi Oy 832,203 1.49Adafor Oy 822,800 1.48Tammivuori Pirkko 812,004 1.46Nordea Bank Suomi Oyj 768,090 1.38Ahomäki Timo 711,160 1.28Heininen Jaakko 651,836 1.17Yleinen Työttömyyskassa YTK 646,527 1.16Jaakko Heininen Oy 616,427 1.11Arvojyvä Oy 600,000 1.08Heininen Pekka 508,276 0.91Takanen Jarkko 475,000 0.85Rausatum Oy 280,000 0.50Syrjälä Timo 224,329 0.40Total 33,309,360 59.72
Nominee registeredDanske Bank 2,788,742 5.00Nordea Bank 1,838,782 3.30
Efore Plc's shares on company's posession Dec. 31, 2015 3,501,995 6.28
SHARES AND SHAREHOLDERS
72 EFORE ANNUAL REPORT 2015
FINANCIAL STATEMENTS
Espoo, February 11, 2016
Päivi MarttilaChairman
Olli Heikkilä Marjo Miettinen
Jarmo Simola Jarkko Takanen
Heikki ViikaPresident and CEO
SIGNATURES FOR THE FINANCIAL STATEMENTS AND THE REPORT BY THE BOARD OF DIRECTORS
73 EFORE ANNUAL REPORT 2015
FINANCIAL STATEMENTS
AUDITOR’S REPORT
TO THE ANNUAL GENERAL MEETING OF EFORE PLCWe have audited the accounting records, the financial statements, the report of the Board of Directors, and the administration of Efore Plc for the year ended December 31, 2015. The financial statements comprise the consolidated statement of financial position, statement of comprehensive income, statement of changes in equity and statement of cash flows, and notes to the consolidated financial statements, as well as the parent company’s balance sheet, income statement, cash flow statement and notes to the financial statements.
RESPONSIBILITY OF THE BOARD OF DIRECTORS AND THE PRESIDENT AND CEOThe Board of Directors and the President and CEO are responsible for the preparation of consolidated financial statements that give a true and fair view in accordance with International Financial Reporting Standards (IFRS) as adopted by the EU, as well as for the preparation of financial statements and the report of the Board of Directors that give a true and fair view in accordance with the laws and regulations governing the preparation of the financial statements and the report of the Board of Directors in Finland. The Board of Directors is responsible for the appropriate arrangement of the control of the company’s accounts and
finances, and the President and CEO shall see to it that the accounts of the company are in compliance with the law and that its financial affairs have been arranged in a reliable manner.
AUDITOR’S RESPONSIBILITYOur responsibility is to express an opinion on the financial statements, on the consolidated financial statements and on the report of the Board of Directors based on our audit. The Auditing Act requires that we comply with the requirements of professional ethics. We conducted our audit in accordance with good auditing practice in Finland. Good auditing practice requires that we plan and perform the audit to obtain reasonable assurance about whether the financial statements and the report of the Board of Directors are free from material misstatement, and whether the members of the Board of Directors of the parent company and the President and CEO are guilty of an act or negligence which may result in liability in damages towards the company or have violated the Limited Liability Companies Act or the articles of association of the company.
An audit involves performing procedures to obtain audit evidence about the amounts and disclosures in the financial statements and the report of the Board of Directors. The procedures selected depend on the auditor’s judgment, including the assessment of the risks of material misstatement,
whether due to fraud or error. In making those risk assessments, the auditor considers internal control relevant to the entity’s preparation of financial statements and report of the Board of Directors that give a true and fair view in order to design audit procedures that are appropriate in the circumstances, but not for the purpose of expressing an opinion on the effectiveness of the company’s internal control. An audit also includes evaluating the appropriateness of accounting policies used and the reasonableness of accounting estimates made by management, as well as evaluating the overall presentation of the financial statements and the report of the Board of Directors.
We believe that the audit evidence we have obtained is sufficient and appropriate to provide a basis for our audit opinion.
OPINION ON THE CONSOLIDATED FINANCIAL STATEMENTSIn our opinion, the consolidated financial statements give a true and fair view of the financial position, financial performance, and cash flows of the group in accordance with International Financial Reporting Standards (IFRS) as adopted by the EU.
OPINION ON THE COMPANY’S FINANCIAL STATEMENTS AND THE REPORT OF THE BOARD OF DIRECTORSIn our opinion, the financial statements and the report of the Board of Directors give a true and fair view of both the consolidated and the parent company’s financial performance and financial position in accordance with the laws and regulations governing the preparation of the financial statements and the report of the Board of Directors in Finland. The information in the report of the Board of Directors is consistent with the information in the financial statements.
Helsinki, February 19, 2016
KPMG OY ABHENRIK HOLMBOMAuthorized Public Accountant
74 EFORE ANNUAL REPORT 2015
FINANCIAL STATEMENTS
CORPORATE GOVERNANCE STATEMENT 2015
The obligations of Efore’s decisionmaking bodies are defined in accordance with Finnish legislation and the principles established by the Board of Directors. Efore’s corporate governance complies with the provisions of the Companies Act. In addition, in 2015 Efore complied with the Insider Guidelines issued by the NASDAX OMX Helsinki Oy and the Finnish Corporate Governance Code 2010 for Listed Companies issued by Securities Market Association. From January 1, 2016 Efore applies to the Governance Code 2015 for Listed Finnish Companies issued by the Finnish Securities Market Association.
The Corporate Governance Code is publicly available, e.g. on the website of the Securities Market Association, address www.cgfinland.fi.
The consolidated financial statements were authorized for issue by the Board of Directors of Efore Plc on 11 February, 2016 and are available in Annual Report and at the website of Efore, address www.efore.com.
BOARD OF DIRECTORS
APPOINTING BOARD MEMBERSThe Annual General Meeting elects the members of the Board of Directors
by simple majority vote for a term of office that ends with the close of the next Annual General Meeting following their election. The Board of Directors elects among its members a Chairman and Deputy Chairman.
COMPOSITION OF THE BOARD OF DIRECTORSAs set out in Efore’s Articles of Association, the Board of Directors shall have no less than three and no more than ten ordinary members. The company’s President and CEO is not a member of the Board of Directors. The composition shall take into account the needs of the company operations and the development stage of the company. A person to be elected to the board shall have the qualifications required by the duties, sufficient knowledge of financial matters and business operations. A person to be elected to the Board shall have the possibility to devote a sufficient amount of time to the work.
The majority of the directors shall be independent of the company. In addition, at least two of the members representing this majority shall be independent of significant shareholders of the company.
The following persons were elected as Board members at the Annual General meeting on March 31, 2015.
Päivi Marttila, b. 1961Education: MSc (Econ)Board member since 2013Chairman of the Board since 2013Main duty: Midagon Oy, CEOIndependent of the company and the company’s main shareholders
Olli Heikkilä, b. 1959Education: M.Sc (Eng.)Board member since 2011Main duty: UPMKymmene Oyj, Vice PresidentIndependent of the company and the company’s main shareholders
Marjo Miettinen, b. 1957Education: M.Sc. (Education)Board member since 2013 Vice Chairman of the Board since 2015Main duty: Board professionalIndependent of the company and the company’s main shareholders
Jarmo Simola, b. 1961Education: M.Sc.( Eng)Board member since 2013
Main duty: Tulisuoja Suomi Oy, Managing DirectorIndependent of the company and the company’s main shareholders
Jarkko Takanen, b. 1967Education: Qualified Production Engineer and holds a Commercial College Diploma in Management AccountancyBoard member since 2013Main duty: Jussi Capital Oy, Managing Director Independent of the company
Furthermore, during the fiscal year 2015 Francesco Casoli was a member of the Board of Directors until March 31, 2015.
DUTIES AND RESPONSIBILITIES OF THE BOARDThe Board of Directors has general decisionmaking authority in all company matters that are not stipulated (by law or under the Articles of Association) for the decision or action of another party. The Board is responsible for the governance of the company and for duly organizing its operations. It also approves the corporate strategy, the risk management principles, the Group’s corporate values, the operating plan
75 EFORE ANNUAL REPORT 2015
CORPORATE GOVERNANCE
and related annual budget, and decides on major investments.
The main duties and operating principles of the Board of Directors are given in a separate working order. This refers to the declaration of a quorum at Board meetings, the writing and approval of minutes, and the preparations needed on matters for decision.
The Board of Directors reviews its own working procedures through an annual selfevaluation process or in cooperation with the external company.
The Board of Directors met 14 times during the fiscal year 2015 and the average participation rate of the Board members was 97%.
BOARD COMMITTEESThe Board of Directors has committees that assist in its work. The Board of Directors elects among its members committee members and Chairman of the committees. External members can be also members of the Nomination Committee. The committees’ working orders set out the duties and operating principles for each committee. The committees report their work to the Board of Directors on a regular basis.
The main duties of the Audit Committee are to examine the company’s finances; oversee compliance with the law and the relevant standards; monitor the reporting process of financial statements, supervise the financial reporting process, monitor the efficiency of the
company’s internal control, internal audit, if applicable, and risk management systems; review the description of the main features of the internal control and risk management systems pertaining to the financial reporting process, which is included in the company’s corporate governance statement; monitor the statutory audit of the financial statements and consolidated financial statements, evaluate the independence of the statutory auditor or audit firm, particularly the provision of related services to the company to be audited and prepare the proposal for resolution on the election of the auditor.
The main duties of the Nomination Committee are to prepare proposals to the general meeting on the composition of the Board of Directors and fees and other financial benefits paid to the Board members.
The main duties of the Remuneration Committee includes preparing matters related to the remuneration of the CEO and other executives of the company as well as preparing proposals related to Group remuneration systems.
MEMBERS OF THE BOARD COMMITTEES DURING THE FISCAL YEAR 2015During the fiscal year 2015 Efore had Audit Committee and Remuneration Committee that assist in Board of Directors’ work.
The members of the Audit Committee are Olli Heikkilä, Jarmo Simola and Jarkko Takanen. The Audit Committee is chaired by Jarkko Takanen. The Audit Committee met six times during the fiscal year 2015 and the participation rate of the members was 94%.
Päivi Marttila continued as the chairman and Marjo Miettinen and Jarmo Simola continued as members of the Remuneration Committee during the fiscal year 2015. The Remuneration Committee met twice during the fiscal year 2015 and the participation rate of the members was 100%.
PRESIDENT AND CEOThe Board of Directors appoints the company’s President and CEO and supervises his actions. The main terms and conditions governing the President and CEO’s appointment are detailed in written contract approved by the Board of Directors. The President and CEO manages and supervises Group business operations within the guidelines and directives issued by the Board of Directors, and ensures that the company’s accounting accords with the law and that the financial management system is reliable.
Vesa Vähämöttönen, tech. lis. (b. 1966) acted as the President and CEO from June 1, 2010 until the end of February 2015. Heikki Viika (b. 1963), M.Sc.(Eng.) appointed on December 22, 2014 as the new President and CEO of Efore
Plc. He started in this position on June 1, 2015. Efore Plc CFO and member of the Executive Management Team Riitta Järnstedt was appointed as acting President and CEO of the company March 1–May 31, 2015.
THE MAIN FEATURES OF THE INTERNAL CONTROL AND RISK MANAGEMENT SYSTEMS
SYSTEMS OF INTERNAL CONTROLThe Board of Directors is responsible that the internal control and risk management are adequately and effectively arranged. In addition, it is the responsibility of the Board to ensure that the internal control of the accounting and financial management is arranged in an appropriate manner. The Audit Committee is responsible for the control of the financial reporting process. The financial management shall inform its findings to the relevant members of the management.
The group has financial reporting systems for the control of the business, financial management and risks. The Board of Directors of the company has approved the management organization and principles, decisionmaking authorities and approval procedures, operational policies of the organizational sectors, financial planning and reporting as well as remuneration principles.
76 EFORE ANNUAL REPORT 2015
CORPORATE GOVERNANCE
The group does not have a separate internal audit function but the internal audit is part of the group financial administration. Local auditors shall audit the procedures of internal control in accordance with the audit plan. The representatives of the financial administration shall perform certain controls when they visit the subsidiaries. The financial management shall report the findings to the President and CEO and the Audit Committee, which in turn report to the Board.
The group financial management together with the other management prepares monthly the financial report. The report contains a summary of the net sales, gross profit, costs level, results, net working capital, cash flow and personnel development for the previous month, yeartoyear period and for the forecasted latter part of the year. Furthermore, the report includes the main risks and possibilities. The report is delivered to the Board of Directors, Executive Management Team and to the financial management of the largest subsidiaries as well as to the auditors when it concerns interim reports. In addition to the monthly reporting the management follows more actively certain actual items in their weekly meeting.
The group financial management oversees the centralized interpretation and application of the accounting standards (IFRS). The group’s financing
and hedging against currency risks are centralized in the head office in Finland. The Audit Committee of the Board evaluates the financial statements and interim statements as well as separately certain special subjects. The Audit Committee reports its findings to the Board, which monitors that the necessary measures are taken.
The principal auditor of Efore Plc is responsible for the audit and the directions and coordination of the audit in the group. The principal auditor prepares annually an audit plan, which contains focus areas and which the Audit Committee approves. The audit report of the group financial statements and the Board report required by law is issued by the auditor to the company’s shareholders. Furthermore, the auditor reports its findings to the Audit Committee.
RISK MANAGEMENTThe aim of the risk management system of Efore is to recognize the strategic, operational and financing risks of the group as well as any conventional risk of loss. The risks that the group takes in its operations are risks that are encountered in pursuit of the strategy and goals. Risk management seeks to control these risks in a proactive and comprehensive manner. The measures taken can include risk avoidance, risk reduction or risk transfer by insurance or agreement.
Risk management forms part of the group’s business processes in all operational units. In this way the risk management process is tied to internal controls. The group and its operational units assess the risks of their operations, prepare risk management plans and report risks in accordance with the organizational structure. The Audit Committee and Board of Directors address risks in connection with the addressing of other business operations. Risk management is taken into consideration in the group’s quality systems, which include also survival plans. There is a more detailed statement of the group’s different risks and their management which can be found in the Investor Relations section of the Internet pages of the company.
77 EFORE ANNUAL REPORT 2015
CORPORATE GOVERNANCE
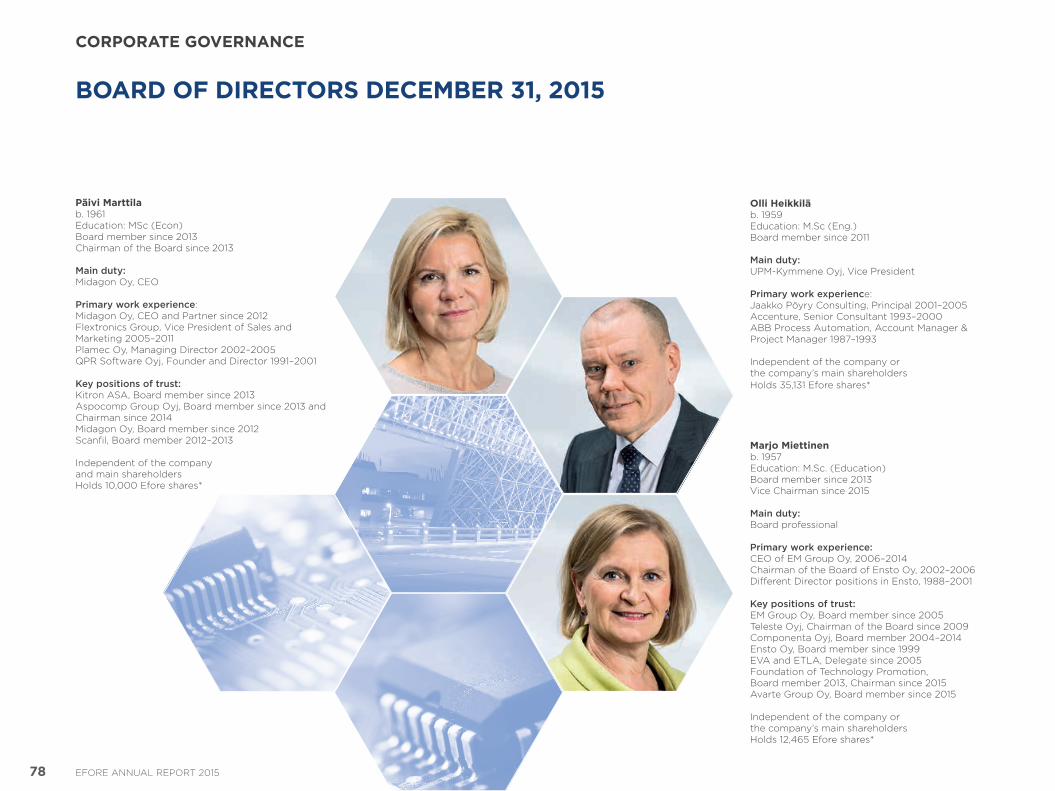
Päivi Marttilab. 1961Education: MSc (Econ)Board member since 2013Chairman of the Board since 2013
Main duty: Midagon Oy, CEO
Primary work experience:Midagon Oy, CEO and Partner since 2012Flextronics Group, Vice President of Sales and Marketing 2005–2011Plamec Oy, Managing Director 2002–2005QPR Software Oyj, Founder and Director 1991–2001
Key positions of trust:Kitron ASA, Board member since 2013Aspocomp Group Oyj, Board member since 2013 and Chairman since 2014Midagon Oy, Board member since 2012Scanfil, Board member 2012–2013
Independent of the company and main shareholdersHolds 10,000 Efore shares*
Olli Heikkiläb. 1959Education: M.Sc (Eng.)Board member since 2011
Main duty: UPMKymmene Oyj, Vice President
Primary work experience:Jaakko Pöyry Consulting, Principal 2001–2005Accenture, Senior Consultant 1993–2000ABB Process Automation, Account Manager & Project Manager 1987–1993
Independent of the company or the company’s main shareholdersHolds 35,131 Efore shares*
Marjo Miettinenb. 1957Education: M.Sc. (Education)Board member since 2013 Vice Chairman since 2015
Main duty: Board professional
Primary work experience:CEO of EM Group Oy, 2006–2014Chairman of the Board of Ensto Oy, 2002–2006Different Director positions in Ensto, 1988–2001
Key positions of trust:EM Group Oy, Board member since 2005Teleste Oyj, Chairman of the Board since 2009Componenta Oyj, Board member 2004–2014Ensto Oy, Board member since 1999EVA and ETLA, Delegate since 2005Foundation of Technology Promotion, Board member 2013, Chairman since 2015Avarte Group Oy, Board member since 2015
Independent of the company or the company’s main shareholdersHolds 12,465 Efore shares*
78 EFORE ANNUAL REPORT 2015
CORPORATE GOVERNANCE
BOARD OF DIRECTORS DECEMBER 31, 2015
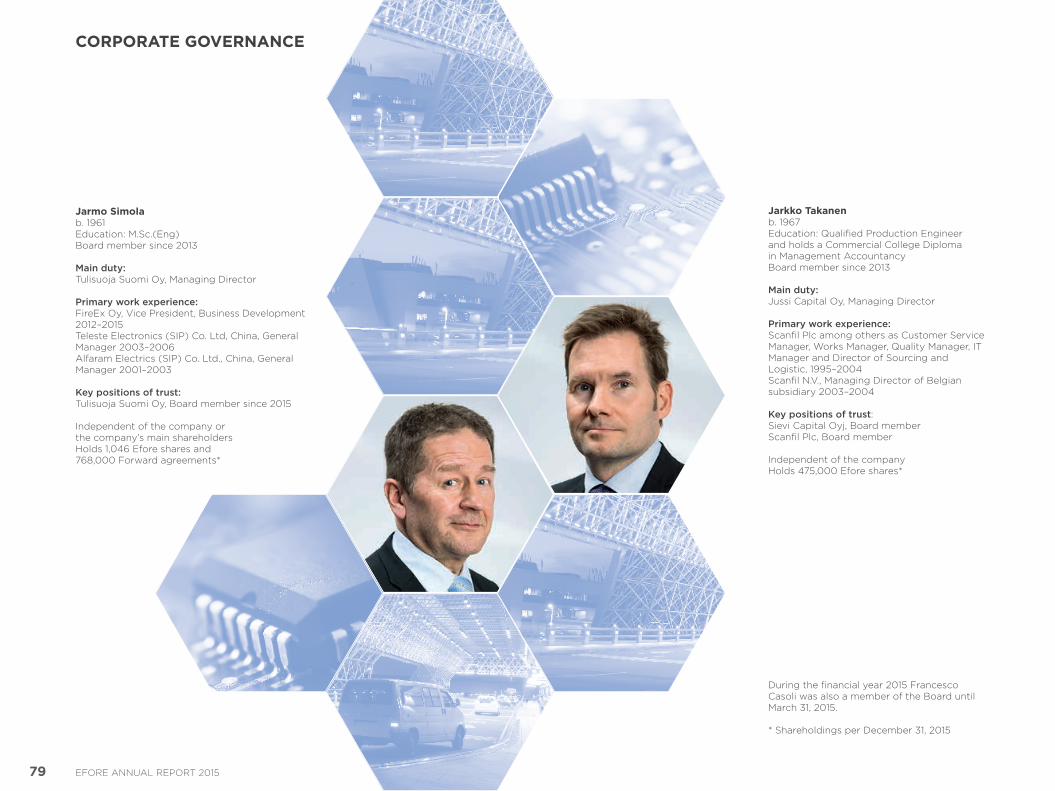
During the financial year 2015 Francesco Casoli was also a member of the Board until March 31, 2015.
* Shareholdings per December 31, 2015
Jarmo Simolab. 1961Education: M.Sc.(Eng)Board member since 2013
Main duty: Tulisuoja Suomi Oy, Managing Director
Primary work experience:FireEx Oy, Vice President, Business Development 2012–2015Teleste Electronics (SIP) Co. Ltd, China, General Manager 2003–2006Alfaram Electrics (SIP) Co. Ltd., China, General Manager 2001–2003
Key positions of trust: Tulisuoja Suomi Oy, Board member since 2015
Independent of the company or the company’s main shareholdersHolds 1,046 Efore shares and 768,000 Forward agreements*
Jarkko Takanenb. 1967Education: Qualified Production Engineer and holds a Commercial College Diploma in Management AccountancyBoard member since 2013
Main duty: Jussi Capital Oy, Managing Director
Primary work experience:Scanfil Plc among others as Customer Service Manager, Works Manager, Quality Manager, IT Manager and Director of Sourcing andLogistic, 1995–2004Scanfil N.V., Managing Director of Belgian subsidiary 2003–2004
Key positions of trust:Sievi Capital Oyj, Board memberScanfil Plc, Board member
Independent of the companyHolds 475,000 Efore shares*
79 EFORE ANNUAL REPORT 2015
CORPORATE GOVERNANCE
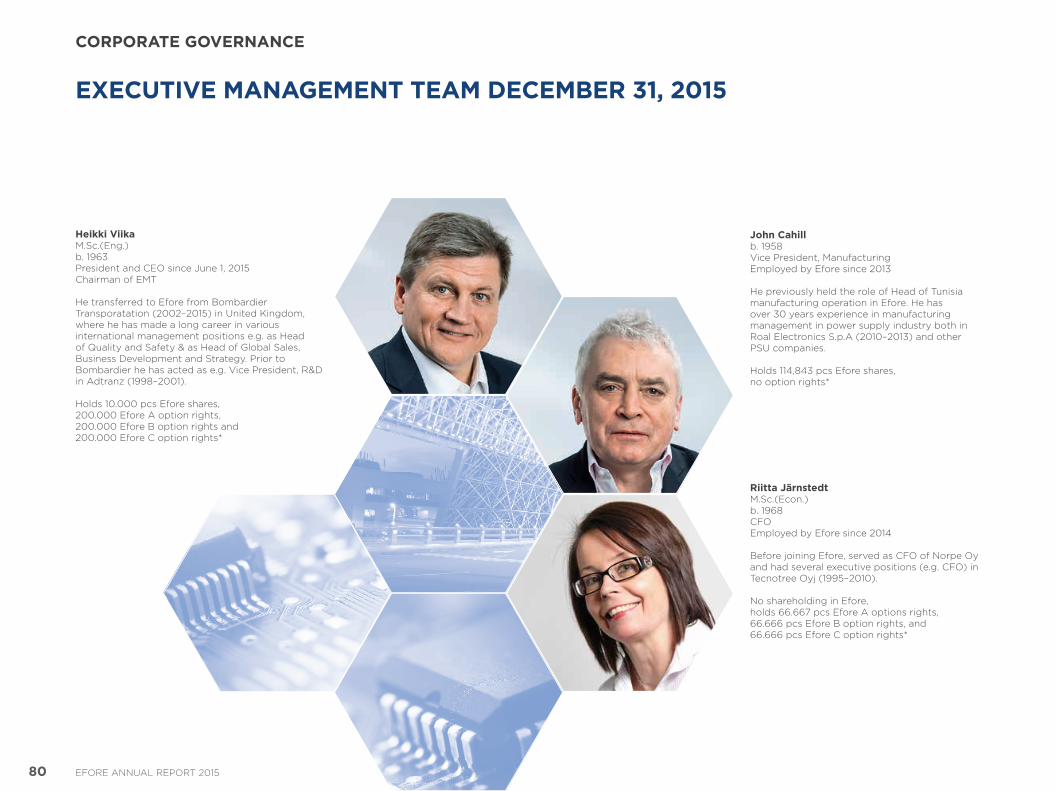
Heikki ViikaM.Sc.(Eng.)b. 1963President and CEO since June 1, 2015Chairman of EMT
He transferred to Efore from Bombardier Transporatation (2002–2015) in United Kingdom, where he has made a long career in various international management positions e.g. as Head of Quality and Safety & as Head of Global Sales, Business Development and Strategy. Prior to Bombardier he has acted as e.g. Vice President, R&D in Adtranz (1998–2001).
Holds 10.000 pcs Efore shares, 200.000 Efore A option rights, 200.000 Efore B option rights and 200.000 Efore C option rights*
John Cahillb. 1958Vice President, ManufacturingEmployed by Efore since 2013
He previously held the role of Head of Tunisia manufacturing operation in Efore. He has over 30 years experience in manufacturing management in power supply industry both in Roal Electronics S.p.A (2010–2013) and other PSU companies.
Holds 114,843 pcs Efore shares, no option rights*
Riitta JärnstedtM.Sc.(Econ.)b. 1968CFOEmployed by Efore since 2014
Before joining Efore, served as CFO of Norpe Oy and had several executive positions (e.g. CFO) in Tecnotree Oyj (1995–2010).
No shareholding in Efore, holds 66.667 pcs Efore A options rights, 66.666 pcs Efore B option rights, and 66.666 pcs Efore C option rights*
EXECUTIVE MANAGEMENT TEAM DECEMBER 31, 2015
80 EFORE ANNUAL REPORT 2015
CORPORATE GOVERNANCE
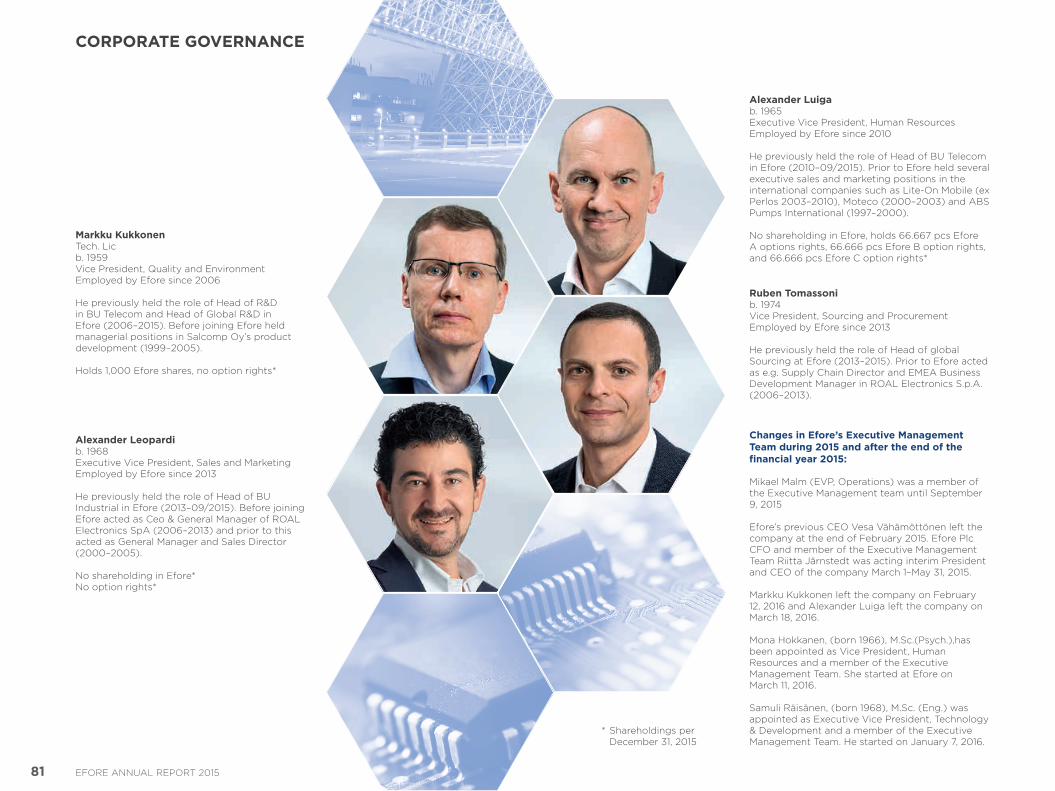
Markku KukkonenTech. Licb. 1959Vice President, Quality and EnvironmentEmployed by Efore since 2006
He previously held the role of Head of R&D in BU Telecom and Head of Global R&D in Efore (2006–2015). Before joining Efore held managerial positions in Salcomp Oy’s product development (1999–2005).
Holds 1,000 Efore shares, no option rights*
Alexander Leopardi b. 1968Executive Vice President, Sales and MarketingEmployed by Efore since 2013
He previously held the role of Head of BU Industrial in Efore (2013–09/2015). Before joining Efore acted as Ceo & General Manager of ROAL Electronics SpA (2006–2013) and prior to this acted as General Manager and Sales Director (2000–2005).
No shareholding in Efore*No option rights*
Alexander Luigab. 1965Executive Vice President, Human ResourcesEmployed by Efore since 2010
He previously held the role of Head of BU Telecom in Efore (2010–09/2015). Prior to Efore held several executive sales and marketing positions in the international companies such as LiteOn Mobile (ex Perlos 2003–2010), Moteco (2000–2003) and ABS Pumps International (1997–2000).
No shareholding in Efore, holds 66.667 pcs Efore A options rights, 66.666 pcs Efore B option rights, and 66.666 pcs Efore C option rights*
Ruben Tomassonib. 1974Vice President, Sourcing and ProcurementEmployed by Efore since 2013
He previously held the role of Head of global Sourcing at Efore (2013–2015). Prior to Efore acted as e.g. Supply Chain Director and EMEA Business Development Manager in ROAL Electronics S.p.A. (2006–2013).
Changes in Efore’s Executive Management Team during 2015 and after the end of the financial year 2015:
Mikael Malm (EVP, Operations) was a member of the Executive Management team until September 9, 2015
Efore’s previous CEO Vesa Vähämöttönen left the company at the end of February 2015. Efore Plc CFO and member of the Executive Management Team Riitta Järnstedt was acting interim President and CEO of the company March 1–May 31, 2015.
Markku Kukkonen left the company on February 12, 2016 and Alexander Luiga left the company on March 18, 2016.
Mona Hokkanen, (born 1966), M.Sc.(Psych.),has been appointed as Vice President, Human Resources and a member of the Executive Management Team. She started at Efore on March 11, 2016.
Samuli Räisänen, (born 1968), M.Sc. (Eng.) was appointed as Executive Vice President, Technology & Development and a member of the Executive Management Team. He started on January 7, 2016.
* Shareholdings per December 31, 2015
81 EFORE ANNUAL REPORT 2015
CORPORATE GOVERNANCE
INFORMATION FOR SHAREHOLDERS
Efore Plc’s registered office is in Espoo, Finland. Its business identity code is 0195681–3.
ANNUAL GENERAL MEETINGThe Annual General Meeting of Efore Plc will be held on March 30, 2016 at 10.00 in Stella Business Park (Terra building), Lars Sonckin kaari 16, 02600 Espoo. Notice of Efore Plc Annual General meeting including registration instructions is available at www.efore.com
BOARD OF DIRECTORS’ PROPOSAL FOR THE ANNUAL GENERAL MEETINGThe Board of Directors will propose to the Annual General Meeting on March 30, 2016 that no dividend will be distributed.
CHANGES OF ADDRESSThe shareholders are advised to inform about changes in their contact details to their bookentry securities account operator.
FINANCIAL REPORTS IN 2016Efore publishes its annual report, the annual financial statements release and three interim reports. The stock exchange releases are available at www.efore.com immediately after they are published. The annual report is published at www.efore. com in pdfformat only.
As a consequence of the new stock exchange rules valid from December 1, 2015, Efore has changed its reporting practice and will not prepare three and nine month interim reports. Efore Plc will disclose the following financial reports in 2016:
Annual Report 2015– Week 10/2016
Half year report(January 1–June 30, 2016)– August 10, 2016
KEY SHARE DATAExchange listing:Nasdaq Helsinki, The Nordic Exchange (Small Cap)Corporate identifier EFO1VTrading lot 1 shareShares December 30, 2015: 55,772,891 sharesShare capital 15,000,000.00 eur
ANALYSTS MONITORING EFOREThe information about analysts monitoring Efore is available at www.efore.com/investors/analysts. Efore takes no responsibility for any evaluations or recommendations published by them.
INVESTOR RELATIONSHeikki Viika, President and CEO is responsible for Investor Relations.
The objective of Efore’s investor relations is to provide precise and uptodate information on the Efore Group’s business operations and financial development. Efore publishes all investor information on Efore’s website in Finnish and English. Efore observes a silent period of 30 days before the publication of its results. During this time the company’s representatives do not comment on the company’s financial position or business development.
INVESTOR CONTACTSHeikki Viika, President and CEO, tel. +358 9 478 466
Sari Jaulas, IR materials & coordination, tel. +358 9 4784 6343
Email: [email protected]
82 EFORE ANNUAL REPORT 2015
EFORE GROUP CONTACT DETAILS
FINLANDHead office
EFORE PLCP.O.Box 260 (Linnoitustie 4B)02601 EspooTel. +358 9 478 466www.efore.com
CHINA
EFORE (SUZHOU) ELECTRONICS CO., LTD.Building 21 A&B, No 428 Xinglong StreetSuzhou Industrial ParkSuzhou, China 215126Tel. +86 512 6767 1500
EFORE (HONG KONG) CO. LTDRoom 702 Hollywood Plaza610 Nathan RoadKowloonHong KongTel. +86 512 6767 1500
ITALY
EFORE S.P.A.Via Jesina 56/A60022 Castelfidardo (AN)Tel. +39 071 721461www.efore.com
SWEDEN
EFORE ABMånskärsvägen 10BSE141 75 Kungens KurvaTel. +46 72 949 2199
TUNISIA
EFORE SARL36, Rue 8601 Z.I.Charguia 2035 TunisCarthageTel. +216 71 770 386
USA
EFORE INC.701 Main Street,Suite 405Stroudsburg, PA 18360USATel. +1 570 421 5750
83 EFORE ANNUAL REPORT 2015

EFORE PLC P.O. BOX 260 (LINNOITUSTIE 4B) 02601 ESPOO, FINLAND TEL. +358 9 478 466 FAX +358 9 4784 6500 WWW.EFORE.COM
EFORE ANNUAL REPORT 2015