Embed Size (px)
Citation preview

The Unintended Consequences of Government Regulations in Emerging Financial
Markets: Evidence from the Chinese IPO market1
François Derrien, Xiaohui Wu, Qi Zeng and Yan Zhang2
This Version: December 2016
Abstract
This paper explores the impact of regulations imposed by the Chinese government on the development of the Chinese IPO market between 2000 and 2011. Some of these regulations have affected the population of Chinese firms that went public domestically, some firms being excluding from the domestic IPO markets, others being induced to list abroad. We also provide evidence that, because of limits on prices and proceeds, the Chinese IPO market does not attract companies that need cash the most. Some IPO firms that raise large amounts of cash decide to pay large dividends shortly after going public, which investors interpret as evidence that their growth options were overestimated at the time of their IPO.
JEL Codes: G28, G30, G38
Keywords: Regulation, Emerging markets, Initial Public Offerings
1 We thank Olga Dodd, Garry Twite, Chris Yung and participants at the seminar in La Trobe University, the 2016 Telfer Annual Conference in Accounting and Finance in Ottawa and 2016 Asian FA in Bangkok for helpful comments. All the remaining errors are ours. 2 Derrien is from HEC Paris. Email: [email protected]. Wu is from Xiamen University. Email: [email protected]. Zeng is from the University of Melbourne. Email: [email protected]. Zhang is from Xiamen University. Email: [email protected].

1
1. Introduction
Well-organized financial markets guarantee that funding goes to firms that need to finance
profitable projects. The issue of how to design financial markets so as to make them as
efficient as possible is therefore important for the governments of emerging economies. In
this paper, we focus on one specific country, China, in which repeated government
intervention has shaped financial markets. We ask whether and how government-imposed
regulations in this country affected the development of the Chinese IPO market over the last
fifteen years.
We focus on China because it is the largest emerging economy, which underwent a long
period of very high growth of both its industrial and financial sectors. The role of the Chinese
government has been critical in this growth. In general, China is an extremely centralized
economy in which the government plays a key role. This has been the case in the financial
industry. The government has fully designed and organized a stock market that was virtually
non-existent thirty years ago. In the process, regulations have changed often and sometimes
dramatically. Thus, focusing on the Chinese market allows us to observe several rule changes
in a limited number of years and to explore their effect on firm decisions.
We consider one segment of the Chinese stock market, the market for Initial Public
Offerings (IPOs), between 2000 and 2011. This time period is characterized both by a
significant evolution of the set of regulations governing the IPO market, and by a large
number of Chinese firms going public in China and abroad. We focus on some of the most
important rules and rule changes that occurred during the time period and try to estimate their
impact on the efficiency of the Chinese IPO market.
The main specificities of the rules imposed to Chinese firms that want to go public are
described in details in the paper. We focus mostly on two important characteristics: First, the
2
government monitors closely the use of proceeds raised in the IPO process, from the start of
the process. This limits significantly the flexibility of firms in using their IPO proceeds.
Second, the government imposes constraints on IPO prices and IPO size. These constraints
vary over time in an arguably unpredictable way.
Using these rules and their evolution over time, we ask a number of questions. First, do
regulations prevent some firms from doing an IPO, or do they induce firms to go public
abroad? Are firms that go abroad for their listing because of regulations are those with the
highest growth prospects? How do regulations and changes in regulations affect the
behaviour of firms that go public? With what consequences for investors? Ultimately, can we
claim that regulations have a negative impact on the quality of firms that list in China?
In a nutshell, our findings suggest that the rules imposed by the Chinese government do
have a negative impact on the local IPO market. We find that they induce or even force firms
from high-growth industries to list overseas, while the firms that list in China are from
industries with more modest growth rates. These firms have significantly lower operating
performance in the years following their IPO than those that list abroad. More generally, the
average firm going public in China is not from industries with the highest growth potential,
and our tests indicate that this is at least partially due to pricing regulations. This suggests
that one of the effects of government-imposed regulations is that the IPO market does not
attract the firms that need equity financing the most. Consistent with this argument, we find
that the operating performance of recent IPO firms decreases shortly after their IPO. We also
find that the average Chinese IPO firm pays surprisingly high dividends, relative to IPO firms
in other countries and to seasoned companies listed in China, in the year following its IPO.
This seems to come from firms that raise more cash than they need to finance their growth
returning this cash to their shareholders, another indication that these firms are not the ones
that need equity financing the most. Investors seem to understand the inefficiencies caused by

3
regulations and the incentives of firms: Stock price reactions are negative when recent IPO
firms announce large dividend payments.
Identification is often difficult in this kind of empirical exercises, because we typically do
not observe the counterfactual of a given rule. Ideally, to estimate the impact of a rule on the
IPO market, one would need to observe the same market without the rule, which is obviously
not available. Instead, we exploit the fact that regulations change frequently, in ways that
cannot easily be anticipated by firms that are planning their IPO. We use these rule changes
in a series of empirical tests, most of which rely on comparisons between different regulatory
regimes for different groups of firms, e.g., IPO firms vs. listed firms, or firms that list
domestically vs. foreign listings. These comparisons allow us to estimate how changes in the
rules affect firms with similar characteristics but belonging to different groups.
Our conclusions also rely on the assumption that the frequent and significant rule changes
that we observe and use in our empirical tests are exogenous to the listing decision, to the
decision to list locally or abroad, and to firm quality. The main endogeneity problem we are
facing in making this assumption is the possibility that unobserved missing variables affect
government’s decisions to change rules and these left-hand side variables. Our understanding
is that the objective of the government in its stock market interventions is more political than
economic. The government’s main goal is to satisfy the appetite of middle-class Chinese
citizens to participate in the stock market, while at the same time ensuring that this stock
market participation does not turn into significant losses for individual investors. One of the
tools at the disposal of the government is the control of the IPO market, which becomes
tighter when the stock market shows signs of overheating. Stock market overheating is likely
to be correlated with macroeconomic variables that also affect some of the IPO-related firm
decisions. Some of our tests, in which we analyze firm decisions after the IPO, are unlikely to
be subject to this criticism. In other tests, we compare the relative industry valuations of firms

4
that go public and its evolution over time. These tests are also unlikely to be contaminated by
macroeconomic variables that cause the government to intervene to control the overall stock
market if these variables affect all industries equally. To deal with the possibility that they do
not, we include industry x year fixed effects in our empirical specifications whenever
possible, so that identification is at the level of each industry industries and for each year of
the sample period separately. Moreover, as we explain in Section 4.2 below, the IPO process
is generally very long in China. Therefore, firms that list locally may respond to
macroeconomic shocks with a lag relative to the government. In spite of all these precautions,
we cannot entirely rule out the possibility that endogeneity affects some of our results, in
particular those related to the decision to list abroad. We must be careful in interpreting some
of the tests involving foreign-listed firms as causal.
The main contribution of this paper is to improve our knowledge of how government-
imposed regulations contribute to shaping financial markets in emerging countries. As such,
it is related to articles that discuss the optimal organization of financial markets, like La Porta
et al. (JPE, 1998), Wurgler (2000), or the way to achieve such an optimal organization, like
Henry (2000) or Glaeser, Johnson and Shleifer (2001). A few articles also focus more
specifically on regulations in IPO markets. Like us, Tian (2011) focuses on the Chinese IPO
market, while Thomadakis et al. (2016) consider the Greek stock market and Chang et al.
(2012) the Korean IPO market. These articles generally focus on pricing regulations and their
impact on pricing and short-term returns following IPOs. Our study aims at exploring the
consequences of regulations on firm decisions and their impact on the population of firms
listed on the local stock market.
This paper is also related to studies that explore the Chinese institutional environment and
its recent evolution (Allen, Qian and Qian, 2005, Pistor and Xu, 2005). It also contributes to
the Chinese IPO literature, which has mostly focused on the characteristics and performance
5
(both in terms of IPO underpricing and of longer-term stock performance) of Chinese IPOs
(Su and Fleisher, 1999, Chan, Wang, and Wei, 2004, Cheung, Ouyang and Tan, 2009, or Du
and Xu, 2009), although some studies focus on the listing decision and the choice between
Chinese and foreign IPO markets (e.g., Güçbilmez, 2014) or the quality of Chinese firms
listing abroad and its evolution over time (Beatty, Lu and Luo, 2016). Finally, this paper
contributes to understand better how firms and investors in one large and important emerging
market, China, react to frequent and important changes in regulations imposed by the central
government. By and large, our conclusion is that these regulations have a significant impact
on the composition of the Chinese stock market, and that both firms and investors react
rationally to them.
The rest of the paper proceeds as follows. In Section 2, we develop testable hypotheses.
Section 3 presents the data. In Section 4, we present and discuss tests of these hypotheses. In
Section 5, we discuss these results and conclude. A complete description of regulations
studied in the paper and of the data appear in the appendix.
2. Hypothesis development
The goal of the paper is to determine whether and how restrictions imposed by the
Chinese government affect the Chinese IPO market. First, we need to verify that those
restrictions are indeed binding. We do so in Table 2, in which we focus on two restrictions:
The first one limits PE ratios of Chinese IPO firms, and was in place between November
2001 and November 2008. The second restriction was in place between 2003 and 2006 and
limits issue size: It states that IPO proceeds cannot be larger than twice the firm’s pre-IPO
equity. We show in Table 2 that these regulations affect the price of IPOs and their size,
respectively.

6
Next, we ask whether these restrictions lead some firms to list abroad rather than
domestically. Standard reasons for listing abroad include better brand exposure, diversifying
investor base (e.g., to prevent takeover attempts), better corporate governance etc. Here we
point out another potential reason: Domestic restrictions in emerging countries may force
domestic firms to seek overseas listing. This is our first hypothesis:
Hypothesis 1: Government-imposed regulations in China affect the decision to list abroad vs.
domestically.
To test this, one can verify that there is a positive number of firms that list overseas but
could not list in China because they would violate some domestic listing regulations. The
problem of this test is to identify the null hypothesis. To get around this issue, we use time-
series variations in the constraints imposed by the Chinese government. The hypothesis is
that the number of Chinese firms that would list abroad without the regulation should be the
same number we observe when the regulation is removed, and the difference between the
number of Chinese firms that list abroad with and without government-imposed restrictions
can be at least partially attributed to the restrictions. In that vein, we focus on one specific
constraint on the relative size of IPOs and refine Hypothesis 1 to ask whether this constraint
affects the number of Chinese firms listing abroad:
Hypothesis 1-1: The ratio of firms that violate the “proceeds should be less than twice the
equity before IPO” rule among the foreign listed Chinese firms is higher when this rule is in
place, between 2003 and 2006, than other periods.
Government-imposed restrictions on PE ratios and issue size may also discourage firms
of high-growth industries to go public in China because the valuation they can obtain
domestically is significantly smaller than the valuation they can reach in foreign stock
markets. This may prevent firms in high-growth industries from going public in China and
push them to turn to the foreign stock market instead.
7
Hypothesis 1-2: Chinese firms that list domestically belong to industries with lower growth
options than is those that list abroad, in particular during periods of restrictions on IPO
valuation and IPO size.
Regulation can also affect listing decisions within industries. If in a given industry firm
quality varies, leading to a distribution of firm value, any constraint on pricing censors the
distribution of valuations by cutting out firms with the highest valuations from the
distribution of IPO candidates. Firms with values above the pricing limit can decide to go
public domestically at low IPO prices and to forego some IPO proceeds, or they can opt for
overseas listing. Thus, in the presence of more severe pricing constraints, firms with higher
values are more likely to list abroad. Similarly, IPO size restrictions can lead firms with the
best growth options, which therefore need to raise the most funds to finance their growth, to
list overseas. Hence the following hypothesis:
Hypothesis 1-3: Chinese firms that list domestically have lower valuations at the time of their
IPO, in particular during periods of restrictions on IPO valuation and IPO size.
The next hypothesis is about the effect of regulation on the population of Chinese firms
that decide to go public locally. The stock market should fund predominantly firms from
industries with the best growth options. If regulation blocks these firms from the stock market,
because they do not meet profitability requirements or because pricing constraints would
make an IPO too costly for their current shareholders, then we might observe that the firms
that go public are not necessarily those with the best growth prospects. Consider for instance
the pricing restrictions that are in place during part of our sample period. When binding, these
restrictions impose costly dilution to current shareholders who must sell underpriced shares to
the investors who participate in the IPO. This may induce current shareholders of high-
growth firms to cancel or postpone the IPO.

8
Hypothesis 2: Firms that go public in China are not from industries with the highest growth
options, in particular during restriction periods.
The next set of hypotheses is about the response of firms to regulatory changes, and its
consequence for shareholders. The third hypothesis can be summarized as follows:
Hypothesis 3: Firms respond to changes in regulations by changing the characteristics of
their IPOs and their post-IPO behaviour.
In 2009, the Chinese government removed pricing restrictions and allowed firms that
raised more funds than the expected proceeds announced in their IPO prospectus to use the
cash in excess of the initial filing amount as they liked. Following this decision, the average
PE ratios of IPOs increased dramatically. At the same time, because firms preferred to have
discretion in the way they could use the cash they raised, it was in their interest to announce
low expected IPO prices. By voluntarily targeting PE ratios lower than those they could
obtain, firms could raise more money than they announced in their IPO prospectuses and
enjoy a lot of freedom in their use of this extra cash.3
Hypothesis 3-1: The average target PE ratio of IPO firms is not higher in the non-PE
restriction period, despite larger actual PE ratios.
Due to this behaviour of Chinese IPO firms, and the fact that IPO firms do not necessarily
need cash to invest in new promising projects, some IPO firms should end up with cash in
excess of their investment needs. These firms should return the cash to their shareholders.
This effect should be more pronounced in firms with more concentrated ownership, in which
large owners will receive a large fraction of the dividends, while the managers of firms with
3 The possibility to use the number of shares sold as an adjustment variable for the size of the IPO is limited by a 1999 law that imposes a minimum number of new shares, and even more by a 2007 decision that fixes the number of shares sold in the IPO (see Appendix B for a detailed presentation of this and other rules).

9
dispersed ownership may prefer to keep cash in the company and to obtain private benefits
from this cash.
Hypothesis 3-2: IPO firms that raise more cash than they expected in the IPO are more likely
to pay dividends in the years following the IPO, more so if their ownership is concentrated.
Finally, we explore market reactions to such actions by firm managers. Large dividend
payments following the IPO signal that the growth opportunities of the newly listed firm are
not as high as expected. Stock price reactions to such dividend announcements should be
negative.
Hypothesis 3-3: The stock price reaction to dividend payments by recent IPO firms is
negative.
3. Data
The sample contains all Initial Public Offerings (IPOs) of Chinese firms in China between
2000 and 2011. Because we cover firms for up to three years after their IPO, the sample
period is from 2000 to 2013. We use year 2000 as our starting point because it is the first year
Chinese-listed firms employed a consistent and unified set of accounting standards (Chen et
al, 2012). We obtained our data from several sources, and hand-collected the remaining ones.
For Chinese IPO filings, we use the WIND database. Because the WIND data only starts in
2006, we hand-collected the data from 2000 to 2005. We obtained the accounting and stock
return data from CSMAR and project changes data from RESSET for these IPO firms. We
eliminate 31 financial firms, 6 share swap firms,4 two companies that were originally a single
company before their IPO, 4 post-2006 IPO companies with missing filing amounts, 3 pre-
4 In share swaps, the firms do not go through the standard IPO process. Instead, the shareholders of another listed firm swap their shares with those of the IPO firm, like in a reverse merger.

10
2006 IPO companies with missing prospectuses, and 3 companies that were approved before
1990 but only listed post-2000. 5 We also require firms to have at least two years of
accounting data after their listing. Our final sample includes 1,418 domestical IPOs. We also
use information about 548 Chinese firms that listed overseas between 2000 and 2011. For
these firms, we use SDC to obtain the filing and accounting data at the time of the IPO and
we use Datastream to obtain accounting data in the following years. In some tests, we use all
seasoned firms listed in Chinese stock markets. We collect their stock price data and
accounting data from CSMAR.
Appendix A presents the list and the definition of variables we use in subsequent tests.
We winsorize all the continuous variables at the 1% and 99% levels. For the non-IPO
industry average calculation, we drop firms with negative PE ratios.
[Insert Table 1 here.]
Panel A of Table 1 reports summary statistics of the main variables used in subsequent
tests for the subsample of Chinese firms that list domestically. Most of these variables are
standard in the literature. A few of them are not. The Ownership variable measures the
concentration of the firm’s ownership. It is calculated as the cumulated ownership of up to
the ten largest investors of the firm, provided that they are related through close family or
business relationships. Close to half the ownership of IPO firms in our sample is controlled
by such groups of large shareholders. This is true throughout the sample period, with very
little variation in this variable between 2000 and 2011. Excess ratio is the scaled difference
between the expected IPO proceeds announced in the IPO prospectus and the funds raised in
the IPO. This variable is important in our tests because changing regulations have influenced
both its magnitude and the way recent IPO firms use this cash windfall. Finally, Excess cash
5 For example, Shangdong Jintai’s IPO was approved in 1989, but the company was not listed until 2001. We cannot obtain the prospectuses of these companies.

11
flow is an indicator variable equal to one for recent IPO firms that pay dividends greater than
their operating cash flows. We use this variable, which has also changed significantly
throughout our sample period, to understand how firms respond to changing regulations.
Panel B of Table 1 reports summary statistics for Chinese firms that listed abroad during
our sample period, for the subset of the variables that are available for these IPOs.
Comparisons between the two panels suggest that the two samples are quite different.
Chinese firms that list abroad are significantly smaller than those that list domestically. They
also invest less (7.4% of their total assets against 8.8% for firms that list in China). Their
operating performance is about twice as high (average ROA of 12.4% vs. 5.4%), as is their
valuation when they go public: The average Price-to-Earnings ratio (Market-to-Book ratio) of
firms that list abroad is around 61 (20), against 39 (9) for domestic listings. Unreported
industry compositions of these two subsamples are also quite different, domestic IPO firms
being more capital-intensive. As an illustration, Machinery, Chemicals and Technology,
hardware and equipment are the three industries with the largest numbers of domestic IPOs
during our sample period, each of them representing approximately 10% of our sample of
domestic IPOs. By contrast, the three leading industries for Chinese firms that list abroad are
Software and services, Consumer durables and apparel, and Real-estate, representing about
11%, 10%, and 7% of the sample of foreign listings, respectively. These industry differences
need to be taken into account in any comparison between domestic and foreign listings. In
fact, in these comparisons, we include industry × year fixed effects, which allows us to
control for time-invariant differences across industries, but also for different time patterns
across industries.
[Insert Figure 1 here.]
Figure 1 shows the time-series patterns of domestic IPOs over the period. In the two
graphs, the solid line shows the evolution of the annual number of IPOs in China between

12
2000 and 2011. Several episodes appear clearly in these graphs. In 2000 and early 2001, there
were no listing restrictions and the IPO market was active. In 2001-2008, various restrictions
were put in place, reflecting the government’s determination to control the stock market
through regulations and limits on the number of the firms approved to go public. These
restrictions led to a reduction in the number of new firms getting listed. In 2005, the number
of IPOs dropped significantly, following the poor performance of the Chinese stock market.
It recovered gradually in the following years, together with the stock index. In 2009, the
government, trying to boost the economy while facing the Global Financial Crisis, removed
most of the restrictions and simplified the IPO application process. This resulted in a
significant increase in the number of IPOs. At the same time, a new stock exchange designed
for high-tech firms and with less stringent listing requirements was opened, which also led to
an increase in the number of IPOs. The restrictions imposed by the regulators on IPOs over
our study period are presented in details in Appendix B.
Panel A of Figure 1 presents the evolution of the average PE ratio of newly listed firms
between 2000 and 2011. The PE ratio changed dramatically over this period. The main
variations come from the strict cap on PE ratios imposed by the regulator. As we explain in
Appendix B, PE ratios of newly listed firms were capped at 20 between November 2001 and
2004 and at 30 between January 2005 and November 2008. Then the cap was dropped.
Panel B reports average annual cash surprises (excess ratio)6 of IPO firms. The excess
ratio is defined as the difference between the final IPO amount and the initial filing amount.
In China, when firms apply for IPO listing, they have to justify their financing needs by
committing to a specific and detailed investment project that they will invest in after going
public using the proceeds of the IPO. Post-IPO investment in the proposed projects is
mandatory and controlled by the government. The project announced before the IPO is
6 We use the terms cash surprises and excess ratio interchangeably in the text.

13
binding, unless the firm explicitly asks for a change in projects, which is costly and slows
down the IPO process. A significant change in this rule occurred at the end of 2008. Before
the change, firms could not raise more funds than they needed to invest in their projects.
After it, they can use more funds than announced in the IPO prospectus and use this cash
windfall as they like. This rule change, together with the simultaneous removal of the PE cap,
changed dramatically the incentives of IPO firms. Post-2008, firms have an incentive to
announce low expected IPO prices, corresponding to limited IPO proceeds (and to small
projects) in their IPO prospectus and to raise significantly larger amounts (at significantly
higher prices) that they can use with complete discretion. Firms respond to this change in
incentives: As Panel B of Figure 1 shows, the average cash excess ratio is close to zero
during the heavily restricted period (from 2002 to 2008). This ratio becomes very large after
2009.
4. Results
4.1. Government-imposed constraints and the decision to go public in China or abroad
In this section, we test Hypothesis 1, which states that government-imposed constraints
may prevent some firms from going public and induce others to list abroad.
[Insert Table 2 here.]
We start by observing that the restrictions imposed by Chinese regulators are actually
binding for most of the IPO firms. Table 2 reports the number of firms that are within 1
percentage point of the government-imposed limitation on Price-to-Earnings ratios, as well as
the proportion of capped firms among the total IPO firms in the same year. With the
exception of 2005 and 2006, two years of decline of Chinese stock markets in which pricing
limits were not binding for most IPOs, a large proportion of IPO firms are priced at the cap.

14
In fact, the very rare firms that manage to obtain PE ratios in excess of the cap are mainly
state-owned enterprises (SOEs), which presumably have larger bargaining power in
negotiating IPO prices.
One effect of government restrictions is that some firms may be forced to seek foreign
listing. Panel B of Table 2 provides statistics on the number of overseas-listing Chinese firms
that are otherwise in violation of domestic listing restrictions. The restriction that we study in
the table is the regulation that states that “total proceeds cannot exceed more than twice of the
common equity”. This restriction was in place between 2003 and 2006, but given the time it
takes between the start of the IPO process and the time firms actually go public, we assume it
affected IPOs that were completed between 2004 and 2007. We focus on Chinese firms that
list abroad and ask what fraction of these firms had total proceeds greater than twice their
equity, when prices were constrained vs. when they were not. Consistent with Hypothesis 1-1,
the fraction of firms violating the rule is 41% in the restricted period and only 28% in the
non-restricted period. The difference is statistically significant at the 1% level. Although we
cannot rule out the possibility that rule-violating firms would have listed abroad even in the
absence of the restriction, this result shows that regulations blocked access to equity
financing to firms that had to go public in other financial markets in which the size of the
equity issue was not perceived as an issue.
Another way to explore the incentives of Chinese firms to list abroad is by comparing
industry valuations. We hypothesize that firms in industries with high valuations are more
likely to seek overseas listing when valuations at the time of the IPO are limited by pricing
constraints. Considering industries instead of individual firms allows us to abstract from
individual firm characteristics that can explain listing decisions, and to focus on industry-
level growth options, with the idea that the average firm in industries in which growth options
are larger is in greater need of external financing.

15
[Insert Table 3 here.]
Table 3 reports the tests of this hypothesis (Hypothesis 1-2). In Panel A of the table, we
compare adjusted industry-level Market-to-Book ratios, equal to the average MB ratio of
listed firms in the industry of the IPO minus the average MB ratios in all other industries,
between firms listing overseas and domestically. Panel A of the table also reports
comparisons of industry valuation ranks, obtained by ordering the 31 industries in our sample
based on the average MB ratio of the listed firms they contain. First we provide these
statistics during the period in which PE ratios are capped (between November 2001 and
November 2008).7 In this period, the industry of the average firm listing abroad has a MB
ratio 0.14 above other industries, while the average domestic IPO belongs to an industry that
is valued slightly below the average industry (by -0.03, to be precise). The ranks of the
industries for the two groups of IPO give a similar picture: foreign listings belong to
industries with higher valuations than locally-listed firms. For the two measures, these
differences between local and foreign IPOs are statistically significant at the 5% level or
better. During the periods in which there is no such cap on valuations (before November 2001
and after November 2008), there is not much difference between the level and the rank of the
industries of firms that list domestically and those of foreign listed firms in terms of valuation.
This suggests that the pricing restrictions imposed by the Chinese government affect the
population of firms that list abroad and locally. When these restrictions are more severe,
firms from industries with higher valuations, which are presumably also the industries with
the most promising growth prospects, avoid the local IPO market and are more likely to list
abroad.
7 In this table, we consider PE restrictions only and ignore IPO size restrictions because the IPO size restriction period (2003 to 2006) is included in the pricing-restriction period (Nov. 2001 to Nov. 2008). In Panel B of the table, in which the analysis is at the firm level, the tests have more power, which allows us to study the two periods separately.

16
Panel B of Table 3 confirms that there is a significant valuation difference between the
two groups of firms, mostly when pricing or proceeds are constrained. In this table, which
presents linear regressions, the analysis is at the IPO level and the dependent variables are
valuation proxies: the offering Price-to-Earnings ratio in columns 1 and 2, the offering
Market-to-Book ratio in columns 3 and 4. Industry fixed effects capture time-invariant
industry differences in valuation. We do not include time fixed effects because the time
dimension is captured by two dummy variables: Pricing restriction period in columns 1 and 3,
Proceeds restriction period in columns 2 and 4. Pricing restriction period is equal to one
when PE ratios are constrained, between November 2001 and November 2008. Proceeds
restriction period is equal to one when IPO proceeds are constrained, between 2003 and 2006.
Since the proceeds constraint period is included in the pricing constraint period, the effect we
identify in columns 2 and 4 is the effect of the combination of the two constraints. The main
coefficients of interest in these regressions are those on Foreign List, an indicator variable
equal to 1 for foreign IPOs, and on its interaction with Pricing restriction period (in columns
1 and 3) and Pricing restriction period (in columns 2 and 4). The coefficient on Foreign List
represents the valuation premium (or discount) of foreign IPOs outside the restriction period,
while the sum of this coefficient and the coefficient on Foreign List interacted with the
restriction period dummy represents the valuation difference between domestic and foreign
IPOs during restriction periods.
In the four columns of Table 3, Panel B, the coefficient on Foreign List is positive but not
statistically significant. The coefficient in the interaction variable (Foreign List × Pricing
restriction period in columns 1 and 3, Foreign List × Proceeds restriction period in columns
2 and 4), however, is positive and significant in columns 1, 2 and 4. More importantly, the
Wald tests reported at the bottom of the table show that the sum of coefficients on Foreign
List alone and interacted with the restriction period dummy is always significantly positive at

17
the 1% level. In other words, firms that list abroad obtain higher valuations, but mostly
during restriction periods. The economic magnitudes of those valuation differences are also
very large, consistent with the summary statistics of Table 1: during pricing restriction
periods, the PE ratios of foreign IPOs are 34.8 (6.058+28.767) higher than that of domestic
IPOs, while their MB ratios are 9.5 (3.871+5.579) higher. In the same vein, during the
proceeds restriction period between 2003 and 2006, the PE ratios of foreign IPOs are 38.7
(8.74+29.973) higher than that of domestic IPOs and their MB ratios are 11.6 (3.403+8.183)
higher.
These results suggest that constraints on pricing and proceeds imposed by the regulator
affect the valuation of firms listing locally and abroad: when these constraints are lifted,
valuation differences disappear or become more modest. Another related issue is about the
type of firms that list abroad vs. domestically. One possibility is that random firms from the
population of Chinese IPO candidates list abroad, in countries where they can obtain higher
valuations. This is the benign view, in which the effect documented above simply reflects
valuation differences between the Chinese and foreign markets, not intrinsic differences
between domestic and foreign IPO firms. Another possibility, however, is that firms self-
select into foreign listing, and that firms of higher intrinsic quality list abroad. This
alternative possibility is more pernicious because it implies that regulations have a negative
impact on the quality of firms that are listed in Chinese stock markets.
[Insert Table 4 here.]
To distinguish between these two alternative possibilities, we compare the operating
performance (Return on Assets) of foreign and domestic listings in the three years following
the IPO in the first two columns of Table 4. Summary statistics in Table 1 suggest that firms
that list locally differ from firms that choose foreign markets in several important dimensions.
Adding industry effects and controlling for firm characteristics allows us to neutralize some
18
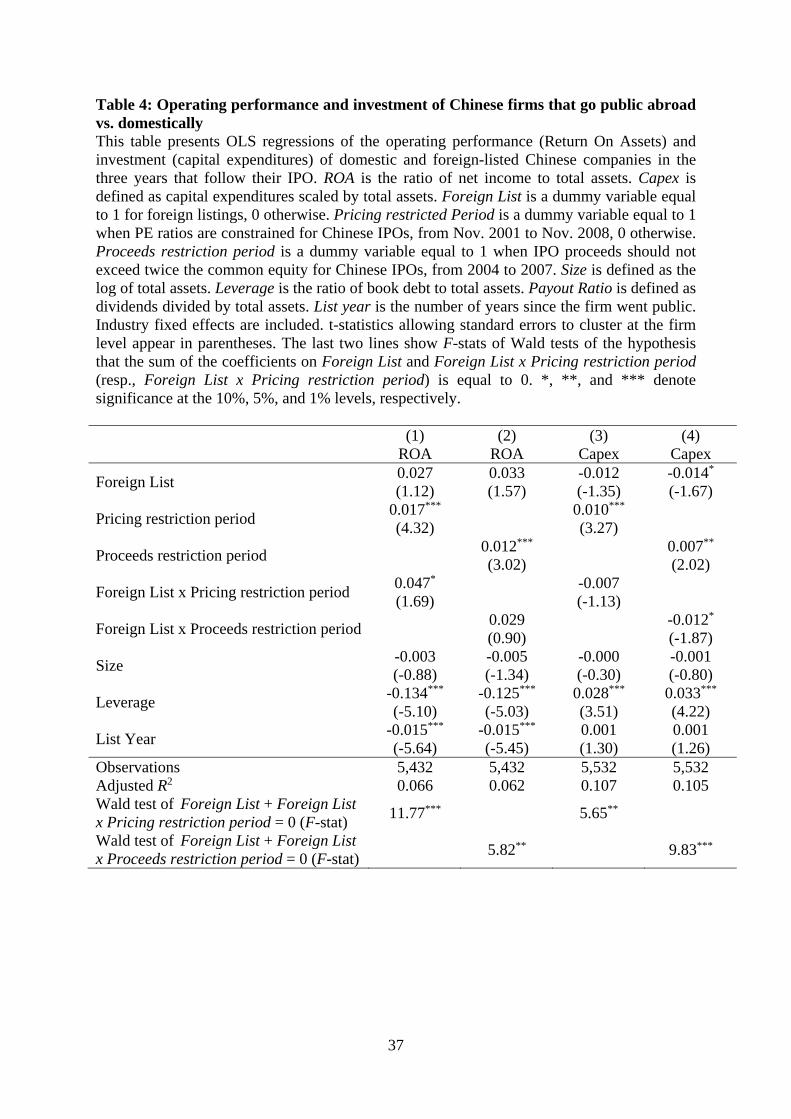
of these dimensions. Consistent with the univariate results of Table 1, Chinese-listed firms
have lower operating performance (of about 3%) but this difference is not statistically
significant at usual levels. It goes up, however, during restriction periods: the coefficients on
Foreign List × Pricing restriction period and Foreign List × Proceeds restriction period are
both positive, in columns 1 and 2, respectively. More importantly, the sum of coefficients on
Foreign List alone and interacted with the restriction period dummies is significantly positive
(at the 1% level in column 1, at the 5% level in column 2). This suggests that the performance
difference between domestic and foreign IPO firms is more pronounced when the regulator
imposes restrictions on prices or proceeds. In other words, firms that list abroad obtain higher
valuations, but mostly during restriction periods.
Another possibility is that the two types of firms differ in other dimensions than their
performance. For example, listing abroad may allow firms to raise more funds, which leads
firms with greater investment opportunities (and therefore greater value) to choose foreign
markets. To examine this possibility, we repeat the previous test using capital expenditures as
the dependent variable, in columns 3 and 4 of Table 4. In fact, firms listed locally invest
slightly more than their foreign-listed counterparts in the three years following their IPO, in
particular when they went public during restriction periods: the sum of coefficients on
Foreign List alone and interacted with the restriction period dummies is significantly negative
(at the 5% level in column 3, at the 1% level in column 4). In light of previous results on
valuation and operating performance differences, this suggests that domestic IPO firms invest
in less profitable projects. Taken together, the results in tables 3 and 4 suggest that there is a
quality difference between the two groups of firms, and finer subperiod analysis suggests that
this is driven at least partially by regulations on the pricing of IPOs.
4.2. Government-imposed constraints and the decision to go public

19
In this section, we focus on Hypothesis 2, which predicts that, in the population of private
Chinese firms, those that go public are not necessarily those that need financing the most.
Unlike in our previous tests, the evidence on this hypothesis can only be indirect because data
limitations prevent us from observing the valuation, performance, and need for funding of
private firms other than those that eventually go public. Instead, we first focus on industry
valuations. Our premise is that capital should be allocated to firms in industries with the
largest growth options. Thus, we should observe more IPOs in industries with higher relative
valuations.
[Insert Table 5 here.]
In Table 5, we compare relative industry valuations of firms going public in four
subperiods with different pricing constraints (none before November 2001, a PE limit of 20
until December 2004, of 30 until November 2008, and no limit thereafter) in Panel A. Panel
B groups these subperiods into two periods, with or without a pricing constraint. During the
periods with no pricing restrictions (pre-Oct. 2001 and post-Nov. 2008), the average market-
to-book ratios in industries of firms that go public are higher than during the period with
pricing restrictions (November 2001 to November 2008). Moreover, in times of pricing
restriction, the average valuation (MB) of firms in the same industries as those that go public
is slightly below the overall average valuation in other industries. By contrast, the valuation
of industries IPO firms are coming from is above the average valuation (+0.38) after
November 2008, when PE limits are lifted. The same picture emerges when one considers
industry ranks instead of valuation. 8 Panel B of Table 5 formally tests the differences
8 The first period we study in Panel A (2000 to October 2001) does not seem to differ from periods with pricing restrictions even though it has no such restrictions. This is driven by IPOs of state-owned enterprises (SOEs), which represent a large fraction of IPOs in this period. Without those, the number of IPOs in the first period goes down to 80, the adjusted industry MB goes up to 0.21, and the relative industry MB rank goes down to 16.06. More generally, our results in this table are stronger when we ignore IPOs by SOEs. This is not

20
between relative industry valuations in pricing restriction periods vs. periods with no price
limits. These differences are highly significant statistically. This suggests that pricing limits
affect the population of firms going public and discourage firms from industries with the
highest growth options to go public, at least domestically. One might argue that post-2009 is
associated with the start of a new exchange board for high-tech growth firms with less strict
listing rules. When we exclude firms from this exchange, the level and rank of average MB in
industries of firms going public decrease slightly, but they are still much higher than during
the restriction period.
Another way to gauge whether firms that go public in China are firms with good growth
prospects is to examine the evolution of their performance around their IPO.
[Insert Table 6 here.]
We do so in Table 6, in which we use a difference-in-differences approach to explore
changes in operating performances in terms of sales and Return on Assets (ROA) between
three years before and three years after the IPO. Treated firms are the domestic IPO firms in
the sample. Control firms are firms that have been listed for at least two years as at date 0,
that are in the same industry, year, terciles of total assets and sales growth, quartile of ROA,
and that are the closest to the treatment firm in terms of ROA (for this sequential matching,
we proceed like in Derrien and Kecskes (2013)). Panel A of the table reports the distribution
of sales growth and ROA one year before the IPO. IPO firms perform slightly better than
their peers before they go public, but differences are not statistically significant. We further
compare the ROA and sales over the period around the IPO (from the IPO minus 3 years to
the IPO plus 3 years) in Panel B of Table 6. Again it seems that on average IPO firms
perform slightly better than similar seasoned firms in most years. Importantly, however,
when we calculate the difference-in-differences between IPO and seasoned firms and
surprising considering that IPO decisions in such firms may be driven by concerns other than valuation and funding needs.

21
between IPO-3 years and IPO+3 years, in Panel C, we find that the change in ROA is
significantly worse for IPO firms than for their peers over that period, while sales keep
increasing. The performance of IPO firms seems to decline around the time when they go
public. This may be because firms that have access to the IPO market in China are not those
that need financing the most. This result is also consistent with reversion to the mean of
performance, which was observed in past studies using data from other countries (e.g.,
Chemmanur, He and Nandy (2014)).
4.3. The unintended negative consequences of the constraints
This section examines the third hypothesis, which predicts that government regulations
and changes in regulations affect the behaviour of IPO firms. We focus on a significant
change in the incentives of IPO firms that occurred at the end of 2008. Firms willing to do an
IPO in China must do so to finance a pre-specified investment project, and IPO candidates
have to disclose the detailed usage of IPO funds in their application process. This changed at
the end of 2008. First, the pricing constraint was lifted, which implies that firms could go
public at much higher valuations than they could previously obtain. Second, while the
proceeds announced in the IPO prospectus still have to be used to fund a pre-determined
investment project, the firm can use any proceeds raised above the cost of the project with
complete discretion. In this new regime, firms have incentives to announce small-scale
projects and small target PE ratios, hoping that the IPO price they will eventually obtain will
allow them to raise significantly more funds, which they will be able to use as they see fit.
Hence our Hypothesis 3-1 regarding the evolution of target PE ratios of IPOs around this
regulatory change.
[Insert Table 7 here.]

22
Table 7 reports the difference in the target and actual PE ratios of Chinese IPOs until
November 2008 vs. after 2010 (2009 is the first year in which the restriction was removed,
but most of the firms listed in 2009 applied for listing before 2009, under the previous regime,
so we drop these firms from the analysis). The average target PE ratio of 23.89 post-2010 is
significantly lower statistically than it was before November 2008 (25.88 on average), though
overall valuations are significantly higher in the last two years of our sample period relative
to earlier years. The second line of Table 7 presents actual PE ratios obtained by IPOs in the
two subperiods: it shows a significant increase, which is the direct consequence of the
removal of price limits. This difference between target and actual valuations represent
significant cash windfalls for IPO firms in the years following the removal of price limits.
Next we ask what firms do with these cash windfalls. We have seen in Table 6 that recent
IPOs tend to grow more than listed firms in the three years following their listing. In the
presence of large “cash surprises” (significant amounts of cash raised in excess of the amount
filed in the IPO prospectus), firms could also decide to return cash to their shareholders.
Whether they do so should depend on shareholder incentives. When ownership is
concentrated, shareholders have both strong incentives and the possibility to influence the
decision to pay dividends. This is probably less the case in firms with dispersed ownership or
in SOEs, in which managers have more incentives to use slack to extract private benefits.
[Insert Table 8 here.]
We test this hypothesis (Hypothesis 3-2) in Table 8, in which we use the following
specification:
tjtiiiiitji ControlsOwnershipoExcessratiOwnershipratioExcessD ,1,43210,,
The dependent variable is the payout ratio of firm i that belongs to industry j in the three
years following the IPO. Columns 1 and 2 report the results for the first year after the IPO

23
and columns 3 and 4 report the results for the three years after the IPO. The specification
include industry year fixed effects that capture the evolution of dividend payments at the
level of the industry the firm belongs to. The main independent variables of interest are
excess ratio (the amount raised above the targeted amount scaled by total assets of the IPO
year), ownership, which measures the ownership concentration of the firm at the time of the
IPO, and the interaction of these two variables. We also include controls lagged by one year
relative to the dividend-payment year. Table 1 suggests that recent Chinese IPOs pay
significant dividends (2.1% of their total assets on average in the three years following the
IPO). The first column of Table 8 shows that higher excess cash and more concentrated
ownership are associated with larger payouts in the year following the IPO. This effect is
mostly driven by the interaction of those two variables (Column 2): IPO firms with highly
concentrated ownership and large cash surprises pay high dividends. The effect is
economically sizeable: A one-standard deviation increase in both Ownership and Excess ratio
leads to an increase of about 6% of the standard deviation of the payout ratio
(0.1570.2020.036 / 0.019 = 6%).
Taking a longer perspective, one notices that firms with high excess ratios and
concentrated ownerships continue to pay larger dividends in the three years following their
IPO, but the coefficient on the interaction variable in column 4 goes down by about a third
compared to that in column 2. Also consistent with an attenuation of this effect over time, the
effect of Excess ratio on dividend payout is no more significant in column 3, and the
coefficient on List Year, which counts the number of years since the IPO, is negative and
significant. In unreported robustness checks, we use different dependent variables such as
payout ratio using dividends relative to earnings (instead of total assets) and a dummy
variable indicating whether the dividend payout is larger than the net income or the annual
cash flows. We also run logit regressions. The results hold qualitatively in all cases. Thus, the

24
time when Chinese IPO firms are more likely to pay dividends is right after their IPO,
provided that they raised more cash than they needed and that their ownership is concentrated.
Next we ask whether investors understand the implications of such large dividend
distributions by some recent IPO firms. If our interpretation that these dividends indicate that
the firm has no profitable project available is correct, investors should revise downward their
expectations of the growth options of the firm when dividends are announced. This should
lead to a significant decrease in the firm’s stock price following the dividend announcement.
[Insert Table 9 here.]
This is Hypothesis 3-3, which we test in Table 9. This table reports Cumulative Abnormal
Returns in the 7-day period around the announcement of the dividend by newly-listed firms
in the three years following their IPO. Industry year fixed effects control for the evolution
of the average industry-level stock reaction to dividend announcement. The results suggest
that a higher payout ratio is associated with a more positive response from the market.
However, the interaction of this variable with the cash surprise at the time of the IPO (the
Excess ratio variable in the regression) has a large negative coefficient, which is not affected
much in column 2 of the table, in which we add more controls to the specification. In this
regression, a one-standard deviation increase in both Excess ratio and Payout ratio leads to
an average stock price decrease of 0.44% in the period around the dividend announcement
(0.202 0.019 1.153 = 0.44%).
In other words, recent IPO firms that pay dividends are not penalized by investors, but
those that pay a large dividend instead of investing the cash windfall they have obtained in
their IPO are. This suggests that, at the time these firms announce their dividends, investors
realize that they over-estimated the growth options of these firms. The downward revisions of
these growth options leads to a decrease in the value of the firms.

25
[Insert Table 10 here.]
In the next table, we explore the propensity of recent IPO firms to pay dividends and
market reactions to dividend announcements relative to listed firms. It might be the case that
large dividend payments are frequent in China, and that our previous results are simply
capturing this phenomenon. In the first column of the table, we regress payout ratios on firm
characteristics, the most important of which is Seasoned, a variable equal to 1 for seasoned
firms and 0 for recent IPO firms. Again, industry year fixed effects capture industry-level
evolutions of the dependent variables. Consistent with previous results, we find that recent
IPO firms pay on average 0.5% of their total assets more than the average comparable listed
firm. This is in sharp contrast with the evidence from more developed financial markets and
with the intuition, which suggests that IPO firms are at a stage of their life cycle in which
they need cash to invest. Consistent with the view that dividend announcements by firms that
went public recently reveal that their growth options are more limited than initially expected,
dividend announcements by recent IPO firms are associated with a return 0.8% lower than
that of seasoned companies making similar announcements.
5. Discussion and conclusion
Our results suggest that regulations imposed by the Chinese government have a
significant impact on the Chinese IPO market. In particular, pricing constraints seem to affect
the decision to list in China or abroad. The most promising firms seem to prefer listing
abroad. Although this is perhaps due to factors unrelated to regulations per se, our results
suggest foreign listing by high-value firms is more widespread at times when pricing
restrictions are more severe. Another important result is that firms change their behaviour in
response to regulation changes, and investors understand the incentives of firms and react

26
accordingly. For example, when firms that went public recently and had successful IPOs that
allowed to raise more funds than they asked for announce large dividend payments, investors
understand that these firms have less growth opportunities than they initially thought, and
their stock price decreases.
Overall, these results show that the Chinese IPO market is not organized optimally, in the
sense that it does not attract to the stock market the firms that need new financing the most.
IPO-specific regulations seem to play a role in this phenomenon, although other frictions may
also be at play. One of them, the impact of which we cannot directly test, is the fact that the
Chinese government is constantly experimenting with new rules. This creates a very
uncertain environment for IPO candidates, which might decide to list abroad or to obtain
alternative forms of financing.

27
References
Allen, F., J. Qian, and M. Qian, 2005, “Law, finance, and economic growth in China,” Journal of Financial Economics 77, 57-116.
Beatty, R., H. Lu, and W. Luo, 2016, “Market failure and re-emergence: A study of Chinese firms listed in the US,” mimeo, University of Southern California.
Chan, K., J. Wang, and K.C.J. Wei, 2004, “Underpricing and long-term performance of IPOs in China, Journal of Corporate Finance 10, 409-430.
Chang, K., Y.-C. Kim, Y.S. Kim, and J.H. Thornton Jr., 2012, “Unintended regulatory consequences: Evidence from the Korean IPOs,” Pacific-Basin Finance Journal 20, 292-309.
Chen, Q., X. Chen, K. Schipper, X. Yongxin and X. Jian, 2012, “The sensitivity of corporate cash holdings to corporate governance”, Review of Financial Studies, 25(12), 3610-3644.
Cheung, Y.-L., Z. Ouyang, and W. Tan, 2009, “How Regulatory Changes Affect IPO Underpricing in China,” China Economic Review 20, 692-702.
Chemmanur, T., S. He, and D. Nandy, 2010, “The Going-Public Decision and the Product Market”, Review of Financial Studies, 23(5), 1855-1908.
Derrien, F., and A. Kecskes, 2013, “The Real Effects of Financial Shocks: Evidence from Exogenous Changes in Analyst Coverage”, Journal of Finance, 68(4), 1407-1440.
Du, J., and C. Xu, 2009, “Which firms went public in China? A study of financial market regulation, World Development 37(4), 812-824.
Glaeser, E., S. Johnson, and A. Shleifer, 2001, “Coase versus the Coasians,” Quarterly Journal of Economics, August 2001, 853-899.
Güçbilmez, U., 2014, “Why do some Chinese technology firms avoid ChiNext and go public in the U.S.?,” International Review of Financial Analysis 36, 179-194.
Henry, P.B., 2000, “Stock market liberalization, economic reform, and emerging market equity prices,” Journal of Finance, 55(2), 529-564.
Kim, M., and J. Ritter, 1999, “Valuing IPOs,” Journal of Financial Economics, 53(3), 409-437.
Kothari, S.P., A. Leone, C.E. Wasley, 2005, “Performance matched discretionary accrual measures”, Journal of Accounting and Economics, 39(1), 163-197.
Lopez de Silanes, F., La Porta, R., Shleifer, A., and R. Vishny, 1998, “Law and finance,” Journal of Political Economy 116.
Pistor, K., and C. Xu, 2005, “Governing stock markets in transition economies: Lessons for China,” American Law and Economics Review 7, 184-210.

28
Su, D., and B.M. Fleisher, 1999, “An empirical investigation of underpricing in Chinese IPOs,” Pacific-Basin Finance Journal 7, 173-202.
Thomadakis, S., D. Gounopoulos, C. Nounis, and A. Merikas, 2016, “Collateral Regulation and IPO specific liberalisation: The case of price limits in the Athens stock exchange,” European Financial Management 22(2), 276-312.
Tian, L., 2011, “Regulatory underpricing: Determinants of Chinese extreme IPO returns,” Journal of Empirical Finance 18, 78-90.
Wurgler, J., 2000, “Financial markets and the allocation of capital”, Journal of Financial Economics, 58(1), 187-214.

29
Appendix A. Variable definitions
Name Definitions Excess ratio IPO proceeds minus filing amount scaled by total
assets of the IPO year Payout ratio Dividends scaled by total assets Ownership Ownership of the largest shareholder in the company,
plus the cumulative ownership of other shareholders (in the ten largest) that have family or business relations with the largest shareholder
Excess ROA Dummy variable equal to 1 if dividends exceed net income, 0 otherwise
Excess cash flow Dummy variable equal to 1 if dividends exceed operational cash flows, 0 otherwise
Size Natural log of total assets Leverage Book debt divided by total assets Sales growth Sales in the current year minus sales in the previous
year, divided by sales in the previous year Cash Flow Ratio of operational cash flows to total assets Capex Capital expenditures scaled by total assets ROA Net income divided by total assets List Year Number of years since the IPO Offering PE Ratio Price-to-Earnings ratio at the time of the IPO, equal to
the offer price divided by the latest Earnings Per Share before the offering
Offering MB Ratio Market-to-Book ratio at the time of the IPO, equal to the market value of equity after the IPO divided by total common shareholders' equity before the offering
Pricing restriction period Periods when PE ratios are not constrained for Chinese IPOs, from Nov. 1st 2001 to 2008
Proceeds restriction period Periods when IPO proceeds should not exceed twice the common equity for Chinese IPOs, from 2004 to 2007
Chinesedum Dummy variable equal to 1 for Chinese firms that list domestically, 0 for Chinese firms that list abroad
Seasoned Firms that have been listed for over 3 years

30
Appendix B: Financial hurdles for getting listed in Chinese stock market
All companies applying for an IPO must meet the following historical financial performance criteria to be eligible for an initial public offering on one of China's two stock exchanges.
(1) Cumulative net income in the three years prior to the IPO must exceed 30 million renminbi (RMB), and the company cannot report a net loss in any of the three years;
(2) Cumulative revenue in the three years prior to the IPO must equal at least RMB 300 million or cumulative cash flow from operation in three years prior to the IPO must be at least RMB 50 million;
(3) Intangible assets cannot account for more than 20% of total assets; and
(4) Net assets in the year before the IPO must total at least RMB 30 million.
From 2003 to 2006, IPO proceeds should not larger than twice the equity.
Window guidance
The only explicit regulation is the smallest number of shares issued. A 1999 law specified that firms with fewer than 400 million shares outstanding must have at least 25% of new shares following the IPO. Other regulations are not written but there is a consensus on them among market participants.
Over time, there is different guidance on the IPO process.
Number of shares: from 2007 on, firms with fewer than 400 million shares must have exactly 25% of newly issued shares after the IPO.
IPO price: o Before 1999.06: Ranged between 13-17 o 1999.06- 2001.10: No cap. o 2001.11-2004.12: PE capped at 20. o 2005.01-2008.11: PE capped at 30. o 2008.12-2013: No cap. o 2012-2013: All IPOs suspended. o 2014-: IPOs restarted and PE is capped at industrial PE.
The timeline of an IPO application
Firms that want to go public first need to approach an underwriter, which advises them and organizes the whole process, usually involving legal and accounting firms for relevant material. The application preparation takes at least one year on average.
The project that justifies the fund raising is determined at this stage. Any change to this project or to the amount required to invest in it requires another round of approval from relevant agencies, which is time consuming and costly. Thus, firms try to keep revisions from initial filing to a minimum from this point on.

31
Finally, the application is filed with the Chinese Securities Regulatory Commission (CSRC). The contents of the application are very similar to those in the prospectus. They include information on the funds needed and the expected amount raised, as well as extra funding sources in case the funds raised in the IPO do not cover the funding needs of the project.
The waiting period, defined as the difference between the date of application filing and the date of listing, includes at least two components. First is the period from application to final approval, and the second is the period from formal approval and listing. Both can potentially take a long time and are quite uncertain.
Overall, the waiting time is very uncertain. From our interview with the practitioners, the waiting period is from one to two years normally, unless the IPO market is suspended by the government.
The final prospectus, after approval by CSRC, includes information on the total amount needed to fund the project and the expected amount raised, equal to the number of new shares times the expected IPO price.

32
Figure 1. Time-series patterns of Chinese IPOs
This figure shows the time-series patterns of Chinese IPO firms during 2000-2011. The red line in panels A and B represents the number of firms that do an IPO in China between 2000 and 2011 (with the numbers appearing on the right vertical axis). Panel A also show the evolution of the average PE ratio over the same period. Panel B shows the evolution of the average excess ratio, defined as the IPO proceeds minus the filing proceeds, scaled by total assets after the IPO.
Panel A Panel B PE ratio Excess ratio

33
Table 1: Summary statistics of Chinese IPO firms This table provides descriptive statistics for the variables in our sample of Chinese IPOs. Panel A presents statistics for Chinese firms that list in China, Panel B for Chinese firms that list abroad. Payout ratio is defined as dividends divided by total assets. Excess ratio is calculated as the IPO proceeds minus the filing proceeds, scaled by total assets after the IPO. Size is defined as the log of assets. Sales growth is defined as sales in the current year minus sales in the previous year divided by sales in the previous year. Leverage is the ratio of book debt to total assets. Ownership is the ownership of the largest shareholder in the company, plus the cumulative ownership of other shareholders (in the ten largest) that have family or business relations with the largest shareholder. ROA is the ratio of net income to total assets. Cash flow is the ratio of operating cash flows to total assets. Capex is capital expenditures scaled by total assets. List year is the number of years since the firm went public. Statistics on these variables are reported for the first three years post-IPO. Offering PE (respectively, Offering M/B) is the price-to-earnings ratio (respectively, the market-to-book ratio) of firms, calculated at the time of their IPO. All continuous variables are winsorized at the 1% and 99% levels.
Panel A: Domestic listings
Variable N Mean Median SD Min Max
Payout ratio 4,254 0.021 0.016 0.019 0 0.092 Excess ratio 4,254 0.137 0.088 0.202 -0.350 0.582 Size 4,254 21.11 20.92 0.968 19.60 25.02 Sales growth 4,254 0.217 0.189 0.372 -0.915 1.819 Leverage 4,254 0.156 0.114 0.137 0.008 0.637 Ownership 4,254 0.487 0.502 0.157 0.167 0.785 Cash flow 4,254 0.035 0.037 0.074 -0.196 0.219 ROA 4,254 0.054 0.053 0.036 -0.077 0.163 List year 4,254 2 2 0.817 1 3 Capex 4,254 0.088 0.071 0.069 0.001 0.328 Offering PE 1,418 39.32 32.56 21.18 6.67 150.82 Offering M/B 1,418 9.27 7.68 6.21 1.31 56.21
Panel B: Chinese firms that list abroad
Variable N Mean Median SD Min Max
Size 1,347 14.534 14.481 1.756 10.007 19.996 Leverage 1,387 0.363 0.338 0.207 0.038 0.836 ROA 1,279 0.124 0.058 0.370 -0.573 2.587 Capex 1,381 0.074 0.050 0.075 0.000 0.362 Offering PE 391 61.21 19.36 111.65 2.27 462.26 Offering M/B 398 19.83 5.68 37.66 1.31 157.31

34
Table 2: Pricing constraints and the listing decision Panel A presents the number and percentage of domestic IPOs with an offering Price-to-Earnings ratio within one percentage point of the PE limit chosen by the regulator. From November 2001 to 2004, the PE limit is 20. From 2005 to November 2008, the PE limit is 30. Panel B presents statistics on the fraction of foreign-listed IPOs that would violate the rule stating that “proceeds should not exceed twice the common equity” in different periods. It compares this fraction for firms affected by the restriction (those that went public between 2004 and 2007) vs. firms that went public in the rest of the 2000-2011 period. *** denotes significance at the 1% level.
Panel A: Domestic IPO firms with capped PE ratios
Year Number of IPOs Number of capped IPOs % capped
Nov. 2001-2002 76 63 82
2003 65 36 55
2004 100 36 36
2005 14 0 0
2006 61 5 8
2007 112 67 60
Jan.-Nov. 2008 76 32 42
Panel B: Foreign-listed IPOs violating the “proceeds should not exceed twice the common equity” rule
Restriction period (2004-2007)
Non-restriction period p-value of difference
Fraction of firms violating the rule
0.41 0.28 <0.01***
Number of observations 229 282

35
Table 3: Valuation of Chinese firms that go public abroad vs. domestically Panel A presents differences in average adjusted industry Market-to-Book (MB) and industry MB rank between firms that go public abroad and domestically in the year of their IPO. Adjusted industry MB is the average MB of listed firms in an industry minus the average MB of all listed firms. Firms have to be listed for at least 2 years to enter the sample. Industry MB Rank is the rank of the average MB of an industry (relative to all other industries). Panel A is exploring the PE restriction period (Nov.2001-Nov.2008). Panel B explores the non-restriction periods (2000 to Oct.2001 and post-Nov.2008). p-values of difference tests between the two groups of firms appear in the last column. Panel B presents OLS regressions of valuation ratios at the time of the IPO for domestic vs. foreign-listed Chinese firms (Price-to-Earnings ratio in column 1, Market-to-book ratio in column 2). Foreign List is a dummy variable equal to 1 for foreign listings, 0 otherwise. Pricing restricted Period is a dummy variable equal to 1 when PE ratios are constrained for Chinese IPOs, from Nov. 2001 to Nov. 2008, 0 otherwise. Proceeds restriction period is a dummy variable equal to 1 when IPO proceeds should not exceed twice the common equity for Chinese IPOs, from 2004 to 2007. Size is the log of total assets. Leverage is the ratio of book debt to total assets. ROA is the ratio of net income to total assets. Industry fixed effects are included. Heteroskedasticity-robust t-statistics are in parentheses. The last two lines show F-stats of Wald tests of the hypothesis that the sum of the coefficients on Foreign List and Foreign List x Pricing restriction period (resp., Foreign List x Pricing restriction period) is equal to 0. *, **, and *** denote significance at the 10%, 5%, and 1% levels, respectively.
Panel A: Relative industry valuations of domestic vs. foreign IPOs
Foreign listing
Domestic listing
p-value of difference
Pricing restriction period (Nov.2001 to Nov.2008)
Adj. industry MB 0.14 -0.03 0.01** Industry MB Rank 14.56 16.78 <0.01*** Number of observations 283 503
Non pricing-restriction period (pre-Nov.2001 and Post Nov.2008)
Adj. industry MB 0.34 0.28 0.51 Industry MB Rank 15.62 14.43 0.06* Number of observations 200 914

36
Panel B: Valuation of domestic vs. foreign IPOs
(1) (2) (3) (4) Offering PE Offering PE Offering MB Offering MB
Foreign List 6.058 (0.84)
8.740 (1.36)
3.871 (1.36)
3.403 (1.44)
Pricing restriction period -26.115*** (-18.98)
-6.029*** (-11.74)
Proceeds restriction period
-19.437*** (-13.05)
-4.974*** (-9.96)
Foreign List x Pricing restriction period 28.767***
(2.62)
5.579 (1.44)
Foreign List x Proceeds restriction period
29.973** (2.52)
8.183** (2.07)
Size 0.203 (0.10)
1.133 (0.54)
-1.525** (-2.43)
-1.315** (-2.11)
ROA -0.457 (-0.01)
5.512 (0.15)
40.864*** (4.15)
41.474*** (4.16)
Leverage 20.100 (1.29)
12.043 (0.78)
29.520*** (6.20)
27.372*** (5.87)
Observations 1,771 1,771 1,716 1,716 Adjusted R2 0.110 0.086 0.187 0.177 Wald test of Foreign List + Foreign List x Pricing restriction period = 0 (F-stat)
17.19*** 12.88***
Wald test of Foreign List + Foreign List x Proceeds restriction period = 0 (F-stat)
14.22*** 13.12***
37
Table 4: Operating performance and investment of Chinese firms that go public abroad vs. domestically This table presents OLS regressions of the operating performance (Return On Assets) and investment (capital expenditures) of domestic and foreign-listed Chinese companies in the three years that follow their IPO. ROA is the ratio of net income to total assets. Capex is defined as capital expenditures scaled by total assets. Foreign List is a dummy variable equal to 1 for foreign listings, 0 otherwise. Pricing restricted Period is a dummy variable equal to 1 when PE ratios are constrained for Chinese IPOs, from Nov. 2001 to Nov. 2008, 0 otherwise. Proceeds restriction period is a dummy variable equal to 1 when IPO proceeds should not exceed twice the common equity for Chinese IPOs, from 2004 to 2007. Size is defined as the log of total assets. Leverage is the ratio of book debt to total assets. Payout Ratio is defined as dividends divided by total assets. List year is the number of years since the firm went public. Industry fixed effects are included. t-statistics allowing standard errors to cluster at the firm level appear in parentheses. The last two lines show F-stats of Wald tests of the hypothesis that the sum of the coefficients on Foreign List and Foreign List x Pricing restriction period (resp., Foreign List x Pricing restriction period) is equal to 0. *, **, and *** denote significance at the 10%, 5%, and 1% levels, respectively. (1) (2) (3) (4) ROA ROA Capex Capex
Foreign List 0.027 (1.12)
0.033 (1.57)
-0.012 (-1.35)
-0.014* (-1.67)
Pricing restriction period 0.017*** (4.32)
0.010*** (3.27)
Proceeds restriction period
0.012*** (3.02)
0.007** (2.02)
Foreign List x Pricing restriction period 0.047* (1.69)
-0.007 (-1.13)
Foreign List x Proceeds restriction period
0.029 (0.90)
-0.012* (-1.87)
Size -0.003 (-0.88)
-0.005 (-1.34)
-0.000 (-0.30)
-0.001 (-0.80)
Leverage -0.134*** (-5.10)
-0.125*** (-5.03)
0.028*** (3.51)
0.033*** (4.22)
List Year -0.015*** (-5.64)
-0.015*** (-5.45)
0.001 (1.30)
0.001 (1.26)
Observations 5,432 5,432 5,532 5,532 Adjusted R2 0.066 0.062 0.107 0.105 Wald test of Foreign List + Foreign List x Pricing restriction period = 0 (F-stat)
11.77*** 5.65**
Wald test of Foreign List + Foreign List x Proceeds restriction period = 0 (F-stat)
5.82** 9.83***

38
Table 5: Industry Market-to-Book of IPO firms This table presents the mean value of adjusted industry MB and industry MB rank of Non-SOE IPO firms in different periods. The adjusted industry MB is the average MB of firms in an industry minus the average MB of all listed firms (listed for at least two years). Industry Rank is the rank of the average MB of an industry (relative to all other industries). The PE constraint period is from November 2001 to November 2008. The Non PE constraint period includes 2000 to October 2001 and December 2008 to 2011. Panel A presents the mean value of the adjusted industry MB and the industry MB rank of all domestic IPO firms in different periods. Panel B presents the difference in mean values of adjusted industry MB and industry MB ranks of domestic IPO firms between PE constraint period and Non-PE constraint period. The p-value of a difference test between the two periods appears in the last column. *, **, and *** denote significance at the 10%, 5%, and 1% levels respectively. Panel A 2000 to
2001.10 2001.11 to
2004 2005 to 11. 2008
12.2008 to 2011
Adjusted industry MB -0.09 -0.03 -0.02 0.38 Industry MB rank 17.71 17.67 15.96 13.52 Observations 198 240 263 716 Panel B PE constraint
period Non PE
constraint period P-value of the
difference Adjusted industry MB -0.03 0.28 <0.01*** Industry MB rank 16.78 14.43 <0.01*** Observations 503 914

39
Table 6: Operating performance changes around Chinese IPOs This table reports changes in operating performance around the IPO, for domestic IPO firms in the sample vs. seasoned firms, which are used as controls. Controls are selected as follows: For all firms listed for at least 2 years, we sort ROA into quartiles and sales growth and total assets into terciles every year and match each treatment firm with a seasoned firm in the same industry, year, total assets, sales growth and ROA groups. The seasoned firm with the smallest difference in ROA with the treatment firm is chosen as the control firm. Panel A reports descriptive statistics for treated and control firms one year before the IPO, as well as p-values of differences between the mean values of the variables for treated vs. control firms. Size is defined as the log of assets. Sales growth is defined as sales in the current year minus sales in the previous year, divided by sales in the previous year. ROA is net income divided by book total asset. Panel B reports mean values of ROA and sales of treated and control firms from 3 years before to 3 years after the IPO. Sales are in 109 RMB. Panel C reports difference-in-differences estimates for ROA and sales from 3 years before to 3 years after the IPO. The first difference is the difference between the average ROA (respectively, sales) 3 years after the IPO and the average ROA (respectively, sales) 3 years before the IPO for both treated and control firms. The second difference is the difference between the differences of treated and control firms. DiD results are winsorized at the 1% and 99% levels. *, **, and *** denote significance at the 10%, 5%, and 1% levels respectively.
Panel A: Summary statistics – Chinese IPOs vs. matched seasoned firms
variable 25th percentile median 75th percentile P-value
treated control treated control treated control Size
19.51 20.10 20.35 20.46 21.11 21.29 0.04**
Sales growth
0.069 0.060 0.201 0.197 0.391 0.434 0.79
ROA 0.075 0.069 0.123 0.120 0.198 0.188 0.53 Panel B: Evolution of operating performance
Year N IPO-3 IPO-2 IPO-1 IPO+1 IPO+2 IPO+3
ROA Treated 4,370 0.110 0.117 0.118 0.053 0.045 0.042 Control 4,392 0.043 0.066 0.081 0.035 0.036 0.046
Sales Treated 4,394 2.42 3.16 3.91 6.02 7.04 8.62
Control 4,392 2.07 2.58 2.78 4.75 5.27 5.77 Panel C: Difference-in-differences
N ROA Sales
Diff-in-diff 733 -0.052*** 1.11**

40
Table 7: Pre-Nov.2008 vs. post-2009 target and actual PE ratios of IPO firms This table presents target PE ratios announced by domestic IPO firms before November 2008 vs. after December 2009. The target PE ratio is announced in the pre-IPO prospectuses. It is calculated as the offering PE multiplied by the filing amount and divided by IPO proceeds. The p-value of a difference test between the two periods appears in the last column.*, **, and *** denote significance at the 10%, 5%, and 1% levels respectively.
Pre-Nov. 2008 Post-Dec. 2009 P-value
Target PE 25.88 23.89 <0.001***
PE 24.49 52.96 <0.001*** Number of observations 675 647

41
Table 8: Cash surprises and payout ratios This table presents the relation between payout ratio and cash surprises up to 3 years after the IPO for domestic IPOs. Payout ratio is defined as dividends divided by total assets. Excess ratio is IPO proceeds minus filing proceeds, divided by total assets. Size is the log of total assets. Sales growth is sales in the current year minus sales in the previous year, divided by sales in the previous year. Leverage is the ratio of book debt to total assets. Ownership is the ownership of the largest shareholder in the company, plus the cumulative ownership of other shareholders (in the ten largest) that have family or business relations with the largest shareholder. ROA is the ratio of net income to total assets. Cash flow is operating cash flows divided by total assets. Capex is capital expenditures divided by total assets. List year is the number of years since the firm went public. Industry × year fixed effects are included. Heteroskedasticity-robust t-statistics are in parentheses in the first two columns, t-statistics allowing for clustering of standard errors at the firm level in the last two columns. *, **, and *** denote significance at the 10%, 5%, and 1% levels respectively. First Year First Year First 3 Years First 3 Years Payout Ratio Payout Ratio Payout Ratio Payout Ratio
Excess Ratio 0.009* (1.95)
-0.008 (-0.90)
0.002 (0.69)
-0.010* (-1.78)
Ownership 0.007** (1.97)
0.001 (0.22)
0.006*** (2.91)
0.002 (0.94)
Excess Ratio × Ownership
0.036** (2.14)
0.025** (2.34)
State Owned -0.000 (-0.18)
-0.000 (-0.00)
-0.000 (-0.06)
0.000 (0.13)
Size -0.000 (-0.68)
-0.000 (-0.61)
0.001** (2.24)
0.001** (2.33)
Sales Growth -0.002 (-1.08)
-0.002 (-1.11)
-0.003*** (-3.51)
-0.003*** (-3.37)
Leverage -0.013** (-2.43)
-0.013** (-2.48)
-0.020*** (-7.32)
-0.020*** (-7.35)
Cash Flow 0.034*** (3.96)
0.034*** (3.93)
0.036*** (8.78)
0.036*** (8.77)
ROA 0.289*** (9.24)
0.289*** (9.23)
0.247*** (20.37)
0.247*** (20.35)
Capex -0.019** (-2.22)
-0.019** (-2.18)
-0.023*** (-5.60)
-0.023*** (-5.53)
List Year
-0.001*** (-3.47)
-0.001*** (-3.46)
Year × Industry fixed effects Yes Yes Yes Yes
Observations 1,418 1,418 4,201 4,201
R2 0.393 0.396 0.437 0.438

42
Table 9: Market reaction to dividend announcements This table presents determinants of the market reaction to dividend payout announcements up to three years after domestic IPOs. CAR is the seven-day cumulative abnormal return around the announcement of the dividend. Payout ratio is defined as dividends divided by total assets. Excess ratio is calculated as the IPO proceeds minus the filing proceeds, scaled by total assets. Size is the log of assets. Sales growth is defined as sales in the current year minus sales in the previous year, divided by sales in the previous year. Leverage is the ratio of book debt to total assets. Ownership is the ownership of the largest shareholder in the company, plus the cumulative ownership of other shareholders (in the ten largest) that have family or business relations with the largest shareholder. ROA is the ratio of net income to total assets. Cash flow is ratio of the operating cash flows to total assets. Capex is capital expenditures divided by total assets. List year is the number of years since the firm went public. Industry × Year fixed effects are included. t-statistics allowing standard errors to cluster at the firm level appear in parentheses. *, **, and *** denote significance at the 10%, 5%, and 1% levels respectively.
(1) (2) CAR CAR
Payout Ratio 0.395*** (4.10)
0.353*** (3.00)
Excess Ratio 0.0169 (1.36)
0.0111 (0.77)
Excess Ratio × Payout Ratio -1.182*** (-3.30)
-1.153*** (-3.11)
List Year 0.0116***
(5.95) 0.0121***
(6.01)
State Owned
-0.000646 (-0.16)
Ownership
0.0140 (1.54)
Size
0.00178 (1.01)
Sales Growth
-0.00274 (-0.60)
ROA
-0.00612 (-0.10)
Leverage
-0.0169 (-1.41)
Cash Flow
-0.00866 (-0.43)
Industry × Year fixed effects Yes Yes Observations 3,295 3,295 Adjusted R2 0.081 0.080

43
Table 10: Payout ratios and dividend-announcement CAR for IPOs vs. seasoned firms This table presents regressions of the payout ratio, defined as dividends divided by total assets, and the CAR in the seven days around dividend announcements, on the following explanatory variables: Seasoned is a dummy variable equal to 1 for seasoned companies, 0 for domestic IPO firms up to three years after their IPO. State Owned is a dummy variable equal to 1 if the firm is state-owned, 0 otherwise. Size is the log of total assets. Sales growth is defined as sales in the current year minus sales in the previous year, divided by sales in the previous year. Leverage is the ratio of book debt to total assets. Ownership is the ownership of the largest shareholder in the company, plus the cumulative ownership of other shareholders (in the ten largest) that have family or business relations with the largest shareholder. ROA is the ratio of net income to total assets. Cash flow is ratio of operating cash flows to total assets. Capex is capital expenditures scaled by total assets. List year is the number of years since the firm went public. Year × Industry fixed effects are included. t-statistics allowing standard errors to cluster at the firm level appear in parentheses. *, **, and *** denote significance at the 10%, 5%, and 1% levels respectively.
(1) (2) Payout Ratio CAR Seasoned -0.005***
(-12.75) 0.008*** (3.89)
State Owned 0.001* (1.65)
-0.002 (-1.07)
Size 0.001*** (3.32)
0.001* (1.67)
Sales Growth -0.000*** (-6.44)
-0.001 (-0.86)
Leverage -0.000 (-0.69)
-0.001 (-0.19)
Cash Flow 0.039*** (17.20)
-0.002 (-0.17)
ROA 0.104*** (22.44)
0.052** (2.44)
List Year -0.000*** (-9.19)
-0.000 (-0.79)
Capex -0.009*** (-3.26)
Industry × Year fixed effects Yes Yes Observations 19,929 11,294 Adjusted R2 0.334 0.022


![20110712 Unintended Consequences 12[1].07](https://img.pdfslide.net/doc/110x75/577d278b1a28ab4e1ea429b5/20110712-unintended-consequences-12107.jpg)