Embed Size (px)
Citation preview

The mal B idging
Thermal Bridging Part L1A – A Practical Guide
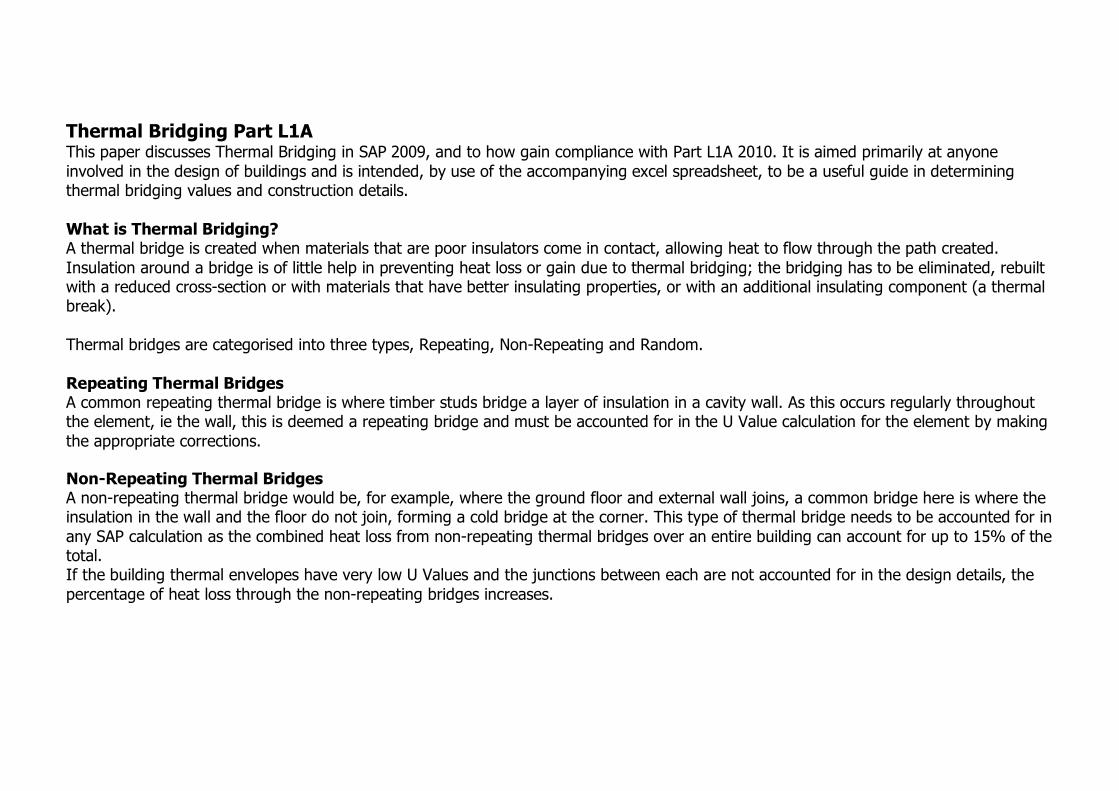
Thermal Bridging Part L1A This paper discusses Thermal Bridging in SAP 2009, and to how gain compliance with Part L1A 2010. It is aimed primarily at anyone involved in the design of buildings and is intended, by use of the accompanying excel spreadsheet, to be a useful guide in determining thermal bridging values and construction details. What is Thermal Bridging? A thermal bridge is created when materials that are poor insulators come in contact, allowing heat to flow through the path created. Insulation around a bridge is of little help in preventing heat loss or gain due to thermal bridging; the bridging has to be eliminated, rebuilt with a reduced cross-section or with materials that have better insulating properties, or with an additional insulating component (a thermal break). Thermal bridges are categorised into three types, Repeating, Non-Repeating and Random. Repeating Thermal Bridges A common repeating thermal bridge is where timber studs bridge a layer of insulation in a cavity wall. As this occurs regularly throughout the element, ie the wall, this is deemed a repeating bridge and must be accounted for in the U Value calculation for the element by making the appropriate corrections. Non-Repeating Thermal Bridges A non-repeating thermal bridge would be, for example, where the ground floor and external wall joins, a common bridge here is where the insulation in the wall and the floor do not join, forming a cold bridge at the corner. This type of thermal bridge needs to be accounted for in any SAP calculation as the combined heat loss from non-repeating thermal bridges over an entire building can account for up to 15% of the total. If the building thermal envelopes have very low U Values and the junctions between each are not accounted for in the design details, the percentage of heat loss through the non-repeating bridges increases.

The visual effect of cold bridging is condensation forming in the corners of rooms, and mould growing in due course. This is particularly a problem where external corners are exposed to the cold, or if internally wardrobes and other furniture obscure corners and there is little movement of warm air to circulate. Random Thermal Bridging Random bridging is where there is a one off bridge, for example a steel beam in a wall construction. These are dealt with in SAP by applying a procedure to account for it in the U Value calculation as detailed in BR443. However, good building practice would dictate that this type of bridge be minimised as much as possible. This paper is concerned with Non-Repeating Thermal Bridges only.
How are Thermal Bridges accounted for in SAP? Psi (Ψ) values The Ψ value is a measurement of heat loss, in Watts/meter. Kelvin (W/m.K) across a given junction between the external wall and another element. When multiplied by the length of that junction this becomes the linear thermal transmittance, or y value. All of the different y values are added together to provide the one figure that is then divided by the heat loss areas and input into the SAP software. This can be expressed as follows:
• Junction length (m) x Ψ value = y value
• Sum y values / Sum area of heat loss envelopes (A heat loss floor+ A heat loss walls + A heat loss roof) = total y value.

Thermal bridging in SAP 2006/ Part L 2005 Previously the designer of a building had various choices when determining which thermal bridging details would be entered into the SAP software. If designing his or her own details, the default Ψ value would be used, or a user defined one if known, multiplied by the linear length of each appropriate junction would give the overall y value. Alternatively if Accredited Construction Details (ACD) were used an overall y value figure of 0.08 could be applied, if Enhanced Construction Details (ECD) were used then 0.04 would be used, or if no detailing defined a figure of 0.15 would be used. In rare cases a user defined overall y value, as defined in BRE IP 1/06 and BR497, could be applied. Thermal bridging in SAP 2009/ Part L 2101 In the latest Building Regulations Part L 2010 there is a requirement now to account for non repeating thermal bridges within the SAP 2009 calculation, however, unlike the 2006 Regs previously, the Ψ value must be multiplied by the linear thermal length of the junction in all cases, and overall y value figures if using ACDs for example cannot be used any longer. This means that SAP assessors now must measure the length of each of the junctions listed in the table below and multiply it by an appropriate Ψ value to gain the y value for the junction. These are added together to provide the total, which is then divided by the total area of all the heat loss envelopes, to give the y value, as mentioned above. This is the figure input into the Sap and which goes into the calculation when determining the DER. Only junctions that conform to ACDs are measured in SAP 2009, although approved details do exist for different junctions in other schemes, however these are not accounted for in SAP2009. Thermal Bridging Junctions accounted for in SAP The full list of junctions measured in SAP 2009 and applicable to ADL1A is shown below in Table 1.

Table 1: SAP Table K1 A quick look at Table 1 and it can be seen that some junctions have more of an impact than others. For example, a Ψ value for a Gable wall with insulation at rafter level is 6 times less than if insulated at ceiling level. A flat roof is 7 times lower than a flat roof with a parapet. Lintels values are high, as is the ground floor junction, and as mentioned above a gable insulated at ceiling level, these should be considered first as their impact on the total result is greatest.

Each Junction detail has been assigned a reference number to make it easier to identify, as shown in Table K1 above. Their positions are shown on the drawings below.
Drawing 2 Thermal Bridging Reference numbers around openings
Drawing 1 Thermal Bridging Reference numbers
E10
P4 E12
E10
E6
E6
E5
E5 E5
P1
P2
E18
E18
E16
E16
E6
E8
P5 P5 E13
E13
E4
E3
E1 & 2

Dormers are included, See Diagram 3 below, however, they are due to be updated within the SAP software to include some junction lengths not currently included and possibly to account for different construction types. In many situations the construction of a dormer will differ from that of the main walls, for example a masonry cavity wall and a timber framed dormer wall. In this instance an area weighted value is input into the SAP software. Diagram 2 Dormer Thermal Bridging Reference numbers Note: Windows carry the same reference numbers as above
E13
E10 E12
E16 E16
IGNORED
IGNORED

Applying the Regulations With the changes to the Building Regulations in October 2010 and the introduction of SAP 2009 there are some distinct differences to the old practices. The previous overall figures for the ACD and ECD have now gone, instead if using these details the individual ACD or ECD Ψ values for each junction, multiplied by its length, are used to calculate the total figure. Using the overall figure of 0.15 is still an option but in reality the likelihood of gaining an overall pass for the building is extremely slim. Another way and which seems to be the most prevalent today, is designers are encouraged to design their own details, and the default Ψ values would apply. A better option would be to have the Ψ values calculated by a competent person, and these used instead of the default figures. In this situation a 25% or 0.02 confidence factor would be applied to each of the resulting heat loss figures, this is because the designed detail has not been proven in its buildability and therefore a Q& A checking, unlike the ACD and ECD figures. This should provide a better overall result than if using the default figures. In both the above, the linear thermal bridging lengths would be calculated and multiplied by the appropriate Ψ values used. There will eventually be schemes that ‘quality assure the calculation of the linear transmittance (Ψ values), accredit details in terms of buildability and have an associated quality assurance regime that inspects a sample of sites to confirm that the details are being implemented correctly.’ ACD values will be absorbed into these schemes Ψ values and many more details will gradually become available and confidence factors will not need to be applied. However in reality no additional approved schemes are in place today, and the deadline of Oct 2011 when the first ones were due to be approved has been put back, seemingly indefinitely, at present. Therefore, although a competent person may be employed to calculate the Ψ value he or she will not at present be a member of a scheme that will have a Q&A regime, a confidence factor would need to be applied. It should be noted that the resulting Ψ values will nearly always be an improvement on the default values, however, they may not be as good as one from an existing ACD scheme.

The current ACD and ECD schemes, Scottish ACDs, and the AECB Silver and Gold Carbonlite standards are the only approved schemes at present. These details may be used by anyone wishing to do so, and whose Ψ values may be applied to the linear calculation. Most details from the existing schemes have a checklist and a unique reference number. The reference numbers of any details to be used must be given to the SAP assessor at the design stage, and once the building is complete, good practice would suggest that the signed and dated checklists should be given to the SAP assessor to demonstrate compliance. Examples of each are shown on the next page and there are web links below to all the checklists themselves. Accompanying this paper is an excel spreadsheet detailing all of the Ψ values from every approved scheme, per junction type below, cross referenced, so that the most similar type can be compared. Links to the various Accredited Constructions detailed information. Accredited Construction Details Ψ(ACD) http://www.planningportal.gov.uk/buildingregulations/approveddocuments/partl/bcassociateddocuments9/acd Enhanced Construction Details Ψ (ECD) http://www.energysavingtrust.org.uk/business/Business/Housing-professionals/Interactive-tools/Enhanced-Construction-Details Scottish Accredited Construction Details ACDsΨ ( SACD) http://www.scotland.gov.uk/Topics/Built-Environment/Building/Building-standards/profinfo/techguide/acdscot AECB Silver Standard Ψ AECB Gold Standard Ψ http://www.aecb.net/standards_and_guidance.

ACD Checklist ECD Checklist
Scottish ACD Detail AECB Detail

Thermal Bridging Junction Details All are Junctions with an External Wall E1 Steel Lintel with Perforated steel base plate E2 All other lintels including other steel lintels
The combined lengths are taken automatically from the window dimensions as entered into the SAP software, then multiplied by the appropriate Ψ values.

E3 Sill & E4 Jamb The combined lengths are taken automatically from the window dimensions as entered into the SAP software, then multiplied by the appropriate Ψ values.
Sill Jamb E5 Ground Floor This is taken as the exposed heat loss perimeter on the ground floor. E6 Intermediate floor within dwelling This is the exposed heat loss perimeter of all the floors above the ground floor. E7 Intermediate floor between dwellings This applies to flats only, and is the exposed heat loss floor perimeter (other than ground floor) and exposed heat loss ceiling perimeter (other than top floor) of each flat. E8 Balcony within a dwelling The width of the balcony, if a balcony does not bridge the wall insulation, but is externally supported ACDs can apply.
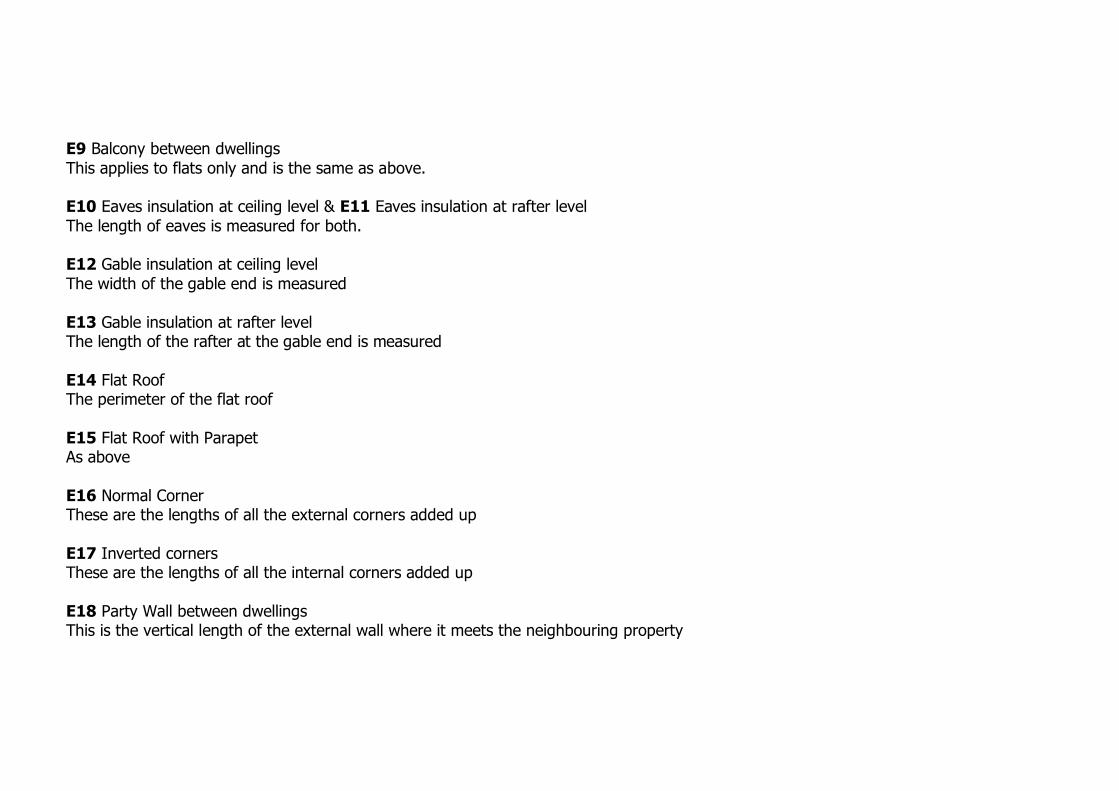
E9 Balcony between dwellings This applies to flats only and is the same as above. E10 Eaves insulation at ceiling level & E11 Eaves insulation at rafter level The length of eaves is measured for both. E12 Gable insulation at ceiling level The width of the gable end is measured E13 Gable insulation at rafter level The length of the rafter at the gable end is measured E14 Flat Roof The perimeter of the flat roof E15 Flat Roof with Parapet As above E16 Normal Corner These are the lengths of all the external corners added up E17 Inverted corners These are the lengths of all the internal corners added up E18 Party Wall between dwellings This is the vertical length of the external wall where it meets the neighbouring property

Junctions with a Party Wall P1 Ground floor This is the width of the party wall at ground floor level P2 Intermediate floor within dwelling This is the width of the party wall of all the floors above the ground floor. P3 Intermediate floor between dwellings This applies to flats only, and is the floor width joining the party wall (other than ground floor) and is the ceiling width joining the party wall (other than top floor) of each flat. P4 Roof insulation at ceiling level The length of eaves is measured at ceiling level across the party wall width P5 Roof insulation at rafter level The length of the rafter at the party wall gable end is measured

Thermal Bridging and Air Permeability There is a close correlation between the air permeability of a building and thermal bridging, and often attention to the details in junction design means that a lower air permeability target can be set. In the example in Table 2 below, the actual y values vary considerably on their own, and their overall impact on the DER ( Dwelling Emission Rate) may be quite small, it depends on the building. However the impact of lower air permeability figures on the overall DER can and do have a much bigger influence, therefore by paying greater attention to reducing the thermal bridges combined with lower y values, means that lower air permeability figures may be used, without risk of a failed air test. An air permeability test is used to determine the unwanted heat losses through the building fabric, usually this is very adept at showing up easy to repair unwanted leaks, around service pipes and skirting boards for example, however, as the building is already constructed when this is done, it will also show up much more expensive and difficult to repair leaks in the building fabric if these have not been correctly designed and built. DER TER AIR
PERMEABILITY Y VALUE
16.98 14.75 10 0.161* 14.15 14.75 5 0.064^ Table 2 – Example of how air permeability and y value are linked to the DER result. The above y values have been calculated using the default Ψ values* with the Building Regulations minimum of 10 for air permeability to achieve a DER of 16.98, in this case a fail. However, when calculated using ACD Ψ values ^ with the much lower air permeability of 5, this will achieve a DER of 14.15, a pass.

Case Studies Below are two case study buildings, recently assessed in SAP 2009, showing the differences on the overall result by using the various ACD scheme Ψ values compared to the default values. Case Study 1 - Detached House
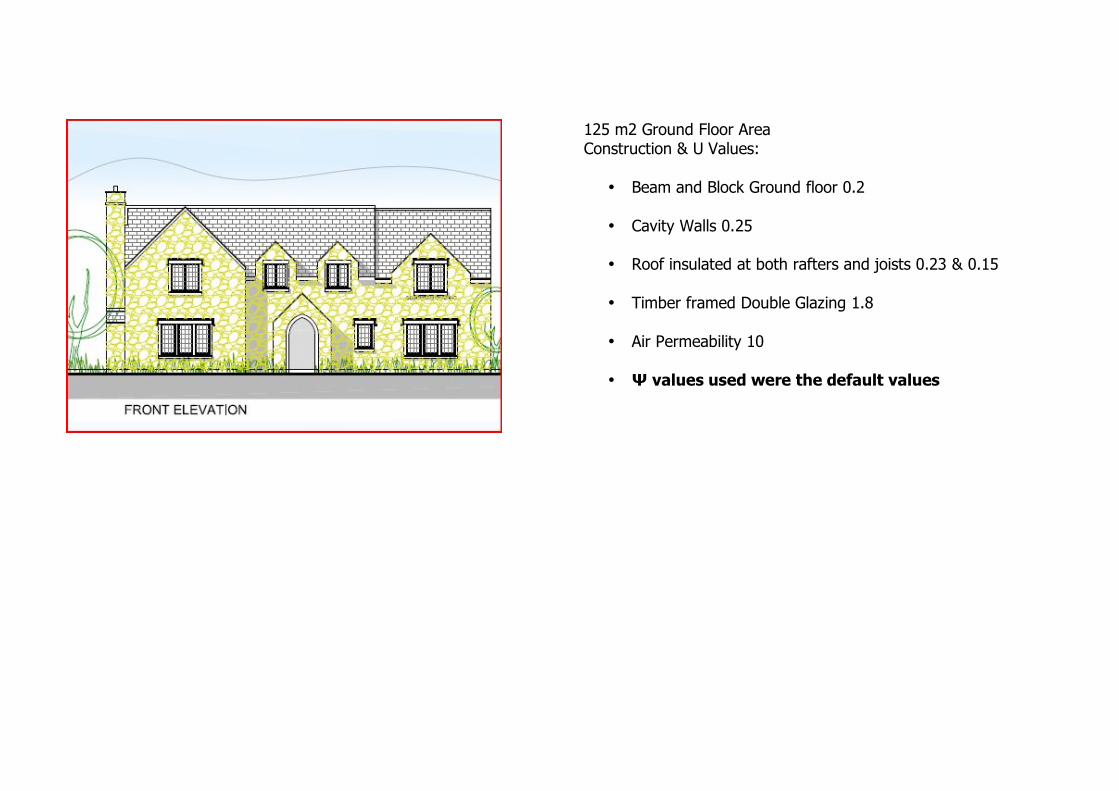
125 m2 Ground Floor Area Construction & U Values:
• Beam and Block Ground floor 0.2 • Cavity Walls 0.25 • Roof insulated at both rafters and joists 0.23 & 0.15 • Timber framed Double Glazing 1.8 • Air Permeability 10 • Ψ values used were the default values
Junction Length (M)
Default Ψ
ACD Ψ ECD Ψ Scot ACDΨ
AECB Silv Ψ
AECB Gold Ψ
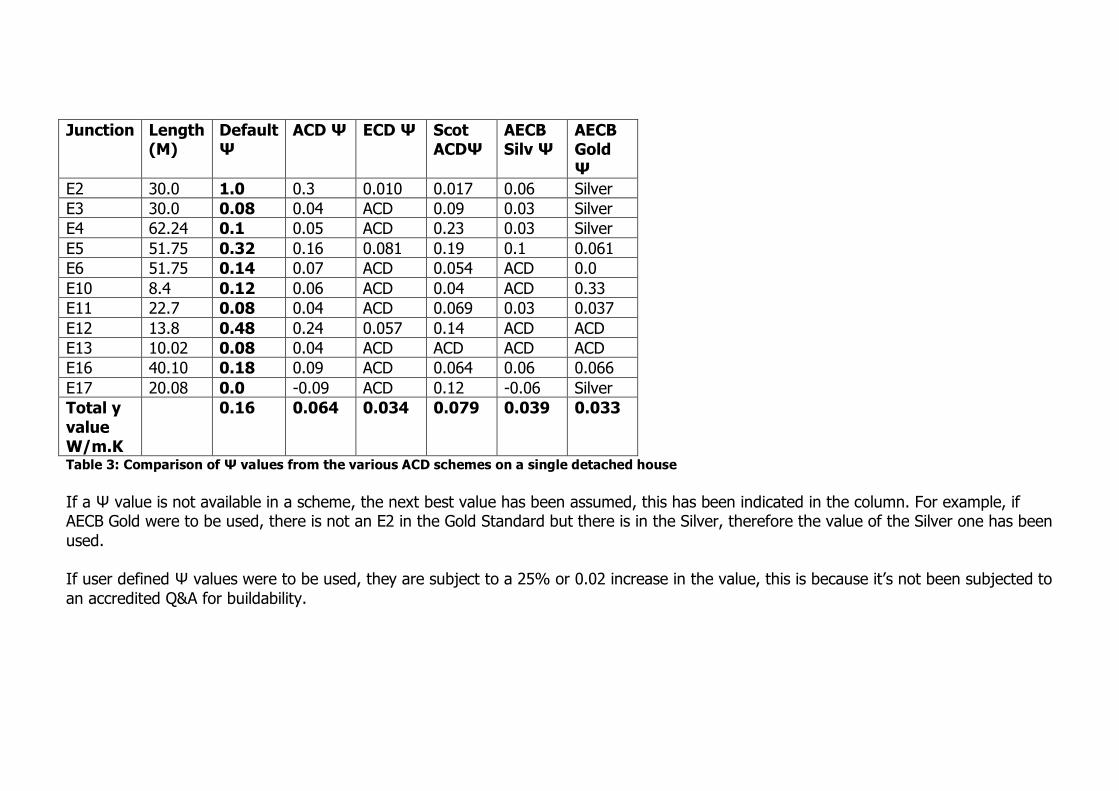
E2 30.0 1.0 0.3 0.010 0.017 0.06 Silver E3 30.0 0.08 0.04 ACD 0.09 0.03 Silver E4 62.24 0.1 0.05 ACD 0.23 0.03 Silver E5 51.75 0.32 0.16 0.081 0.19 0.1 0.061 E6 51.75 0.14 0.07 ACD 0.054 ACD 0.0 E10 8.4 0.12 0.06 ACD 0.04 ACD 0.33 E11 22.7 0.08 0.04 ACD 0.069 0.03 0.037 E12 13.8 0.48 0.24 0.057 0.14 ACD ACD E13 10.02 0.08 0.04 ACD ACD ACD ACD E16 40.10 0.18 0.09 ACD 0.064 0.06 0.066 E17 20.08 0.0 -0.09 ACD 0.12 -0.06 Silver Total y value W/m.K
0.16 0.064 0.034 0.079 0.039 0.033
Table 3: Comparison of Ψ values from the various ACD schemes on a single detached house If a Ψ value is not available in a scheme, the next best value has been assumed, this has been indicated in the column. For example, if AECB Gold were to be used, there is not an E2 in the Gold Standard but there is in the Silver, therefore the value of the Silver one has been used. If user defined Ψ values were to be used, they are subject to a 25% or 0.02 increase in the value, this is because it’s not been subjected to an accredited Q&A for buildability.

Default
Ψ ACD Ψ ECD Ψ Scot
ACDΨ AECB Silv Ψ
AECB Gold Ψ
DER 4.72 4.40 4.30 4.45 4.32 4.30 TER 14.75 14.75 14.75 14.75 14.75 14.75 FEES 68.12 59.90 57.22 61.17 57.66 57.13 Table 4: Comparison of overall results on a single detached house DER = Dwelling Emission Rate TER = Target Emission Rate FEES = Fabric Energy Efficiency Standard As can be seen from the above table, the DER, which must be lower than the TER to gain an overall pass, varies by 0.42 from the lowest to the highest depending on which ACD scheme is used compared to the default values. This particular dwelling had a biomass boiler with wood pellets delivered in bulk, which is why the DER is so much lower than the TER. Should this dwelling have had a gas boiler, it would have failed with a DER of 16.85 and the thermal performance would need to have been significantly improved.

Case Study 2 End Terrace House
Ground Floor First Floor

33 m2 Ground floor Area Construction & U Values:
• Beam and Block Ground floor 0.15 • Cavity Walls 0.2 • Party Wall 0.0 • Roof insulated at rafters 0.15 • Timber framed Double Glazing 1.4 • Air Permeability 4 • Ψ value used were the ACD values
Front Elevation

Junction Length (M)
Default Ψ
ACD Ψ
ECD Ψ Scot ACDΨ
AECB Silv Ψ
AECB Gold Ψ
E1 1.2 1.0 0.5 0.07 ACD 0.06 Silver E2 8.4 1.0 0.3 ACD 0.13 0.06 Silver E3 9.6 0.08 0.04 ACD 0.02 0.03 Silver E4 27.8 0.1 0.05 ACD 0.222 0.03 Silver E5 16.57 0.32 0.16 0.067 0.067 0.1 0.061 E6 16.57 0.14 0.07 ACD 0.077 ACD 0.0 E11 10.12 0.08 0.04 ACD 0.034 0.03 0.037 E13 6.45 0.08 0.04 ACD ACD ACD ACD E16 12.52 0.18 0.09 ACD 0.064 0.06 0.066 E18 12.52 0.12 0.06 ACD ACD 0.08 Silver P1 6.45 0.16 0.08 ACD 0.051 ACD ACD P2 6.45 0.04 0.00 ACD 0.013 ACD ACD P5 6.45 0.04 0.02 ACD 0.224 ACD ACD Total y value W/m.K
0.162 0.070 0.058 0.086 0.044 0.034
Table 5: Comparison of Ψ values from the various ACD schemes on a single end terraced house If a Ψ value is not available in a scheme, the next best value has been assumed, this has been indicated in the column. For example, if AECB Gold were to be used, there is not an E2 in the Gold Standard but there is in the Silver, therefore the value of the Silver one has been used. If user defined Ψ values were to be used, they are subject to a 25% or 0.02 increase in the value, this is because it’s not been subjected to an accredited Q&A for buildability.

Default Ψ
ACD Ψ ECD Ψ Scot ACDΨ
AECB Silv Ψ
AECB Gold Ψ
DER 25.11 22.49 22.13 22.93 21.72 21.43 TER 22.62 22.62 22.62 22.62 22.62 22.62 FEES 76.02 63.46 61.77 65.57 59.82 58.44 Table 6: Comparison of overall results on a single end terraced house DER = Dwelling Emission Rate TER = Target Emission Rate FEES = Fabric Energy Efficiency Standard
Dwelling Emission Rate (DER) is the actual kg CO2/m2/year for the building. The Target Emission Rate (TER) is the kg CO2/m2/year for a building of the same size and dimensions of the actual building that complies with all the requirements of L1A. Fabric Energy Efficiency Standard (FEES) is not currently part of L1A, however, there are plans to use as a measure of the thermal efficiency of the building at some point in the future. It is a measure in kWh/m2/year for a combination of U Values, Thermal Bridging, Air Permeability, Thermal Mass and Solar Gains. Maximum figures to achieve are:
• 39 kWh/m2/yr are for Mid-terraced Houses/Flats/Maisonettes • 46 kWh/m2/yr for End-terraced, Semi detached/Detached Houses.

Table of Thermal Bridging Values for SAP calculations (Separate excel spreadsheet) How to use the spreadsheet: If no Accredited Details or similar are to be used, then the Default value will be applied to the Thermal Bridging calculation. However, if an alternative PSI (Ψ) value is required the various Schemes listed in the spreadsheet offer alternative proven solutions for some of the junctions with an external wall or party wall. As far as possible each schemes PSI (Ψ) value is listed on the same line as the most comparable in each scheme to gain a comparison for like for like. Example: E5 Ground floor, if not using the default value and the wall is a masonry wall construction; there are a number of choices within each of the different schemes. The values will indicate how they compare to one another, the actual construction details can be found by using the reference numbers and looking them up with the appropriate scheme. NOTES: Junction References used in the table: ACD MCI = Masonry cavity walls MII = Masonry Internal insulation MEI = Masonry External Insulation TFW = Timber Framed Wall STW = Steel Framed Wall ECD MV = Masonry Construction TF = Timber Framed Construction
SF = Steel Framed Construction SACD 1 = Masonry Construction full fill cavity 2 = Masonry Construction Partial fill cavity 3 = Timber Framed Construction 4 = Steel Framed Construction AECB MW = Masonry Wall TW = Timber Wall
Other Junctions: these will not currently be assessed in SAP, however they are listed here for the designer should they be required.
Sources: * Source: The Governments Standard Assessment, Procedure for Energy Rating of Dwellings: 2009 Edition, incorporating RDSAP 2009, BRE ** Source: Energy Saving Trust Enhanced Construction Details Matrix *** Source: Accredited Construction Details (Scotland) October 2010 v1.2 W/mK*> The AECB Carbonlite Silver Standard V 1.0.0 W/mK*< The AECB Carbonlite Passivhaus/Gold Standard V 1.0.0

Copyright – Energy Saving Experts Ltd July 2011
Energy Saving Experts All Part L Calculations
• SAP • SBEM • Extensions • Renovations • Change of Use • Thermal Bridging • U Values
Condensation Risk Analysis Part G Water Calculations Renewable Feasibility Studies Code for Sustainable Homes Assessments Passivhaus Calculations For full details go to www.energy-saving-experts.com