Embed Size (px)
Citation preview

Third Quarter 2021 OverviewOctober 28, 2021
3Q’21 OVERVIEW 2
Participants
Jim Loree CEO
Don Allan President & CFO
Lee McChesneyVP, Corporate Finance &
CFO, Tools & Storage
Dennis Lange VP, Investor Relations

3Q’21 OVERVIEW 3
Cautionary Statements
Certain Statements Contained In This Presentation Are Forward Looking. These Are Based On
Assumptions Of Future Events Which May Not Prove To Be Accurate. They Involve Risk And
Uncertainty. Actual Results May Differ Materially From Those Expected Or Implied. We Direct You
To The Cautionary Statements Detailed In The Corresponding Press Release And Form 8-K And Our
Recent ‘34 Act SEC Filings.

3Q’21 OVERVIEW 4
3Q 2021 Key Messages
*Non-GAAP Financial Measures. See Appendix For Reconciliation of GAAP To Non-GAAP Measures Used in This Presentation.
• Prioritized Meeting Demand In A Difficult Environment To Deliver Record $4.3 Billion In Revenue (+11% VPY | + 10% Organic Growth*)
• Investing In Innovation, Manufacturing Automation, Inventory & Our Supply Chain To Meet Strong Demand & Fuel Sustainable Growth
• Actively Addressing A Dynamic Supply Chain & Are Implementing Price & Productivity Actions To Offset Inflation
• We Are Confident In Our Multi-Year Growth & Margin Expansion Story Supported By Secular & Company Specific Catalysts
$4.3BTotal Revenue
10%Organic Growth*
32.8%Gross Margin %*
12.2%Operating Margin %*
$2.77Adjusted Diluted EPS*
Key Financials
Record 3Q Revenue Driven By Robust Customer Demand Resulting In 10% Organic Growth*

3Q’21 OVERVIEW 5
Growth In Outdoor
…Creating Significant ESG, Growth & Margin Opportunities
Announced Two Major Complementary Acquisitions During The Third Quarter…
~$4 Billion Lawn & Garden Platform* With Broad Coverage Across $25B+ Outdoor Category
2021 Estimated Revenue ~$2.5B+
2021 Estimated Revenue ~$0.4B 2021 Estimated Revenue ~$0.9B
Fastest Growing Franchise In Cordless/Electric Outdoor Power Equipment
MTD & Excel Acquisitions Provide Compelling Capacity Expansion & Multi-Year Runway For Growth
Electrification & Autonomous
Lead Large Format Gas & Electric Expansion
1Win With The Professional
Apply Innovation Leadership & Dealer Network To Expand Into
Higher-End Pro Categories
2Optimize Brand & Channel
Strong Position In Retail & Expansion In Pro Dealer Network
3Parts & Service
Further Penetrate ~$4B Global Lawn & Garden Parts &
Accessories Category
4
* Post Closing & Pending Required Regulatory Approvals for MTD and Excel Transactions

3Q’21 OVERVIEW
~$200M Of New SG&A Investments In 2H’21 Run Rate Cost Base
6
Tools: Fueling Organic Growth
PeopleInnovation Speed To Market
Power Tools200+ New Products Across Pro &
Industrial Categories
300+ New Products Supporting Tradespeople & DIY
Hand Tools500+ New Products
We Added ~1,300 New Hires Across Power Tools & Hand Tools To Support R&D And
Commercialization Efforts
New Product Cycle Time Reduction
1Streamlined Development Process
2 Increased Testing Capacity
3 Expanded Global Footprint & Design Centers
Additional Manufacturing Capacity
1M+ Ft.2 New North America Manufacturing Space
Additional Distribution & Third-Party Partnerships
Compact 20V Core High Power
Cutting
Mech Tools
Storage
MeasuringFastening Drilling
Engineers
Product Managers
Brand, Industrial Design & Insights
Sales & Commercial

3Q’21 OVERVIEW 7
DEWALT POWERSTACK™ … The Next Dimension In Power
…Shipping In 4Q21 With Hundreds Of Millions Of Annual Growth Potential
DEWALT’s Latest Breakthrough Delivering The Lightest And Most Powerful Compact Battery...
† Vs. DCB203 Battery; No In Application** Footprint Vs. DCB203 Battery*** Vs. Model DCB203
The Technology Leader In Professional Power Tools

3Q’21 OVERVIEW 8
Black + Decker reviva™
Collaborating With Eastman To Deliver The World’s First Power Tool Made From Recycled Material...
…One Example Why Black + Decker Is A Major Growth Catalyst Beginning In 2022
Fully Sustainable, Frustration-Free Packaging
Our Products are as Strong as Our Commitment to the Environment
9*
*Equivalent Weight**Recycled Material Is Certified Through Third-Party Mass Balance Allocation Process
Housing Manufactured From 50% Certified Recycled Material**
10M

3Q’21 OVERVIEW 9
Positioning Supply Chain For Growth
…And Set The Business Up For Significant Volume Growth In 2022 & Beyond
Investing In Supply Chain Capacity, Efficiency & Resiliency To Serve Our Customers…
Capacity Additions
Hermosillo, MX
Monterrey, MX
Fort Worth, TX
• Adding Capacity In Accordance With Our Make Where We Sell Strategy
• Opening 2 New Power Tool + 1 New Hand Tool North America Based Plants
Strategic Sourcing Factory Automation
Battery Cells
• Investments Made With Key Battery Suppliers To Secure Dedicated Capacity For The Medium Term
• Diversifying Supply Base And Increasing Inventory To Support Continued Strong Demand & Electrification Trends
Electronics & Semi-Conductors
• Qualifying Multiple Module Platforms To Increase Capacity & Supply Flexibility
• Investments With Suppliers To Install Additional Lines & Accelerate Capacity Improvement
• Diversifying Supply Base & Geographic Footprint
Target Capacity Increases Of Key Components To Support Significant Growth In ‘22+
• Flexible Automation Cells With Ability To Seamless Changeover To Manufacture Multiple Different Drills
• Significant ↑ In Labor Efficiency + Meaningful ↑ In Throughput = Key Enabler Of Make Where We Sell
• Multiple Applications Deployed At Charlotte Manufacturing Facility | <1Yr Payback
Leveraging Flexible Automation To Competitively Manufacture In The US
US Cost Of Sales Made In NA
2016 2021 + New Capacity
Approaching 3X Growth

3Q’21 OVERVIEW
$2,804 $3,186
3Q'20 3Q'21
10
3Q’21 Segment Overview
Revenue Profit*
Tools & Storage Industrial Security
• +13% Organic Growth*
• +9% N.A., +20% Europe, +28% EM
• +11% PT, +16% HTAS, +11% OPG
• Robust Demand Across All Markets As Secular Shifts Related To Reconnection With Home & Garden & eCommerce Were Amplified By Industry-Leading Innovation & Professional Demand
• Demand Remains Robust Outpacing 2020 Comps
• +25% Organic Revenues Versus 2019
• +8% Organic Growth*
• +12% N.A.
• Modestly Positive Europe
• N.A.: Strong Backlog Conversion In Commercial Electronic Security And Growth Within Automatic Doors & Healthcare
• Europe: Positive Organically Led By Data-Driven Product Solutions In France
• Transformation Is Driving Topline Momentum:
• Order Rates Grew 14% In 3Q & Record High Quarter-End Executable Backlog
• +1% Organic Growth*
• (1%) Engineered Fastening
• +7% Infrastructure
• Engineered Fastening: Strong General Industrial Growth Was Offset By Market-Driven Aerospace Declines & Lower Automotive OEM Production Resulting From The Global Semiconductor Shortage
• Infrastructure: 16% Organic Growth In Attachment Tools Was Partially Offset By Lower Pipeline Project Activity In Oil & Gas
• Cyclical Growth Opportunity In ‘22 And Beyond Across All End Markets
OM Rate* (580 Bps) | Volume, Price, Productivity And Benefits From Innovation Were More Than Offset By Accelerating Transit Costs, Commodity Inflation & Growth Investments
OM Rate* (440 Bps) | Benefits From Price & Productivity More Than Offset By Commodity Inflation, Growth Investments & Volume Declines In Higher Margin
Automotive & Aerospace Fasteners
OM Rate* (180 Bps) | Price & Volume Gains More Than Offset By Labor Costs, Pandemic-Related Inefficiencies &
Growth Investments
$603 $500
3Q'20 3Q'21
(17%)
+14% 21.5% 15.7%
$587 $594
3Q'20 3Q'21
Revenue Profit*
$72
$47
3Q'20 3Q'21
(35%)
+1% 12.3% 7.9%
$460 $484
3Q'20 3Q'21
Revenue Profit*
$50 $45
3Q'20 3Q'21
(12%)
+5% 11.0% 9.2%
*Non-GAAP Financial Measures. See Appendix For Reconciliation of GAAP To Non-GAAP Measures Used in This Presentation.

3Q’21 OVERVIEW
QTD YTD
Net Income 395$ 414$ 19$ 767$ 1,359$ 592$
Deprec / Amort 145 144 (1) 431 431 -
Working Capital 52 (457) (509) (668) (1,374) (706)
Pre-tax Loss on Sales
of Businesses - - - - 4 4
Other 85 (96) (181) 70 (129) (199)
Operating CF 677 5 (672) 600 291 (309)
CapEx (62) (130) (68) (209) (322) (113)
Free Cash Flow 615$ (125)$ (740)$ 391$ (31)$ (422)$
V$ 3Q'213Q'20 V$3Q'213Q'20
11
3Q 2021 Free Cash Flow*
…Expect Significant 4Q Free Cash Flow Generation In-Line With Normal Seasonality
Prioritizing Inventory To Serve The Robust Demand Environment…
5.7 WCT
(1.3T) VPY
*Non-GAAP Financial Measure

3Q’21 OVERVIEW 12
Cost & Actions Update
…Offsetting Cost Impacts That Accelerated During The Third Quarter
Taking Actions To Set The Business Up For Positive Net Carryover In 2022…
$XMSupply Chain Environment Remains Dynamic…
Key Trends Driving Incremental Pressure
$XXM
$300M
$160M
$290M$130M
$100M
Jul’21 Guide
Oct’21 Guide
~$460M
~$230M ~$690M
FY’22 YoY
~$600-$650M
Commodity Cost-To-Serve
• Inputs Continued To Move Higher During 3Q | Steel, Resins & Purchased Components Were Key Drivers
• Spot Container Prices ↑ ~6-7X | Transit Times ↑ From ~40 Days To ~85 Days Resulting In Higher Costs To Meet Demand
…Necessitating Incremental Pricing & Productivity Actions
• Productivity Actions
• 3Q Price Increases Completed
• Communicated 5% Surcharge In NA Tools & Storage Effective Nov. 8th & Global Price Increases Across The Businesses During 4Q
• 2022 Opportunity Of $100-$150M Margin Resiliency Benefits Incremental To Above Actions
Pricing/Margin Actions Sized To Exceed 2022 Headwinds

3Q’21 OVERVIEW 13
2021 Guidance
…Free Cash Flow To Approximate $1.1 To $1.3 Billion
Expect 16%-17% Organic Growth And EPS Of $10.90-$11.10*, Up 21%-23% Versus Prior Year...
* Excludes Acquisition-Related & Other Charges Noted Above** Assuming Current Input Cost & Demand Environment. Excludes Acquisition-Related & Other Charges
P&L And Other
• Diluted EPS: 2021 GAAP EPS $10.20 - $10.45 | 2021 Adjusted EPS* $10.90 - $11.10
• Cost Structure Considerations: $125M In Net Cost Savings Carryover | Inflation & Cost-To-Serve Headwind ~$690M | FX Tailwind ~$15M
• Other Items: Other, Net: ~$210M | Interest ~$180M | Pretax Acquisition-Related & Other Charges ~$130M
• Shares: ~161.2M | Tax Rate: ~12%
• Free Cash Flow: Expected To Approximate $1.1-1.3 Billion | CapEx ~3%-3.5% Of Sales
Organic Growth & Segments
2021 Updated Outlook Initial View On 2022
Industrial
Organic: Low Single Digit
Margin: Down YoY
Tools & Storage
Organic: Low 20’s
Margin: Down YoY
Security
Organic: High Single Digits
Margin: Down YoY
Total Company Organic Growth 16%-17%
Mid-Single Digit Volume Growth
Positive Price /Cost
MTD & Excel Accretion~$0.50
Below-The-Line (Tax)(~$0.50)
Targeting $1 EPS Accretion In 2022**
~$0.90 - $1.10

3Q’21 OVERVIEW
Summary
Growth + Margin Expansion
R E C O N N E C T I O N W I T H H O M E & G A R D E N
e C O M M E R C E
E L E C T R I F I C A T I O N
H E A L T H & S A F E T Y
M A R G I N R E S I L I E N C Y
14
…Performance Driven By Our People & Guided By Our Purpose – For Those Who Make The World
Demand Remains Robust & Our Multi-Year Runway For Growth & Margin Expansion Is Compelling...
Driven By Our Vision & Purpose
To Be A Force For Good
1 Continue Delivering Top Quartile Long-Term Performance
Be Recognized As One Of The World’s Most Innovative Companies2Elevate Our Commitment To Corporate Social Responsibility3

Q&ATHANK YOU

APPENDIX

3Q’21 OVERVIEW
Canada 3Q’21 YTD
Organic 6% 23%
% SWK 5% 5%
17
Global Presence
US 3Q’21 YTD
Organic 8% 19%
% SWK 59% 58%
Emg. Mkt 3Q’21 YTD
Organic 24% 45%
% SWK 13% 12%
Europe 3Q’21 YTD
Organic 10% 26%
% SWK 19% 20%
Japan 3Q’21 YTD
Organic 29% 32%
% SWK 2% 3%
Australia 3Q’21 YTD
Organic (13%) 12%
% SWK 2% 2%
3Q’21 OVERVIEW 18
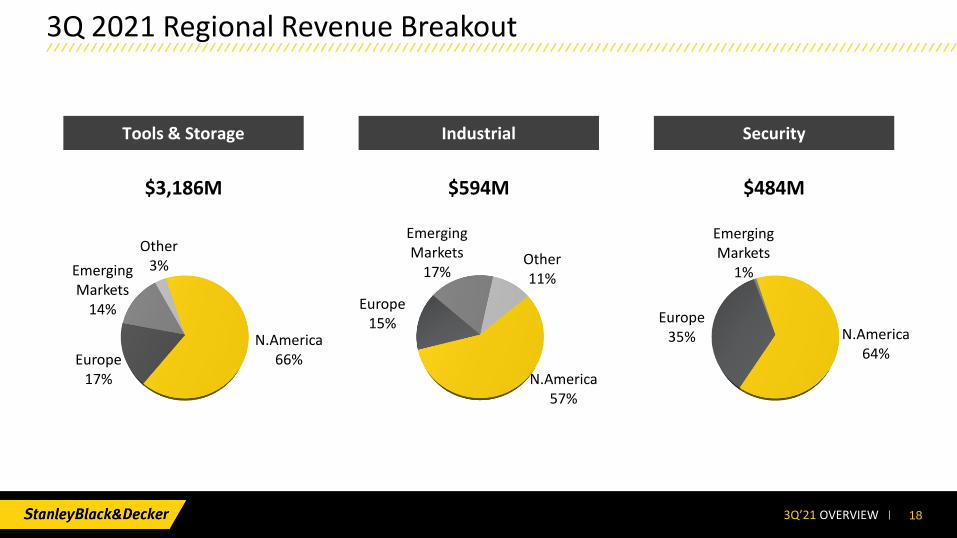
3Q 2021 Regional Revenue Breakout
$594M
N.America66%Europe
17%
Emerging Markets
14%
Other3%
$3,186M
Tools & Storage
$484M
Industrial Security
N.America64%
Europe35%
Emerging Markets
1%
N.America57%
Europe15%
Emerging Markets
17%Other11%

3Q’21 OVERVIEW 19
Reconciliation Of GAAP To Non-GAAP Measures
$1,376.335.7%
GAAPGross Profit
$7.0
Acquisition-Related Charges & Other
$1,383.335.9%
Non-GAAP Gross Profit
Q3 2020
$637.416.6%
GAAPOperating Profit
$43.0
Acquisition-Related Charges & Other
$680.417.7%
Non-GAAP Operating Profit
$2.44
GAAPDiluted EPS
$0.45
Acquisition-Related Charges & Other
$2.89
Non-GAAP Diluted EPS
$1,391.532.6%
GAAPGross Profit
$5.0
Acquisition-Related Charges & Other
$1,396.532.8%
Non-GAAP Gross Profit
Q3 2021
$492.711.6%
GAAPOperating Profit
$28.8
Acquisition-Related Charges & Other
$521.512.2%
Non-GAAP Operating Profit
$2.56
GAAPDiluted EPS
$0.21
Acquisition-Related Charges & Other
$2.77
Non-GAAP Diluted EPS

3Q’21 OVERVIEW 20
Reconciliation Of GAAP To Non-GAAP Segment Profit
$597.121.3%
GAAPSegment Profit
$5.6
Acquisition-Related Charges & Other
$602.721.5%
Non-GAAP Segment Profit
Q3 2020
$63.810.9%
GAAPSegment Profit
$8.4
Acquisition-Related Charges & Other
$72.212.3%
Non-GAAP Segment Profit
$39.38.6%
GAAPSegment Profit
$11.1
Acquisition-Related Charges & Other
$50.411.0%
Non-GAAP Segment Profit
$485.815.2%
GAAPSegment Profit
$14.2
Acquisition-Related Charges & Other
$500.015.7%
Non-GAAP Segment Profit
Q3 2021
$43.87.4%
GAAPSegment Profit
$3.2
Acquisition-Related Charges & Other
$47.07.9%
Non-GAAP Segment Profit
$39.68.2%
GAAPSegment Profit
$5.0
Acquisition-Related Charges & Other
$44.69.2%
Non-GAAP Segment Profit
Too
ls &
Sto
rage
Ind
ust
rial
Secu
rity

3Q’21 OVERVIEW 21
Reconciliation Of GAAP To Non-GAAP Sales Growth
14%
GAAPSales Growth
0%
Acquisitions
0%
Divestitures
1%
GAAPSales Growth
0%
Acquisitions
1%
Divestitures
5%
GAAPSales Growth
1%
Acquisitions
5%
Divestitures
1%
Currency
13%
Non-GAAP Organic Sales Growth
1%
Currency
1%
Non-GAAP Organic Sales Growth
1%
Currency
8%
Non-GAAP Organic Sales Growth
Too
ls &
St
ora
geIn
du
stri
alSe
curi
ty
11%
GAAP Sales Growth
0%
Acquisitions
0%
Divestitures
1%
Currency
10%
Non-GAAP Organic Sales Growth
Stan
ley
Bla
ck
& D
eck
er

3Q’21 OVERVIEW 22
Organic sales growth is defined as the difference between total current and prior year sales less the impact of companies acquired and divested in the past twelve months and any foreign currency impacts divided by prior year sales. Operating profit is defined as sales less cost of sales and selling, general and administrative expenses. Management uses operating profit and its percentage of net sales as key measures to assess the performance of the Company as a whole, as well as the related measures at the segment level. Free cash flow is defined as cash flow from operations less capital and software expenditures. Management considers free cash flow an important indicator of its liquidity, as well as its ability to fund future growth and to provide a return to the shareowners and is useful information for investors. Free cash flow does not include deductions for mandatory debt service, other borrowing activity, discretionary dividends on the Company’s common and preferred stock and business acquisitions, among other items. Free cash flow conversion is defined as free cash flow divided by net income. The Non-GAAP statement of operations and business segment information, as reconciled to GAAP on pages 12 through 15 of the press release, is considered relevant to aid analysis of the Company’s profit and earnings results aside from the material impact of the acquisition-related and other charges.
Non-GAAP Financial Measures