Embed Size (px)
Citation preview

Third Quarter 2021 Review
November 11, 2021

2
Regarding Forward-Looking StatementsStatements contained in this presentation and certain other written or oral statements made from time to time by Statements contained in this presentation and certain other written or oral statements made from timeto time by Flowers Foods, Inc. (the “company”, “Flowers Foods”, “Flowers”, “us”, “we”, or “our”) and its representatives that are not historical facts are forward-looking statements as defined in the PrivateSecurities Litigation Reform Act of 1995. Forward-looking statements relate to current expectations regarding our future financial condition and results of operations and the ultimate impact of the novel strain ofcoronavirus (“COVID-19”) on our business, results of operations and financial condition and are often identified by the use of words and phrases such as “anticipate,” “believe,” “continue,” “could,” “estimate,”“expect,” “intend,” “may,” “plan,” “predict,” “project,” “should,” “will,” “would,” “is likely to,” “is expected to” or “will continue,” or the negative of these terms or other comparable terminology. These forward-looking statements are based upon assumptions we believe are reasonable. Forward-looking statements are based on current information and are subject to risks and uncertainties that could cause our actual resultsto differ materially from those projected. Certain factors that may cause actual results, performance, liquidity, and achievements to differ materially from those projected are discussed in this Annual Report onForm 10-K (the “Form 10-K”) and may include, but are not limited to, (a) unexpected changes in any of the following: (1) general economic and business conditions; (2) the competitive setting in which weoperate, including advertising or promotional strategies by us or our competitors, as well as changes in consumer demand; (3) interest rates and other terms available to us on our borrowings; (4) energy and rawmaterials costs and availability and hedging counter-party risks; (5) relationships with or increased costs related to our employees and third-party service providers; (6) laws and regulations (includingenvironmental and health-related issues); and (7) accounting standards or tax rates in the markets in which we operate, (b) the ultimate impact of the COVID-19 outbreak and measures taken in response thereto,including additional variants of the virus, the efficacy and distribution of vaccines, and the impact of federal vaccine mandates on our business, workforce, results of operations and financial condition, which arehighly uncertain and are difficult to predict, (c) our ability to manage the demand, supply and operational challenges with the actual or perceived effects of the COVID-19 pandemic; (d) the loss or financialinstability of any significant customer(s), including as a result of product recalls or safety concerns related to our products, (e) changes in consumer behavior, trends and preferences, including health and wholegrain trends, and the movement toward more inexpensive store branded products, (f) the level of success we achieve in developing and introducing new products and entering new markets, (g) our ability toimplement new technology and customer requirements as required, (h) our ability to operate existing, and any new, manufacturing lines according to schedule, (i) our ability to implement and achieve ourenvironmental, social, and governance (“ESG”) goals in accordance with suppliers, regulations, and customers; (j) our ability to execute our business strategies which may involve, among other things, (1) theintegration of acquisitions or the acquisition or disposition of assets at presently targeted values, (2) the deployment of new systems and technology, and (3) an enhanced organizational structure, (k) consolidationwithin the baking industry and related industries, (l) changes in pricing, customer and consumer reaction to pricing actions (including decreased volumes), and the pricing environment among competitors withinthe industry, (m) disruptions in our direct-store-delivery distribution model, including litigation or an adverse ruling by a court or regulatory or governmental body, or other regulatory developments, that couldaffect the independent contractor classifications of the independent distributor partners, (n) increasing legal complexity and legal proceedings that we are or may become subject to, (o) labor shortages and turnoveror increases in employee and employee-related costs, (p) the credit, business, and legal risks associated with independent distributor partners and customers, which operate in the highly competitive retail food andfoodservice industries, (q) any business disruptions due to political instability, pandemics, armed hostilities, incidents of terrorism, natural disasters, labor strikes or work stoppages, technological breakdowns,product contamination, product recalls or safety concerns related to our products, or the responses to or repercussions from any of these or similar events or conditions and our ability to insure against such events,(r) the failure of our information technology systems to perform adequately, including any interruptions, intrusions or security breaches of such systems or risks associated with the planned implementation of anew enterprise resource planning (“ERP”) system; and (s) the potential impact of climate change on the company, including physical and transition risks, higher regulatory and compliance costs, reputational risks,and availability of capital on attractive terms. The foregoing list of important factors does not include all such factors, nor necessarily present them in order of importance. In addition, you should consult otherdisclosures made by the company (such as in our other filings with the Securities and Exchange Commission (“SEC”) or in company press releases) for other factors that may cause actual results to differmaterially from those projected by the company. Refer to Part I, Item 1A., Risk Factors, of the Form 10-K and Part II, Item 1A., Risk Factors of the Form 10-Q for the quarter ended October 9, 2021 for additionalinformation regarding factors that could affect the company’s results of operations, financial condition and liquidity. We caution you not to place undue reliance on forward-looking statements, as they speak onlyas of the date made and are inherently uncertain. The company undertakes no obligation to publicly revise or update such statements, except as required by law. You are advised, however, to consult any furtherpublic disclosures by the company (such as in our filings with the SEC or in company press releases) on related subjects.

Key Messages
3
• Branded retail sales maintaining strength while non-retail sales recovering from pandemic effect
• Investing in innovation and marketing intended to drive future branded retail growth
• Mitigating impact of inflation in 2021 and remain confident we should be able to do so in 2022. Consumer demand relatively inelastic so far in response to pricing initiatives
• Raised 2021 sales and EPS guidance above long-term growth targets1, reflecting stronger year-to-date performance.
(1) Off 2019 base year.

Q3 2021 Financial Highlights
4
$116
$118
$11 0
$11 1
$11 2
$11 3
$11 4
$11 5
$11 6
$11 7
$11 8
$11 9
$12 0
Q3'20 Q3'21
11.5%Margin
11.8%Margin
1.8%
GROWTH
3.9%
GROWTH
COMPONENTS OF Q3’21 SALES CHANGE (MILLIONS) ADJUSTED EBITDA (MILLIONS)1
• Sales increase due to price increases to mitigate inflation, and positive mix shift to branded retail products
• Adjusted EBITDA margins decreased due to higher logistics costs and investments in marketing
(1) Earnings before interest, taxes, depreciation & amortization, adjusted for matters affecting comparability. See non-GAAP reconciliations at the end of this slide presentation.

Q3 2021 Comparison to Pre-Pandemic Results
5
$95$118
$—
$20
$40
$60
$80
$10 0
$12 0
$14 0
Q3'19 Q3'21
11.5%Margin9.8%
Margin
+24.5%
GROWTH
6.3%
GROWTH
COMPONENTS OF Q3’21 SALES GROWTH VS Q3’19 (MILLIONS) ADJUSTED EBITDA VS Q3’19 (MILLIONS)1
• Sales increased due to higher demand for branded retail products caused by the pandemic and internal growth initiatives
• Mix shift to branded retail products drove cost leverage and margin increase
(1) Earnings before interest, taxes, depreciation & amortization, adjusted for matters affecting comparability. See non-GAAP reconciliations at the end of this slide presentation.

NET SALES$1.028B +3.9% v PY• Price/Mix +6.4%; Volume -2.5%
• Continued growth in branded retail, partial recovery of non-retail, and price initiatives to mitigate inflation, offset by ongoing declines in store branded sales
Q3 2021 Financial Review
6
ADJ. EBITDA1
$118.5M +1.8% v PY• 11.5% of sales, down 30 bps
• Higher sales and mix shift to branded retail drove increase; margin decreased due to higher logistics costs, and investments in marketing
CASH FLOWS – YTDDividends$131.5M
Cash from Ops$315.2MCapex$86.7M
GAAP DILUTED EPS$0.18 -$0.03 v PY
ADJ. DILUTED EPS2
$0.30 +$0.01 v PYIncreased EBITDA and reduced interest expense partly offset by higher tax expense
(1) Earnings before interest, taxes, depreciation & amortization (EBITDA), adjusted for matters affecting comparability. See non-GAAP reconciliations at the end of this slide presentation.(2) Earnings per share (EPS), adjusted for matters affecting comparability. See non-GAAP reconciliations at the end of this slide presentation.

Fiscal 2021 Guidance (Provided November 11, 2021)
7
(1) One fewer week expected to contribute 1.8% of overall sales decline.(2) Adjusted for matters affecting comparability. See non-GAAP reconciliations at the end of this presentation.(3) Excluding loss on extinguishment of debt.
Fiscal 2021 Considerations• Persistence of pandemic
and impact on mix
• Promotional environment
• Ability to mitigate inflation
• Demand elasticity
• Appreciation bonuses for frontline workers to impact 4Q’21 EPS by $0.01
• One fewer week in FY21 impacts sales by 1.8% and EPS by ~$0.02 compared to FY20
SALES1 ADJ. EPS2
OTHER
-2.0% to -1.0% $1.22 to $1.26
Depreciation & amortization —$135 to $140 million
Net interest expense3—Approx. $8 million
Effective tax rate —Approx. 24.5%
Diluted shares outstanding —Approx. 213 million
Capital expenditures —$125 to $135 million

8
Flowers’ Market Share
17.0 16.3
18.0 17.4 17.5
17.1 17.7 17.7 18.0
7.0 7.1 7.3 7.6 7.2 7.1 7.3 7.2 7.1
Q 3 2019 Q 4 2019 Q 1 2020 Q 2 2020 Q 3 2020 Q 4 2020 Q 1 2021 Q 2 2021 Q 3 2021
FLO Bread Share FLO Cake Share
Source: Flowers Custom Database – IRi Total US Mulo + C Store

9
Category Review
6.2%
2.7%
21.3%
18.4%
14.4%16.4%
-5.8%
-2.0%
3.6%2.6%
-0.1%
19.3%
14.7%
10.9%
13.4%
-9.6%
-5.1%
-1.9%
Q 3 2019 Q 4 2019 Q 1 2020 Q 2 2020 Q 3 2020 Q 4 2020 Q 1 2021 Q 2 2021 Q 3 2021
Dollar Sales % Chg Unit Sales % Chg
Source: Flowers Custom Database – IRi Total US Mulo + C Store
FLOWERS FRESH PACKAGED BREADS

10
Category Review
-6.0%
-1.7%
1.2%
12.0%
7.6%
4.1%
-0.1%
-2.1%
4.8%
-8.0%
-5.6%
-3.7%
4.7%
0.6%
-1.3%
-4.3%
-6.7%
-1.7%
Q 3 2019 Q 4 2019 Q 1 2020 Q 2 2020 Q 3 2020 Q 4 2020 Q 1 2021 Q 2 2021 Q 3 2021
Dollar Sales % Chg Unit Sales % Chg
Source: Flowers Custom Database – IRi Total US Mulo + C Store
FLOWERS COMMERCIAL CAKE

11
Organics Generating Growth
Source: Flowers Custom Database – IRi Total US Mulo + C Store
$211.2 $240.7 $247.9 $250.0 $270.8 $264.7
$154.5
$267.7
$381.5 $467.9
$593.5 $638.0 42.2
52.7
60.6 65.2
68.7 70.7
(5.0)
5.0
15.0
25.0
35.0
45.0
55.0
65.0
75.0
$-
$100.0
$200.0
$300.0
$400.0
$500.0
$600.0
$700.0
$800.0
$900.0
$1,000.0
FY 2016 FY 2017 FY 2018 FY 2019 FY 2020 L52 W/E Q3 2021
ORGANIC FRESH PACKAGED BREADS XFLO FLOWERS ORGANICS FLOWERS SHARE OF ORGANICS

12
Gluten-free Generating Growth
Source: Flowers Custom Database – IRi Total US Mulo + C Store
$209.6 $221.0 $229.8 $222.3 $229.2 $224.0
$11.9 $17.2
$32.6 $61.1 $93.1 $104.6
5.4 7.2
12.4
21.6
28.9 31.8
(50.0)
(40.0)
(30.0)
(20.0)
(10.0)
-
10.0
20.0
30.0
40.0
$-
$50.0
$100.0
$150.0
$200.0
$250.0
$300.0
$350.0
$400.0
FY 2016 FY 2017 FY 2018 FY 2019 FY 2020 L52 W/E Q3 2021
GLUTEN FREE FRESH PACKAGED BREADS XFLO FLOWERS GLUTEN FREE FLOWERS SHARE OF GLUTEN FREE

13
Branded Products Gaining Share
Source: IRI Custom Database Total US + Convenience
Fresh Packaged Breads Branded vs. Store Brand Share
75.2 75.8 76.2 76.979.7 80.6
24.8 24.2 23.8 23.120.3 19.4
FY 2016 FY 2017 FY2018 FY2019 FY 2020 TTMBranded Store branded
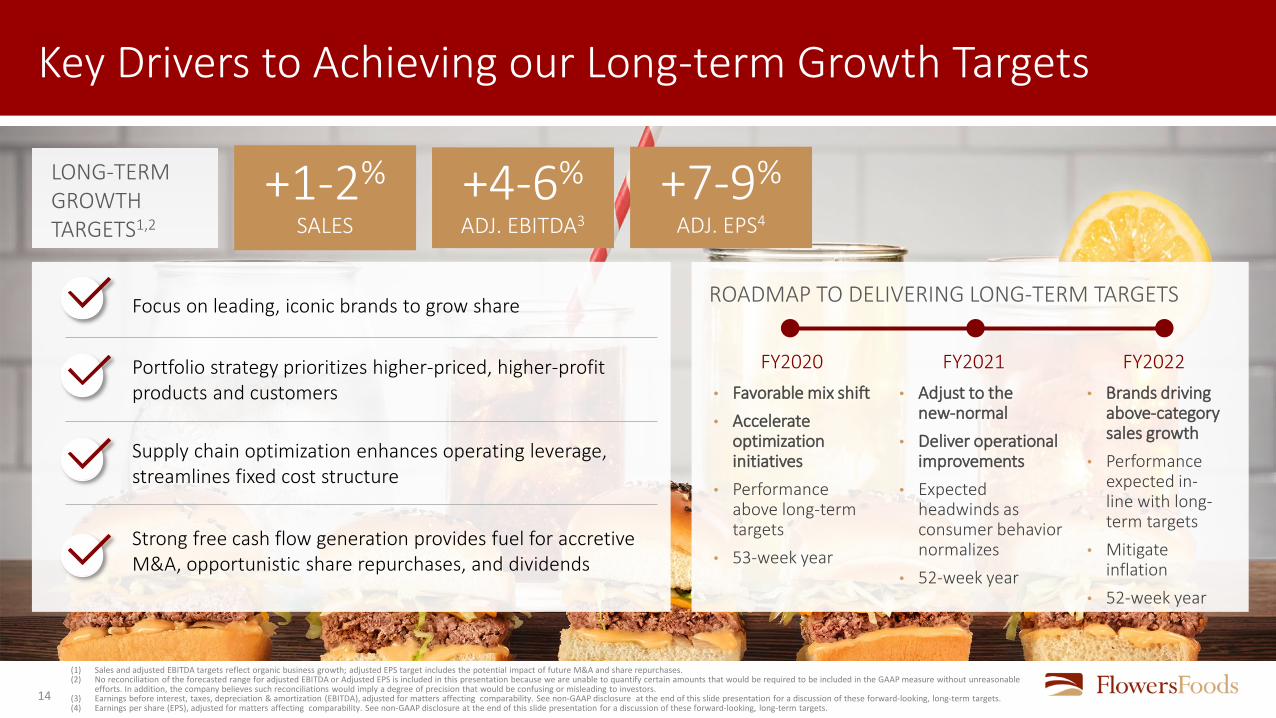
Key Drivers to Achieving our Long-term Growth Targets
14
LONG-TERM GROWTH TARGETS1,2
+1-2%SALES
+4-6%ADJ. EBITDA3
+7-9%ADJ. EPS4
Focus on leading, iconic brands to grow share
Portfolio strategy prioritizes higher-priced, higher-profit products and customers
Supply chain optimization enhances operating leverage, streamlines fixed cost structure
Strong free cash flow generation provides fuel for accretive M&A, opportunistic share repurchases, and dividends
(1) Sales and adjusted EBITDA targets reflect organic business growth; adjusted EPS target includes the potential impact of future M&A and share repurchases.(2) No reconciliation of the forecasted range for adjusted EBITDA or Adjusted EPS is included in this presentation because we are unable to quantify certain amounts that would be required to be included in the GAAP measure without unreasonable
efforts. In addition, the company believes such reconciliations would imply a degree of precision that would be confusing or misleading to investors.(3) Earnings before interest, taxes, depreciation & amortization (EBITDA), adjusted for matters affecting comparability. See non-GAAP disclosure at the end of this slide presentation for a discussion of these forward-looking, long-term targets.(4) Earnings per share (EPS), adjusted for matters affecting comparability. See non-GAAP disclosure at the end of this slide presentation for a discussion of these forward-looking, long-term targets.
FY2020 FY2021 FY2022• Favorable mix shift• Accelerate
optimization initiatives
• Performance above long-term targets
• 53-week year
• Adjust to the new-normal
• Deliver operational improvements
• Expected headwinds as consumer behavior normalizes
• 52-week year
• Brands driving above-category sales growth
• Performance expected in-line with long-term targets
• Mitigate inflation
• 52-week year
ROADMAP TO DELIVERING LONG-TERM TARGETS

Information Regarding Non-GAAP Financial Measures
15
Information Regarding Non-GAAP Financial Measures
The company prepares its consolidated financial statements in accordance with U.S. Generally Accepted Accounting Principles (GAAP). However, from time to time, the company may present in its public statements, press releases and SEC filings, non-GAAP financial measures such as, EBITDA, adjusted EBITDA, EBITDA margin, adjusted EBITDA margin, adjusted net income, adjusted EPS, adjusted income tax expense, adjusted selling, distribution and administrative expenses (SD&A), gross margin excluding depreciation and amortization, free cash flow, and the ratio of net debt to adjusted EBITDA. The reconciliations attached provide reconciliations of the non-GAAP measures used in this presentation or release to the most comparable GAAP financial measure. The company’s definitions of these non-GAAP measures may differ from similarly titled measures used by others. These non-GAAP measures should be considered supplemental to, and not a substitute for, financial information prepared in accordance with GAAP.
The company defines EBITDA as earnings before interest, taxes, depreciation and amortization. Earnings are net income. The company defines free cash flow as operating cash flow minus capital expenditures. The company believes that free cash flow provides investors a better understanding of the company’s liquidity position. The company believes that EBITDA is a useful tool for managing the operations of its business and is an indicator of the company’s ability to incur and service indebtedness and generate free cash flow. EBITDA is used as the primary performance measure in the company’s 2014 Omnibus Equity and Incentive Compensation Plan. Furthermore, pursuant to the terms of our credit facility, EBITDA is used to determine the company’s compliance with certain financial covenants. The company also believes that EBITDA measures are commonly reported and widely used by investors and other interested parties as measures of a company’s operating performance and debt servicing ability because EBITDA measures assist in comparing performance on a consistent basis without regard to depreciation or amortization, which can vary significantly depending upon accounting methods and non-operating factors (such as historical cost). EBITDA is also a widely-accepted financial indicator of a company’s ability to incur and service indebtedness.
EBITDA should not be considered an alternative to (a) income from operations or net income (loss) as a measure of operating performance; (b) cash flows provided by operating, investing and financing activities (as determined in accordance with GAAP) as a measure of the company’s ability to meet its cash needs; or (c) any other indicator of performance or liquidity that has been determined in accordance with GAAP.
The company defines adjusted EBITDA, EBITDA margin, adjusted EBITDA margin, adjusted net income, adjusted diluted EPS, adjusted income tax expense and adjusted SD&A, respectively, excluding the impact of asset impairment charges, Project Centennial consulting costs, business process improvement costs, lease terminations and legal settlements, acquisition-related costs, and pension plan settlements. Adjusted income tax expense also excludes the impact of tax reform. The company believes that these measures, when considered together with its GAAP financial results, provides management and investors with a more complete understanding of its business operating results, including underlying trends, by excluding the effects of certain charges.
The company defines net debt as total debt less cash and cash equivalents. Net debt to EBITDA is used as a measure of financial leverage employed by the company. Gross margin excluding depreciation and amortization is used as a performance measure to provide additional transparent information regarding our results of operations on a consolidated and segment basis. Changes in depreciation and amortization are separately discussed and include depreciation and amortization for materials, supplies, labor and other production costs and operating activities.
Presentation of gross margin includes depreciation and amortization in the materials, supplies, labor and other production costs according to GAAP. Our method of presenting gross margin excludes the depreciation and amortization components, as discussed above.
Reconciliations of the non-GAAP measures used in this script to the most comparable GAAP financial measure are published in the earnings release issued in advance of this earnings call and posted on our website at flowersfoods.com/investors.
Reconciliation of Non-GAAP Financial Measures
16
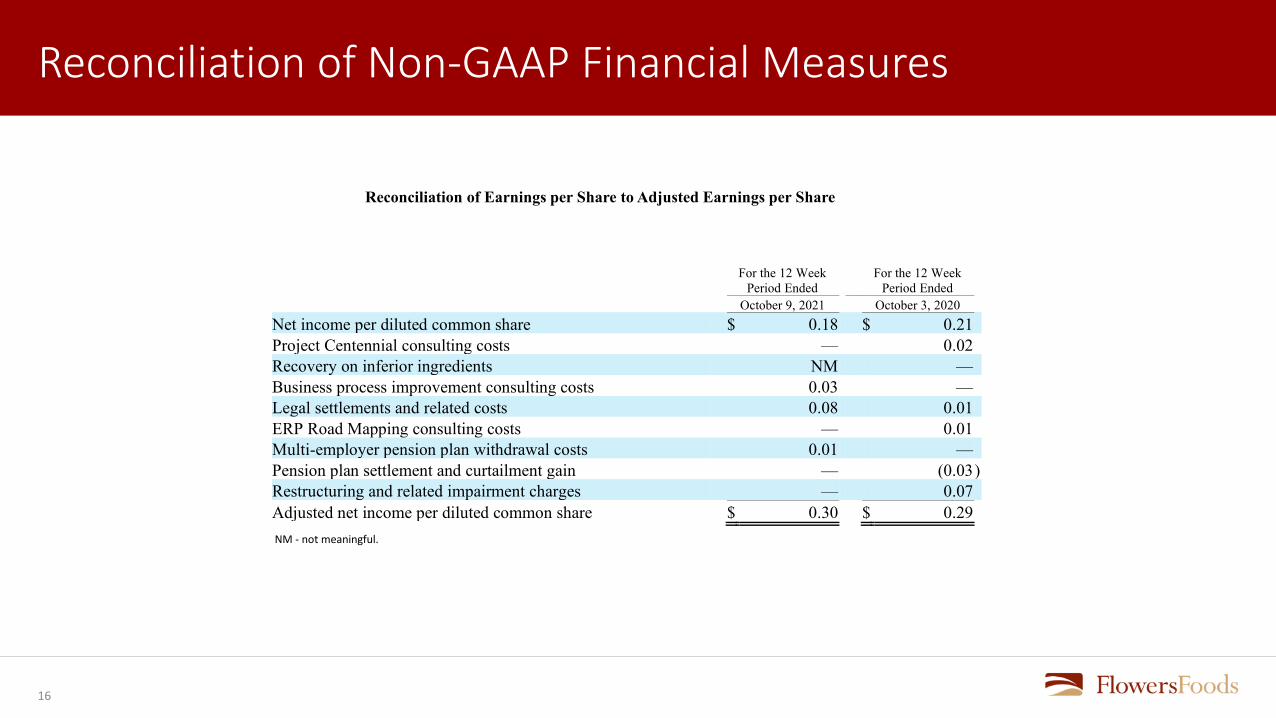
Reconciliation of Earnings per Share to Adjusted Earnings per Share
For the 12 Week
Period Ended For the 12 Week
Period Ended October 9, 2021 October 3, 2020
Net income per diluted common share $ 0.18 $ 0.21 Project Centennial consulting costs — 0.02 Recovery on inferior ingredients NM — Business process improvement consulting costs 0.03 — Legal settlements and related costs 0.08 0.01 ERP Road Mapping consulting costs — 0.01 Multi-employer pension plan withdrawal costs 0.01 — Pension plan settlement and curtailment gain — (0.03 ) Restructuring and related impairment charges — 0.07 Adjusted net income per diluted common share $ 0.30 $ 0.29
NM - not meaningful.

17
Reconciliation of Non-GAAP Financial Measures
Reconciliation of Gross Margin (000s omitted)
For the 12 Week Period Ended
For the 12 Week Period Ended
October 9, 2021 October 3, 2020
1,027,800$ 989,650$
515,078 497,659 Gross Margin excluding depreciation and amortization 512,722 491,991 Less depreciation and amortization for production activities 18,043 17,443 Gross Margin 494,679$ 474,548$
Depreciation and amortization for production activities 18,043$ 17,443$
13,637 14,719Total depreciation and amortization 31,680$ 32,162$
SalesMaterials, supplies, labor and other production costs (exclusive of depreciation and amortization)
Depreciation and amortization for selling, distribution and administrative activities

18
Reconciliation of Non-GAAP Financial Measures
Reconciliation of Selling, Distribution and Administrative Expenses to Adjusted SD&A (000s omitted)
For the 12 Week Period Ended
For the 12 Week Period Ended
October 9, 2021 October 3, 2020
426,575$ 386,739$ Less:Project Centennial consulting costs - 5,068 ERP road mapping consulting costs - 3,079 Legal settlements and related costs 23,089 3,011 Business Process Improvement consulting costs 9,233 -
394,253$ 375,581$
Sales 1,027,800$ 989,650$ Adjusted SD&A as a percent of sales 38.4% 38.0%
Adjusted selling, distribution and administrative expenses
Selling, distribution and administrative expenses
19
Reconciliation of Non-GAAP Financial Measures
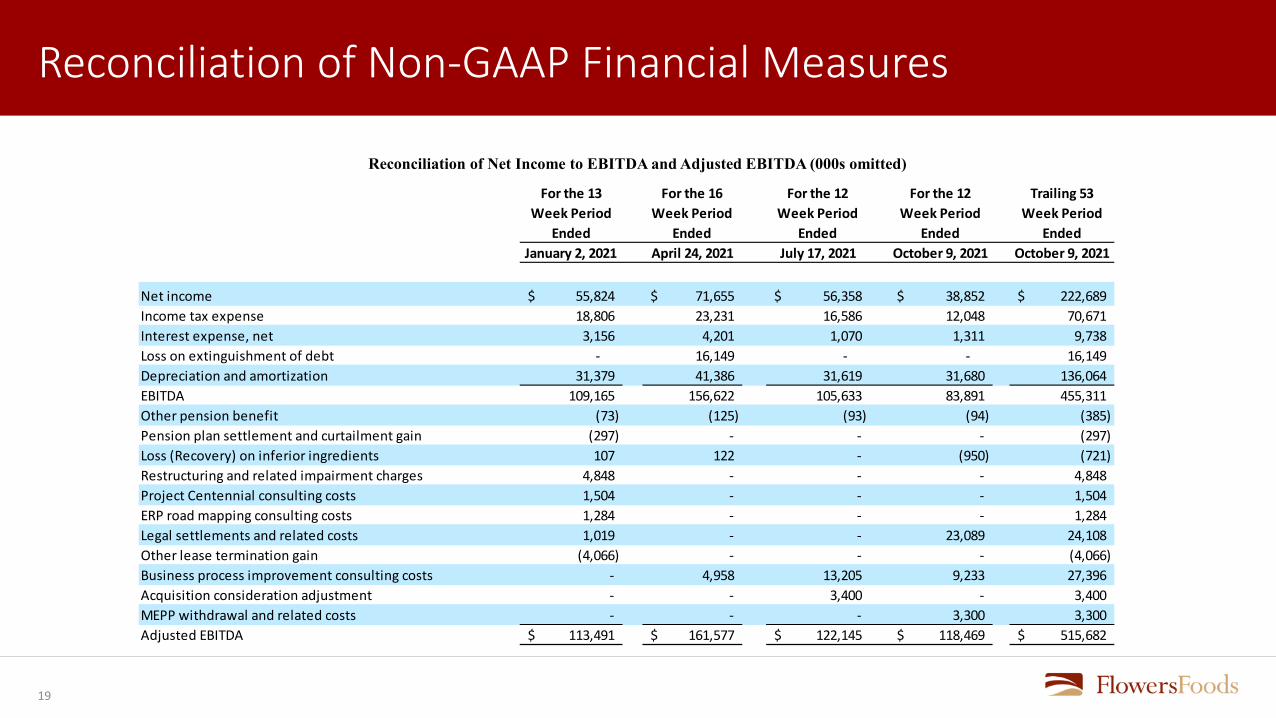
Reconciliation of Net Income to EBITDA and Adjusted EBITDA (000s omitted)
For the 13 Week Period
Ended
For the 16 Week Period
Ended
For the 12 Week Period
Ended
For the 12 Week Period
Ended
Trailing 53 Week Period
EndedJanuary 2, 2021 April 24, 2021 July 17, 2021 October 9, 2021 October 9, 2021
Net income 55,824$ 71,655$ 56,358$ 38,852$ 222,689$ Income tax expense 18,806 23,231 16,586 12,048 70,671 Interest expense, net 3,156 4,201 1,070 1,311 9,738 Loss on extinguishment of debt - 16,149 - - 16,149 Depreciation and amortization 31,379 41,386 31,619 31,680 136,064 EBITDA 109,165 156,622 105,633 83,891 455,311 Other pension benefit (73) (125) (93) (94) (385) Pension plan settlement and curtailment gain (297) - - - (297) Loss (Recovery) on inferior ingredients 107 122 - (950) (721) Restructuring and related impairment charges 4,848 - - - 4,848 Project Centennial consulting costs 1,504 - - - 1,504 ERP road mapping consulting costs 1,284 - - - 1,284 Legal settlements and related costs 1,019 - - 23,089 24,108 Other lease termination gain (4,066) - - - (4,066) Business process improvement consulting costs - 4,958 13,205 9,233 27,396 Acquisition consideration adjustment - - 3,400 - 3,400 MEPP withdrawal and related costs - - - 3,300 3,300 Adjusted EBITDA 113,491$ 161,577$ 122,145$ 118,469$ 515,682$

20
Reconciliation of Non-GAAP Financial Measures
Reconciliation of Income Tax Expense to Adjusted Income Tax Expense (000s omitted)
For the 12 Week Period Ended
For the 12 Week Period Ended
October 9, 2021 October 3, 2020
12,048$ 13,113$
Project Centennial consulting costs - 1,267 ERP road mapping consulting costs - 770 Restructuring and related impairment charges - 5,025
- (1,788) Legal settlements and related costs 5,773 753
2,308 - Recovery on inferior ingredients (238) - MEPP withdrawal and related costs 825 -
20,716$ 19,140$
Tax impact of:
Adjusted income tax expense
Income tax expense
Business process improvement consulting costs
Pension plan settlement and curtailment gain

21
Reconciliation of Non-GAAP Financial Measures
Reconciliation of Net Income to Adjusted Net Income (000s omitted)
For the 12 Week Period Ended
For the 12 Week Period Ended
October 9, 2021 October 3, 2020
38,852$ 44,347$ Project Centennial consulting costs - 3,801 ERP road mapping consulting costs - 2,309 Restructuring and related impairment charges - 15,075 Pension plan settlement and curtailment gain - (5,365) Legal settlements and related costs 17,316 2,258 Business process improvement consulting costs 6,925 - Recovery on inferior ingredients (712) - MEPP withdrawal and related costs 2,475 -
64,856$ 62,425$ Adjusted net income
Net Income

22
Reconciliation of Non-GAAP Financial Measures
Reconciliation of Debt to Net Debt and Calculation of Net Debt to Trailing Twelve Month Adjusted EBITDA Ratio (000s omitted)
As ofOctober 9, 2021
Current maturities of long-term debt -$ Long-term debt 890,180 Total debt 890,180 Less: Cash and cash equivalents 307,523 Net Debt 582,657$
Adjusted EBITDA for the Trailing Twelve Months Ended October 9, 2021 515,682$ Ratio of Net Debt to Trailing Twelve Month Adjusted EBITDA 1.1

23
Reconciliation of Non-GAAP Financial Measures
Reconciliation of Earnings per Share - Full Year Fiscal 2021 Guidance Range Estimate
NM - not meaningful.
Certain amounts may not add due to rounding.
Net income per diluted common share 0.96$ to 1.00$ Business process improvement consulting costs 0.10 0.10 Recovery on inferior ingredients NM NMMulti-employer pension plan withdrawal costs 0.01 0.01 Legal settlements and related costs 0.08 0.08 Acquisition consideration adjustment 0.01 0.01 Loss on extinguishment of debt 0.06 0.06 Adjusted net income per diluted common share 1.22$ to 1.26$

24
Reconciliation of Non-GAAP Financial Measures
Reconciliation of Net Income to EBITDA and Adjusted EBITDA (000s omitted)For the 12
Week Period Ended
For the 12 Week Period
EndedOctober 3, 2020 October 5, 2019
Net income 44,347$ 43,358$ Income tax expense 13,113 12,442 Interest expense, net 2,755 2,334 Depreciation and amortization 32,162 33,196 EBITDA 92,377 91,330 Other pension (benefit) cost (72) 518 Pension plan settlement and curtailment gain (7,153) - Restructuring and related impairment charges 20,100 3,277 Project Centennial consulting costs 5,068 - ERP road mapping consulting costs 3,079 - Legal settlements 3,011 - Adjusted EBITDA 116,410$ 95,125$
Sales 989,650$ 966,561$ Adjusted EBITDA margin 11.8% 9.8%

25
Reconciliation of Non-GAAP Financial Measures
Reconciliation of Debt to Net Debt and Calculation of Net Debt to Trailing Twelve Month Adjusted EBITDA Ratio (000s omitted)
As ofJuly 17, 2021
Current maturities of long-term debt -$ Long-term debt 889,878 Total debt 889,878 Less: Cash and cash equivalents 292,270 Net Debt 597,608$
Adjusted EBITDA for the Trailing Twelve Months Ended July 17, 2021 513,623$ Ratio of Net Debt to Trailing Twelve Month Adjusted EBITDA 1.2