Embed Size (px)
Citation preview
4
Thunderstorm and Lightning Climatology of Australia
Yuriy Kuleshov National Climate Centre, Bureau of Meteorology, Melbourne
School of Mathematical and Geospatial Sciences, Royal Melbourne Institute of Technology (RMIT) University, Melbourne
Australia
1. Introduction
Thunderstorms are spectacular but hazardous weather phenomena and the associated lightning and wind gusts can be very hazardous to people, buildings, and industry and utility assets. The thunderstorm hazards in Australia are in most respects similar to those in other countries, but some are worthy of special comment. In some instances, the effects of lightning-initiated bushfires are so extreme that they are classified as natural disasters. The wildfires started by lightning are known locally in Australia as bushfires and grass fires, and these can cause extensive damage and loss of life. The ignition is caused by the lightning current in ground flashes, and firing is associated with low moisture contents of (potential) fine fuels such as duff in trees and dense grass, and the occurrence of multiple stroke currents and continuing current. During dry periods, lightning initiated grass fires are a major problem in inland areas, as are lightning initiated bushfires in remote forest areas. Once ignited, grass fires spread quickly, whereas in bushfires, ignition often starts as a small localised fire in or near the crown of the tree, and it may take a few hours for the fire to spread to other trees and to become an uncontrollable wildfire. Given the potential hazards associated with lightning, knowledge about spatial and temporal distributions of thunderstorm and lightning activity is of great importance for developing comprehensive protective measures.
Traditionally, thunderstorm activity is recorded at meteorological sites as a number of thunder-days per year. Thunder-day records are commonly used as proxy information for describing lightning activity. To obtain instrumental records of lightning incidence, many lightning flash counters (LFC) and lightning location systems (LLS) have been installed at meteorological and other sites worldwide. Recently, remotely-sensed lightning data gathered by the National Aeronautics and Space Administration (NASA) satellite-based instruments became available.
In this chapter, a review of thunderstorm and lightning climatology of Australia, with emphasis on spatial distribution and frequency of thunder-days and lightning flash density over the Australian continent, is presented. Geographical distribution of thunderstorm and lightning activity for the Australian continent has been analysed in a number of studies based on long-term records from LFCs and thunder-day records, as well as recently acquired NASA satellite-based lightning data.
www.intechopen.com

Modern Climatology
86
2. Spatial distribution and frequency of thunderstorms and lightning in Australia
Thunderstorm occurrence at a particular location can be expressed in terms of thunder-days, Td, defined as ‘an observational day (any 24-hour period selected as the basis for climatological or hydrological observations) during which thunder is heard at the station. Precipitation need not occur’ (Huschke, 1959). The 24-hour period selected at the Australian Bureau of Meteorology (ABM) for the phenomenon registration is midnight to midnight (local standard time). The requirement that thunder should actually be heard limits the area covered by each observing point, under favourable listening conditions, to a circular area with a radius of some 20 km (WMO, 1953).
Using the Australian thunder-day records, the thunderstorm distribution across the country was analyzed in detail and an updated average annual thunder-day map of Australia (Fig. 1) was prepared at the National Climate Centre, the ABM (Kuleshov et al., 2002). Clearly thunderstorms are most frequent over the northern half of the country, and generally decrease southward, with lowest frequencies in southeast Tasmania. A secondary maximum is also apparent in southeast Queensland and over central and eastern New South Wales, extending into the north-eastern Victorian high country.
Fig. 1. Map of average annual thunder-days for Australia (1990-1999).
www.intechopen.com
Thunderstorm and Lightning Climatology of Australia
87
To understand this distribution, it is important to note that thunderstorm development generally requires three factors:
1. An unstable convective atmosphere, with generally high surface temperatures and a strong vertical lapse rate (i.e., temperature falls rapidly with height), which provides a favourable environment for the strong vertical atmospheric motions that produce thunderstorms.
2. A trigger for this vertical motion, such as low level convergence of airstreams, a frontal system, local differences in heating or orography.
3. High atmospheric moisture levels.
High moisture levels, especially near the coast, affect the tropical north of Australia in the summer half of the year. Lower pressure lies across northern and central Australia, and gives rise to the vertical motion and low level convergence that favour thunderstorm development. The northern half of Australia is thus very favourable for thunderstorms in the warmer months October through March, and especially in the far north, thunderstorms are frequent and often associated with heavy rainfall and intense lightning. In the remainder of the year dry, stable outflow from the subtropical high pressure belt, which normally lies over the continent, inhibits convective showers and storms.
Thunderstorm frequencies generally decrease in the southern parts of the tropics and the adjacent desert areas of central Australia. This is because the air, though often very hot, is generally drier. The exception appears to be over inland western Australia where a wide area experiences over 30 thunder-days a year. However, many of these would be so-called “dry” thunderstorms, with little or no rain, because low-level relative humidity tends to be low and acts to evaporate any falling precipitation.
3. Estimating lightning flash density from thunder-day records
The lightning flash density, defined as the number of flashes of a specific type occurring on or over unit area in unit time, is commonly used to describe lightning activity. The lightning flash densities are denoted as Ng, Nc and Nt for cloud-to-ground (CG, or simply ground), intra-cloud (IC, or simply cloud) and total (TF = CG + IC) flashes, respectively, and expressed as a number of flashes per square kilometre per year (km-2 yr-1).
In the absence of information about lightning activity obtained directly from lightning detectors, the lightning ground flash density, Ng, may be estimated from thunder-days, Td , using an equation of the form Ng = aTdb, in which a and b are empirically derived constants that depend on the meteorological conditions at a given location. The earliest estimates of the equation for Australia were by Mackerras (1978), who derived values of a = 0.01 and b = 1.4. This study was based on results from 26 sites for the period 1965 to 1977 and the ABM thunder-day map based on data from 1954 to 1963. Anderson and Eriksson (1980), based on 120 observations over two years in South Africa, derived values of a = 0.023 and b = 1.3. The corresponding equation has since become known as ‘Eriksson’s Formula’. A subsequent study using 62 stations over a longer period of five years from 1976 to 1980 yielded the values a = 0.04 and b = 1.25 (Anderson et al., 1984). The equation using these two values of the constants is generally known as the ‘CIGRE Formula’. Both the CIGRE and Eriksson’s equations are used in the literature, although they were both derived at the same location. But there are very few systematic studies enabling one to compare their results with those
www.intechopen.com

Modern Climatology
88
from other parts of the world. Recently, using long-term (up to 22 years) LFC registrations and thunder-day observations for 17 Australian localities, Kuleshov and Jayaratne (2004) updated Mackerras’ empirical formula and compared the results with Eriksson’s and CIGRE formulas. It was concluded that the empirical formula, Ng = 0.012 Td1.4 , gives the best estimate of Ng in Australia. However, lightning flash densities derived from such empirical relationships to thunder-day records are less accurate than those derived from direct measurements of Ng.
4. Instruments of lightning registration
In this section, an overview of instrumental methods used for recording lightning activity in Australia is presented. The first instrumental records of lightning activity using LFCs were made in the 1950s (Pierce, 1956); later, several types of LFCs known as CIGRE-500 Hz, CIGRE-10kHz (Barham and Mackerras, 1972; Anderson et al., 1979) and CGR3 (Mackerras, 1985) were developed and have been used widely around the world. LLSs are also used in most developed countries, beginning in America in the 1980s and then worldwide, including two commercial systems in Australia, GPATS (GPATS website, www.gpats.com.au) and Kattron (Kattron website, www.lightning.net.au). The GPATS network provides coverage of the Australian continent while spatial coverage of the Kattron network is limited to selected areas in South-East Australia.
The role of a LFC differs from that of a LLS. The LFC records the occurrence of local
lightning flashes with effective ranges between about 10 and 30 km, whereas the LLS
produces information about lightning strokes occurring within the bounds of its network of
sensors. In such a network, each sensor is optimally separated by no more than 300 to 400
km from neighbouring sensors. The LFC registrations are more accurate than LLSs data for
ranges below 30 km (Kuleshov et al., 2010).
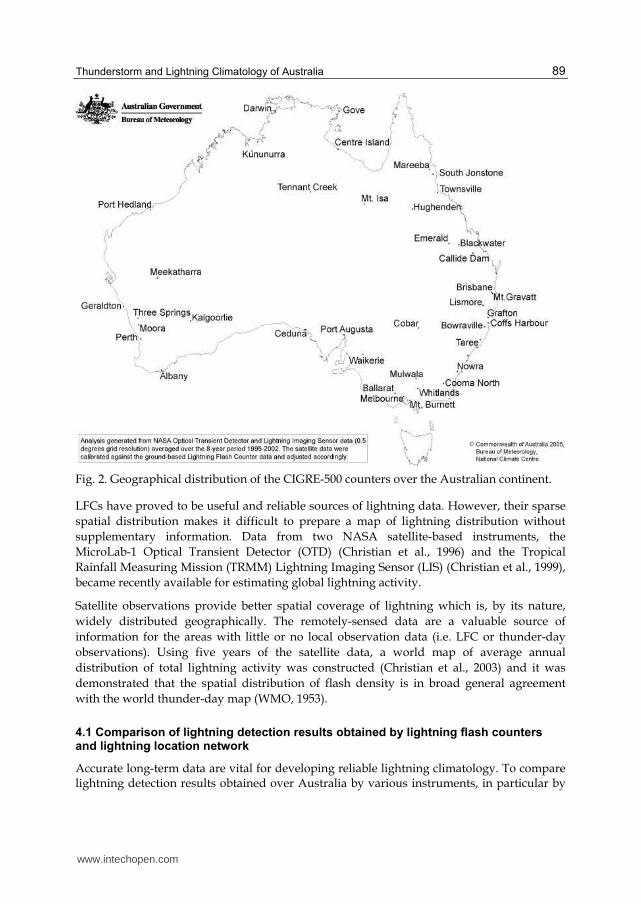
The CIGRE-500 counter is the instrument used by the ABM for its network of LFCs (the LFC site locations are shown in Fig. 2). Another type of counter, primarily developed for research purposes, is the CGR3 (Cloud-to-Ground Ratio #3) instrument (Mackerras, 1985). CGR3 counters were installed in 11 countries and were used for the derivation of total, intra-cloud and ground flash density estimates around the world (Mackerras and Darveniza, 1994; Mackerras et al., 1998). In Australia, these counters have been installed in Brisbane (27.5° S, 153.0° E) and Darwin (12.3° S, 131.0° E), and were used for estimating ground, cloud, and total flash densities at those localities. A later generation CGR4 counter (Mackerras et al., 2009) use the same (or similar) type of aerial for detecting electric field changes caused by lightning as the CGR3 LFCs; the main difference between the two instruments is that the CGR4 LFC uses a microprocessor to implement the flash discrimination procedures, the counting of flashes and the display of registrations.
The GPATS LLS operates on the principle of accurately measuring the time-of-arrival of the
electric field component of lightning impulses at each sensor, by using GPS-synchronised local
clocks to timestamp observations to sub-100 ns accuracy (GPATS website). These
measurements are transferred to a central processing system at GPATS, where they are
correlated and combined to produce estimates for the location (latitude and longitude), time,
peak current (kA), type (cloud-ground or cloud-cloud) and polarity of each stroke. The sensors
have the ability to discriminate individual strokes in a CG flash comprising multiple strokes.
www.intechopen.com
Thunderstorm and Lightning Climatology of Australia
89
Fig. 2. Geographical distribution of the CIGRE-500 counters over the Australian continent.
LFCs have proved to be useful and reliable sources of lightning data. However, their sparse
spatial distribution makes it difficult to prepare a map of lightning distribution without
supplementary information. Data from two NASA satellite-based instruments, the
MicroLab-1 Optical Transient Detector (OTD) (Christian et al., 1996) and the Tropical
Rainfall Measuring Mission (TRMM) Lightning Imaging Sensor (LIS) (Christian et al., 1999),
became recently available for estimating global lightning activity.
Satellite observations provide better spatial coverage of lightning which is, by its nature,
widely distributed geographically. The remotely-sensed data are a valuable source of
information for the areas with little or no local observation data (i.e. LFC or thunder-day
observations). Using five years of the satellite data, a world map of average annual
distribution of total lightning activity was constructed (Christian et al., 2003) and it was
demonstrated that the spatial distribution of flash density is in broad general agreement
with the world thunder-day map (WMO, 1953).
4.1 Comparison of lightning detection results obtained by lightning flash counters and lightning location network
Accurate long-term data are vital for developing reliable lightning climatology. To compare lightning detection results obtained over Australia by various instruments, in particular by
www.intechopen.com
Modern Climatology
90
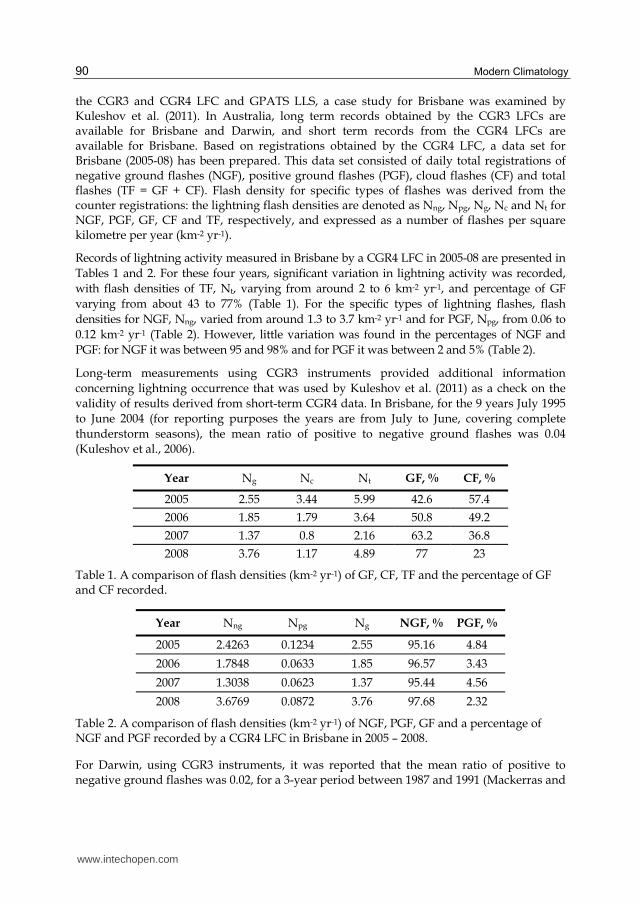
the CGR3 and CGR4 LFC and GPATS LLS, a case study for Brisbane was examined by Kuleshov et al. (2011). In Australia, long term records obtained by the CGR3 LFCs are available for Brisbane and Darwin, and short term records from the CGR4 LFCs are available for Brisbane. Based on registrations obtained by the CGR4 LFC, a data set for Brisbane (2005-08) has been prepared. This data set consisted of daily total registrations of negative ground flashes (NGF), positive ground flashes (PGF), cloud flashes (CF) and total flashes (TF = GF + CF). Flash density for specific types of flashes was derived from the counter registrations: the lightning flash densities are denoted as Nng, Npg, Ng, Nc and Nt for NGF, PGF, GF, CF and TF, respectively, and expressed as a number of flashes per square kilometre per year (km-2 yr-1).
Records of lightning activity measured in Brisbane by a CGR4 LFC in 2005-08 are presented in
Tables 1 and 2. For these four years, significant variation in lightning activity was recorded,
with flash densities of TF, Nt, varying from around 2 to 6 km-2 yr-1, and percentage of GF
varying from about 43 to 77% (Table 1). For the specific types of lightning flashes, flash
densities for NGF, Nng, varied from around 1.3 to 3.7 km-2 yr-1 and for PGF, Npg, from 0.06 to
0.12 km-2 yr-1 (Table 2). However, little variation was found in the percentages of NGF and
PGF: for NGF it was between 95 and 98% and for PGF it was between 2 and 5% (Table 2).
Long-term measurements using CGR3 instruments provided additional information
concerning lightning occurrence that was used by Kuleshov et al. (2011) as a check on the
validity of results derived from short-term CGR4 data. In Brisbane, for the 9 years July 1995
to June 2004 (for reporting purposes the years are from July to June, covering complete
thunderstorm seasons), the mean ratio of positive to negative ground flashes was 0.04
(Kuleshov et al., 2006).
Year Ng Nc Nt GF, % CF, %
2005 2.55 3.44 5.99 42.6 57.4
2006 1.85 1.79 3.64 50.8 49.2
2007 1.37 0.8 2.16 63.2 36.8
2008 3.76 1.17 4.89 77 23
Table 1. A comparison of flash densities (km-2 yr-1) of GF, CF, TF and the percentage of GF and CF recorded.
Year Nng Npg Ng NGF, % PGF, %
2005 2.4263 0.1234 2.55 95.16 4.84
2006 1.7848 0.0633 1.85 96.57 3.43
2007 1.3038 0.0623 1.37 95.44 4.56
2008 3.6769 0.0872 3.76 97.68 2.32
Table 2. A comparison of flash densities (km-2 yr-1) of NGF, PGF, GF and a percentage of NGF and PGF recorded by a CGR4 LFC in Brisbane in 2005 – 2008.
For Darwin, using CGR3 instruments, it was reported that the mean ratio of positive to negative ground flashes was 0.02, for a 3-year period between 1987 and 1991 (Mackerras and
www.intechopen.com
Thunderstorm and Lightning Climatology of Australia
91
Darveniza, 1994). For the period August 2003 to June 2004, a CGR4 instrument has been in use at Darwin Airport and the proportion of positive ground flashes was 0.04.
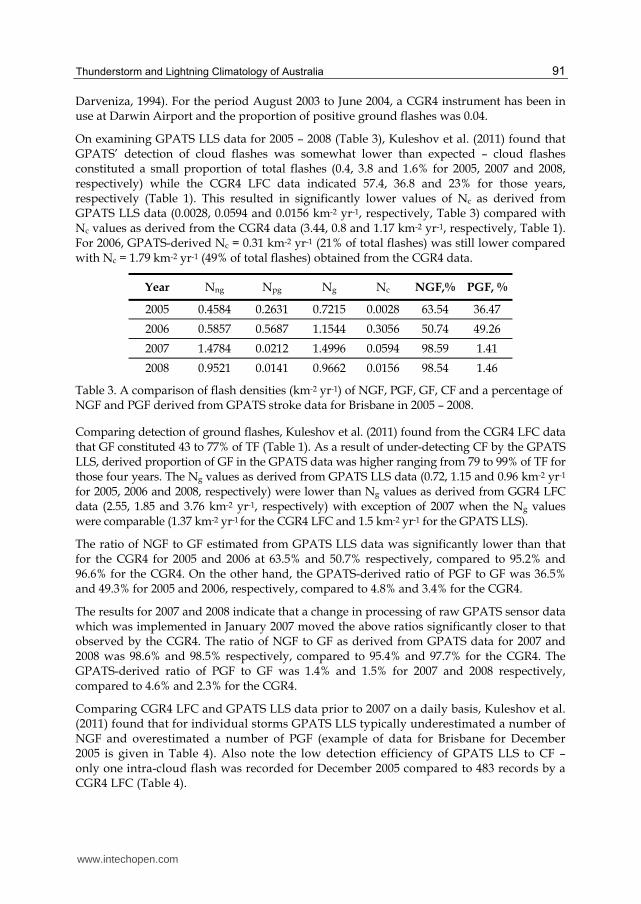
On examining GPATS LLS data for 2005 – 2008 (Table 3), Kuleshov et al. (2011) found that GPATS’ detection of cloud flashes was somewhat lower than expected – cloud flashes constituted a small proportion of total flashes (0.4, 3.8 and 1.6% for 2005, 2007 and 2008, respectively) while the CGR4 LFC data indicated 57.4, 36.8 and 23% for those years, respectively (Table 1). This resulted in significantly lower values of Nc as derived from GPATS LLS data (0.0028, 0.0594 and 0.0156 km-2 yr-1, respectively, Table 3) compared with Nc values as derived from the CGR4 data (3.44, 0.8 and 1.17 km-2 yr-1, respectively, Table 1). For 2006, GPATS-derived Nc = 0.31 km-2 yr-1 (21% of total flashes) was still lower compared with Nc = 1.79 km-2 yr-1 (49% of total flashes) obtained from the CGR4 data.
Year Nng Npg Ng Nc NGF,% PGF, %
2005 0.4584 0.2631 0.7215 0.0028 63.54 36.47
2006 0.5857 0.5687 1.1544 0.3056 50.74 49.26
2007 1.4784 0.0212 1.4996 0.0594 98.59 1.41
2008 0.9521 0.0141 0.9662 0.0156 98.54 1.46
Table 3. A comparison of flash densities (km-2 yr-1) of NGF, PGF, GF, CF and a percentage of NGF and PGF derived from GPATS stroke data for Brisbane in 2005 – 2008.
Comparing detection of ground flashes, Kuleshov et al. (2011) found from the CGR4 LFC data that GF constituted 43 to 77% of TF (Table 1). As a result of under-detecting CF by the GPATS LLS, derived proportion of GF in the GPATS data was higher ranging from 79 to 99% of TF for those four years. The Ng values as derived from GPATS LLS data (0.72, 1.15 and 0.96 km-2 yr-1 for 2005, 2006 and 2008, respectively) were lower than Ng values as derived from GGR4 LFC data (2.55, 1.85 and 3.76 km-2 yr-1, respectively) with exception of 2007 when the Ng values were comparable (1.37 km-2 yr-1 for the CGR4 LFC and 1.5 km-2 yr-1 for the GPATS LLS).
The ratio of NGF to GF estimated from GPATS LLS data was significantly lower than that for the CGR4 for 2005 and 2006 at 63.5% and 50.7% respectively, compared to 95.2% and 96.6% for the CGR4. On the other hand, the GPATS-derived ratio of PGF to GF was 36.5% and 49.3% for 2005 and 2006, respectively, compared to 4.8% and 3.4% for the CGR4.
The results for 2007 and 2008 indicate that a change in processing of raw GPATS sensor data which was implemented in January 2007 moved the above ratios significantly closer to that observed by the CGR4. The ratio of NGF to GF as derived from GPATS data for 2007 and 2008 was 98.6% and 98.5% respectively, compared to 95.4% and 97.7% for the CGR4. The GPATS-derived ratio of PGF to GF was 1.4% and 1.5% for 2007 and 2008 respectively, compared to 4.6% and 2.3% for the CGR4.
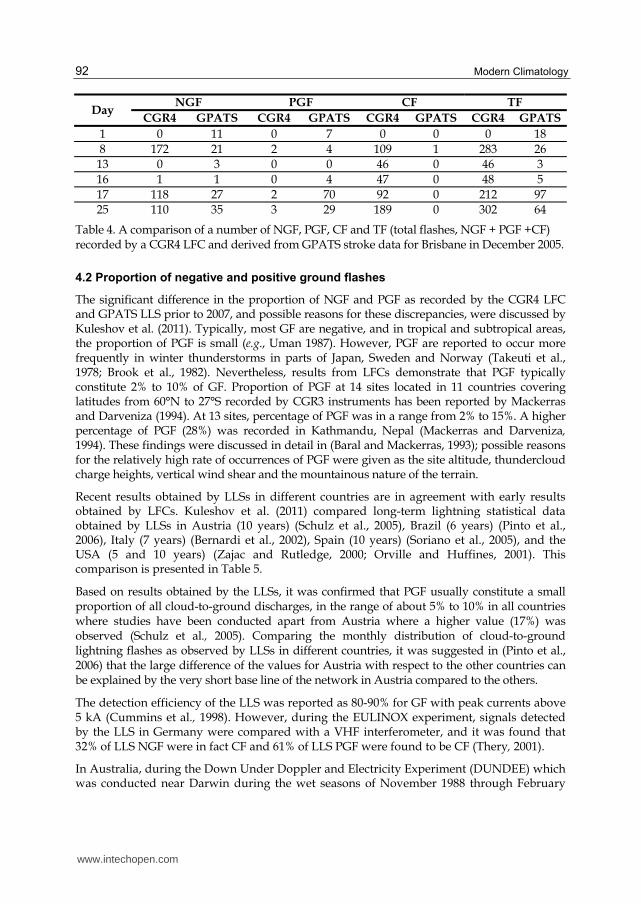
Comparing CGR4 LFC and GPATS LLS data prior to 2007 on a daily basis, Kuleshov et al. (2011) found that for individual storms GPATS LLS typically underestimated a number of NGF and overestimated a number of PGF (example of data for Brisbane for December 2005 is given in Table 4). Also note the low detection efficiency of GPATS LLS to CF – only one intra-cloud flash was recorded for December 2005 compared to 483 records by a CGR4 LFC (Table 4).
www.intechopen.com
Modern Climatology
92
Day NGF PGF CF TF
CGR4 GPATS CGR4 GPATS CGR4 GPATS CGR4 GPATS
1 0 11 0 7 0 0 0 18
8 172 21 2 4 109 1 283 26 13 0 3 0 0 46 0 46 3
16 1 1 0 4 47 0 48 5
17 118 27 2 70 92 0 212 97 25 110 35 3 29 189 0 302 64
Table 4. A comparison of a number of NGF, PGF, CF and TF (total flashes, NGF + PGF +CF) recorded by a CGR4 LFC and derived from GPATS stroke data for Brisbane in December 2005.
4.2 Proportion of negative and positive ground flashes
The significant difference in the proportion of NGF and PGF as recorded by the CGR4 LFC and GPATS LLS prior to 2007, and possible reasons for these discrepancies, were discussed by Kuleshov et al. (2011). Typically, most GF are negative, and in tropical and subtropical areas, the proportion of PGF is small (e.g., Uman 1987). However, PGF are reported to occur more frequently in winter thunderstorms in parts of Japan, Sweden and Norway (Takeuti et al., 1978; Brook et al., 1982). Nevertheless, results from LFCs demonstrate that PGF typically constitute 2% to 10% of GF. Proportion of PGF at 14 sites located in 11 countries covering latitudes from 60°N to 27°S recorded by CGR3 instruments has been reported by Mackerras and Darveniza (1994). At 13 sites, percentage of PGF was in a range from 2% to 15%. A higher percentage of PGF (28%) was recorded in Kathmandu, Nepal (Mackerras and Darveniza, 1994). These findings were discussed in detail in (Baral and Mackerras, 1993); possible reasons for the relatively high rate of occurrences of PGF were given as the site altitude, thundercloud charge heights, vertical wind shear and the mountainous nature of the terrain.
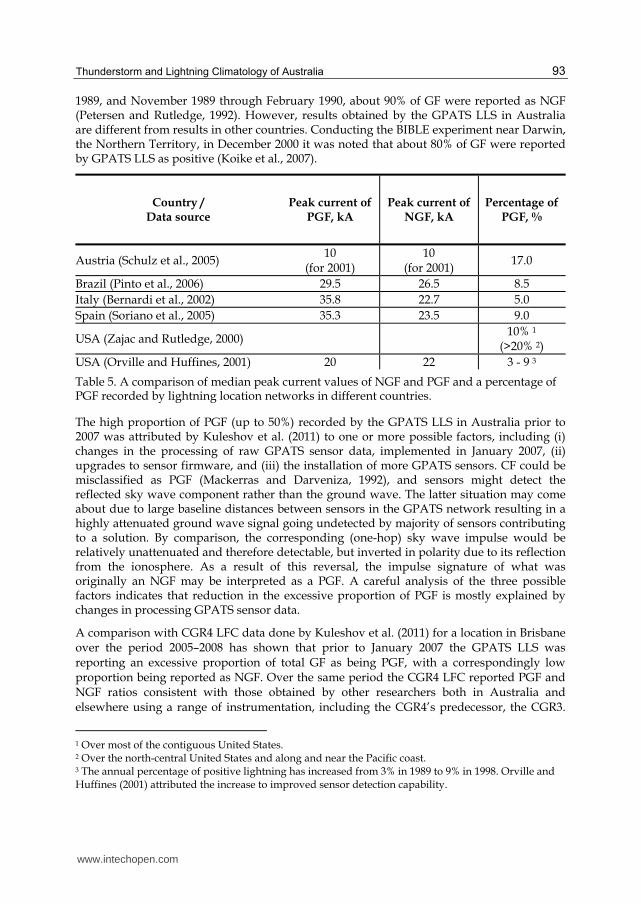
Recent results obtained by LLSs in different countries are in agreement with early results obtained by LFCs. Kuleshov et al. (2011) compared long-term lightning statistical data obtained by LLSs in Austria (10 years) (Schulz et al., 2005), Brazil (6 years) (Pinto et al., 2006), Italy (7 years) (Bernardi et al., 2002), Spain (10 years) (Soriano et al., 2005), and the USA (5 and 10 years) (Zajac and Rutledge, 2000; Orville and Huffines, 2001). This comparison is presented in Table 5.
Based on results obtained by the LLSs, it was confirmed that PGF usually constitute a small proportion of all cloud-to-ground discharges, in the range of about 5% to 10% in all countries where studies have been conducted apart from Austria where a higher value (17%) was observed (Schulz et al., 2005). Comparing the monthly distribution of cloud-to-ground lightning flashes as observed by LLSs in different countries, it was suggested in (Pinto et al., 2006) that the large difference of the values for Austria with respect to the other countries can be explained by the very short base line of the network in Austria compared to the others.
The detection efficiency of the LLS was reported as 80-90% for GF with peak currents above 5 kA (Cummins et al., 1998). However, during the EULINOX experiment, signals detected by the LLS in Germany were compared with a VHF interferometer, and it was found that 32% of LLS NGF were in fact CF and 61% of LLS PGF were found to be CF (Thery, 2001).
In Australia, during the Down Under Doppler and Electricity Experiment (DUNDEE) which was conducted near Darwin during the wet seasons of November 1988 through February
www.intechopen.com
Thunderstorm and Lightning Climatology of Australia
93
1989, and November 1989 through February 1990, about 90% of GF were reported as NGF (Petersen and Rutledge, 1992). However, results obtained by the GPATS LLS in Australia are different from results in other countries. Conducting the BIBLE experiment near Darwin, the Northern Territory, in December 2000 it was noted that about 80% of GF were reported by GPATS LLS as positive (Koike et al., 2007).
Country / Data source
Peak current of PGF, kA
Peak current of NGF, kA
Percentage of PGF, %
Austria (Schulz et al., 2005) 10
(for 2001) 10
(for 2001) 17.0
Brazil (Pinto et al., 2006) 29.5 26.5 8.5
Italy (Bernardi et al., 2002) 35.8 22.7 5.0
Spain (Soriano et al., 2005) 35.3 23.5 9.0
USA (Zajac and Rutledge, 2000) 10% 1
(>20% 2)
USA (Orville and Huffines, 2001) 20 22 3 - 9 3
Table 5. A comparison of median peak current values of NGF and PGF and a percentage of PGF recorded by lightning location networks in different countries.
The high proportion of PGF (up to 50%) recorded by the GPATS LLS in Australia prior to 2007 was attributed by Kuleshov et al. (2011) to one or more possible factors, including (i) changes in the processing of raw GPATS sensor data, implemented in January 2007, (ii) upgrades to sensor firmware, and (iii) the installation of more GPATS sensors. CF could be misclassified as PGF (Mackerras and Darveniza, 1992), and sensors might detect the reflected sky wave component rather than the ground wave. The latter situation may come about due to large baseline distances between sensors in the GPATS network resulting in a highly attenuated ground wave signal going undetected by majority of sensors contributing to a solution. By comparison, the corresponding (one-hop) sky wave impulse would be relatively unattenuated and therefore detectable, but inverted in polarity due to its reflection from the ionosphere. As a result of this reversal, the impulse signature of what was originally an NGF may be interpreted as a PGF. A careful analysis of the three possible factors indicates that reduction in the excessive proportion of PGF is mostly explained by changes in processing GPATS sensor data.
A comparison with CGR4 LFC data done by Kuleshov et al. (2011) for a location in Brisbane over the period 2005–2008 has shown that prior to January 2007 the GPATS LLS was reporting an excessive proportion of total GF as being PGF, with a correspondingly low proportion being reported as NGF. Over the same period the CGR4 LFC reported PGF and NGF ratios consistent with those obtained by other researchers both in Australia and elsewhere using a range of instrumentation, including the CGR4’s predecessor, the CGR3.
1 Over most of the contiguous United States. 2 Over the north-central United States and along and near the Pacific coast. 3 The annual percentage of positive lightning has increased from 3% in 1989 to 9% in 1998. Orville and Huffines (2001) attributed the increase to improved sensor detection capability.
www.intechopen.com
Modern Climatology
94
After January 2007, the PGF and NGF ratios reported by the GPATS changed significantly to become more aligned with the CGR4 observations. Indeed, the ratio of PGF to total GF for 2007 and 2008 is somewhat lower than that derived from the CGR4 data and lightning cloud flash density values, Nc, are lower by an order of magnitude than those estimated from the CGR4 measurements indicating that further investigation of later data may be required. This transition coincided with an upgrade to the GPATS’ stroke processing software. It is therefore concluded that the polarity of GPATS stroke data prior to January 2007 not in agreement with records obtained by lightning location networks in different countries. Consequently, only GIGRE-500, CGR3 and CGR4 data records which are consistent with lightning data obtained internationally were used for analysis of lightning climatology over the Australian continent presented in following sections.
5. Variation of lightning distribution
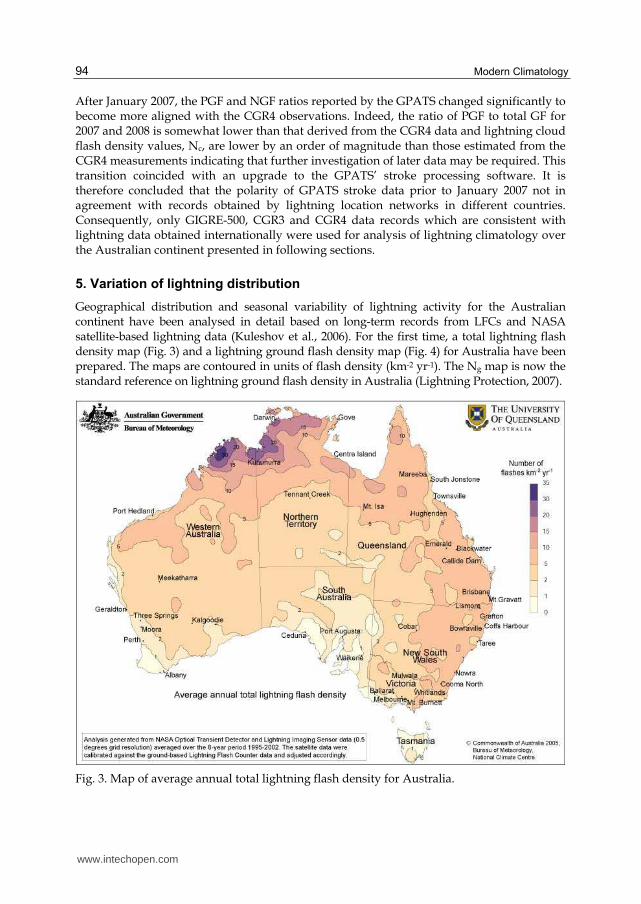
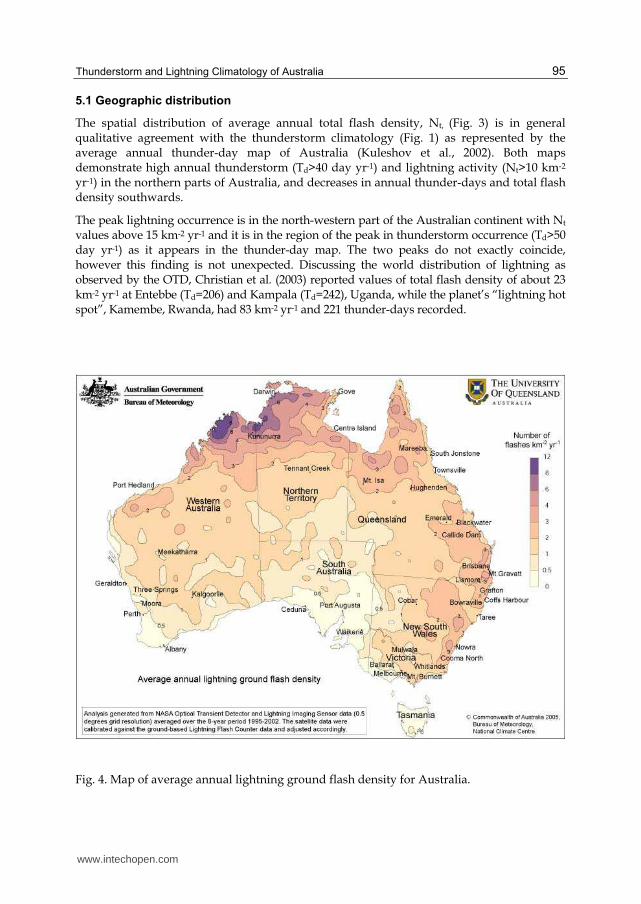
Geographical distribution and seasonal variability of lightning activity for the Australian continent have been analysed in detail based on long-term records from LFCs and NASA satellite-based lightning data (Kuleshov et al., 2006). For the first time, a total lightning flash density map (Fig. 3) and a lightning ground flash density map (Fig. 4) for Australia have been prepared. The maps are contoured in units of flash density (km-2 yr-1). The Ng map is now the standard reference on lightning ground flash density in Australia (Lightning Protection, 2007).
Fig. 3. Map of average annual total lightning flash density for Australia.
www.intechopen.com
Thunderstorm and Lightning Climatology of Australia
95
5.1 Geographic distribution
The spatial distribution of average annual total flash density, Nt, (Fig. 3) is in general qualitative agreement with the thunderstorm climatology (Fig. 1) as represented by the average annual thunder-day map of Australia (Kuleshov et al., 2002). Both maps demonstrate high annual thunderstorm (Td>40 day yr-1) and lightning activity (Nt>10 km-2 yr-1) in the northern parts of Australia, and decreases in annual thunder-days and total flash density southwards.
The peak lightning occurrence is in the north-western part of the Australian continent with Nt values above 15 km-2 yr-1 and it is in the region of the peak in thunderstorm occurrence (Td>50 day yr-1) as it appears in the thunder-day map. The two peaks do not exactly coincide, however this finding is not unexpected. Discussing the world distribution of lightning as observed by the OTD, Christian et al. (2003) reported values of total flash density of about 23 km-2 yr-1 at Entebbe (Td=206) and Kampala (Td=242), Uganda, while the planet’s “lightning hot spot”, Kamembe, Rwanda, had 83 km-2 yr-1 and 221 thunder-days recorded.
Fig. 4. Map of average annual lightning ground flash density for Australia.
www.intechopen.com
Modern Climatology
96
The maximum average annual number of Td>80 is in the vicinity of Darwin, where storms triggered over the Arnhem Land ranges and over Bathurst Island are very common (Fig. 1). High frequency of thunderstorms (40-60 thunder-days per year) is observed at the King Leopold and Durack Ranges in the north of Western Australia. This approximately corresponds to the area of the maximum average annual total lightning flash density with Nt>30 km-2 yr-1 centred around 16° S 126° E (Fig. 3). The highest value of Nt as derived from the satellite data is about 35 km-2 yr-1.
The secondary maximum of thunderstorm and lightning occurrence is over the north-eastern part of the Northern Territory and northern part of Queensland, with values of Td between 40 and 60 days per year, and with Nt values between 5 and 15 km-2 yr-1. Another secondary maximum is evident over eastern part of Australia, with local maxima over the Great Dividing Range. Average annual number of thunder days is between 20 and 40 in this area, and lightning activity is also high with Nt values up to 10 km-2 yr-1. Lightning occurrence generally decreases southward, and number of total lightning flashes is small in Victoria, South Australia, the southern parts of Western Australia and New South Wales, and Tasmania, with the values of Nt <5 km-2 yr-1.
5.2 Seasonal variations
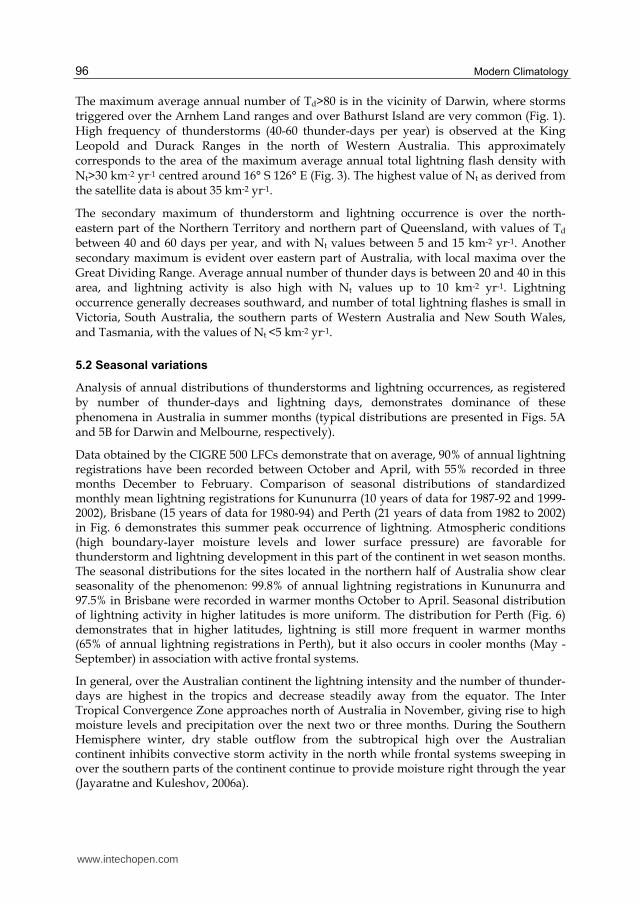
Analysis of annual distributions of thunderstorms and lightning occurrences, as registered by number of thunder-days and lightning days, demonstrates dominance of these phenomena in Australia in summer months (typical distributions are presented in Figs. 5A and 5B for Darwin and Melbourne, respectively).
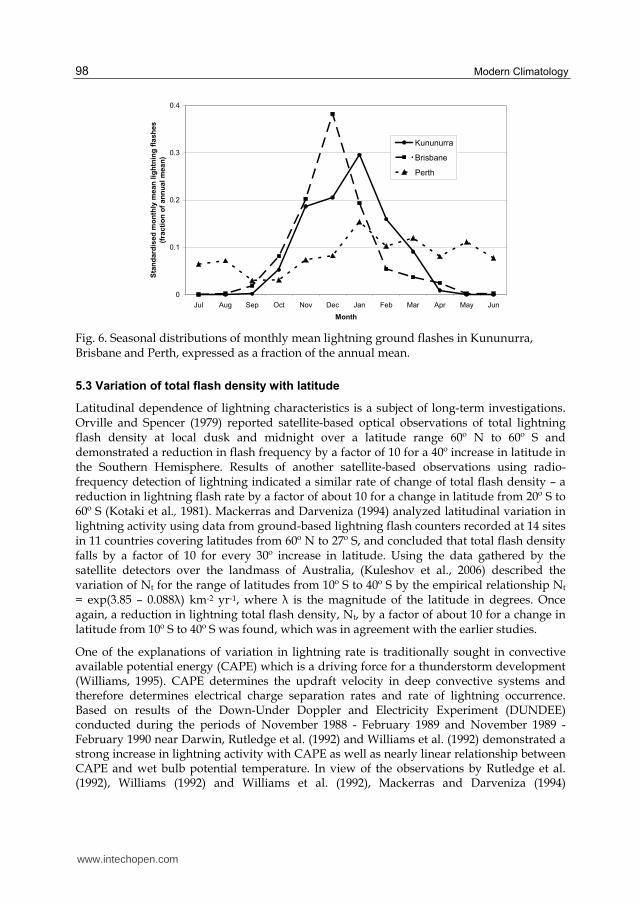
Data obtained by the CIGRE 500 LFCs demonstrate that on average, 90% of annual lightning registrations have been recorded between October and April, with 55% recorded in three months December to February. Comparison of seasonal distributions of standardized monthly mean lightning registrations for Kununurra (10 years of data for 1987-92 and 1999-2002), Brisbane (15 years of data for 1980-94) and Perth (21 years of data from 1982 to 2002) in Fig. 6 demonstrates this summer peak occurrence of lightning. Atmospheric conditions (high boundary-layer moisture levels and lower surface pressure) are favorable for thunderstorm and lightning development in this part of the continent in wet season months. The seasonal distributions for the sites located in the northern half of Australia show clear seasonality of the phenomenon: 99.8% of annual lightning registrations in Kununurra and 97.5% in Brisbane were recorded in warmer months October to April. Seasonal distribution of lightning activity in higher latitudes is more uniform. The distribution for Perth (Fig. 6) demonstrates that in higher latitudes, lightning is still more frequent in warmer months (65% of annual lightning registrations in Perth), but it also occurs in cooler months (May - September) in association with active frontal systems.
In general, over the Australian continent the lightning intensity and the number of thunder-days are highest in the tropics and decrease steadily away from the equator. The Inter Tropical Convergence Zone approaches north of Australia in November, giving rise to high moisture levels and precipitation over the next two or three months. During the Southern Hemisphere winter, dry stable outflow from the subtropical high over the Australian continent inhibits convective storm activity in the north while frontal systems sweeping in over the southern parts of the continent continue to provide moisture right through the year (Jayaratne and Kuleshov, 2006a).
www.intechopen.com
Thunderstorm and Lightning Climatology of Australia
97
a)
b)
Fig. 5. Seasonal distributions of monthly mean thunder-days in Darwin (A) and Melbourne (B).
www.intechopen.com
Modern Climatology
98
0
0.1
0.2
0.3
0.4
Jul Aug Sep Oct Nov Dec Jan Feb Mar Apr May Jun
Month
Sta
nd
ard
ised
mo
nth
ly m
ean
lig
htn
ing
fla
sh
es
(fra
cti
on
of
an
nu
al
mea
n)
Kununurra
Brisbane
Perth
Fig. 6. Seasonal distributions of monthly mean lightning ground flashes in Kununurra, Brisbane and Perth, expressed as a fraction of the annual mean.
5.3 Variation of total flash density with latitude
Latitudinal dependence of lightning characteristics is a subject of long-term investigations. Orville and Spencer (1979) reported satellite-based optical observations of total lightning flash density at local dusk and midnight over a latitude range 60º N to 60º S and demonstrated a reduction in flash frequency by a factor of 10 for a 40º increase in latitude in the Southern Hemisphere. Results of another satellite-based observations using radio-frequency detection of lightning indicated a similar rate of change of total flash density – a reduction in lightning flash rate by a factor of about 10 for a change in latitude from 20º S to 60º S (Kotaki et al., 1981). Mackerras and Darveniza (1994) analyzed latitudinal variation in lightning activity using data from ground-based lightning flash counters recorded at 14 sites in 11 countries covering latitudes from 60º N to 27º S, and concluded that total flash density falls by a factor of 10 for every 30º increase in latitude. Using the data gathered by the satellite detectors over the landmass of Australia, (Kuleshov et al., 2006) described the variation of Nt for the range of latitudes from 10º S to 40º S by the empirical relationship Nt = exp(3.85 – 0.088λ) km-2 yr-1, where λ is the magnitude of the latitude in degrees. Once again, a reduction in lightning total flash density, Nt, by a factor of about 10 for a change in latitude from 10º S to 40º S was found, which was in agreement with the earlier studies.
One of the explanations of variation in lightning rate is traditionally sought in convective available potential energy (CAPE) which is a driving force for a thunderstorm development (Williams, 1995). CAPE determines the updraft velocity in deep convective systems and therefore determines electrical charge separation rates and rate of lightning occurrence. Based on results of the Down-Under Doppler and Electricity Experiment (DUNDEE) conducted during the periods of November 1988 - February 1989 and November 1989 - February 1990 near Darwin, Rutledge et al. (1992) and Williams et al. (1992) demonstrated a strong increase in lightning activity with CAPE as well as nearly linear relationship between CAPE and wet bulb potential temperature. In view of the observations by Rutledge et al. (1992), Williams (1992) and Williams et al. (1992), Mackerras and Darveniza (1994)
www.intechopen.com
Thunderstorm and Lightning Climatology of Australia
99
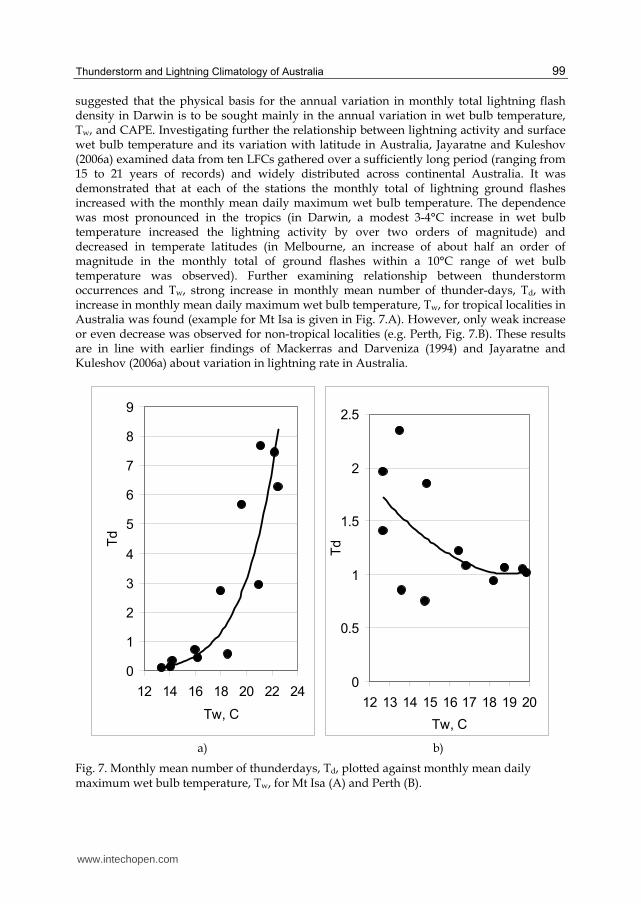
suggested that the physical basis for the annual variation in monthly total lightning flash density in Darwin is to be sought mainly in the annual variation in wet bulb temperature, Tw, and CAPE. Investigating further the relationship between lightning activity and surface wet bulb temperature and its variation with latitude in Australia, Jayaratne and Kuleshov (2006a) examined data from ten LFCs gathered over a sufficiently long period (ranging from 15 to 21 years of records) and widely distributed across continental Australia. It was demonstrated that at each of the stations the monthly total of lightning ground flashes increased with the monthly mean daily maximum wet bulb temperature. The dependence was most pronounced in the tropics (in Darwin, a modest 3-4°C increase in wet bulb temperature increased the lightning activity by over two orders of magnitude) and decreased in temperate latitudes (in Melbourne, an increase of about half an order of magnitude in the monthly total of ground flashes within a 10°C range of wet bulb temperature was observed). Further examining relationship between thunderstorm occurrences and Tw, strong increase in monthly mean number of thunder-days, Td, with increase in monthly mean daily maximum wet bulb temperature, Tw, for tropical localities in Australia was found (example for Mt Isa is given in Fig. 7.A). However, only weak increase or even decrease was observed for non-tropical localities (e.g. Perth, Fig. 7.B). These results are in line with earlier findings of Mackerras and Darveniza (1994) and Jayaratne and Kuleshov (2006a) about variation in lightning rate in Australia.
0
1
2
3
4
5
6
7
8
9
12 14 16 18 20 22 24
Tw, C
Td
0
0.5
1
1.5
2
2.5
12 13 14 15 16 17 18 19 20
Tw, C
Td
a) b)
Fig. 7. Monthly mean number of thunderdays, Td, plotted against monthly mean daily maximum wet bulb temperature, Tw, for Mt Isa (A) and Perth (B).
www.intechopen.com
Modern Climatology
100
It appears that the main explanation for the annual variation in monthly flash density in tropical parts of the Australian continent is found in the variation in wet bulb temperature and CAPE. However, other factors such as variation in freezing level (Williams et al., 2005; Mushtak et al., 2005), in aerosol loading (Williams and Stanfill, 2002), as well as variation in topography (Bocippio et al., 2001), may also influence the geographical and seasonal variations of lightning parameters in other parts of the continent.
5.4 Yearly variations in thunder-days
Climatic hazards such as thunderstorms and lightning can accompany destructive weather,
particularly in the tropical regions. It is important to examine how the frequencies of
thunderstorms have changed over the periods for which thunder-day records are available
in Australia and, perhaps more importantly, how they are likely to change in the future.
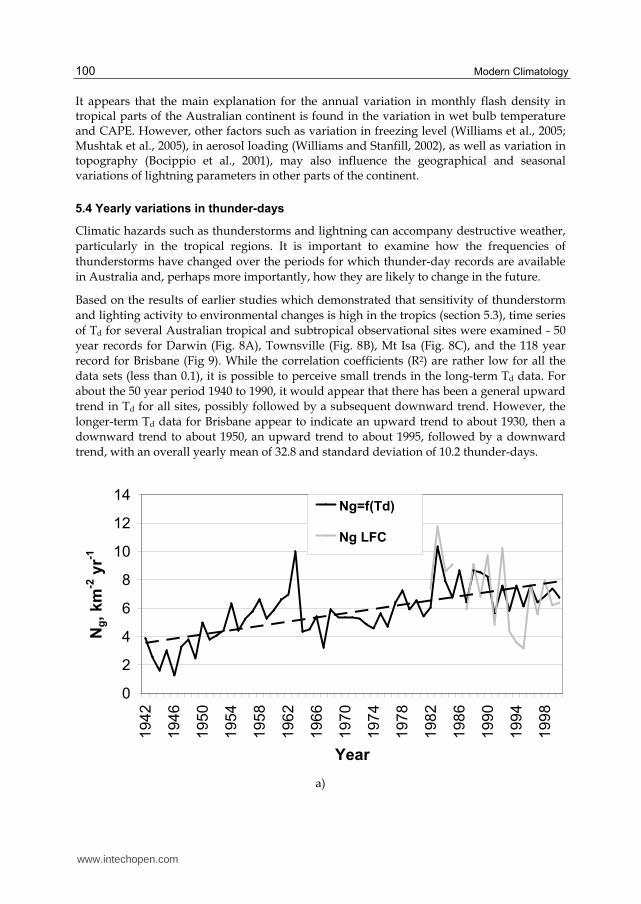
Based on the results of earlier studies which demonstrated that sensitivity of thunderstorm
and lighting activity to environmental changes is high in the tropics (section 5.3), time series
of Td for several Australian tropical and subtropical observational sites were examined - 50
year records for Darwin (Fig. 8A), Townsville (Fig. 8B), Mt Isa (Fig. 8C), and the 118 year
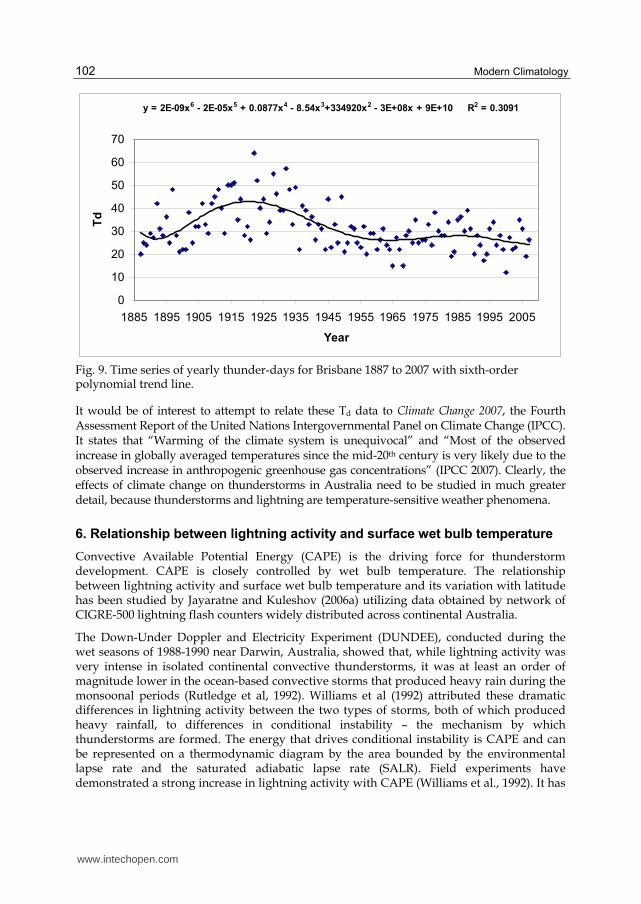
record for Brisbane (Fig 9). While the correlation coefficients (R2) are rather low for all the
data sets (less than 0.1), it is possible to perceive small trends in the long-term Td data. For
about the 50 year period 1940 to 1990, it would appear that there has been a general upward
trend in Td for all sites, possibly followed by a subsequent downward trend. However, the
longer-term Td data for Brisbane appear to indicate an upward trend to about 1930, then a
downward trend to about 1950, an upward trend to about 1995, followed by a downward
trend, with an overall yearly mean of 32.8 and standard deviation of 10.2 thunder-days.
0
2
4
6
8
10
12
14
194
2
194
6
195
0
195
4
195
8
196
2
196
6
197
0
197
4
197
8
198
2
198
6
199
0
199
4
199
8
Year
Ng,
km
-2 y
r-1
Ng=f(Td)
Ng LFC
a)
www.intechopen.com
Thunderstorm and Lightning Climatology of Australia
101
0
0.5
1
1.5
2
194
1
194
5
194
9
195
3
195
7
196
1
196
5
196
9
197
3
197
7
198
1
198
5
198
9
199
3
199
7
Year
Ng,
km
-2 y
r-1
Ng = f(Td)
Ng LFC
b)
0
0.5
1
1.5
2
2.5
3
3.5
4
4.5
5
196
7
196
9
197
1
197
3
197
5
197
7
197
9
198
1
198
3
198
5
198
7
198
9
199
1
199
3
199
5
199
7
199
9
200
1
200
3
200
5
Year
Ng,
km
-2 y
r-1
Ng=f(Td)
Ng LFC
c)
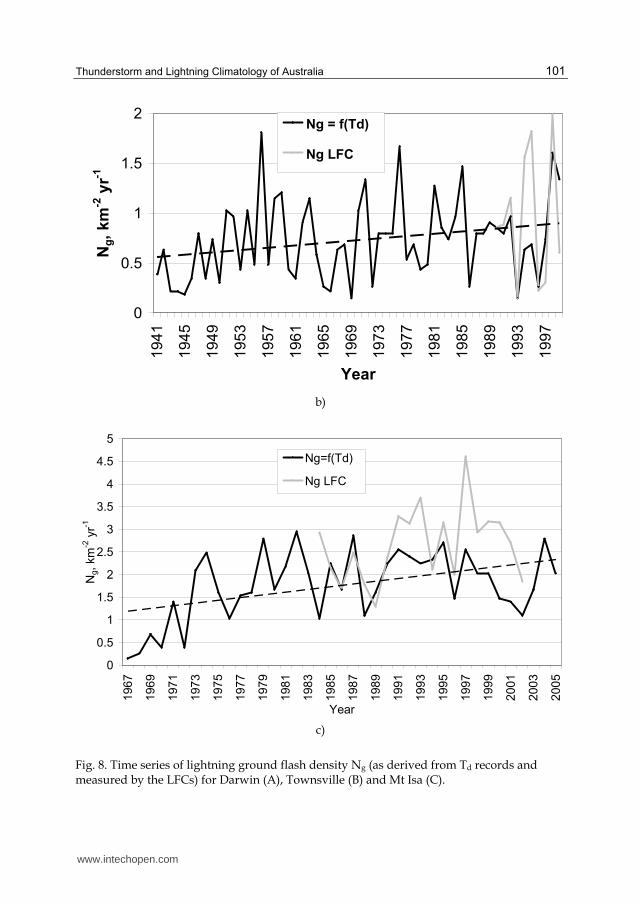
Fig. 8. Time series of lightning ground flash density Ng (as derived from Td records and measured by the LFCs) for Darwin (A), Townsville (B) and Mt Isa (C).
www.intechopen.com
Modern Climatology
102
y = 2E-09x6 - 2E-05x5 + 0.0877x4 - 8.54x3+334920x2 - 3E+08x + 9E+10 R2 = 0.3091
0
10
20
30
40
50
60
70
1885 1895 1905 1915 1925 1935 1945 1955 1965 1975 1985 1995 2005
Year
Td
Fig. 9. Time series of yearly thunder-days for Brisbane 1887 to 2007 with sixth-order polynomial trend line.
It would be of interest to attempt to relate these Td data to Climate Change 2007, the Fourth Assessment Report of the United Nations Intergovernmental Panel on Climate Change (IPCC). It states that “Warming of the climate system is unequivocal” and “Most of the observed increase in globally averaged temperatures since the mid-20th century is very likely due to the observed increase in anthropogenic greenhouse gas concentrations” (IPCC 2007). Clearly, the effects of climate change on thunderstorms in Australia need to be studied in much greater detail, because thunderstorms and lightning are temperature-sensitive weather phenomena.
6. Relationship between lightning activity and surface wet bulb temperature
Convective Available Potential Energy (CAPE) is the driving force for thunderstorm development. CAPE is closely controlled by wet bulb temperature. The relationship between lightning activity and surface wet bulb temperature and its variation with latitude has been studied by Jayaratne and Kuleshov (2006a) utilizing data obtained by network of CIGRE-500 lightning flash counters widely distributed across continental Australia.
The Down-Under Doppler and Electricity Experiment (DUNDEE), conducted during the wet seasons of 1988-1990 near Darwin, Australia, showed that, while lightning activity was very intense in isolated continental convective thunderstorms, it was at least an order of magnitude lower in the ocean-based convective storms that produced heavy rain during the monsoonal periods (Rutledge et al, 1992). Williams et al (1992) attributed these dramatic differences in lightning activity between the two types of storms, both of which produced heavy rainfall, to differences in conditional instability – the mechanism by which thunderstorms are formed. The energy that drives conditional instability is CAPE and can be represented on a thermodynamic diagram by the area bounded by the environmental lapse rate and the saturated adiabatic lapse rate (SALR). Field experiments have demonstrated a strong increase in lightning activity with CAPE (Williams et al., 1992). It has
www.intechopen.com
Thunderstorm and Lightning Climatology of Australia
103
also been shown that CAPE increases linearly with potential wet bulb temperature, Tw (Williams et al, 1992; Williams and Renno, 1993; Peterson et al, 1996). This is not surprising in view of the fact that the SALR is determined by Tw. Williams et al (1992) showed that a 1ºC change in Tw resulted in a change in CAPE of about 1 kJ kg-1. The mean daily maximum surface Tw in Darwin during the 1988-89 wet season dropped by about 2ºC from the break periods to the monsoon periods. While the high lightning incidence continental storms occurred during the break periods, little lightning was observed in the monsoonal storms. The calculated CAPE showed an increase from about 800 J kg-1 to about 2000 J kg-1 from the monsoonal period to the break period. The corresponding lightning flash density over an area of 40,000 km2 increased from about 100 to over 1000 per day. Analysis of the two-season data set indicated that the monthly mean lightning count in Darwin increased by more than two orders of magnitude as Tw increased by 2ºC. Jayaratne (1993) showed a similar behaviour in Botswana in Africa where the lightning activity doubled for every 1ºC increase in Tw. Peterson et al (1996) studying data collected during TOGA COARE over the western Pacific Ocean, concluded that a 0.5ºC increase in Tw led to a 5 to 8 factor increase in the cloud to ground lightning activity. A detailed explanation for the increase of lightning activity with CAPE and Tw may be found in Williams (1995).
In Australia, the ABM maintains a network of about 40 lightning flash counters scattered widely around Australia (Fig 2). The availability of a reasonably large lightning flash data set obtained at several sites over a range of geographical latitudes on the Australian continent allowed to investigate the reported sensitive relationship between lightning activity and Tw. (Jayaratne and Kuleshov, 2006a). Of the 40 stations, ten sites were selected for their reliability and availability of data over sufficiently long periods of observation and to represent a wide geographical distribution across the continent.
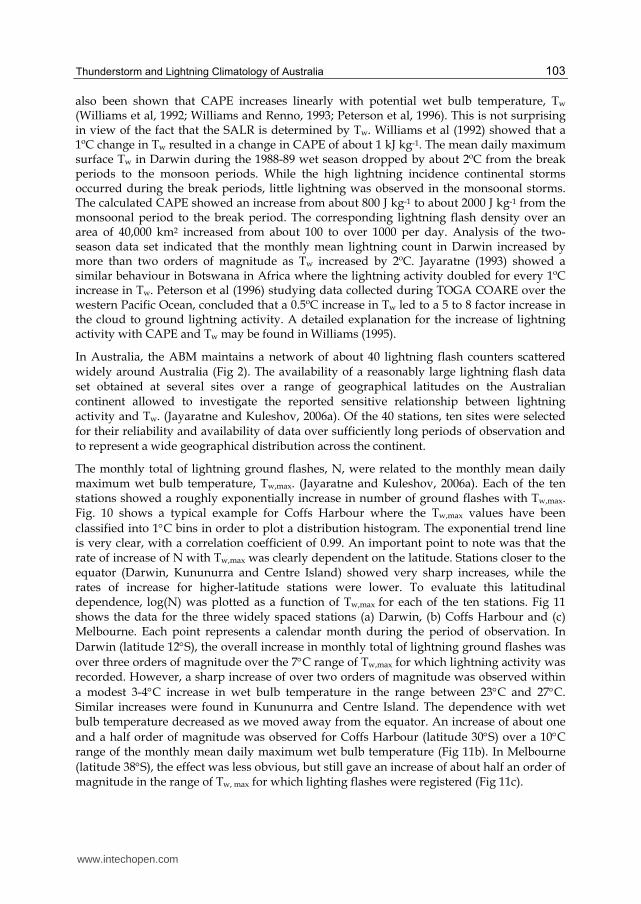
The monthly total of lightning ground flashes, N, were related to the monthly mean daily maximum wet bulb temperature, Tw,max. (Jayaratne and Kuleshov, 2006a). Each of the ten stations showed a roughly exponentially increase in number of ground flashes with Tw,max. Fig. 10 shows a typical example for Coffs Harbour where the Tw,max values have been
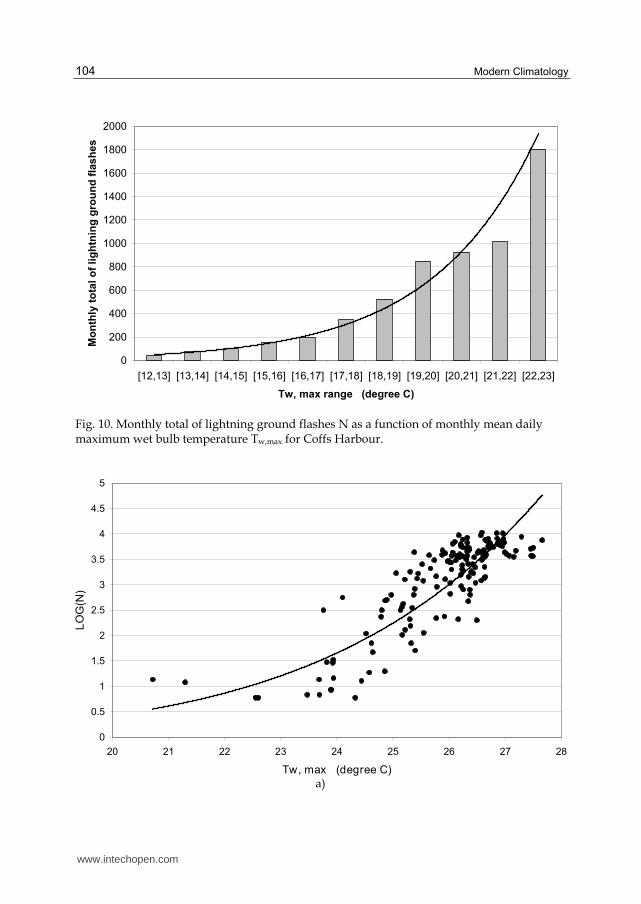
classified into 1C bins in order to plot a distribution histogram. The exponential trend line is very clear, with a correlation coefficient of 0.99. An important point to note was that the rate of increase of N with Tw,max was clearly dependent on the latitude. Stations closer to the equator (Darwin, Kununurra and Centre Island) showed very sharp increases, while the rates of increase for higher-latitude stations were lower. To evaluate this latitudinal dependence, log(N) was plotted as a function of Tw,max for each of the ten stations. Fig 11 shows the data for the three widely spaced stations (a) Darwin, (b) Coffs Harbour and (c) Melbourne. Each point represents a calendar month during the period of observation. In
Darwin (latitude 12S), the overall increase in monthly total of lightning ground flashes was
over three orders of magnitude over the 7C range of Tw,max for which lightning activity was recorded. However, a sharp increase of over two orders of magnitude was observed within
a modest 3-4C increase in wet bulb temperature in the range between 23C and 27C. Similar increases were found in Kununurra and Centre Island. The dependence with wet bulb temperature decreased as we moved away from the equator. An increase of about one
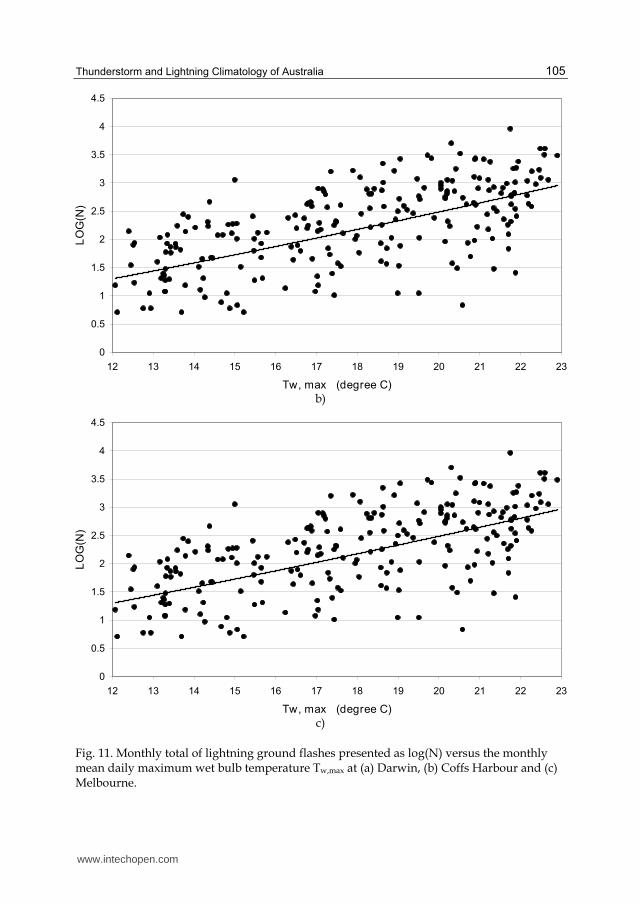
and a half order of magnitude was observed for Coffs Harbour (latitude 30S) over a 10C range of the monthly mean daily maximum wet bulb temperature (Fig 11b). In Melbourne
(latitude 38S), the effect was less obvious, but still gave an increase of about half an order of magnitude in the range of Tw, max for which lighting flashes were registered (Fig 11c).
www.intechopen.com
Modern Climatology
104
0
200
400
600
800
1000
1200
1400
1600
1800
2000
[12,13] [13,14] [14,15] [15,16] [16,17] [17,18] [18,19] [19,20] [20,21] [21,22] [22,23]
Tw, max range (degree C)
Mo
nth
ly t
ota
l o
f li
gh
tnin
g g
rou
nd
fla
sh
es
Fig. 10. Monthly total of lightning ground flashes N as a function of monthly mean daily maximum wet bulb temperature Tw,max for Coffs Harbour.
a)
www.intechopen.com
Thunderstorm and Lightning Climatology of Australia
105
b)
c)
Fig. 11. Monthly total of lightning ground flashes presented as log(N) versus the monthly mean daily maximum wet bulb temperature Tw,max at (a) Darwin, (b) Coffs Harbour and (c) Melbourne.
www.intechopen.com
Modern Climatology
106
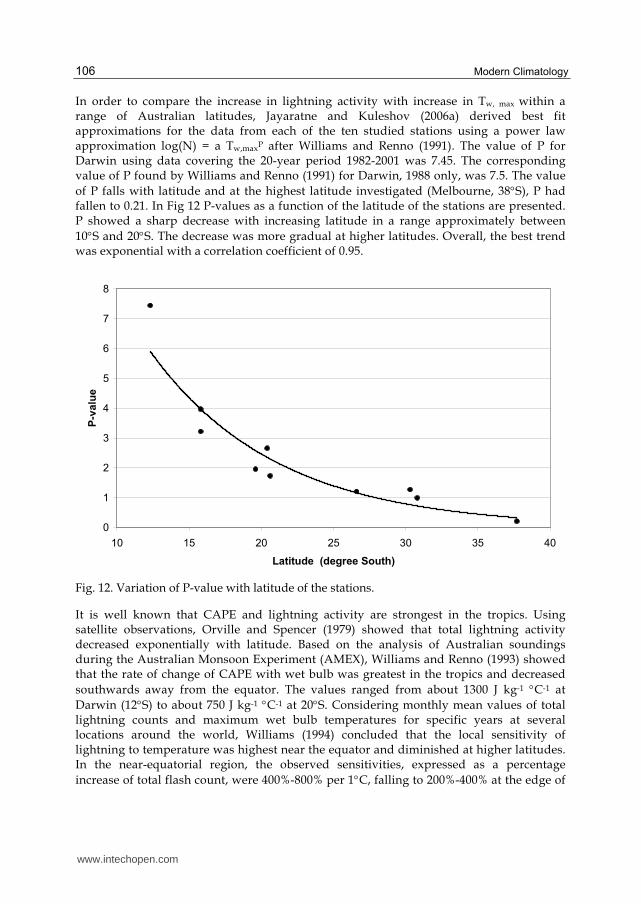
In order to compare the increase in lightning activity with increase in Tw, max within a range of Australian latitudes, Jayaratne and Kuleshov (2006a) derived best fit approximations for the data from each of the ten studied stations using a power law approximation log(N) = a Tw,maxP after Williams and Renno (1991). The value of P for Darwin using data covering the 20-year period 1982-2001 was 7.45. The corresponding value of P found by Williams and Renno (1991) for Darwin, 1988 only, was 7.5. The value
of P falls with latitude and at the highest latitude investigated (Melbourne, 38S), P had fallen to 0.21. In Fig 12 P-values as a function of the latitude of the stations are presented. P showed a sharp decrease with increasing latitude in a range approximately between
10S and 20S. The decrease was more gradual at higher latitudes. Overall, the best trend was exponential with a correlation coefficient of 0.95.
0
1
2
3
4
5
6
7
8
10 15 20 25 30 35 40
Latitude (degree South)
P-v
alu
e
Fig. 12. Variation of P-value with latitude of the stations.
It is well known that CAPE and lightning activity are strongest in the tropics. Using satellite observations, Orville and Spencer (1979) showed that total lightning activity decreased exponentially with latitude. Based on the analysis of Australian soundings during the Australian Monsoon Experiment (AMEX), Williams and Renno (1993) showed that the rate of change of CAPE with wet bulb was greatest in the tropics and decreased
southwards away from the equator. The values ranged from about 1300 J kg-1 C-1 at
Darwin (12S) to about 750 J kg-1 C-1 at 20S. Considering monthly mean values of total lightning counts and maximum wet bulb temperatures for specific years at several locations around the world, Williams (1994) concluded that the local sensitivity of lightning to temperature was highest near the equator and diminished at higher latitudes. In the near-equatorial region, the observed sensitivities, expressed as a percentage
increase of total flash count, were 400%-800% per 1C, falling to 200%-400% at the edge of
www.intechopen.com
Thunderstorm and Lightning Climatology of Australia
107
the tropics. The sensitivity at mid latitude was only 100%-200%. The value for Darwin
(12S), using total lightning count data gathered during the year 1988, was close to 500%. From Fig 11(a), the value using ground flash data over a period of 20 years, calculated
over the temperature range 22C to 27C was 400%, in good agreement with the above. It
should be noted that the increase within the narrower temperature range of 24C to 27C, corresponding to the intense summer thunderstorms, gave a much higher factor of 1000%.
The values for Coffs Harbour (30S) and Melbourne (38S) were significantly lower at 160% and 130% respectively. Williams (1994) did not present results from Southern Hemisphere stations at these higher latitudes but our values compare well with their results for Northern Hemisphere stations at the same distance from the equator.
The reason for the decrease of P-values as the location moved away from the equator (Fig 12) is not very obvious. Williams and Renno (1991) suggested that, although CAPE still plays a major role in the temperate latitudes, CAPE is strongly influenced by the presence of cold dry air aloft in the environment and less influenced by the wet bulb temperature of boundary layer air. Williams (1994) stresses that a more fundamental understanding of the strongly nonlinear relationship between lightning and CAPE must await a more complete understanding of the microphysics of charge separation within thunderstorms.
7. Relationship between lightning ground flash density and rainfall
The close relationship between rain and lightning is well known. Battan (1965) and Piepgrass et al. (1982) related number counts of cloud to ground (CG) lightning from nearby thunderstorms to rain gauge readings and found them to be well correlated. Many studies have found the intensity of lightning to be positively correlated to rainfall estimated from radar measurements (Kinzer, 1974; Reap and MacGorman, 1989; Williams et al.., 1992; Cheze and Sauvageot, 1997). Intense falls of rain associated with nearby CG lightning have been documented by Shackford (1960), Moore et al. (1962), Piepgrass et al. (1982) and Jayaratne et al. (1995).
However, there are numerous documented observations of heavy rain accompanied by little or no lightning activity (Williams et al, 1992; Jayaratne, 1993). Kuleshov et al (2002) studied thunderstorm distribution and frequency in Australia using data from 300 sites around the country. In particular, they showed that the section of eastern coast in Queensland between Cooktown (15ºS) and Innisfail (18ºS), reputed to be the wettest part of Australia, had fewer than 25 thunder-days per year, while other tropical regions of the country recorded over 40 thunder-days annually. Thorough analysis and comparison of time series of thunder-day frequency with rainfall variations over the period 1970-1999 allowed them to conclude that thunderstorm frequency in Australia does not, in general, appear to vary in any consistent way with rainfall. To study geographical and seasonal characteristics of the relationship between lightning ground flash density and rainfall in detail, Jayaratne and Kuleshov (2006b) analysed observations of annual rainfall and lightning incidence collected at 23 stations around the continent of Australia.
7.1 Rain yields
Although there is a high positive correlation between rainfall and lightning, the ratio of rain mass to CG lightning flash count over a common area, with units of kilograms of rain per
www.intechopen.com
Modern Climatology
108
flash, quantitatively defined as the “rain yield”, varies considerable with location. In general, heavy rain associated with monsoon or oceanic convection show rain yields of the order of 109 – 1010 kg fl-1, while continental convective thunderstorms show much smaller values of 107 – 108 kg fl-1 (Williams et al., 1992; Petersen and Rutledge, 1998). Zipser (1994) found that the number of thunder days associated with heavy rain in tropical monsoon and oceanic storm regions was significantly lower than that in continental rainfall regimes. Observing the results of several studies at various geographical locations, Petersen and Rutledge (1998) concluded that the rain yield varied by a factor of 10 or more at any given location and by a factor of up to 103 between different locations and rainfall regimes. At the lower end, values of around 5x10⁷ kg fl-1 were found in the arid south-western United States. A wide section of the mid-continental United States showed remarkably stable values clustered near 108 kg fl-1, as did a landlocked station in Botswana within the African subcontinent. In tropical locations, the rain yields increased systematically from a continental value of 4x10⁸ kg fl-1 to a maritime value of 1010 kg fl-1 in the western Pacific Ocean. Williams et al. (1992) identified two distinct rainfall regimes in Darwin in continental northern Australia. Rain yields for tropical continental break period thunderstorms and tropical oceanic thunderstorms differed by almost an order of magnitude, being 3x10⁸ kg fl-1 and 2x10⁹ kg fl-1 respectively. Similarly, rain yields for break and monsoon period convection that occurred offshore over Melville and Bathurst Islands near Darwin showed values of 8x10⁸ kg fl-1 and 8x10⁹ kg fl-1 respectively.
Williams et al. (1992) attributed the contrasting lightning activity in the two types of rainfall regimes to differences in convective available potential energy (CAPE). Many studies have demonstrated a strong increase in lightning activity with CAPE (Williams et al., 1992; Petersen et al., 1996). This is not surprising as CAPE bears a strong relationship to the potential wet bulb temperature, Tw, - a parameter that increases with temperature and humidity – both of which lead to an increase in lightning activity (Williams and Renno, 1993). Williams et al. (1992) showed that a 1ºC change in Tw resulted in a change in CAPE of about 1 kJ kg-1. The mean daily maximum surface Tw in Darwin during the 1988-89 wet season dropped by about 2ºC from the break periods to the monsoon periods. Highly active lightning storms occurred during the break periods while relatively little lightning was observed in the monsoonal storms. The mean values of CAPE during the two periods were 2000 J kg-1 and 800 J kg-1 respectively. The corresponding lightning flash rates observed over an area of 40,000 km2 were about 1000 and 100 per day respectively.
Continental land surface is systematically hotter than the sea. This gives rise to greater CAPE, atmospheric instability and stronger air motions that are vital for deep convection and thunderstorm formation. Although the total rainfall is about the same, lightning activity over land is an order of magnitude greater than over the oceans (Orville and Henderson, 1986). Thus, maritime stations, in general, have a higher rain yield than continental stations.
An alternative hypothesis for the land-ocean contrast in lightning is based on differences
in boundary layer aerosol concentrations (Rosenfeld and Lensky, 1998). Continental air is
more polluted than ocean air and contains more cloud condensation nuclei. Typical
concentrations range from 100-200 cm-3 over the oceans to values greater than 1000 cm-3
over land. The resultant larger numbers of smaller cloud droplets at continental locations
give rise to a dominance of diffusional droplet growth and suppressed coalescence. This
www.intechopen.com

Thunderstorm and Lightning Climatology of Australia
109
leads to a reduction in rainfall and allows liquid water to ascend to the higher mixed
phase region of thunderclouds where strong electrification takes place. The net result is
increased lightning activity, reduced rainfall and reduced rain yields at continental
stations when compared to maritime stations.
A further possible explanation for the contrast in lightning and rainfall characteristics between land and ocean thunderstorms is based on cloud base height (Williams and Stanfill, 2002). They argue that higher cloud base heights provide larger updraught widths and reduced dilution by mixing – two factors that promote lightning activity. It has been shown that lightning flash rate increases with cloud base height (Williams et al, 2004). Typically, cloud base heights over the maritime and continental locations are about 500 m and 3000 m respectively and the associated lightning flash rates between these two locations differed by an order of magnitude.
7.2 Rainfall climatology of Australia
The continent of Australia contains a diverse range of climatic zones. The tropical northern and eastern coastal rim is generally humid and experiences heavy rainfall in the summer. The continental interior is largely arid and the southern regions are mostly temperate. The average rainfall in Australia is 450 mm. Around 80% of the landmass has a median rainfall less than 600 mm per year with 50% less than 300 mm. Large areal pockets within South and West Australia have less than 150 mm. The vast interior of the continent has a median annual rainfall of less than 200 mm. This region is not normally exposed to moist air masses for extended periods and rainfall is irregular. However, in favourable synoptic situations, which occur infrequently over extensive parts of the region, up to 400 mm of rain may fall within a few days and cause widespread flooding. The region with the highest annual rainfall is the east coast of Queensland near Cairns, with some stations recording over 3000 mm per year.
Owing to its low relief, compared to other continents, Australia causes little obstruction to the atmospheric systems that control the climate. However, as outlined earlier, the rainfall pattern is strongly seasonal in character, with a winter rainfall regime in the south and a summer regime in the north. During the Southern Hemisphere winter (May-October), huge anticyclonic high pressure systems transit from west to east across the continent and may remain almost stationary over the interior for several days. Northern Australia is thus influenced by mild, dry south-east winds, while southern Australia experiences cool, moist westerly winds. During the winter, frontal systems passing from the west to the east over the Southern Ocean have a controlling influence on the climate of southern Australia, causing rainy periods. In the summer months (November-April), the anticyclones move in a more southerly track along the coast, directing easterly winds over the continent and providing fine, hot weather in southern Australia. During this season, northern Australia is heavily influenced by the intertropical convergence zone. The associated intrusion of warm moist air gives rise to hot and humid conditions. Heavy rain may be prevalent for two to three weeks at a time due to tropical depressions caused by monsoonal low-pressure troughs. Thus, in contrast to the wet summer/ dry winter typical of Darwin and Brisbane, Adelaide and Perth show the wet winter/dry summer pattern whereas Sydney, Melbourne, Canberra and Hobart show a relatively uniform pattern of rainfall throughout the year.
www.intechopen.com
Modern Climatology
110
Rainfall frequency can be described in terms of rain-days. A rain-day is defined as a 24-hour period, usually from 9 am to 9 am the next day, when more than 0.2 mm of rain is recorded. The frequency of rain-days does not necessarily correlate well with the annual rainfall. For example, the frequency exceeds 150 rain-days per year in parts of the north Queensland coast where the annual rainfall is over 2000 mm, as well as in much of southern Victoria and in the extreme south-west of Western Australia where it is not more than about 600 mm. Over most of the continent the frequency is less than 50 rain-days per year. In the high rainfall areas of northern Australia, the number of rain-days is about 80 per year, but much heavier falls occur in this region than in southern regions.
7.3 Geographical and seasonal distribution of rainfall yield in Australia and its relationship with lightning ground flash density
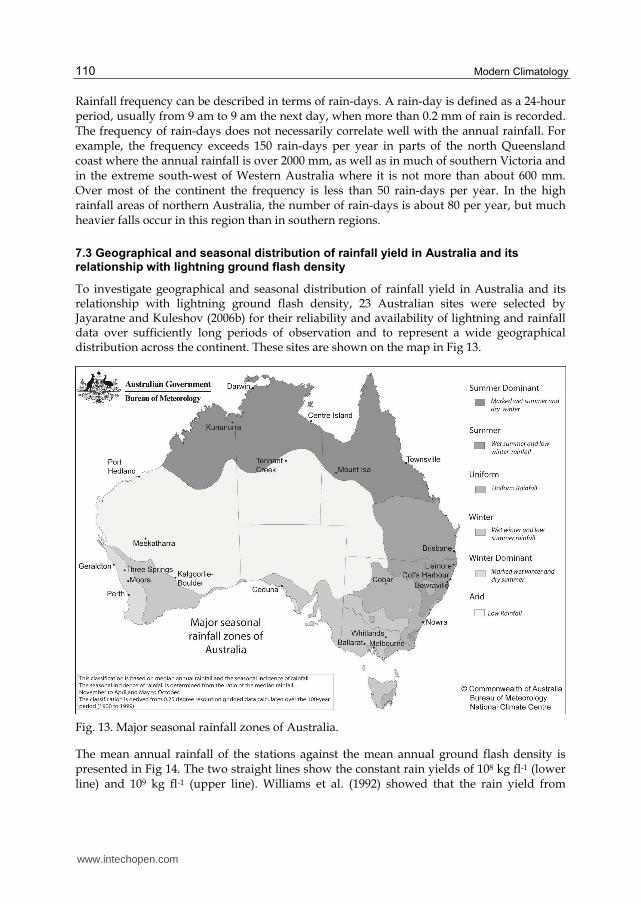
To investigate geographical and seasonal distribution of rainfall yield in Australia and its relationship with lightning ground flash density, 23 Australian sites were selected by Jayaratne and Kuleshov (2006b) for their reliability and availability of lightning and rainfall data over sufficiently long periods of observation and to represent a wide geographical distribution across the continent. These sites are shown on the map in Fig 13.
Fig. 13. Major seasonal rainfall zones of Australia.
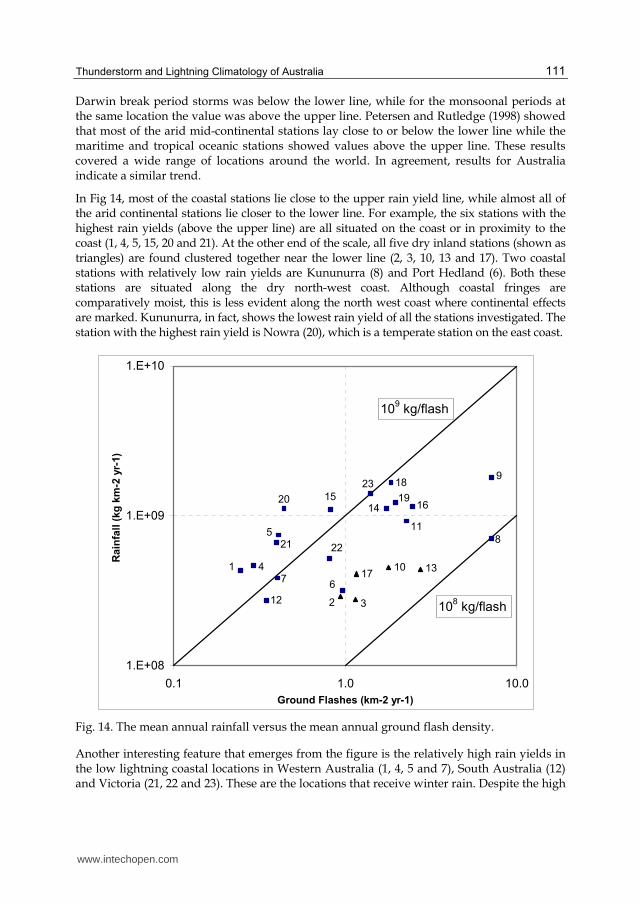
The mean annual rainfall of the stations against the mean annual ground flash density is presented in Fig 14. The two straight lines show the constant rain yields of 108 kg fl-1 (lower line) and 109 kg fl-1 (upper line). Williams et al. (1992) showed that the rain yield from
www.intechopen.com
Thunderstorm and Lightning Climatology of Australia
111
Darwin break period storms was below the lower line, while for the monsoonal periods at the same location the value was above the upper line. Petersen and Rutledge (1998) showed that most of the arid mid-continental stations lay close to or below the lower line while the maritime and tropical oceanic stations showed values above the upper line. These results covered a wide range of locations around the world. In agreement, results for Australia indicate a similar trend.
In Fig 14, most of the coastal stations lie close to the upper rain yield line, while almost all of the arid continental stations lie closer to the lower line. For example, the six stations with the highest rain yields (above the upper line) are all situated on the coast or in proximity to the coast (1, 4, 5, 15, 20 and 21). At the other end of the scale, all five dry inland stations (shown as triangles) are found clustered together near the lower line (2, 3, 10, 13 and 17). Two coastal stations with relatively low rain yields are Kununurra (8) and Port Hedland (6). Both these stations are situated along the dry north-west coast. Although coastal fringes are comparatively moist, this is less evident along the north west coast where continental effects are marked. Kununurra, in fact, shows the lowest rain yield of all the stations investigated. The station with the highest rain yield is Nowra (20), which is a temperate station on the east coast.
6
11
7
8
9
1
12
4
191516
5
18
1420
21 22
23
131017
32
1.E+08
1.E+09
1.E+10
0.1 1.0 10.0
Ground Flashes (km-2 yr-1)
Rain
fall
(kg
km
-2 y
r-1)
109 kg/flash
108 kg/flash
Fig. 14. The mean annual rainfall versus the mean annual ground flash density.
Another interesting feature that emerges from the figure is the relatively high rain yields in the low lightning coastal locations in Western Australia (1, 4, 5 and 7), South Australia (12) and Victoria (21, 22 and 23). These are the locations that receive winter rain. Despite the high
www.intechopen.com
Modern Climatology
112
winter rainfall, lightning activity during this time is low owing to the low surface temperatures and CAPE. The coastal stations in New South Wales and Queensland (14, 15, 16, 17, 18, 19 and 20) receive most of its annual rainfall during the summer months when high surface temperatures give rise to higher CAPE and lightning activity.
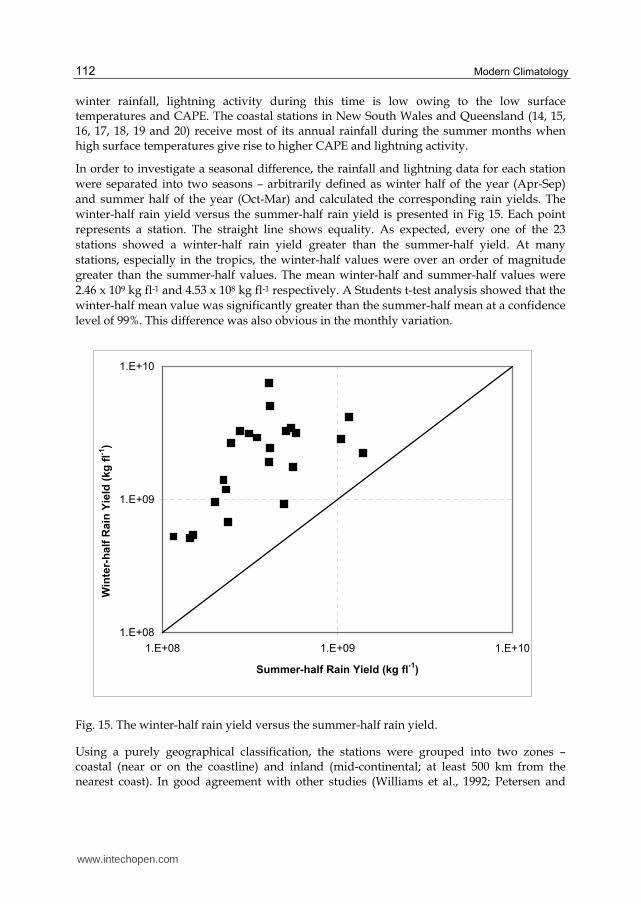
In order to investigate a seasonal difference, the rainfall and lightning data for each station
were separated into two seasons – arbitrarily defined as winter half of the year (Apr-Sep)
and summer half of the year (Oct-Mar) and calculated the corresponding rain yields. The
winter-half rain yield versus the summer-half rain yield is presented in Fig 15. Each point
represents a station. The straight line shows equality. As expected, every one of the 23
stations showed a winter-half rain yield greater than the summer-half yield. At many
stations, especially in the tropics, the winter-half values were over an order of magnitude
greater than the summer-half values. The mean winter-half and summer-half values were
2.46 x 10⁹ kg fl-1 and 4.53 x 10⁸ kg fl-1 respectively. A Students t-test analysis showed that the
winter-half mean value was significantly greater than the summer-half mean at a confidence
level of 99%. This difference was also obvious in the monthly variation.
1.E+08
1.E+09
1.E+10
1.E+08 1.E+09 1.E+10
Summer-half Rain Yield (kg fl-1
)
Win
ter-
ha
lf R
ain
Yie
ld (
kg
fl-1
)
Fig. 15. The winter-half rain yield versus the summer-half rain yield.
Using a purely geographical classification, the stations were grouped into two zones – coastal (near or on the coastline) and inland (mid-continental; at least 500 km from the nearest coast). In good agreement with other studies (Williams et al., 1992; Petersen and
www.intechopen.com

Thunderstorm and Lightning Climatology of Australia
113
Rutledge, 1998), the mean rain yield in Australia (Table 6) for the mid-continental stations (2.64 x 10⁸ kg fl-1) was lower than the corresponding overall mean value of the coastal stations (9.91 x 10⁸ kg fl-1) (Jayaratne and Kuleshov, 2006b).
In attempting to look for trends in relation to climatic conditions, it was necessary to
identify the various climatic zones in Australia. Jayaratne and Kuleshov (2006b) used the
classification proposed by the ABM based on Gaffney (1971) and grouped the stations into
six seasonal rainfall zones as shown in the map in Fig 13. The zones are listed in Table 7,
together with the stations in each zone and the corresponding zonal station mean annual
rainfalls, ground flash densities and rain yields. The annual rainfall in the two summer
rainfall zones, S and SD, were significantly higher than in the two winter rainfall zones, W
and WD. However, the converse was true for the rain yield, with the W and WD values
being significantly higher than those for S and SD. The mean rain yields for groups S and SD
was 5.44 x 10⁸ kg fl-1 and for groups W and WD it was 1.28 x 10⁹ kg fl-1 – a difference of over
a factor of two. Statistical analyses showed that the winter zone rain yields were
significantly higher than both the summer zone and arid zone values at a confidence level of
95%. The rainfall and rain yield in the arid zone, A, was significantly lower than in all other
zones. As expected, the ground flash densities were highest in the two seasonal rainfall
zones S and SD.
Zone Notation Mean Rain Yield(x108 kg fl-1)
Inland I 2.64
Northern Coastal NC 2.52
Eastern Coastal EC 10.9
Southern Coastal SC 10.3
Western Coastal WC 12.9
All Coastal 9.91
Table 6. The stations classified according to geographical location. Also shown in the last row is the overall mean for all coastal stations.
Zone NotationMean Rainfall
(x108 kg km-2 yr-1)
Mean Ground Flash Density, Ng
(fl km-2 yr-1)
Mean Rain Yield (x108 kg fl-1)
Summer S 12.9 2.00 6.59
Summer Dominant
SD 9.96 4.02 4.52
Uniform U 7.64 0.80 14.5
Winter W 7.16 0.74 10.3
Winter Dominant
WD 5.06 0.34 15.3
Arid A 3.35 1.21 2.84
Table 7. The stations classified according to the six major seasonal rainfall zones.
www.intechopen.com
Modern Climatology
114
In agreement with previous studies, the present results in Australia show increased rain yields at coastal stations over inland stations and during the winter over the summer seasons. These observations are broadly explicable in terms of the differences in surface heating between the two seasons and between the geographical locations. Greater surface heating is related to higher cloud base height and greater CAPE, both of which have been linked with higher lightning activity (Williams et al, 2005; Williams and Renno, 1993). Moreover, the air over inland stations contain higher aerosol and cloud condensation nuclei concentrations than coastal stations and, by the explanation given in the introduction, may exhibit higher lightning activity, lower rainfall and lower rain yields.
8. Summary and conclusions
In this chapter, a review of thunderstorm and lightning climatology of Australia, with emphasis on spatial distribution and frequency of thunder-days and lightning flash density over the Australian continent, was presented. Thunderstorms are most frequent over the northern half of the country, and generally decrease southward, with lowest frequencies in southeast Tasmania. A secondary maximum is also apparent in southeast Queensland and over central and eastern New South Wales, extending into the north-eastern Victorian highlands.
Long-term lightning data obtained by Australian ground-based lightning flash counters as well as lightning data gathered by the NASA satellite-based instruments (OTD and LIS), have been used in order to analyze spatial distribution and frequency of lightning activity in Australia. The lightning data were used to produce lightning flash density maps, the first for Australia. Long-term records of thunder-days registered at the Australian stations were also used to produce updated thunder-day map.
In general, the geographical distribution of lightning incidence expressed as total lightning flash density, Nt, (i.e. cloud-to-ground and intracloud flashes) demonstrates high level of lightning activity (Nt>10 km-2 yr-1) in the northern parts of Australia and a decrease in total flashes southwards (Nt<5 km-2 yr-1 in Victoria, the southern parts of Western and Southern Australia, and Tasmania). The peak lightning occurrence is in the north-western part of the Australian continent with Nt values above 30 km-2 yr-1 centred around 16° S 126° E. Secondary maxima are evident over the north-eastern part of the Northern Territory and northern part of Queensland, and over the eastern parts of Queensland and New South Wales, with Nt values up to 10 km-2 yr-1. Spatial distribution of lightning occurrence is in general agreement with the spatial distribution of thunderstorms as it is presented in the map of average annual thunder-days for Australia.
Seasonal distributions of lightning occurrence demonstrate predominance of lightning in Australia in warmer months, with peak occurrence of lightning in January. In the northern half of the country, development of thunderstorms and lightning is enhanced by high boundary-layer moisture levels and lower surface pressure in the wet season months (October – April). Seasonal distribution of lightning activity in higher latitudes is more uniform; lightning is still more frequent in warmer months, but it also occurs in cooler months (May - September) in association with active frontal systems.
A reduction in lightning total flash density, Nt, by a factor of about 10 for a change in
latitude from 10º S to 40º S was found, and this is in agreement with the earlier studies. The
www.intechopen.com
Thunderstorm and Lightning Climatology of Australia
115
variation of Nt for the range of latitudes over the Australian continent is approximately
expressed by the empirical relationship Nt = exp(3.85 – 0.088λ) km-2 yr-1, where λ is the
magnitude of the latitude in degrees. It appears that the main explanation for the annual
variation in monthly flash density and latitudinal variation in annual flash density across
the Australian continent is found in the variation in wet bulb temperature and convective
available potential energy (CAPE).
Time series of Td for several Australian tropical and subtropical observational sites have
been examined. For about the 50 year period, it would appear that there has been a small
upward trend in Td for all sites, possibly followed by a subsequent downward trend.
However, the longer-term Td data (118 years) for Brisbane appear to indicate both upward
and downward trends. The effects of climate change on thunderstorms in Australia need to
be studied in much greater detail, because thunderstorms and lightning are temperature-
sensitive weather phenomena.
CAPE is the driving force for thunderstorm development and it is closely controlled by
wet bulb temperature. The lightning activity over continental Australia was studied as a
function of wet bulb temperature and it was found that the monthly total of lightning
ground flashes, N, increased sharply with the increase of the monthly mean daily
maximum wet bulb temperature, Tw,max. The dependence was strongest in the tropics and
became less pronounced at temperate latitudes. In Darwin, located at latitude 12S, a
modest 3-4C increase in wet bulb temperature increased the lightning activity by over
two orders of magnitude. Similar increases were found at other tropical stations. The
corresponding increases for Coffs Harbour (latitude 30S) and for Melbourne (latitude
38S) were about one and a half orders of magnitude and about half an order of
magnitude respectively, each over a 10C range of Tw,max. Power law approximations were
derived for each of the ten stations and showed that the logarithm of N was directly
proportional to the power, P, of Tw,max. The value of P showed a sharp exponential
decrease with increasing latitude away from the equator. A possible reason attributed for
this behaviour is the sensitive dependence of wet bulb temperature on CAPE – the driving
force for thunderstorm development.
Ground-based observations of annual rainfall and lightning incidence around the continent
of Australia were used to compute values of ‘rain yield’, defined as the mass of rain
produced per lightning ground flash (units: kg fl-1) over a given area of ground. The rain
yield was found to vary considerably with geographical location, season and climatic
conditions. Mid-continental stations showed a mean rain yield of 2.64 x 10⁸ kg fl-1 in contrast
to the coastal and near-coastal stations that showed a corresponding mean value of 9.91 x
108 kg fl-1. When the stations were classified according to seasonal climate zones, the winter
and winter-dominant rainfall stations showed a rain yield of 1.28 x 10⁹ kg fl-1 while the
summer and summer-dominant rainfall stations showed a significantly lower value of 5.44 x
108 kg fl-1. Mean winter rain yields were significantly higher than the summer values. These
differences are attributed to surface heating which controls such parameters as cloud base
height and CAPE in the atmosphere. In terms of the behaviour of the rain yield with
geographical, seasonal and climatic conditions, the Australian observations are in good
agreement with studies in other parts of the world.
www.intechopen.com
Modern Climatology
116
9. Acknowledgement
Author expresses his gratitude to long term collaborators on Australian lightning studies Professors Mat Darveniza, David Mackerras and Rohan Jayaratne.
10. References
Anderson, R. B., and A. J. Eriksson (1980), Lightning parameters for engineering
application, Electra, 69, 65-102.
Anderson, R. B., A. J. Eriksson, H. Kroninger, D. V. Meal, and M. A. Smith (1984),
Lightning and thunderstorm parameters, Paper presented at IEEE Int. Conf.
Lightning and Power Systems, London, UK.
Anderson, R. B., H. R. van Niekerk, S. A. Prentice, and D. Mackerras (1979), Improved
Lightning Flash Counter, Electra, 66, 85-98.
Baral, K. N., and D. Mackerras (1993), Positive cloud-to-ground lightning discharges in
Kathmandu thunderstorms, J. Geophys. Res., 98, 10,331-10,340.
Barham, R. A., and D. Mackerras (1972), Vertical-aerial CIGRE-type lightning flash
counter, Electron. Lett., 8, 480-482.
Battan, L.J. (1965). Some factors governing precipitation and lightning from convective
clouds. J. Atmos. Sci., vol. 22, pp. 79-84.
Bernardi, M., A. Pigini, G. Diendorfer, and W. Schulz (2002), Long term experience on
lightning acquisition in Italy and Austria and data application to the
improvement of lightning performance, CIGRE Rep. 33-205, Cons. Int. des Grands
Reseaux Electr., Paris.
Boccippio, D. J., K. L. Cummins, H. J. Christian, and S. J. Goodman (2001), Combined satellite- and surface-based estimation of the intracloud-cloud-to-ground lightning ratio over the continental United States, Mon. Weather Rev., 129, 108-122.
Brook, M., M. Nakano, and P. Krehbiel (1982), The electrical structure of the Hokuriku
winter thunderstorms. J. Geophys. Res. 87, C2, 1207-1215.
Cheze, J.L. and Sauvageot, H. (1997). Area average rainfall and lightning activity. J.
Geophys. Res., vol. 102, 1707-1715.
Christian, H. J., K. T. Driscoll, S. J. Goodman, R. J. Blakeslee, D. A. Mach, and D. E.
Buechler (1996), The Optical Transient Detector (OTD), paper presented at 10th
Int. Conf. on Atmospheric Electricity; Osaka, Japan; 10-14 June.
Christian, H. J., R. J. Blakeslee, S. J. Goodman, D. A. Mach, M. F. Stewart, D. E. Buechler,
W. J. Koshak, J. M. Hall, W. L. Boeck, K. T. Driscoll, and D. J. Bocippio (1999), The
Lightning Imaging Sensor, paper presented at 11th Int. Conf. on Atmospheric
Electricity, Guntersville, Alabama, 7-11 June.
Christian, H. J., R. J. Blakeslee, D. J. Boccippio, W. L. Boeck, D. E. Buechler, K. T. Driscoll,
S. J. Goodman, J. M. Hall, W. J. Koshak, D. M. Mach, and M. F. Stewart (2003),
Global frequency and distribution of lightning as observed from space by the
Optical Transient Detector, J. Geophys. Res., 108(D1), 4005, doi:10.1029/
2002JD002347.
www.intechopen.com
Thunderstorm and Lightning Climatology of Australia
117
Cummins, K.L., M.J. Murphy, E.A. Bardo, W.L. Hiscox, R.B. Pyle, and A.E. Pifer (1998), A
combined TOA/MDF technology upgrade of the U.S. National Lightning
Detection Network, J. Geophys. Res., 103, 9035-9044.
Gaffney, D.O. (1971). Seasonal rainfall zones in Australia. Bureau of Meteorology.
Working papers. No. 141, 9 p.
GPATS website, www.gpats.com.au
Huschke, R. E. (Ed.) (1959), Glossary of Meteorology, 638 pp., Am. Meteorol. Soc., Boston,
Massachusetts.
Intergovernmental Panel on Climate Change (IPCC) (2007), Climate Change 2007, the
Fourth Assessment Report, WMO and UNEP, Geneva, Switzerland.
Jayaratne ER (1993) Conditional instability and lightning incidence in Gaborone,
Botswana. Meteorol Atmos Phys 52: 169-175
Jayaratne, E. R. and Y. Kuleshov (2006a), The relationship between lightning activity and surface wet bulb temperature, Meteorol. Atmos. Phys., 91, 17-24, doi:10.1007/s00703-004-0100-0.
Jayaratne, E. R. and Kuleshov (2006b), Geographical and seasonal characteristics of the
relationship between lightning ground flash density and rainfall within the
continent of Australia, Atmospheric Research, vol 79, no 1, pp. 1-14.
Jayaratne, E.R., Ramachandran, V., Devan, K.R.S. (1995). Observations of lightning flash rates and rain gushes in Gaborone, Botswana. J. Atmos. Terr. Phys. 57 (4), 325-331.
Kattron website, www.lightning.net.au
Kinzer, G. (1974). Cloud-to-ground lightning versus radar reflectivity in Oklahoma
thunderstorms. J. Atmos. Sci. 31, 787-799.
Koike, M.; Y. Kondo, K. Kita, N. Takegawa, N. Nishi, T. Kashihara, S. Kawakami, S. Kudoh, D. Blake, T. Shirai, B. Liley, M. Ko, Y. Miyazaki, Z. Kawasaki, and T. Ogawa (2007), Measurements of reactive nitrogen produced by tropical thunderstorms during BIBLE-C, J. Geophys. Res., 112, D18304, doi:10.1029/2006JD008193.
Kuleshov, Y., G. de Hoedt, W. Wright, and A. Brewster (2002), Thunderstorm distribution
and frequency in Australia, Austral. Meteorol. Mag. 51, 145-154.
Kuleshov, Y., and E. R. Jayaratne (2004), Estimates of lightning ground flash density in Australia and its relationship to thunder-days, Austral. Meteorol. Mag. 53, 189-196.
Kuleshov, Y., D. Mackerras, and M. Darveniza (2006), Spatial distribution and frequency
of lightning activity and lightning flash density maps for Australia. J. Geophys.
Res., 111, D19105, doi:10.1029/2005JD006982.
Kuleshov, Y., D. Mackerras, and M. Darveniza (2010), Spatial Distribution and Frequency
of Thunderstorms and Lightning in Australia. Chapter 8, in Lightning: Principles,
Instruments and Applications. H.D. Betz et al. (eds), Springer Science + Business
Media B.V., 189-209, doi 10.1007/978-1-4020-9079-0_8.
Kuleshov, Y., P. Hettrick, D. Mackerras, M. Darveniza and E. R. Jayaratne (2011),
Occurrence of positive and negative polarity cloud-to-ground lighting flashes:
Case study of CGR4 and GPATS data for Brisbane, Australia. Australian
Meteorological and Oceanographic Journal, 61,107-112.
www.intechopen.com
Modern Climatology
118
Lightning Protection (2007), Australian Standard/New Zealand Standard 1768-2007, 188
pp., Standards Australia, Sydney, Australia and Standards Association of New
Zealand, Wellington, New Zealand.
Mackerras, D. (1978), Prediction of lightning incidence and effects in electrical systems,
Electr. Eng. Trans. Int. Eng. Austral. 73-77.
Mackerras, D. (1985), Automatic short-range measurement of the cloud flash to ground
flash ratio in thunderstorms, J. Geophys. Res. 90, 6,195-6,201.
Mackerras, D., and M. Darveniza (1992), Design and performance of CGR3 instruments
for measuring the cloud flash-to-ground flash ratio in thunderstorms, Internal
Report EE92/2, 99 pp., Univ. of Queensland, St. Lucia, Australia.
Mackerras, D. and M. Darveniza (1994), Latitudinal variation of lightning occurrence
characteristics, J. Geophys. Res. 99, 10,813-10,821.
Mackerras, D., M. Darveniza, R. E. Orville, E. R. Williams, and S. J. Goodman (1998),
Global lightning: Total, cloud and ground flash estimates, J. Geophys. Res. 103,
19,791-19,809.
Mackerras, D., M. Darveniza and P. Hettrick (2009), The CGR4 lightning sensor, Austral.
Meteorol. and Oceanograph. J., 58, 263-273.
Moore, C.B., Vonnegut, B., Machado, J.A., Survilas, H.J. (1962). Radar observations of rain
gushes following overhead lightning strokes. J. Geophys. Res. 67, 207-220.
Mushtak, V., E. Williams, and D. Boccippio (2005), Latitudinal variations of cloud base
height and lightning parameters in the tropics , Atm. Res. 76, 222-230.
Orville, R. E., and G. R. Huffines (2001), Cloud-to-ground lightning in the United States:
NLDN results in the first decade, 1989-98, Mon. Weather Rev., 129, 1179-1193.
Orville, R.E., and W. Spencer (1979), Global lightning flash frequency, Mon. Weather Rev.,
107, 934-943.
Orville, R.E., Henderson, R.W. (1986). Global distributions of midnight lightning:
September 1977 to August 1978. Mon. Weather Rev. 114, 2640-2653.
Piepgrass, M.V., Krider, E.P., Moore, C.B. (1982). Lightning and surface rainfall during
Florida thunderstorms. J. Geophys. Res. 87, 11193-11201.
Pierce, E. T. (1956), The influence of individual variations in the field changes due to
lightning discharges upon the design and performance of lightning flash
counters, Archiv für Meteorologie, Geophysik und Bioclimatologie, Serie A:
Meteorologie Und Geophysik, Band 9, 78-86.
Petersen, W.A., and S.A. Rutledge (1992), Some characteristics of cloud-to-ground
lightning in tropical northern Australia. J. Geophys. Res., 97, 11553-11560.
Peterson WA, Rutledge SA (1998), On the relationship between cloud to ground lightning
and convective rainfall. J Geophys Res 103: 14025-14040
Peterson WA, Rutledge SA, Orville RE (1996), Cloud to ground lightning observations
from TOGA COARE: selected results and lightning location algorithms. Mon
Wea Rev 124: 602-620.
Pinto, O., Jr., K. P. Naccarato, I. R. C. A. Pinto, W. A. Fernandes, and O. Pinto Neto (2006), Monthly distribution of cloud-to-ground lightning flashes as observed by lightning location systems. Geophys. Res. Lett., 33, L09811, doi:10.1029/2006GL026081.
www.intechopen.com
Thunderstorm and Lightning Climatology of Australia
119
Reap, R.M., MacGorman, D.R. (1989), Cloud-to-ground lightning: climatological
characteristics and relationships to model fields, radar observations, and severe
local storms. Mon. Wea. Rev. 117, 518-535.
Rosenfeld, D., Lensky, I.M. (1998), Satellite-based insights into precipitation formation
processes in continental and maritime convective clouds. Bull. Amer. Meteorol.
Soc. 79, 2457-2476.
Rutledge S. A., E. R. Williams, and T. D. Keenan (1992), The Down Under Doppler and
Electricity Experiment (DUNDEE): Overview and Preliminary results, Bull. Am.
Meteorol. Soc., 73(1), 3-15.
Schulz, W., K. Cummins, G. Diendorfer, and M. Dorninger (2005), Cloud-to-ground
lightning in Austria: a 10-year study using data from a lightning location system.
J. Geophys. Res. 110, D09101, doi:10.1029/2004JD005332.
Shackford, C.R. 1960. Radar indications of a precipitation-lightning relationship in New
England thunderstorms. J. Meteor. 17, 15-19.
Soriano, L. R., F. de Pablo, and C. Tomas (2005), Ten-year study of cloud-to-ground
lightning activity in the Iberian Peninsula, J. Atmos. Terr. Phys., 67(16), 1632-1639.
Takeuti, T., M. Nakano, M. Brook, D. J. Raymond, and P. Krehbiel (1978), The anomalous
winter thunderstorms of the Hokuriku Coast. J. Geophys. Res. 83, C5, 2385-2394.
Thery, C. (2001), Evaluation of LPATS data using VHF interferometric observations of
lightning flashes during the Eulinox experiment, Atmos. Res., 56, 397-409.
Williams, E. R. (1992), The Schumann resonance: A global tropical thermometer, Science,
256, 1184-1187.
Williams, E.R. (1994), Global circuit response to seasonal variations in global surface air
temperature. Mon Wea Rev 122: 1917-1929.
Williams, E. R. (1995), Meteorological aspects of thunderstorms, in Handbook of Atmospheric Electrodynamics, edited by H. Volland, pp. 27-60, CRC Press, London, UK.
Williams, E. R., S. A. Rutledge, S. G. Geotis, N. Renno, E. Rasmussen, and T. Rickenbach
(1992), A radar and electrical study of tropical “hot towers”, J. Atmos. Sci. 49:
1,386-1,395.
Williams, E., and S. Stanfill (2002), The physical origin of the land-ocean contrast in
lightning activity, C. R.-Acad. Sci., Phys. 3, 1277-1292.
Williams, E., V. Mushtak, D. Rosenfeld, S. Goodman, and D. Boccippio (2005),
Thermodynamic conditions favorable to superlative thunderstorm updraft,
mixed phase microphysics and lightning flash rate, Atm. Res. 76, 288-306.
Williams, E.R., and Renno, N. (1991), Conditional instability, tropical lightning,
ionospheric potential and global change. 19th Conf on Hurricanes and Tropical
Meteorology, Miami, Florida
Williams, E.R., and Renno, N. (1993), An analysis of the conditional instability of the
tropical atmosphere. Mon. Wea. Rev. 121, 21-36.
Williams, E.R., Mushtak, V., Rosenfeld, D., Goodman, S., Boccippio, D. (2005).
Thermodynamic conditions favourable to superlative thunderstorm updraft,
mixed phase microphysics and lightning flash rate. Atmos. Res. 76, 288-306.
www.intechopen.com
Modern Climatology
120
World Meteorological Organization (WMO) (1953), World distribution of thunderstorm
days. Part 1: Tables. WMO Publ. 21, TP 6, WMO, Geneva, Switzerland.
Uman, M.A. (1987), The lightning discharge, Dover Publication Inc
Zajac, B., and S. A. Rutledge (2000), Cloud-to-ground lightning activity in the contiguous
United States from 1995 to 1999, Mon. Weather Rev., 129, 999-1019.
Zipser, E.J. (1994), Deep cumulonimbus cloud systems in the tropics with and without
lightning. Mon. Wea. Rev. 122, 1837-1851.
www.intechopen.com
Modern ClimatologyEdited by Dr Shih-Yu Wang
ISBN 978-953-51-0095-9Hard cover, 398 pagesPublisher InTechPublished online 09, March, 2012Published in print edition March, 2012
InTech EuropeUniversity Campus STeP Ri Slavka Krautzeka 83/A 51000 Rijeka, Croatia Phone: +385 (51) 770 447 Fax: +385 (51) 686 166www.intechopen.com
InTech ChinaUnit 405, Office Block, Hotel Equatorial Shanghai No.65, Yan An Road (West), Shanghai, 200040, China
Phone: +86-21-62489820 Fax: +86-21-62489821
Climatology, the study of climate, is no longer regarded as a single discipline that treats climate as somethingthat fluctuates only within the unchanging boundaries described by historical statistics. The field hasrecognized that climate is something that changes continually under the influence of physical and biologicalforces and so, cannot be understood in isolation but rather, is one that includes diverse scientific disciplinesthat play their role in understanding a highly complex coupled "whole system" that is the earth's climate. Themodern era of climatology is echoed in this book. On the one hand it offers a broad synoptic perspective butalso considers the regional standpoint, as it is this that affects what people need from climatology. Aspects onthe topic of climate change - what is often considered a contradiction in terms - is also addressed. It is all tooevident these days that what recent work in climatology has revealed carries profound implications foreconomic and social policy; it is with these in mind that the final chapters consider acumens as to theapplication of what has been learned to date.
How to referenceIn order to correctly reference this scholarly work, feel free to copy and paste the following:
Yuriy Kuleshov (2012). Thunderstorm and Lightning Climatology of Australia, Modern Climatology, Dr Shih-YuWang (Ed.), ISBN: 978-953-51-0095-9, InTech, Available from: http://www.intechopen.com/books/modern-climatology/thunderstorm-and-lightning-climatology-of-australia

© 2012 The Author(s). Licensee IntechOpen. This is an open access articledistributed under the terms of the Creative Commons Attribution 3.0License, which permits unrestricted use, distribution, and reproduction inany medium, provided the original work is properly cited.