Embed Size (px)
Citation preview
DRO Deakin Research Online, Deakin University’s Research Repository Deakin University CRICOS Provider Code: 00113B
Time series analysis of tool wear in sheet metal stamping using acoustic emission
Citation: Shanbhag, V. Vignesh Vishnudas, Pereira, P. Michael, Rolfe, F. Bernard and Arunachalam, N 2017, Time series analysis of tool wear in sheet metal stamping using acoustic emission, Journal of Physics: Conference Series, vol. 896, conference 1, paper 012030, pp. 1-8.
DOI: http://www.dx.doi.org/10.1088/1742-6596/896/1/012030
©2017, The Authors
Reproduced by Deakin University under the terms of the Creative Commons Attribution Licence
Downloaded from DRO: http://hdl.handle.net/10536/DRO/DU:30102962
1
Content from this work may be used under the terms of the Creative Commons Attribution 3.0 licence. Any further distributionof this work must maintain attribution to the author(s) and the title of the work, journal citation and DOI.
Published under licence by IOP Publishing Ltd
1234567890
36th IDDRG Conference – Materials Modelling and Testing for Sheet Metal Forming IOP Publishing
IOP Conf. Series: Journal of Physics: Conf. Series 896 (2017) 012030 doi :10.1088/1742-6596/896/1/012030
Time series analysis of tool wear in sheet metal stamping using acoustic emission
Vignesh V. Shanbhag1, Michael P. Pereira1, Bernard F. Rolfe2 Arunachalam.N 3 1School of Engineering, Deakin University, Locked Bag 20000, Geelong, VIC 3220, Australia 2Institute for Frontier Materials, Deakin University, Locked Bag 20000, Geelong, VIC 3220, Australia 3Manufacturing Engineering Section, Indian Institute of Technology, Madras, India, 600036 E-mail: [email protected]
Abstract Galling is an adhesive wear mode that often affects the lifespan of stamping tools. Since stamping tools represent significant economic cost, even a slight improvement in maintenance cost is of high importance for the stamping industry. In other manufacturing industries, online tool condition monitoring has been used to prevent tool wear-related failure. However, monitoring the acoustic emission signal from a stamping process is a non-trivial task since the acoustic emission signal is non-stationary and non-transient. There have been numerous studies examining acoustic emissions in sheet metal stamping. However, very few have focused in detail on how the signals change as wear on the tool surface progresses prior to failure. In this study, time domain analysis was applied to the acoustic emission signals to extract features related to tool wear. To understand the wear progression, accelerated stamping tests were performed using a semi-industrial stamping setup which can perform clamping, piercing, stamping in a single cycle. The time domain features related to stamping were computed for the acoustic emissions signal of each part. The sidewalls of the stamped parts were scanned using an optical profilometer to obtain profiles of the worn part, and they were qualitatively correlated to that of the acoustic emissions signal. Based on the wear behaviour, the wear data can be divided into three stages: - In the first stage, no wear is observed, in the second stage, adhesive wear is likely to occur, and in the third stage severe abrasive plus adhesive wear is likely to occur. Scanning electron microscopy showed the formation of lumps on the stamping tool, which represents galling behavior. Correlation between the time domain features of the acoustic emissions signal and the wear progression identified in this study lays the basis for tool diagnostics in stamping industry.
1. Introduction The sheet metal stamping process is a mass manufacturing process employed in the automobile and aerospace industries to produce a variety of parts in terms of shape and size. On a mechanical press, sheet metal is clamped into the die and the punch is pressed against the sheet into the die cavity to make the required shape. Shearing, bending and drawing is incorporated in the stamping process to produce the components on the larger scale [1]. However, the stability of the metal forming process is normally dependant on the material and process parameters. A slight change in a process parameter, like material properties or lubrication condition, can produce a defect that can damage the tool. The tools in stamping process have a significant cost, which ranges from 1 to 62 million dollars (USD), depending on the complexity of the part to be produced (for example. outer body panels, bonnets etc.) [2]. Galling is a commonly observed wear mechanism on the stamping tool. Galling is an adhesive wear mechanism is caused by transfer and accumulation of the sheet material on the tool surface, which subsequently causes abrasive wear modes on the sheet surface [3]. Because of the complexity in the stamping process and due to high cost of tool, a new setup is required to monitor the tool continuously. Currently quality inspection stages are placed in the middle of production lines or at the end of production stage where the operators visually inspect the quality of the stamped parts. However, to monitor the large and complex shaped parts, a reliable setup is required. Apart from quality checks, sensors have been incorporated into some manufacturing processes to monitor tool wear [4-8]. Considerable condition monitoring studies have also been conducted in the stamping process using different sensors like strain, audio, borescope, thermocouple, force etc. [9-13]. Sah et al. [14] integrated force sensors into the die to study the contact pressure on the die radius during
2
1234567890
36th IDDRG Conference – Materials Modelling and Testing for Sheet Metal Forming IOP Publishing
IOP Conf. Series: Journal of Physics: Conf. Series 896 (2017) 012030 doi :10.1088/1742-6596/896/1/012030
the forming process. However, high noise produced during the stamping process made the tool wear study complex. In recent times, authors have attempted to use acoustic emissions to study wear because of its ability to work in the high frequency range (20kHz-2MHz) [15]. Skåre et al. [16] studied the wear and frictional behaviour of high strength steel using acoustic emission. Using AE, Sindi et al. [17] monitored the galling phenomena occurring in forming process on a tribo-test setup. Hase et al. [18] monitored the abrasive and adhesive wear phenomena using acoustic emission on a tribo-test setup. However, more study needs to be done to monitor galling progression in the stamping process using AE. To cater to the knowledge relating to wear progression and damage mechanisms in stamping, this investigation will analyse AE signals using time domain features to determine the wear initiation point and to identify wear stages. This study can be summarized as follows:
1. Study of AE signal behaviour for every part to study wear progression rather than specific parts or instants
2. Surface characterization of the die using scanning electron microscope (SEM) and parts using optical profilometry to study lump adhered to the tool and to obtain wear profiles of the worn parts.
3. Qualitatively correlating the AE signal behaviour to the wear profile of the stamped parts.
2. Experimental details
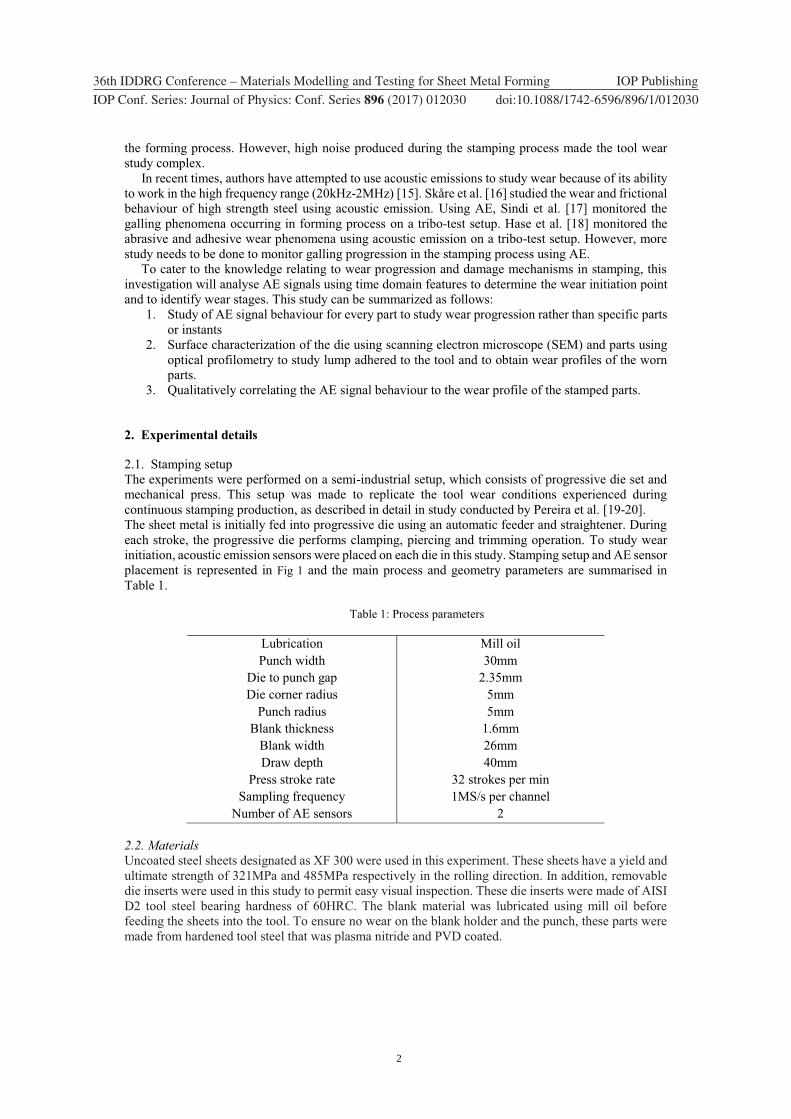
2.1. Stamping setup The experiments were performed on a semi-industrial setup, which consists of progressive die set and mechanical press. This setup was made to replicate the tool wear conditions experienced during continuous stamping production, as described in detail in study conducted by Pereira et al. [19-20]. The sheet metal is initially fed into progressive die using an automatic feeder and straightener. During each stroke, the progressive die performs clamping, piercing and trimming operation. To study wear initiation, acoustic emission sensors were placed on each die in this study. Stamping setup and AE sensor placement is represented in Fig 1 and the main process and geometry parameters are summarised in Table 1.
Table 1: Process parameters
Lubrication Mill oil Punch width 30mm
Die to punch gap 2.35mm Die corner radius 5mm
Punch radius 5mm Blank thickness 1.6mm
Blank width 26mm Draw depth 40mm
Press stroke rate 32 strokes per min Sampling frequency 1MS/s per channel
Number of AE sensors 2
2.2. Materials Uncoated steel sheets designated as XF 300 were used in this experiment. These sheets have a yield and ultimate strength of 321MPa and 485MPa respectively in the rolling direction. In addition, removable die inserts were used in this study to permit easy visual inspection. These die inserts were made of AISI D2 tool steel bearing hardness of 60HRC. The blank material was lubricated using mill oil before feeding the sheets into the tool. To ensure no wear on the blank holder and the punch, these parts were made from hardened tool steel that was plasma nitride and PVD coated.
3
1234567890
36th IDDRG Conference – Materials Modelling and Testing for Sheet Metal Forming IOP Publishing
IOP Conf. Series: Journal of Physics: Conf. Series 896 (2017) 012030 doi :10.1088/1742-6596/896/1/012030
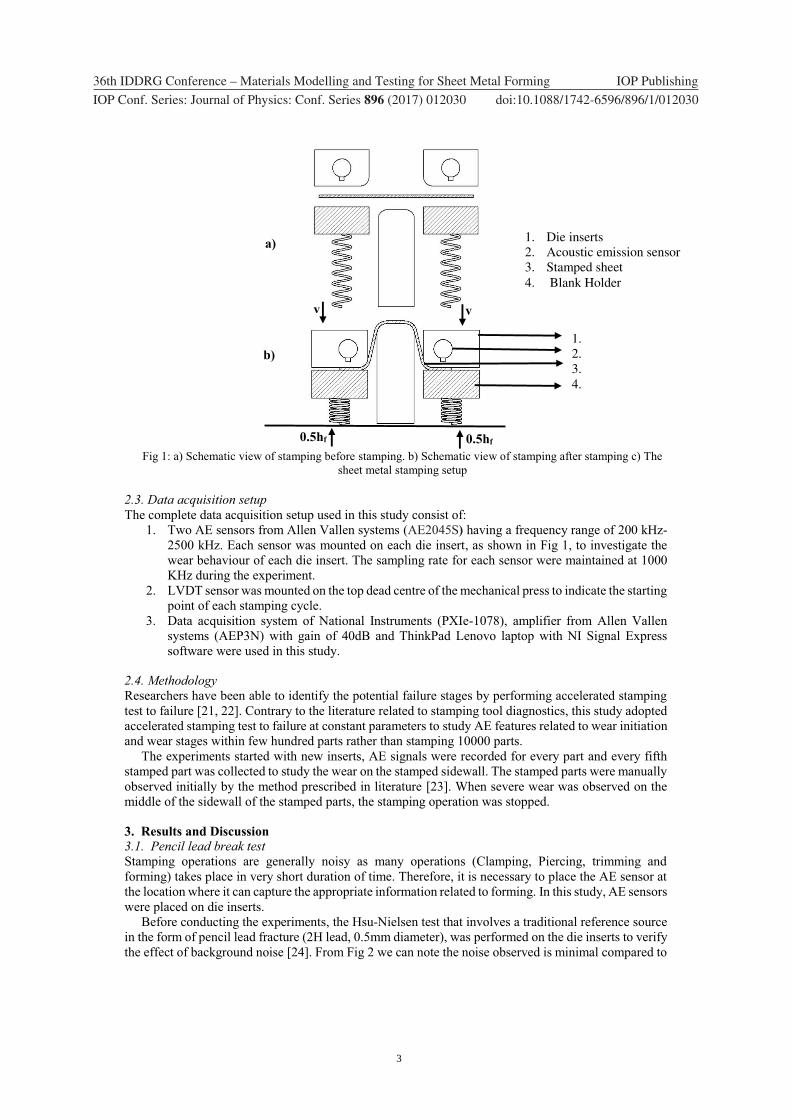
Fig 1: a) Schematic view of stamping before stamping. b) Schematic view of stamping after stamping c) The sheet metal stamping setup
2.3. Data acquisition setup The complete data acquisition setup used in this study consist of:
1. Two AE sensors from Allen Vallen systems (AE2045S) having a frequency range of 200 kHz-2500 kHz. Each sensor was mounted on each die insert, as shown in Fig 1, to investigate the wear behaviour of each die insert. The sampling rate for each sensor were maintained at 1000 KHz during the experiment.
2. LVDT sensor was mounted on the top dead centre of the mechanical press to indicate the starting point of each stamping cycle.
3. Data acquisition system of National Instruments (PXIe-1078), amplifier from Allen Vallen systems (AEP3N) with gain of 40dB and ThinkPad Lenovo laptop with NI Signal Express software were used in this study.
2.4. Methodology Researchers have been able to identify the potential failure stages by performing accelerated stamping test to failure [21, 22]. Contrary to the literature related to stamping tool diagnostics, this study adopted accelerated stamping test to failure at constant parameters to study AE features related to wear initiation and wear stages within few hundred parts rather than stamping 10000 parts. The experiments started with new inserts, AE signals were recorded for every part and every fifth stamped part was collected to study the wear on the stamped sidewall. The stamped parts were manually observed initially by the method prescribed in literature [23]. When severe wear was observed on the middle of the sidewall of the stamped parts, the stamping operation was stopped.
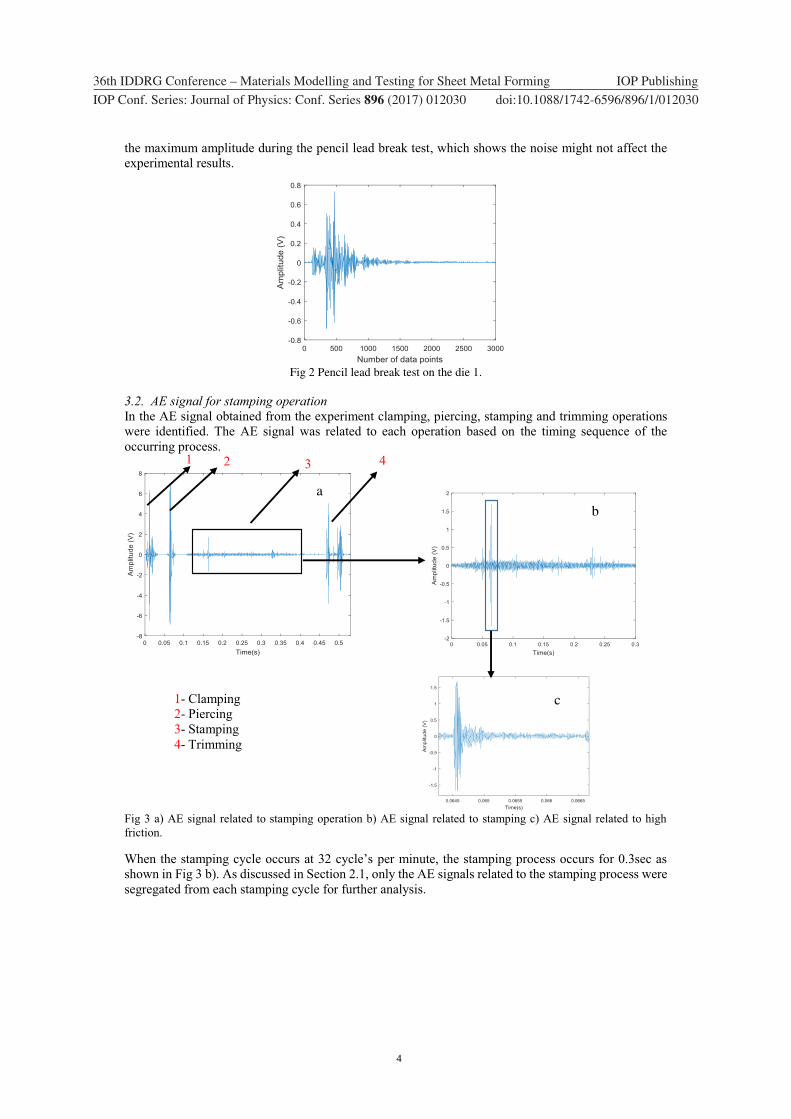
3. Results and Discussion 3.1. Pencil lead break test Stamping operations are generally noisy as many operations (Clamping, Piercing, trimming and forming) takes place in very short duration of time. Therefore, it is necessary to place the AE sensor at the location where it can capture the appropriate information related to forming. In this study, AE sensors were placed on die inserts. Before conducting the experiments, the Hsu-Nielsen test that involves a traditional reference source in the form of pencil lead fracture (2H lead, 0.5mm diameter), was performed on the die inserts to verify the effect of background noise [24]. From Fig 2 we can note the noise observed is minimal compared to
a)
b)
v v
0.5hf 0.5hf
1. Die inserts 2. Acoustic emission sensor 3. Stamped sheet 4. Blank Holder
1. 2. 3. 4.
4
1234567890
36th IDDRG Conference – Materials Modelling and Testing for Sheet Metal Forming IOP Publishing
IOP Conf. Series: Journal of Physics: Conf. Series 896 (2017) 012030 doi :10.1088/1742-6596/896/1/012030
the maximum amplitude during the pencil lead break test, which shows the noise might not affect the experimental results.
Fig 2 Pencil lead break test on the die 1.
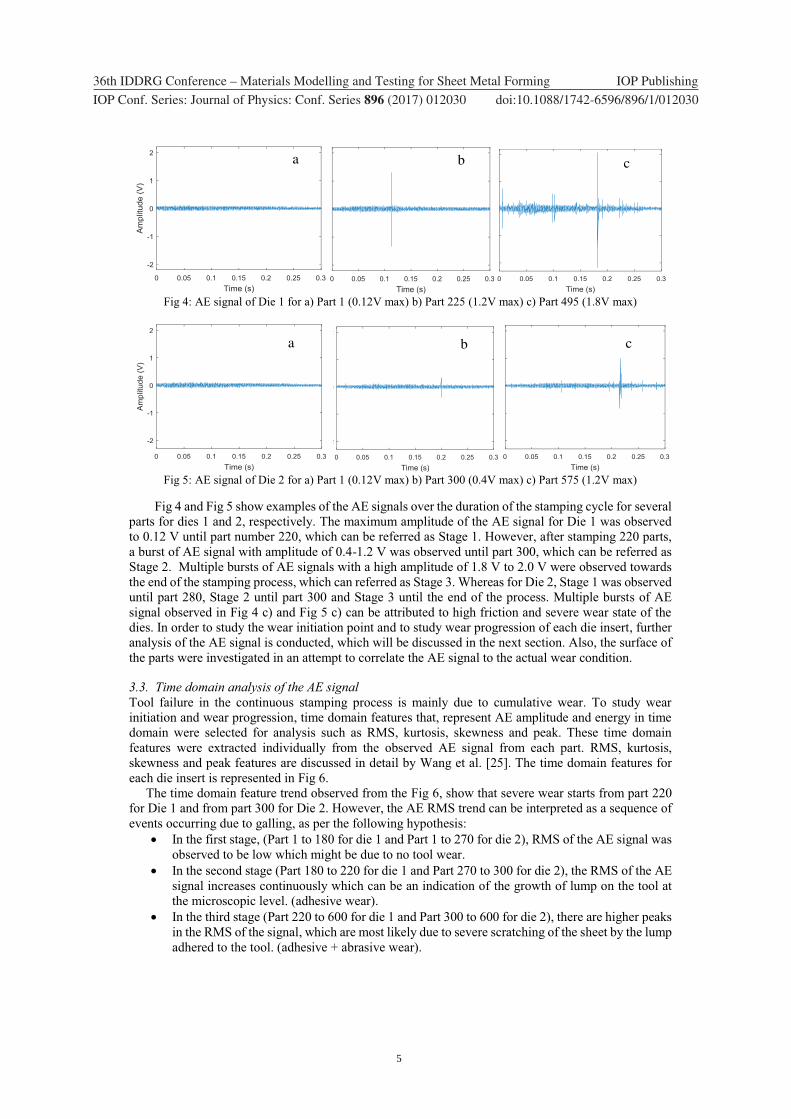
3.2. AE signal for stamping operation In the AE signal obtained from the experiment clamping, piercing, stamping and trimming operations were identified. The AE signal was related to each operation based on the timing sequence of the occurring process.
Fig 3 a) AE signal related to stamping operation b) AE signal related to stamping c) AE signal related to high friction.
When the stamping cycle occurs at 32 cycle’s per minute, the stamping process occurs for 0.3sec as shown in Fig 3 b). As discussed in Section 2.1, only the AE signals related to the stamping process were segregated from each stamping cycle for further analysis.
1 2 3 4
a
b
c 1- Clamping 2- Piercing 3- Stamping 4- Trimming
5
1234567890
36th IDDRG Conference – Materials Modelling and Testing for Sheet Metal Forming IOP Publishing
IOP Conf. Series: Journal of Physics: Conf. Series 896 (2017) 012030 doi :10.1088/1742-6596/896/1/012030
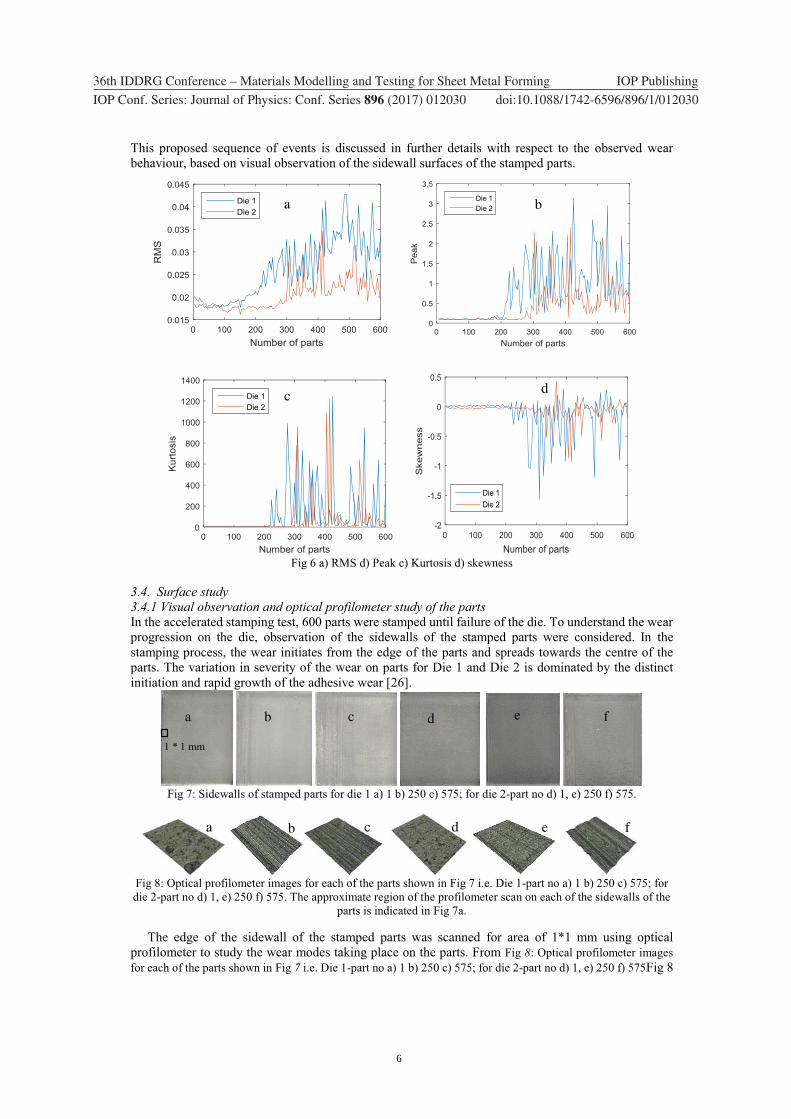
Fig 4: AE signal of Die 1 for a) Part 1 (0.12V max) b) Part 225 (1.2V max) c) Part 495 (1.8V max)
Fig 5: AE signal of Die 2 for a) Part 1 (0.12V max) b) Part 300 (0.4V max) c) Part 575 (1.2V max)
Fig 4 and Fig 5 show examples of the AE signals over the duration of the stamping cycle for several parts for dies 1 and 2, respectively. The maximum amplitude of the AE signal for Die 1 was observed to 0.12 V until part number 220, which can be referred as Stage 1. However, after stamping 220 parts, a burst of AE signal with amplitude of 0.4-1.2 V was observed until part 300, which can be referred as Stage 2. Multiple bursts of AE signals with a high amplitude of 1.8 V to 2.0 V were observed towards the end of the stamping process, which can referred as Stage 3. Whereas for Die 2, Stage 1 was observed until part 280, Stage 2 until part 300 and Stage 3 until the end of the process. Multiple bursts of AE signal observed in Fig 4 c) and Fig 5 c) can be attributed to high friction and severe wear state of the dies. In order to study the wear initiation point and to study wear progression of each die insert, further analysis of the AE signal is conducted, which will be discussed in the next section. Also, the surface of the parts were investigated in an attempt to correlate the AE signal to the actual wear condition.
3.3. Time domain analysis of the AE signal Tool failure in the continuous stamping process is mainly due to cumulative wear. To study wear initiation and wear progression, time domain features that, represent AE amplitude and energy in time domain were selected for analysis such as RMS, kurtosis, skewness and peak. These time domain features were extracted individually from the observed AE signal from each part. RMS, kurtosis, skewness and peak features are discussed in detail by Wang et al. [25]. The time domain features for each die insert is represented in Fig 6. The time domain feature trend observed from the Fig 6, show that severe wear starts from part 220 for Die 1 and from part 300 for Die 2. However, the AE RMS trend can be interpreted as a sequence of events occurring due to galling, as per the following hypothesis:
� In the first stage, (Part 1 to 180 for die 1 and Part 1 to 270 for die 2), RMS of the AE signal was observed to be low which might be due to no tool wear.
� In the second stage (Part 180 to 220 for die 1 and Part 270 to 300 for die 2), the RMS of the AE signal increases continuously which can be an indication of the growth of lump on the tool at the microscopic level. (adhesive wear).
� In the third stage (Part 220 to 600 for die 1 and Part 300 to 600 for die 2), there are higher peaks in the RMS of the signal, which are most likely due to severe scratching of the sheet by the lump adhered to the tool. (adhesive + abrasive wear).
a b c
c b a
6
1234567890
36th IDDRG Conference – Materials Modelling and Testing for Sheet Metal Forming IOP Publishing
IOP Conf. Series: Journal of Physics: Conf. Series 896 (2017) 012030 doi :10.1088/1742-6596/896/1/012030
This proposed sequence of events is discussed in further details with respect to the observed wear behaviour, based on visual observation of the sidewall surfaces of the stamped parts.
Fig 6 a) RMS d) Peak c) Kurtosis d) skewness
3.4. Surface study 3.4.1 Visual observation and optical profilometer study of the parts In the accelerated stamping test, 600 parts were stamped until failure of the die. To understand the wear progression on the die, observation of the sidewalls of the stamped parts were considered. In the stamping process, the wear initiates from the edge of the parts and spreads towards the centre of the parts. The variation in severity of the wear on parts for Die 1 and Die 2 is dominated by the distinct initiation and rapid growth of the adhesive wear [26].
Fig 7: Sidewalls of stamped parts for die 1 a) 1 b) 250 c) 575; for die 2-part no d) 1, e) 250 f) 575.
Fig 8: Optical profilometer images for each of the parts shown in Fig 7 i.e. Die 1-part no a) 1 b) 250 c) 575; for die 2-part no d) 1, e) 250 f) 575. The approximate region of the profilometer scan on each of the sidewalls of the
parts is indicated in Fig 7a.
The edge of the sidewall of the stamped parts was scanned for area of 1*1 mm using optical profilometer to study the wear modes taking place on the parts. From Fig 8: Optical profilometer images for each of the parts shown in Fig 7 i.e. Die 1-part no a) 1 b) 250 c) 575; for die 2-part no d) 1, e) 250 f) 575Fig 8
a b
c d
a b c d e f
a b c d e f
1 * 1 mm
7
1234567890
36th IDDRG Conference – Materials Modelling and Testing for Sheet Metal Forming IOP Publishing
IOP Conf. Series: Journal of Physics: Conf. Series 896 (2017) 012030 doi :10.1088/1742-6596/896/1/012030
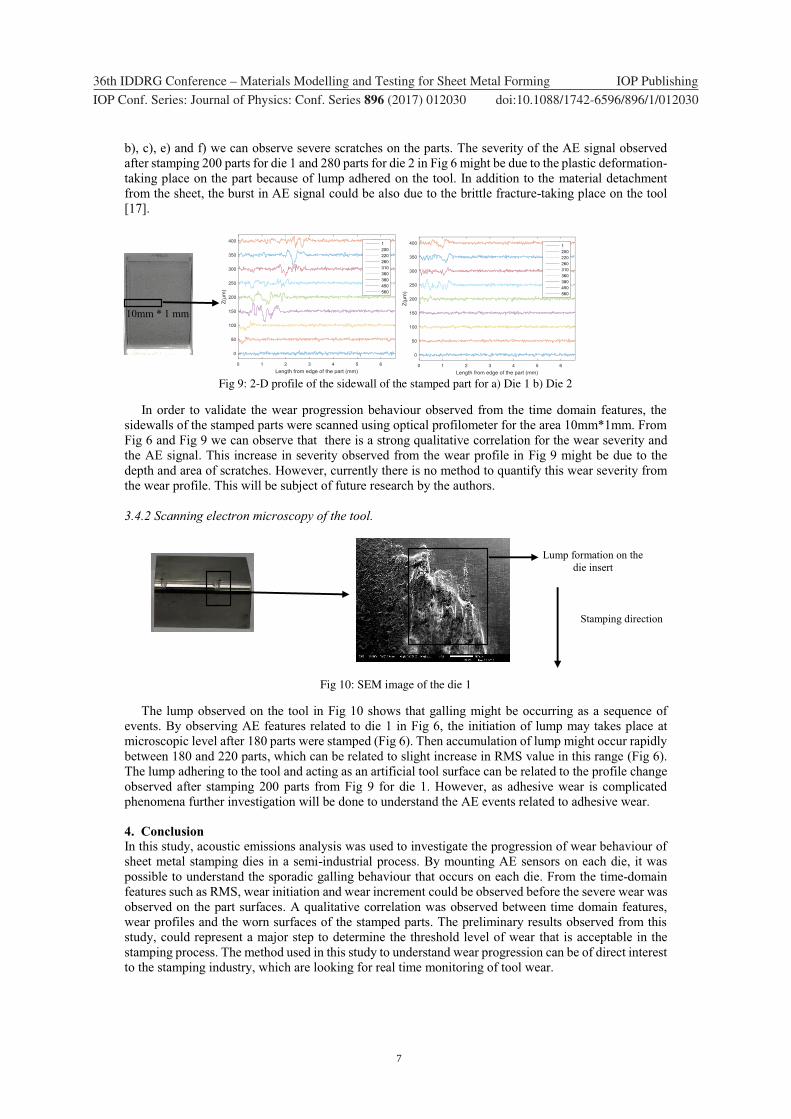
b), c), e) and f) we can observe severe scratches on the parts. The severity of the AE signal observed after stamping 200 parts for die 1 and 280 parts for die 2 in Fig 6 might be due to the plastic deformation-taking place on the part because of lump adhered on the tool. In addition to the material detachment from the sheet, the burst in AE signal could be also due to the brittle fracture-taking place on the tool [17].
Fig 9: 2-D profile of the sidewall of the stamped part for a) Die 1 b) Die 2
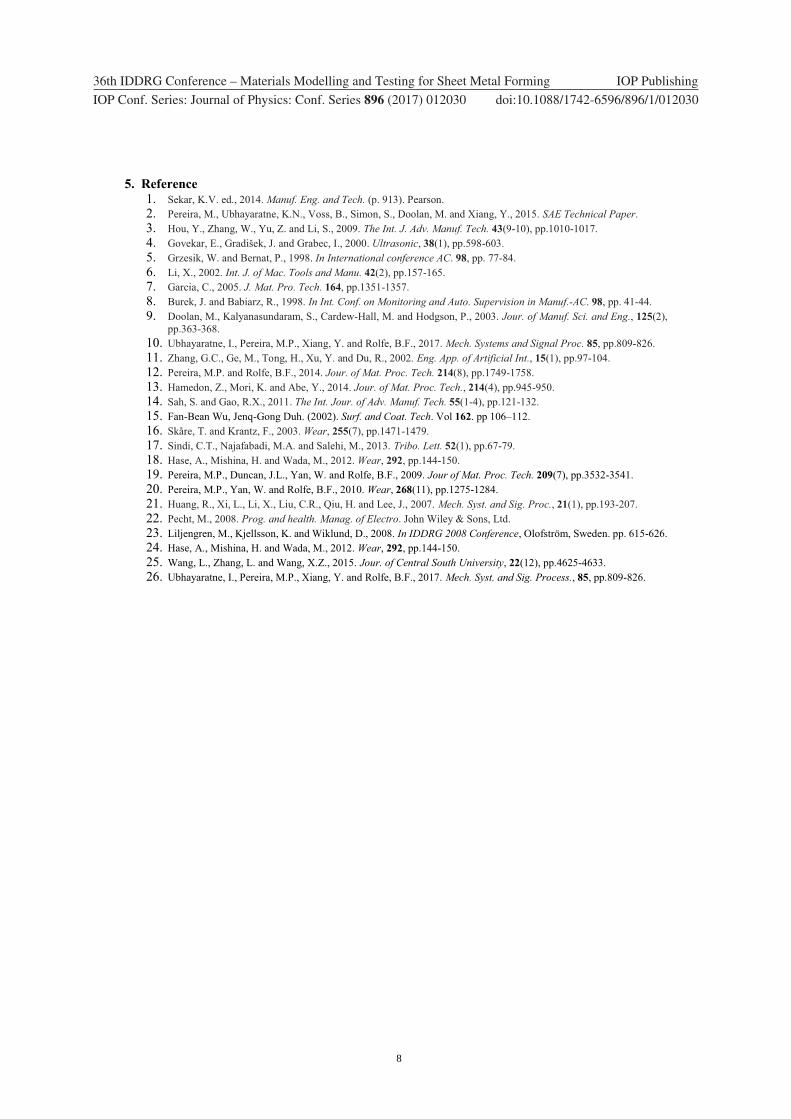
In order to validate the wear progression behaviour observed from the time domain features, the sidewalls of the stamped parts were scanned using optical profilometer for the area 10mm*1mm. From Fig 6 and Fig 9 we can observe that there is a strong qualitative correlation for the wear severity and the AE signal. This increase in severity observed from the wear profile in Fig 9 might be due to the depth and area of scratches. However, currently there is no method to quantify this wear severity from the wear profile. This will be subject of future research by the authors. 3.4.2 Scanning electron microscopy of the tool.
Fig 10: SEM image of the die 1
The lump observed on the tool in Fig 10 shows that galling might be occurring as a sequence of events. By observing AE features related to die 1 in Fig 6, the initiation of lump may takes place at microscopic level after 180 parts were stamped (Fig 6). Then accumulation of lump might occur rapidly between 180 and 220 parts, which can be related to slight increase in RMS value in this range (Fig 6). The lump adhering to the tool and acting as an artificial tool surface can be related to the profile change observed after stamping 200 parts from Fig 9 for die 1. However, as adhesive wear is complicated phenomena further investigation will be done to understand the AE events related to adhesive wear.
4. Conclusion In this study, acoustic emissions analysis was used to investigate the progression of wear behaviour of sheet metal stamping dies in a semi-industrial process. By mounting AE sensors on each die, it was possible to understand the sporadic galling behaviour that occurs on each die. From the time-domain features such as RMS, wear initiation and wear increment could be observed before the severe wear was observed on the part surfaces. A qualitative correlation was observed between time domain features, wear profiles and the worn surfaces of the stamped parts. The preliminary results observed from this study, could represent a major step to determine the threshold level of wear that is acceptable in the stamping process. The method used in this study to understand wear progression can be of direct interest to the stamping industry, which are looking for real time monitoring of tool wear.
10mm * 1 mm
Lump formation on the die insert
Stamping direction
8
1234567890
36th IDDRG Conference – Materials Modelling and Testing for Sheet Metal Forming IOP Publishing
IOP Conf. Series: Journal of Physics: Conf. Series 896 (2017) 012030 doi :10.1088/1742-6596/896/1/012030
5. Reference 1. Sekar, K.V. ed., 2014. Manuf. Eng. and Tech. (p. 913). Pearson. 2. Pereira, M., Ubhayaratne, K.N., Voss, B., Simon, S., Doolan, M. and Xiang, Y., 2015. SAE Technical Paper. 3. Hou, Y., Zhang, W., Yu, Z. and Li, S., 2009. The Int. J. Adv. Manuf. Tech. 43(9-10), pp.1010-1017. 4. Govekar, E., Gradišek, J. and Grabec, I., 2000. Ultrasonic, 38(1), pp.598-603. 5. Grzesik, W. and Bernat, P., 1998. In International conference AC. 98, pp. 77-84. 6. Li, X., 2002. Int. J. of Mac. Tools and Manu. 42(2), pp.157-165. 7. Garcia, C., 2005. J. Mat. Pro. Tech. 164, pp.1351-1357. 8. Burek, J. and Babiarz, R., 1998. In Int. Conf. on Monitoring and Auto. Supervision in Manuf.-AC. 98, pp. 41-44. 9. Doolan, M., Kalyanasundaram, S., Cardew-Hall, M. and Hodgson, P., 2003. Jour. of Manuf. Sci. and Eng., 125(2),
pp.363-368. 10. Ubhayaratne, I., Pereira, M.P., Xiang, Y. and Rolfe, B.F., 2017. Mech. Systems and Signal Proc. 85, pp.809-826. 11. Zhang, G.C., Ge, M., Tong, H., Xu, Y. and Du, R., 2002. Eng. App. of Artificial Int., 15(1), pp.97-104. 12. Pereira, M.P. and Rolfe, B.F., 2014. Jour. of Mat. Proc. Tech. 214(8), pp.1749-1758. 13. Hamedon, Z., Mori, K. and Abe, Y., 2014. Jour. of Mat. Proc. Tech., 214(4), pp.945-950. 14. Sah, S. and Gao, R.X., 2011. The Int. Jour. of Adv. Manuf. Tech. 55(1-4), pp.121-132. 15. Fan-Bean Wu, Jenq-Gong Duh. (2002). Surf. and Coat. Tech. Vol 162. pp 106–112. 16. Skåre, T. and Krantz, F., 2003. Wear, 255(7), pp.1471-1479. 17. Sindi, C.T., Najafabadi, M.A. and Salehi, M., 2013. Tribo. Lett. 52(1), pp.67-79. 18. Hase, A., Mishina, H. and Wada, M., 2012. Wear, 292, pp.144-150. 19. Pereira, M.P., Duncan, J.L., Yan, W. and Rolfe, B.F., 2009. Jour of Mat. Proc. Tech. 209(7), pp.3532-3541. 20. Pereira, M.P., Yan, W. and Rolfe, B.F., 2010. Wear, 268(11), pp.1275-1284. 21. Huang, R., Xi, L., Li, X., Liu, C.R., Qiu, H. and Lee, J., 2007. Mech. Syst. and Sig. Proc., 21(1), pp.193-207. 22. Pecht, M., 2008. Prog. and health. Manag. of Electro. John Wiley & Sons, Ltd. 23. Liljengren, M., Kjellsson, K. and Wiklund, D., 2008. In IDDRG 2008 Conference, Olofström, Sweden. pp. 615-626. 24. Hase, A., Mishina, H. and Wada, M., 2012. Wear, 292, pp.144-150. 25. Wang, L., Zhang, L. and Wang, X.Z., 2015. Jour. of Central South University, 22(12), pp.4625-4633. 26. Ubhayaratne, I., Pereira, M.P., Xiang, Y. and Rolfe, B.F., 2017. Mech. Syst. and Sig. Process., 85, pp.809-826.