Embed Size (px)
Citation preview
Annual Meeting March 11-13, 2012 Manchester Grand Hyatt San Diego, CA
AM‐12‐25 Molecular HighwayTM Technology for FCC Catalysts in a Commercial Refinery
Presented By: Gautham Krishnaiah Rive Technology, Inc. Monmouth Junction, NJ Barry Speronello Rive Technology, Inc. Monmouth Junction, NJ Heath Duncan Rive Technology, Inc. Monmouth Junction, NJ
Washington, DC 20006.3896
www.afpm.org
American Fuel & Petrochemical Manufacturers 1667 K Street, NW Suite 700
202.457.0480 voice 202.457.0486 fax
This paper has been reproduced for the author or authors as a courtesy by the American Fuel & Petrochemical Manufacturers. Publication of this paper does not signify that the contents necessarily reflect the opinions of the AFPM, its officers, directors, members, or staff. Requests for authorization to quote or use the contents should be addressed directly to the author(s)
AM‐12‐25 Page 1
)
s
Molecular Highway™ Technology for FCC Catalysts in a Commercial Refinery
Gautham Krishnaiah, Director, Technical Service, Rive Technology, Inc. Barry Speronello, Research Fellow, Rive Technology, Inc. Allen Hansen, Process Modeling Engineer, Rive Technology, Inc. Heath Duncan, Process Engineer, CountryMark Refining and Logistics, LLC
Background
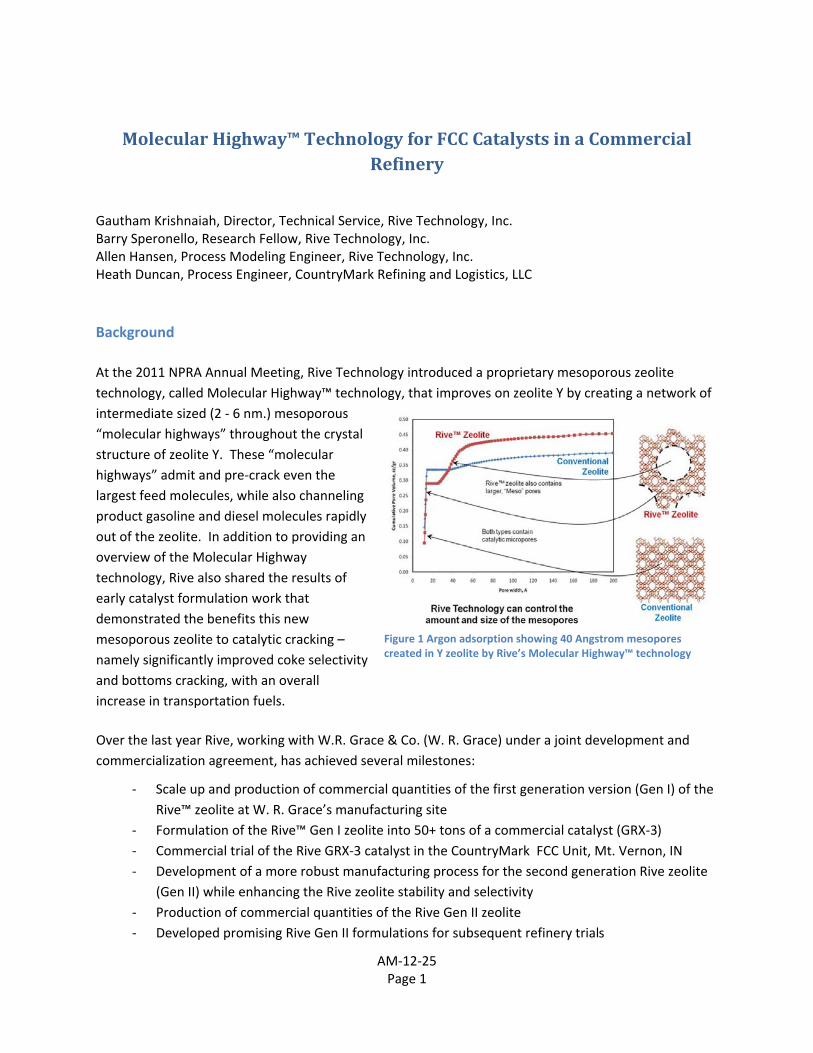
At the 2011 NPRA Annual Meeting, Rive Technology introduced a proprietary mesoporous zeolite technology, called Molecular Highway™ technology, that improves on zeolite Y by creating a network of intermediate sized (2 ‐ 6 nm.) mesoporous “molecular highways” throughout the crystal structure of zeolite Y. These “molecular highways” admit and pre‐crack even the largest feed molecules, while also channeling product gasoline and diesel molecules rapidly out of the zeolite. In addition to providing an overview of the Molecular Highway technology, Rive also shared the results of early catalyst formulation work that demonstrated the benefits this new mesoporous zeolite to catalytic cracking – namely significantly improved coke selectivity and bottoms cracking, with an overall increase in transportation fuels.
Over the last year Rive, working with W.R. Grace & Co. (W. R. Grace) under a joint development and commercialization agreement, has achieved several milestones:
‐ Scale up and production of commercial quantities of the first generation version (Gen I) of theRive™ zeolite at W. R. Grace’s manufacturing site
‐ Formulation of the Rive™ Gen I zeolite into 50+ tons of a commercial catalyst (GRX‐3‐ Commercial trial of the Rive GRX‐3 catalyst in the CountryMark FCC Unit, Mt. Vernon, IN‐ Development of a more robust manufacturing process for the second generation Rive zeolite
(Gen II) while enhancing the Rive zeolite stability and selectivity ‐ Production of commercial quantities of the Rive Gen II zeolite‐ Developed promising Rive Gen II formulations for subsequent refinery trial
Figure 1 Argon adsorption showing 40 Angstrom mesopores created in Y zeolite by Rive’s Molecular Highway™ technology
Commercial Trial of a Rive Zeolite (Gen I) Catalyst Formulation
Early last year, Rive conducted a screening study of a short list of refiners to identify potential candidates for a trial demonstration of the Molecular Highway technology. Using the ACE test results, Rive approached these refiners and proposed a trial of the Rive Molecular Highway technology. After reviewing the ACE test results and potential economic uplift, CountryMark agreed to proceed with a trial.
Rive manufactured the first‐ever commercial batch of mesoporous zeolite (Gen I) at W.R. Grace’s production site. 52 tons of the GRX‐3 catalyst were formulated with Rive’s Gen I zeolite . The GRX‐3 catalyst as produced had the following physical properties: Zeolite Surface Area 250 m2/gm; Matrix Surface Area 100 m2/gm; Davison Attrition Index (DI) 2. The GRX‐3 catalyst was also formulated with a ZSM‐5 containing olefins additive (additive to convert extra gasoline expected from the GRX‐3 catalyst into alkylation feed) and shipped to CountryMark in totes.
AM‐12‐25 Page 2
‐3
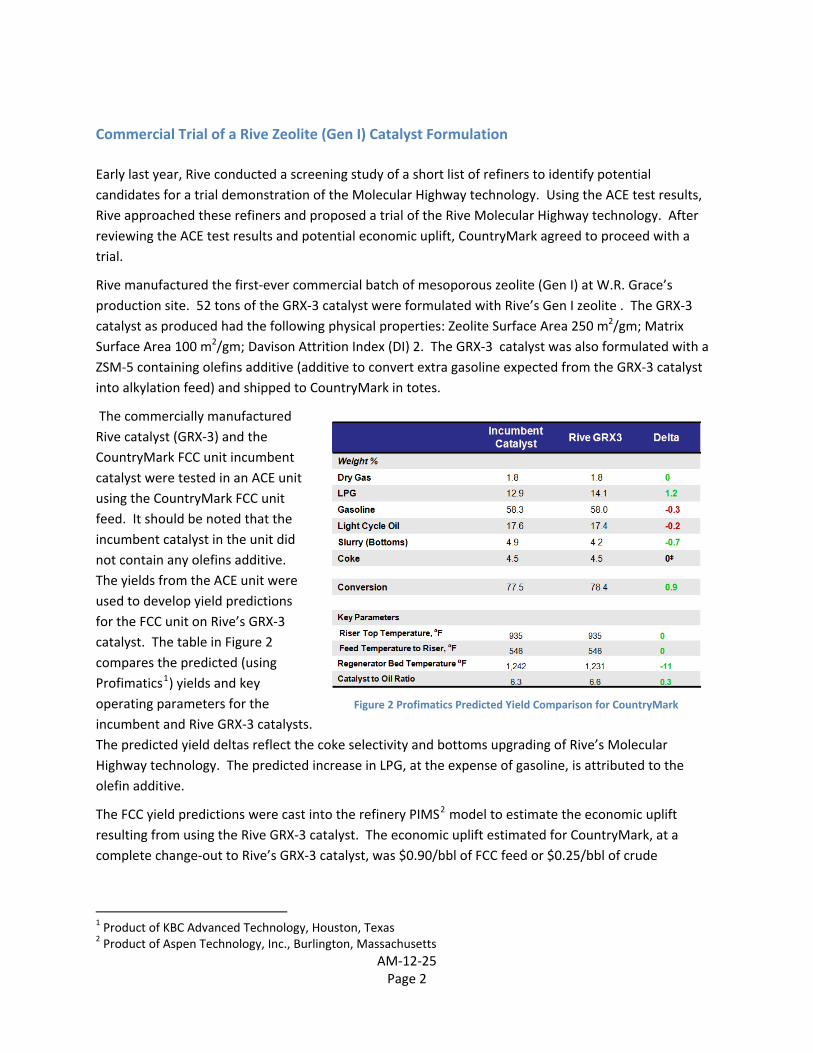
The commercially manufactured Rive catalyst (GRX‐3) and the CountryMark FCC unit incumbent catalyst were tested in an ACE unit using the CountryMark FCC unit feed. It should be noted that the incumbent catalyst in the unit did not contain any olefins additive. The yields from the ACE unit were used to develop yield predictions for the FCC unit on Rive’s GRXcatalyst. The table in Figure 2 compares the predicted (using Profimatics1) yields and key operating parameters for the incumbent and Rive GRX‐3 catalysts. The predicted yield deltas reflect the coke selectivity and bottoms upgrading of Rive’s Molecular Highway technology. The predicted increase in LPG, at the expense of gasoline, is attributed to the olefin additive.
Figure 2 Profimatics Predicted Yield Comparison for CountryMark
The FCC yield predictions were cast into the refinery PIMS2 model to estimate the economic uplift resulting from using the Rive GRX‐3 catalyst. The economic uplift estimated for CountryMark, at a complete change‐out to Rive’s GRX‐3 catalyst, was $0.90/bbl of FCC feed or $0.25/bbl of crude
1 Product of KBC Advanced Technology, Houston, Texas 2 Product of Aspen Technology, Inc., Burlington, Massachusetts
processed through the refinery. This uplift was ~50% of that estimated for a representative US Gulf Coast Refinery ($0.47/bbl of crude throughput) because of some unique factors at CountryMark:
• A relatively unconstrained FCC unit (i.e., no constraints on the air blower, wet gas compressor, circulation or temperatures)
• A high value for slurry (Bottoms) (proximity of asphalt plant) and indifferent to LPG olefins (octane‐long)
• Constant crude and FCC unit feed quality
The CountryMark refinery processes approximately 27,000 BPSD of an Illinois Basin crude. The FCC unit has a throughput rate of 7,400 BPSD and typically processes VGO (API 25.0 and Sulfur 0.3‐0.4 wt%). The unit inventory is around 45 tons, with a daily fresh catalyst addition rate of 0.7 tons/day. With a Rive GRX‐3 catalyst production batch of 52 tons, this translated to a 75‐day trial and a catalyst change‐out of around 70%. The trial started in early August and ended in late October, 2011.
At a minimum, the expectations for the trial included the demonstration of good physical/chemical properties (attrition resistance, activity retention and fluidization characteristics) and hydrothermal stability of the Rive GRX‐3 catalyst. Considering that this was the first commercial production of a catalyst using a commercially‐manufactured mesoporous zeolite, along with the facts that: a) only around 70% change‐out of the catalyst would be achieved; b) there is inherent ‘noise’ in plant data; and c) potential changes in feed quality; only a modest yield response was anticipated for the Rive catalyst. Recognizing these limitations, equilibrium catalyst (ecat) and feed samples were collected regularly during the trial for analysis and pilot plant testing. The ecats were analyzed routinely to monitor the catalyst activity, zeolite/matrix surface areas, coke factor and other properties. Following the trial, ecat samples were tested in the ACE unit and the DCR Pilot unit to demonstrate catalyst selectivities.
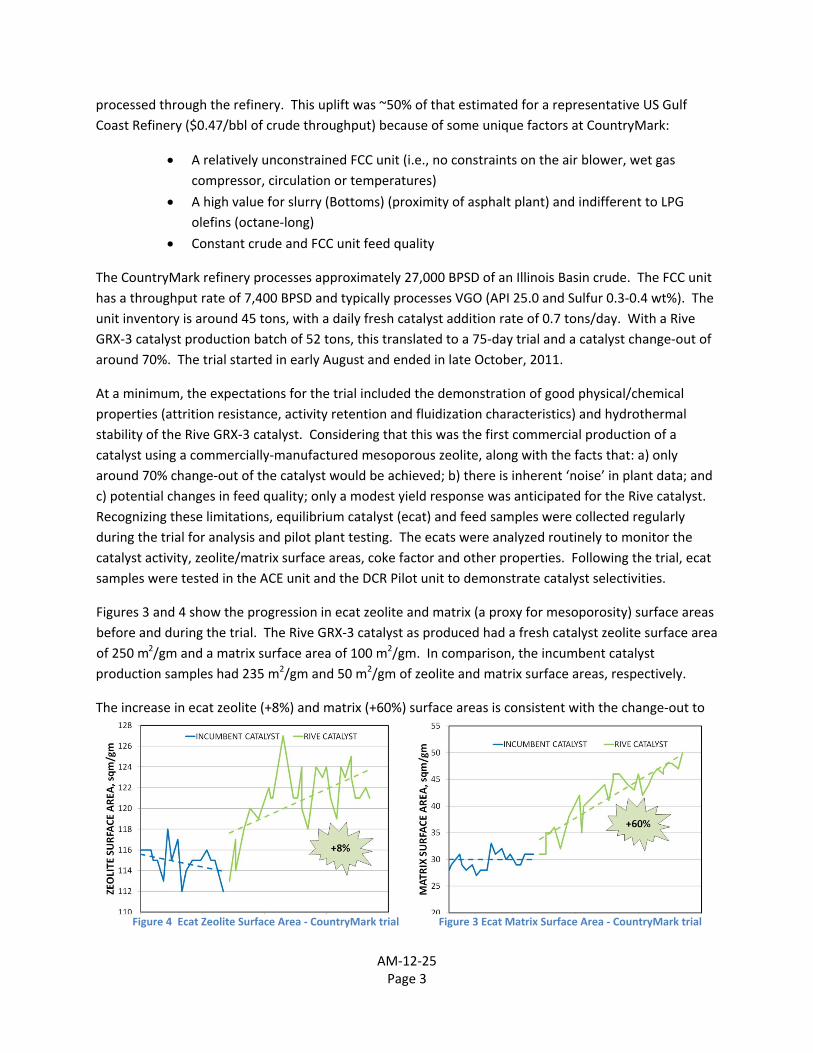
Figures 3 and 4 show the progression in ecat zeolite and matrix (a proxy for mesoporosity) surface areas before and during the trial. The Rive GRX‐3 catalyst as produced had a fresh catalyst zeolite surface area of 250 m2/gm and a matrix surface area of 100 m2/gm. In comparison, the incumbent catalyst production samples had 235 m2/gm and 50 m2/gm of zeolite and matrix surface areas, respectively.
The increase in ecat zeolite (+8%) and matrix (+60%) surface areas is consistent with the change‐out to
Figure 4 Ecat Zeolite Surface Area ‐ CountryMark trial Figure 3 Ecat Matrix Surface Area ‐ CountryMark trial
AM‐12‐25 Page 3
the Rive GRX‐3 catalyst and demonstrates good hydrothermal stability of the zeolite and matrix (mesoporous) surface areas of the Rive catalyst in a commercial application. The surface area retentions are comparable with that of the incumbent catalyst. Note that a maximum change‐out of 67% was achieved with the Rive catalyst. The metals on ecat before and during the trial were 200 ppm Nickel and 1,000 ppm Vanadium.
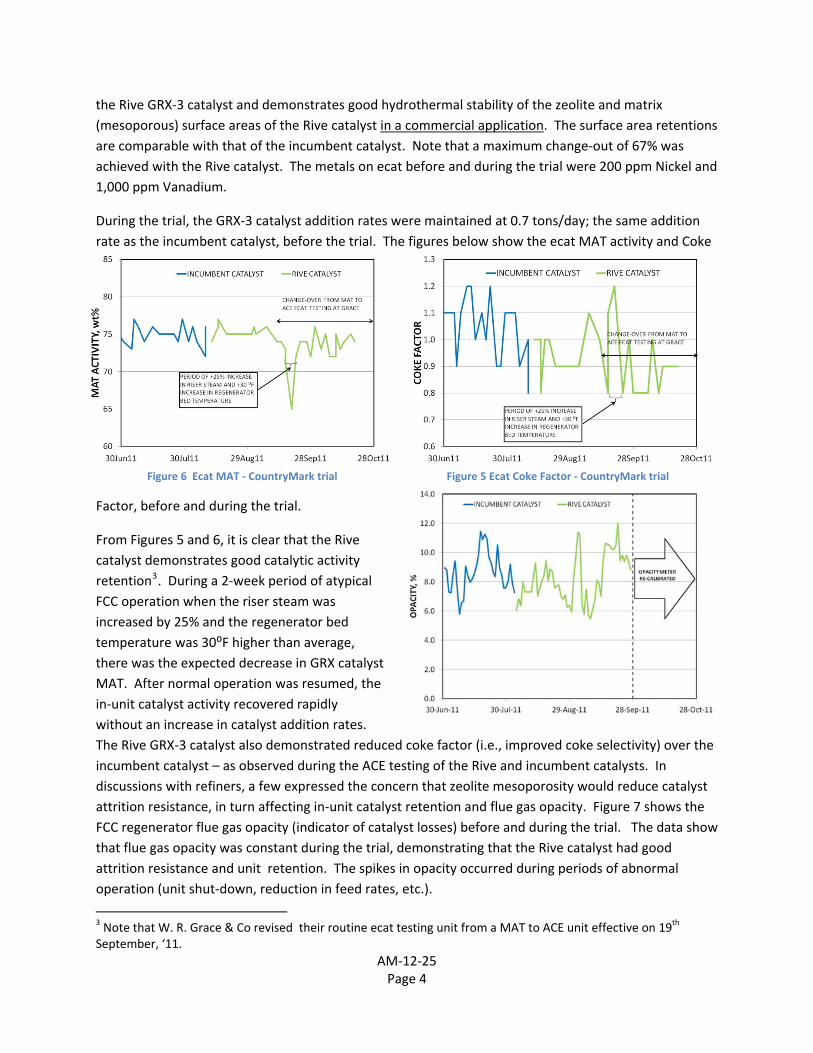
During the trial, the GRX‐3 catalyst addition rates were maintained at 0.7 tons/day; the same addition rate as the incumbent catalyst, before the trial. The figures below show the ecat MAT activity and Coke
Factor, before and during the trial.
From Figures 5 and 6, it is clear that the Rive catalyst demonstrates good catalytic activity retention3. During a 2‐week period of atypical FCC operation when the riser steam was increased by 25% and the regenerator bed temperature was 30⁰F higher than average, there was the expected decrease in GRX catalyst MAT. After normal operation was resumed, the in‐unit catalyst activity recovered rapidly without an increase in catalyst addition rates. The Rive GRX‐3 catalyst also demonstrated reduced coke factor (i.e., improved coke selectivity) overincumbent catalyst – as observed during the ACE testing of the Rive and incumbent catalysts. In discussions with refiners, a few expressed the concern that zeolite mesoporosity would reduce catalyst attrition resistance, in turn affecting in‐unit catalyst retention and flue gas opacity. Figure 7 shows the FCC regenerator flue gas opacity (indicator of catalyst losses) before and during the trial. The data show that flue gas opacity was constant during the trial, demonstrating that the Rive catalyst had good attrition resistance and unit retention. The spikes in opacity occurred during periods of abnormal operation (unit shut‐down, reduction in feed rates, etc.).
Figure 5 Ecat Coke Factor ‐ CountryMark trialFigure 6 Ecat MAT ‐ CountryMark trial
the
3 Note that W. R. Grace & Co revised their routine ecat testing unit from a MAT to ACE unit effective on 19th September, ‘11.
AM‐12‐25 Page 4
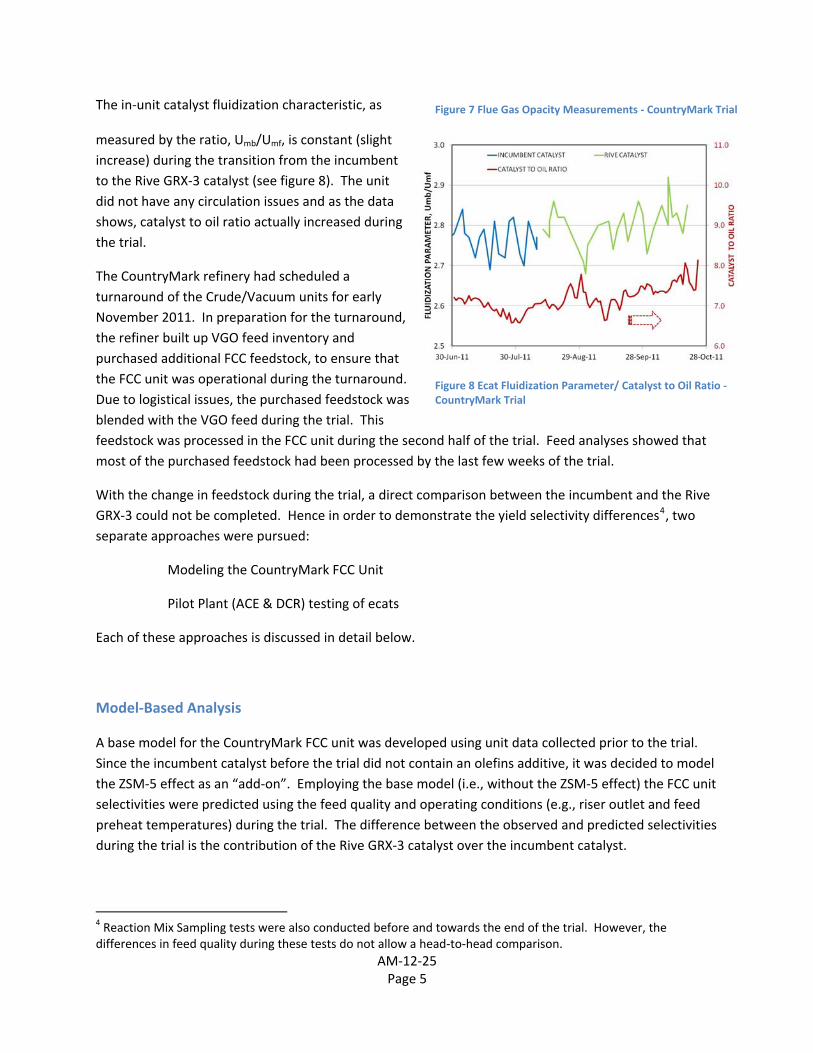
The in‐unit catalyst fluidization characteristic, as
measured by the ratio, Umb/Umf, is constant (slight increase) during the transition from the incumbent to the Rive GRX‐3 catalyst (see figure 8). The unit did not have any circulation issues and as the data shows, catalyst to oil ratio actually increased during the trial.
Figure 7 Flue Gas Opacity Measurements ‐ CountryMark Trial
The CountryMark refinery had scheduled a turnaround of the Crude/Vacuum units for early November 2011. In preparation for the turnaround, the refiner built up VGO feed inventory and purchased additional FCC feedstock, to ensure that the FCC unit was operational during the turnaround. Due to logistical issues, the purchased feedstock was blended with the VGO feed during the trial. This feedstock was processed in the FCC unit during the second half of the trial. Feed analyses showed that most of the purchased feedstock had been processed by the last few weeks of the trial.
Figure 8 Ecat Fluidization Parameter/ Catalyst to Oil Ratio ‐ CountryMark Trial
With the change in feedstock during the trial, a direct comparison between the incumbent and the Rive GRX‐3 could not be completed. Hence in order to demonstrate the yield selectivity differences4, two separate approaches were pursued:
Modeling the CountryMark FCC Unit
Pilot Plant (ACE & DCR) testing of ecats
Each of these approaches is discussed in detail below.
Model‐Based Analysis
A base model for the CountryMark FCC unit was developed using unit data collected prior to the trial. Since the incumbent catalyst before the trial did not contain an olefins additive, it was decided to model the ZSM‐5 effect as an “add‐on”. Employing the base model (i.e., without the ZSM‐5 effect) the FCC unit selectivities were predicted using the feed quality and operating conditions (e.g., riser outlet and feed preheat temperatures) during the trial. The difference between the observed and predicted selectivities during the trial is the contribution of the Rive GRX‐3 catalyst over the incumbent catalyst.
AM‐12‐25 Page 5
4 Reaction Mix Sampling tests were also conducted before and towards the end of the trial. However, the differences in feed quality during these tests do not allow a head‐to‐head comparison.
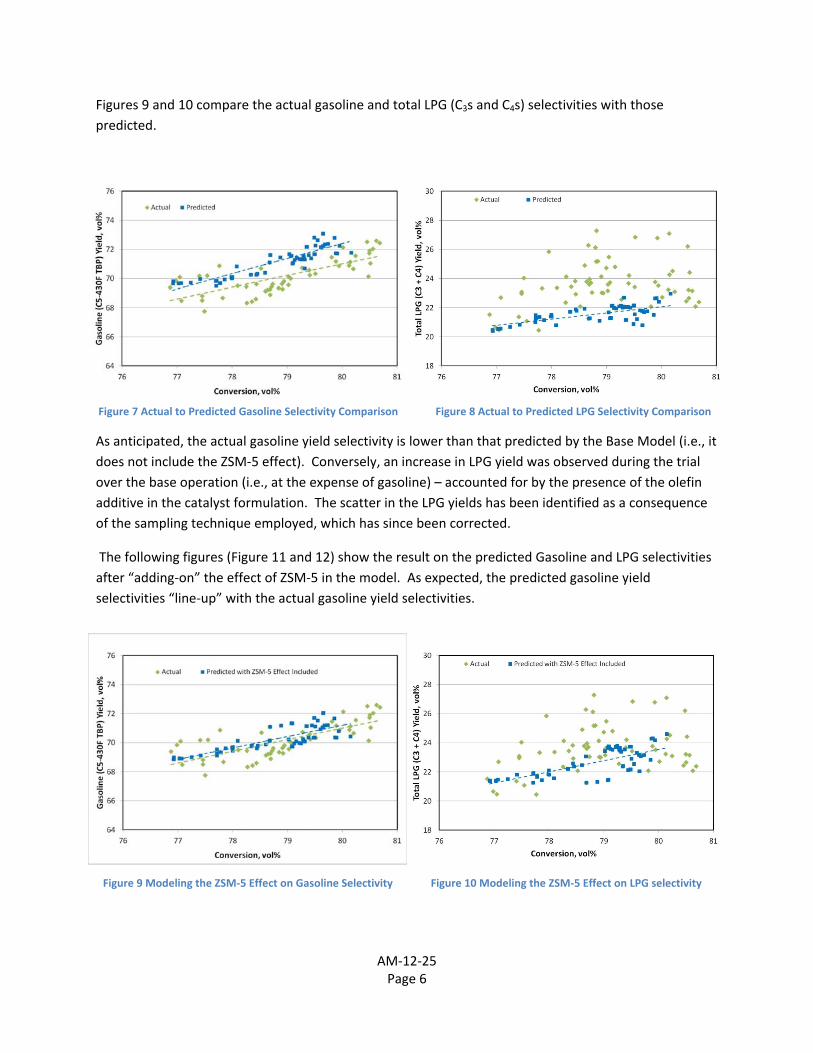
Figures 9 and 10 compare the actual gasoline and total LPG (C3s and C4s) selectivities with those predicted.
As anticipated, the actual gasoline yield selectivity is lower than that predicted by the Base Model (i.e., it does not include the ZSM‐5 effect). Conversely, an increase in LPG yield was observed during the trial over the base operation (i.e., at the expense of gasoline) – accounted for by the presence of the olefin additive in the catalyst formulation. The scatter in the LPG yields has been identified as a consequence of the sampling technique employed, which has since been corrected.
The following figures (Figure 11 and 12) show the result on the predicted Gasoline and LPG selectivities after “adding‐on” the effect of ZSM‐5 in the model. As expected, the predicted gasoline yield selectivities “line‐up” with the actual gasoline yield selectivities.
Figure 8 Actual to Predicted LPG Selectivity ComparisonFigure 7 Actual to Predicted Gasoline Selectivity Comparison
Figure 9 Modeling the ZSM‐5 Effect on Gasoline Selectivity Figure 10 Modeling the ZSM‐5 Effect on LPG selectivity
AM‐12‐25 Page 6
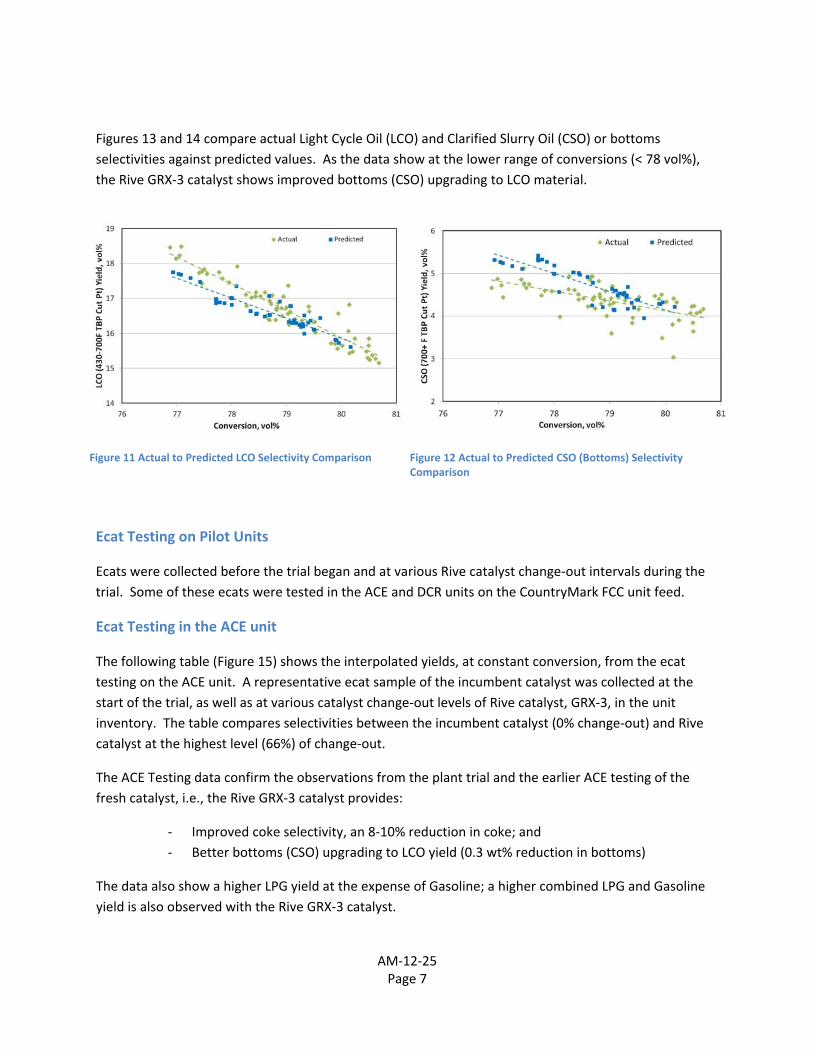
Figures 13 and 14 compare actual Light Cycle Oil (LCO) and Clarified Slurry Oil (CSO) or bottoms selectivities against predicted values. As the data show at the lower range of conversions (< 78 vol%), the Rive GRX‐3 catalyst shows improved bottoms (CSO) upgrading to LCO material.
Figure 11 Actual to Predicted LCO Selectivity Comparison Figure 12 Actual to Predicted CSO (Bottoms) Selectivity Comparison
Ecat Testing on Pilot Units
Ecats were collected before the trial began and at various Rive catalyst change‐out intervals during the trial. Some of these ecats were tested in the ACE and DCR units on the CountryMark FCC unit feed.
Ecat Testing in the ACE unit
The following table (Figure 15) shows the interpolated yields, at constant conversion, from the ecat testing on the ACE unit. A representative ecat sample of the incumbent catalyst was collected at the start of the trial, as well as at various catalyst change‐out levels of Rive catalyst, GRX‐3, in the unit inventory. The table compares selectivities between the incumbent catalyst (0% change‐out) and Rive catalyst at the highest level (66%) of change‐out.
The ACE Testing data confirm the observations from the plant trial and the earlier ACE testing of the fresh catalyst, i.e., the Rive GRX‐3 catalyst provides:
‐ Improved coke selectivity, an 8‐10% reduction in coke; and ‐ Better bottoms (CSO) upgrading to LCO yield (0.3 wt% reduction in bottoms)
The data also show a higher LPG yield at the expense of Gasoline; a higher combined LPG and Gasoline yield is also observed with the Rive GRX‐3 catalyst.
AM‐12‐25 Page 7
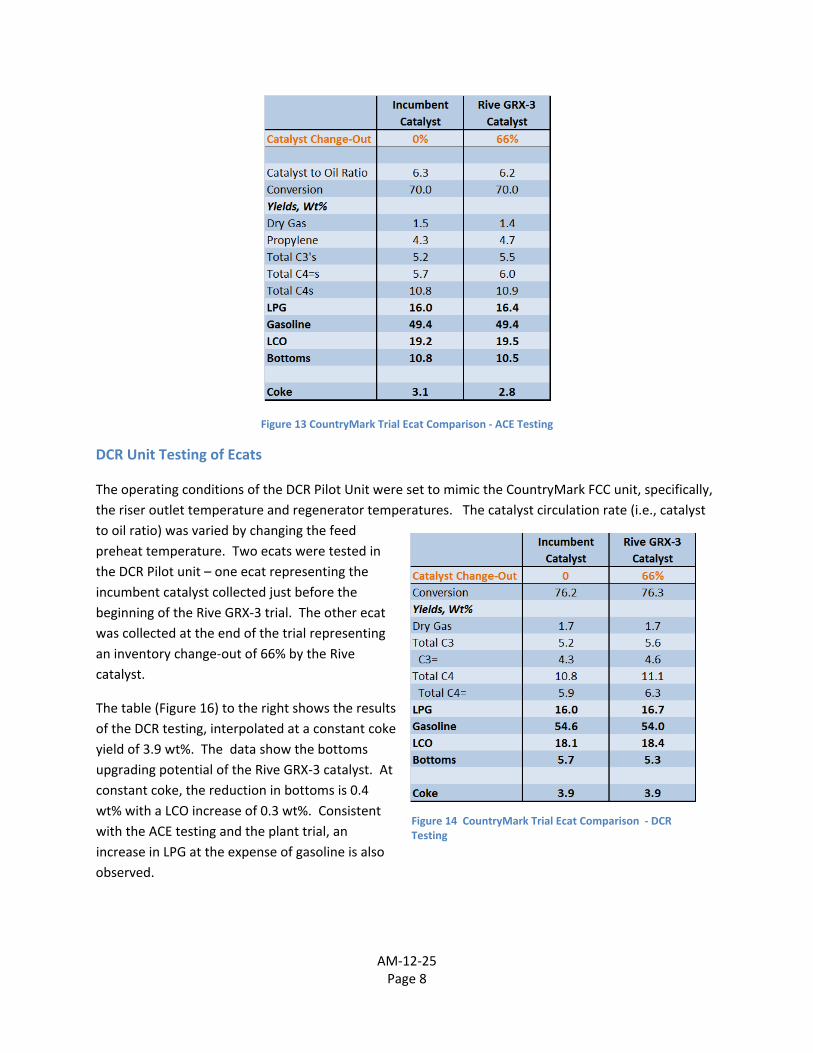
Figure 13 CountryMark Trial Ecat Comparison ‐ ACE Testing
DCR Unit Testing of Ecats
The operating conditions of the DCR Pilot Unit were set to mimic the CountryMark FCC unit, specifically, the riser outlet temperature and regenerator temperatures. The catalyst circulation rate (i.e., catalyst to oil ratio) was varied by changing the feed preheat temperature. Two ecats were tested in the DCR Pilot unit – one ecat representing the incumbent catalyst collected just before the beginning of the Rive GRX‐3 trial. The other ecat was collected at the end of the trial representing an inventory change‐out of 66% by the Rive catalyst.
The table (Figure 16) to the right shows the results of the DCR testing, interpolated at a constant coke yield of 3.9 wt%. The data show the bottoms upgrading potential of the Rive GRX‐3 catalyst. At constant coke, the reduction in bottoms is 0.4 wt% with a LCO increase of 0.3 wt%. Consistent with the ACE testing and the plant trial, an increase in LPG at the expense of gasoline is also
Figure 14 CountryMark Trial Ecat Comparison ‐ DCR Testing
AM‐12‐25 Page 8
observed.
AM‐12‐25 Page 9
their
d catalyst at an inventory
change‐out level of 67%. Th uplift predicted before the tart of the trial based on a
I)
facturing trial at W.R. Grace’s production facility and produced a large quantity of Gen II zeolite (five times the Gen I zeolite
In comparison with Gen I, the Rive Gen II zeolite as produced on a commercial scale has a 15% higher eolite surface area with the same matrix surface area.
were Rive
finer’s feedstock. Depending on the application, i.e., VGO or resid feedstock, the catalyst sample deactivation protocol varied and ranged from simple steam
ons against a state‐of‐the art catalyst technology. The test samples were Cyclic Propylene
Economic Uplift for CountryMark
Prior to starting the trial, Rive consulted with CountryMark and assisted the refiner in upgrading planning tools and PIMS refinery model. Using the yield selectivities observed during the trial and subsequent ecat testing on the ACE and DCR pilot units, it is estimated that the economic uplift generated at CountryMark by the Rive catalyst is $0.72/bbl of FCC Feed or $0.20/bbl of crude processeby the refiner5. It should be noted that this uplift was generated by the Rive
is number is well within the $0.25/bbl of crude 100% change‐out to the Rive catalyst. s
Recent Rive Zeolite Developments
The first commercial catalyst used during the CountryMark FCC trial employed a first generation (Genversion of the Rive zeolite. Since then, Rive’s research and development team has made significant advances in developing a more robust manufacturing process and a second generation (Gen II) Rive zeolite with improved stability and selectivity. Rive recently conducted a manu
quantity produced for the CountryMark trial and at a higher throughput rate).
z
Current Formulation Development with Gen II Zeolites
Working with W. R. Grace, Rive has developed promising new formulations using the Rive Gen II zeolite which has now been produced on a commercial scale manufacturing line. These new formulations screened, initially, by ACE testing on a standard feedstock. In parallel, with W.R. Grace’s assistance, has engaged several refiners interested in evaluating Rive’s Molecular Highway technology. These refiners provided Rive with feed samples and catalyst for lab test work. Further information on the refinery configuration, unit throughputs and constraints was also provided by the refiner. Using the results from the screening study and information provided by the refiners, a small set of formulations were recently prepared for testing with each re
deactivation to metals deactivation protocols.
The following table (Figure 17) shows the results from a recent ACE Test comparison of Rive catalyst formulati
5 Mid‐Continent Crack Spread of $28
AM‐12‐25 Page 10
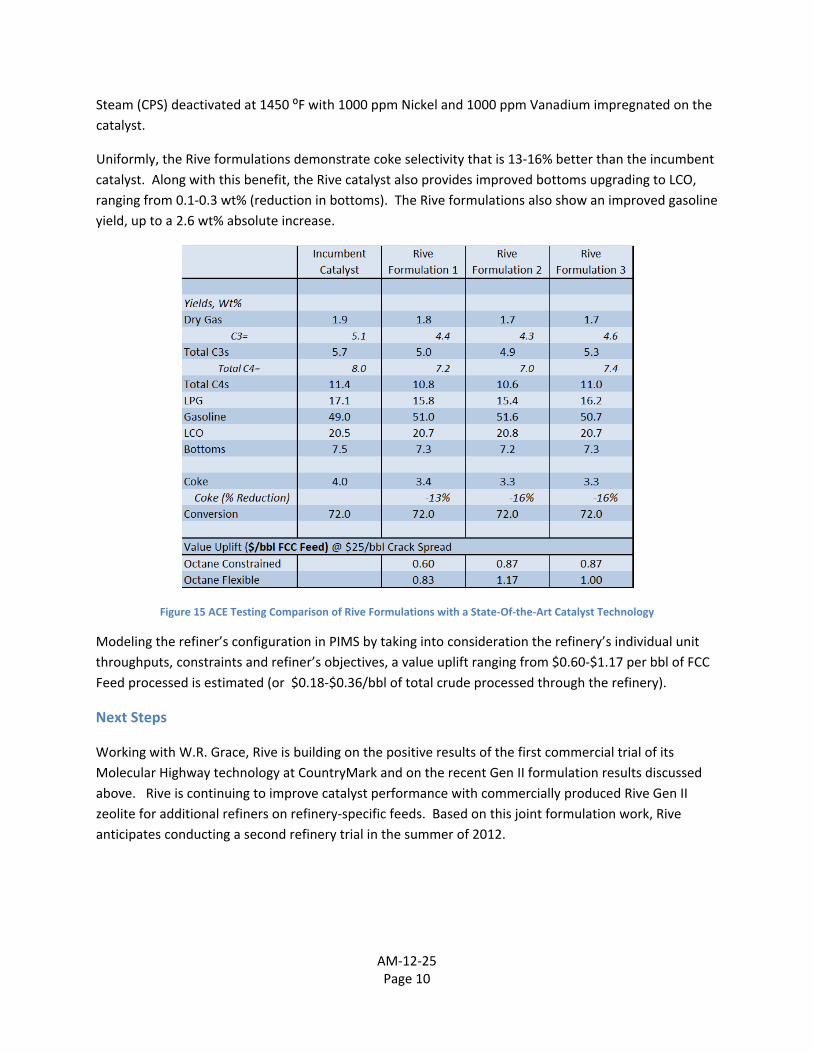
trate coke selectivity that is 13‐16% better than the incumbent catalyst. Along with this benefit, the Rive catalyst also provides improved bottoms upgrading to LCO, ranging from 0.1‐0.3 wt% (reduction in bottoms). The Rive formulations also show an improved gasoline yield, up to a 2.6 wt% absolute increase.
Modeling the refiner’s configuration in PIMS by taking into consideration the refinery’s individual unit constraints and refiner’s objectives, a value uplift ranging from $0.60‐$1.17 per bbl of FCC
Feed processed is estimated (or $0.18‐$0.36/bbl of total crude processed through the refinery).
II formulation results discussed above. Rive is continuing to improve catalyst performance with commercially produced Rive Gen II zeolite for additional refiners on refinery‐specific feeds. Based on this joint formulation work, Rive anticipates conducting a second refinery trial in the summer of 2012.
Steam (CPS) deactivated at 1450 ⁰F with 1000 ppm Nickel and 1000 ppm Vanadium impregnated on the catalyst.
Uniformly, the Rive formulations demons
Figure 15 ACE Testing Comparison of Rive Formulations with a State‐Of‐the‐Art Catalyst Technology
throughputs,
Next Steps
Working with W.R. Grace, Rive is building on the positive results of the first commercial trial of its Molecular Highway technology at CountryMark and on the recent Gen
Acknowledgements
The authors wish to acknowledge with sincere appreciation and thank the entire team from W.R. Grace for their collaboration, expertise, and support of the research and development described in this paper.
We also express our sincere thanks to Steve McGovern, Larry Lacijan, Bob Ludolph, Ken Peccatiello, and the other advisors to Rive Technology for their contributions.
The work and support of CountryMark Cooperative, in particular from John Deaton, Nelson Christian, Dennis Banks, and Sam Nicotra is greatly appreciated.
AM‐12‐25 Page 11