Embed Size (px)
Citation preview
1
Tourism Statistics and TSA Compilation Methods in Asian countries∗
Kozo Miyagawa1
Fumikado Yamamoto2
Etsunobu Kishimoto3
Taku Katsumoto4
1. Introduction
Our main objective is to clarify how the Tourism Satellite Account (TSA) is
compiled in different Asian countries. The TSA provides important indicators that
reflect the scale of a country’s tourism economy. In this study, we focused on 3 areas
related to the compilation of the TSA.
The first area concerned primary tourism statistics, which measure the number of
visitors and tourism expenditure. Since primary statistics can be most the important
fundamental data in the compilation of the TSA, we need to reveal what kind of primary
tourism statistics are used for the compilation.
The second area looked at secondary statistics such as the SNA and the Input
Output table. Since the TSA is one of the satellite accounts of the SNA, the two should
be consistent. Therefore, we need to know how the SNA and the I-O Table are applied
when compiling the TSA.
The third area concerns who in each country is charged with publishing the
primary tourism statistics, the SNA, the I-O Table, and the TSA. In many cases, the
primary tourism statistics and the SNA are developed by different departments. In these
cases, raising the quality of the TSA means ensuring adequate cooperation between
these responsible departments. From this perspective, we surveyed the organizations ∗ This study was supported by the Japan Tourism Agency, the ASEAN Secretariat and a Grant-in-Aid for Scientific Research (C) (25380270) from the Japan Society for the Promotion of Science (JSPS). We thank the Ministry of Industry and Primary Resources of Brunei, the Ministry of Tourism of Cambodia, tourism related organizations of Indonesia, the Korea Tourism Organization, the Ministry of Information, Culture and Tourism of the Lao PDR, the Ministry of Tourism and Culture of Malaysia, the Ministry of Hotels and Tourism of Myanmar, the Department of Tourism of the Philippines, the Singapore Tourism Board, and the Ministry of Tourism and Sports of Thailand for providing valuable information. Of course, any errors are our responsibility. 1 Rissho University 2 Japan Tourism Agency 3 Japan Tourism Agency 4 Mitsubishi Research Institute
2
charged with compiling the TSA in Asian countries.
To clarify the details of these three issues, we conducted a questionnaire survey of
the statistical or tourism bureaus of Asian countries. The results of the survey are
presented in this paper. Additionally, on the basis of the survey results, we compiled
trial tables of the Inbound TSA for Japan.
The remainder of this paper is organized as follows: Section 2 shows the changes
in the number of tourists in Asia and other regions to highlight the importance of
tourism in Asian countries. Details about the survey conducted in this research are
presented in Section 3. In Section 4, the current situations of the tourism statistics and
the compilation methods of the TSA in Japan are introduced as a case study. The results
of the survey are shown in Section 5. The compilation methods and the results of the
Inbound TSA are shown in Section 6. Lastly, conclusions and further topics are offered
in Section 7.
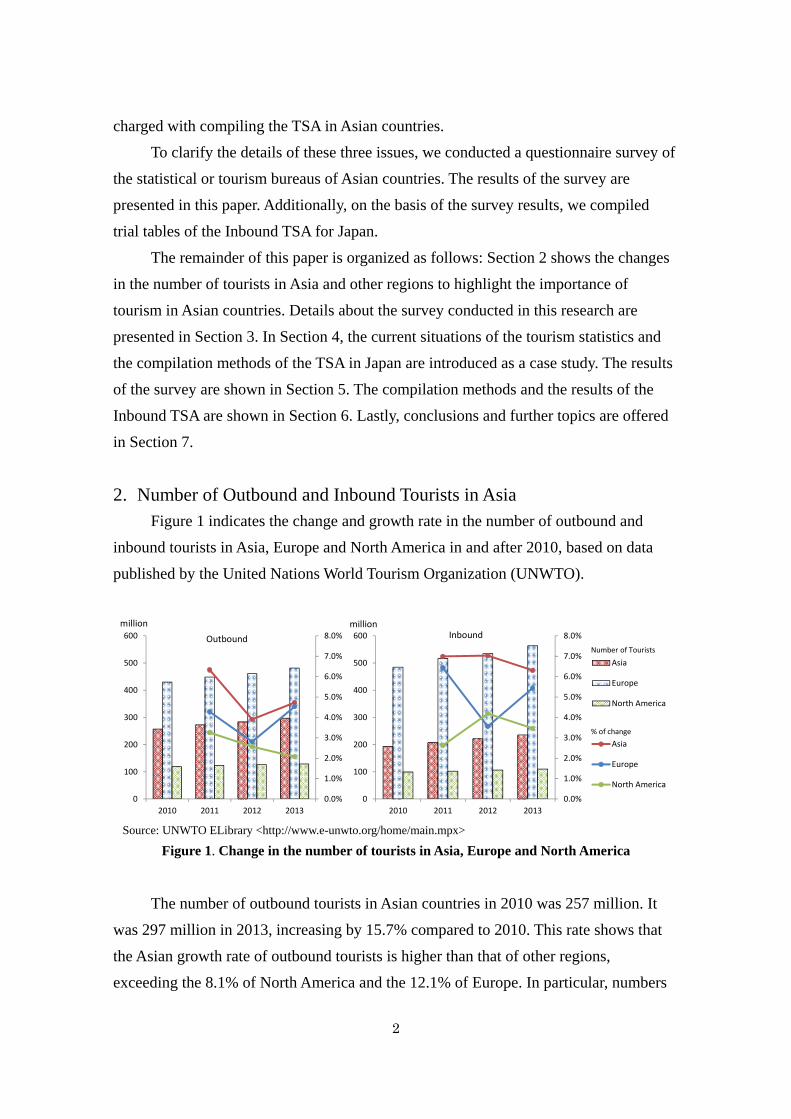
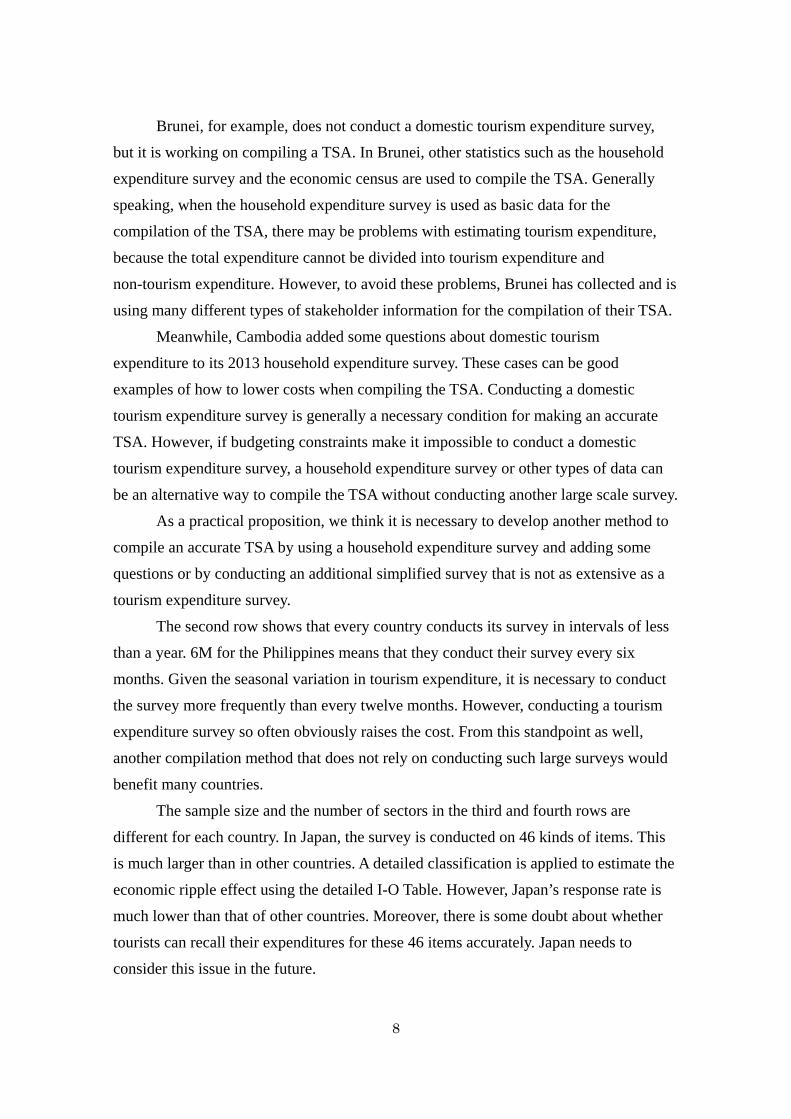
2. Number of Outbound and Inbound Tourists in Asia Figure 1 indicates the change and growth rate in the number of outbound and
inbound tourists in Asia, Europe and North America in and after 2010, based on data
published by the United Nations World Tourism Organization (UNWTO).
Source: UNWTO ELibrary <http://www.e-unwto.org/home/main.mpx>
Figure 1. Change in the number of tourists in Asia, Europe and North America
The number of outbound tourists in Asian countries in 2010 was 257 million. It
was 297 million in 2013, increasing by 15.7% compared to 2010. This rate shows that
the Asian growth rate of outbound tourists is higher than that of other regions,
exceeding the 8.1% of North America and the 12.1% of Europe. In particular, numbers
Number of Tourists
% of change
0.0%
1.0%
2.0%
3.0%
4.0%
5.0%
6.0%
7.0%
8.0%
0
100
200
300
400
500
600
2010 2011 2012 2013
Asia
Europe
North America
Asia
Europe
North America
0.0%
1.0%
2.0%
3.0%
4.0%
5.0%
6.0%
7.0%
8.0%
0
100
200
300
400
500
600
2010 2011 2012 2013
million million
Outbound Inbound
3
of tourists from China have shown a sharp increase, growing from 32 million in 2010 to
56 million in 2013, an increase by 73.5%. The number of outbound tourists in other
Southeast Asian countries has also been steadily growing. In fact, most countries except
for Brunei and Singapore have recorded growth in the 20% to 30% range. The three
highest-growing countries in Southeast Asia are Vietnam, Laos and Cambodia. The
number of outbound tourists was 5.1 million in Vietnam, 1.6 million in Laos and 1
million in Cambodia, and these countries' growth rates compared to 2010 were 59.2%,
75.3% and 89.0% respectively.
The change in the number of inbound tourists in Asia was 194 million in 2010 and
236 million in 2013, a growth of 21.7% compared to 2010. This inbound growth rate in
Asia is higher than that of North America (10.6%) and Europe (16.2%). In particular,
the numbers of inbound tourists in Southeast Asia show a sharp increase, generating
high growth rates of over 25% in every country except for Brunei and Malaysia.
Besides countries in Southeast Asia, other countries and regions such as Hong Kong,
South Korea and Taiwan also show over 25% growth in numbers of inbound tourists
compared to 2010. In Japan, the government's goal of attracting 10 million foreign
tourists was achieved for the first time in 2013. This was a 20.4% increase compared to
2010.
Accordingly, although the scale is still smaller than Europe, the growth rate of
tourism in Asia is higher than in other regions, and tourism is growing into an important
factor of growth in the Asian region. As tourism expands its presence in Asia, tourism
statistics are also becoming important to Asian countries. The following Section
introduces the results of research on tourism statistics and the current TSA situation in
Asia, in order to identify challenges for tourism statistics and further enhancements.
3. About the Survey As mentioned before, we conducted a questionnaire survey about the tourism
statistics and the TSA for Asian countries. For our survey, we targeted the 11 Asian
countries listed in Table 1. We mailed the questionnaires to the tourism statistics
division of each country through the ASEAN Secretariat. The survey was divided into 4
parts.
Firstly, we asked about the status of TSA compilation. The second to fourth parts
corresponded to the research objectives mentioned in Section 1. In the second part, we
asked about the development status of primary tourism statistics in particular for
4
domestic and inbound tourism expenditure, and the number of accommodation guests.
Third, we asked about the SNA and the I-O Table. The development status and the
application method for the compilation of the SNA and the I-O Table were surveyed.
Fourth, we asked the organizations about their cooperative structure related to the
compilation of the TSA. The questionnaire is shown in Appendix A.
Table 1: Countries Targeted by Our Survey
Brunei Cambodia Indonesia Japan
Korea Lao PDR Malaysia Myanmar
Philippines Singapore Thailand
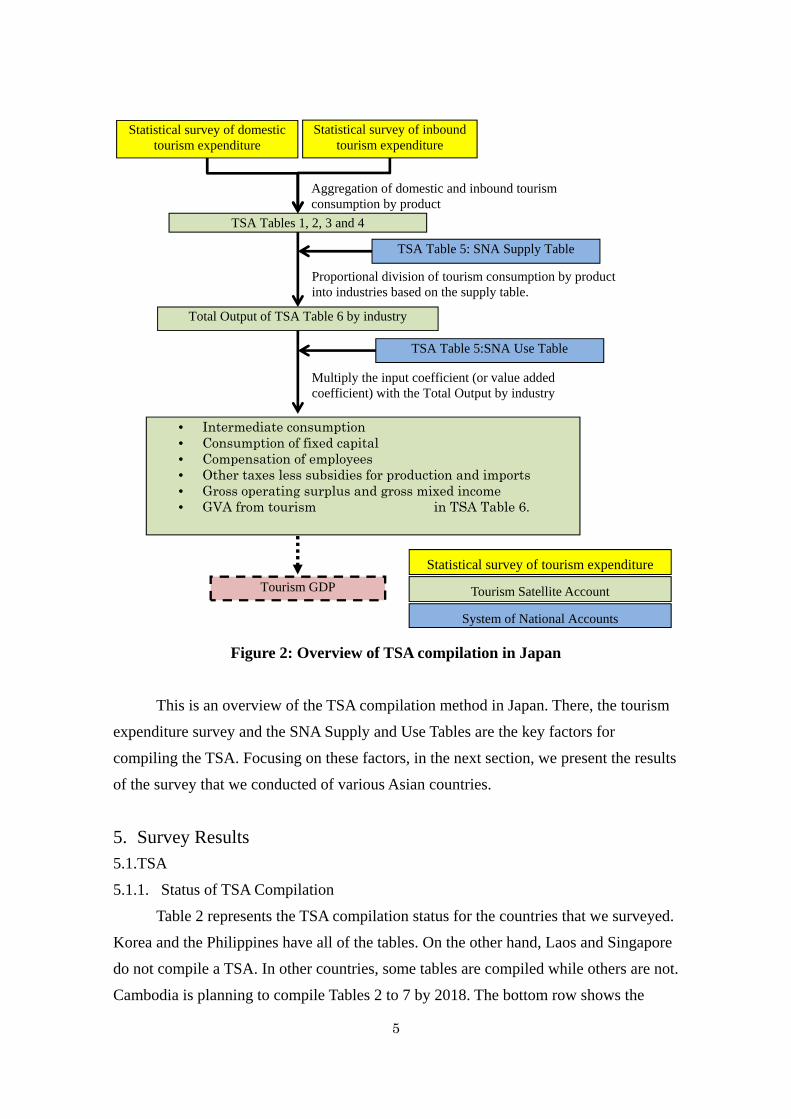
4. Overview of the Japanese Tourism Statistics and the TSA Before showing the survey results, let us provide an overview of tourism
statistics and TSA compilation in Japan. Figure 2 shows the process of TSA
compilation in Japan.
The TSA is compiled annually by the Japan Tourism Agency (JTA). The JTA
conducts 2 types of tourism expenditure surveys. One is a survey of domestic tourism
expenditure. It is conducted based on 46 consumption items. The other is a survey of
inbound tourism expenditure. It is based on 20 consumption items. TSA Tables 1 to 3
are compiled by aggregating these expenditure surveys. Table 4 is compiled based on
Tables 1 to 3.
Table 5 is made by recompiling the SNA Supply and Use Tables. Moreover, the
total output of tourism industries in Table 6 is estimated by dividing Table 5 by Tables 1
to 4. By multiplying the input coefficients or value added coefficients with the total
output by industry, each item of gross value added is calculated in Table 6. The input
coefficients or value added coefficients are obtained from the SNA Use Table. As a
result, the tourism GDP is estimated.
In Japan, while the SNA is made by the Economic and Social Research Institute
in the Cabinet Office (ESRI), the TSA is compiled by the JTA. Therefore, the JTA
receives the detailed Supply and Use Tables from the Economic and Social Research
Institute in order to compile the TSA.
5
Figure 2: Overview of TSA compilation in Japan
This is an overview of the TSA compilation method in Japan. There, the tourism
expenditure survey and the SNA Supply and Use Tables are the key factors for
compiling the TSA. Focusing on these factors, in the next section, we present the results
of the survey that we conducted of various Asian countries.
5. Survey Results 5.1.TSA
5.1.1. Status of TSA Compilation
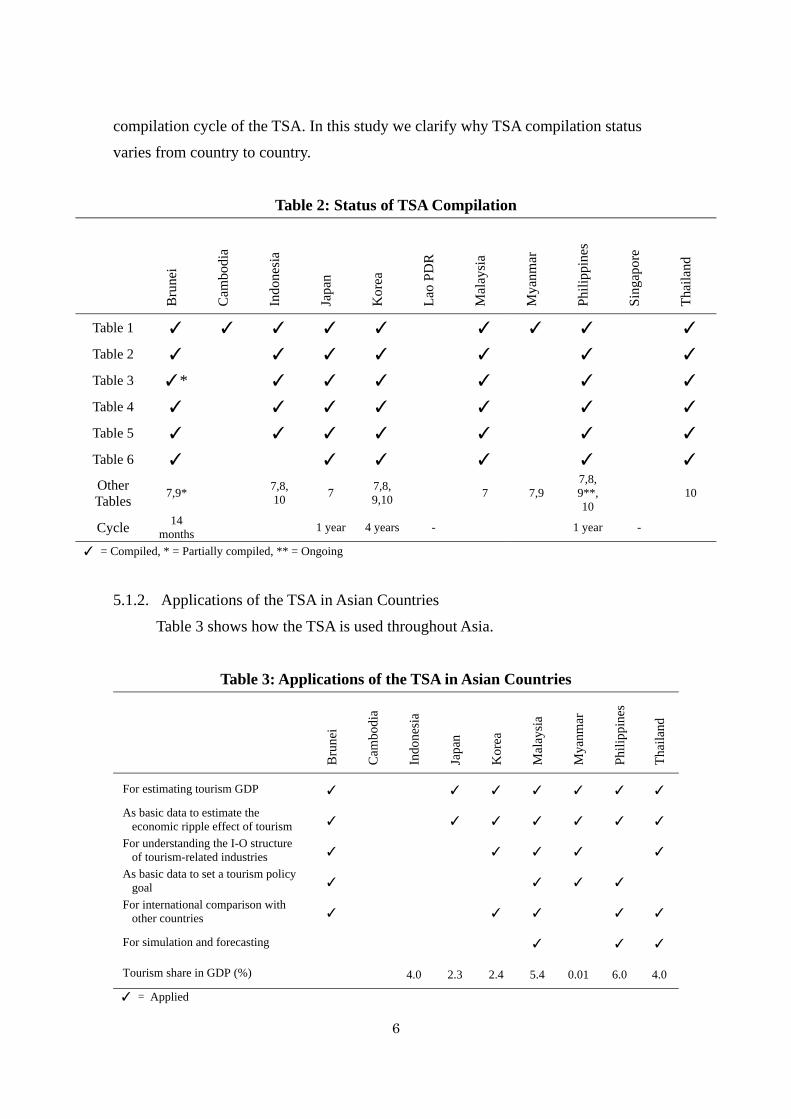
Table 2 represents the TSA compilation status for the countries that we surveyed.
Korea and the Philippines have all of the tables. On the other hand, Laos and Singapore
do not compile a TSA. In other countries, some tables are compiled while others are not.
Cambodia is planning to compile Tables 2 to 7 by 2018. The bottom row shows the
TSA Table 5: SNA Supply Table
Statistical survey of domestic tourism expenditure
TSA Tables 1, 2, 3 and 4
Total Output of TSA Table 6 by industry
TSA Table 5:SNA Use Table
Tourism GDP
Proportional division of tourism consumption by product into industries based on the supply table.
Multiply the input coefficient (or value added coefficient) with the Total Output by industry
Aggregation of domestic and inbound tourism consumption by product
Statistical survey of inbound tourism expenditure
• Intermediate consumption • Consumption of fixed capital • Compensation of employees • Other taxes less subsidies for production and imports • Gross operating surplus and gross mixed income • GVA from tourism in TSA Table 6.
Statistical survey of tourism expenditure
Tourism Satellite Account
System of National Accounts
6
compilation cycle of the TSA. In this study we clarify why TSA compilation status
varies from country to country.
Table 2: Status of TSA Compilation
Bru
nei
Cam
bodi
a
Indo
nesi
a
Japa
n
Kor
ea
Lao
PD
R
Mal
aysi
a
Mya
nmar
Phi
lipp
ines
Sin
gapo
re
Tha
ilan
d
Table 1 ✓ ✓ ✓ ✓ ✓ ✓ ✓ ✓ ✓
Table 2 ✓ ✓ ✓ ✓ ✓ ✓ ✓
Table 3 ✓* ✓ ✓ ✓ ✓ ✓ ✓
Table 4 ✓ ✓ ✓ ✓ ✓ ✓ ✓
Table 5 ✓ ✓ ✓ ✓ ✓ ✓ ✓
Table 6 ✓ ✓ ✓ ✓ ✓ ✓
Other Tables
7,9* 7,8, 10
7 7,8, 9,10
7 7,9 7,8, 9**, 10
10
Cycle 14
months 1 year 4 years - 1 year -
✓ = Compiled, * = Partially compiled, ** = Ongoing
5.1.2. Applications of the TSA in Asian Countries
Table 3 shows how the TSA is used throughout Asia.
Table 3: Applications of the TSA in Asian Countries
Bru
nei
Cam
bodi
a
Indo
nesi
a
Japa
n
Kor
ea
Mal
aysi
a
Mya
nmar
Phi
lippi
nes
Tha
iland
For estimating tourism GDP ✓ ✓ ✓ ✓ ✓ ✓ ✓
As basic data to estimate the economic ripple effect of tourism ✓ ✓ ✓ ✓ ✓ ✓ ✓
For understanding the I-O structure of tourism-related industries ✓ ✓ ✓ ✓ ✓
As basic data to set a tourism policy goal ✓ ✓ ✓ ✓
For international comparison with other countries ✓ ✓ ✓ ✓ ✓
For simulation and forecasting ✓ ✓ ✓
Tourism share in GDP (%) 4.0 2.3 2.4 5.4 0.01 6.0 4.0
✓ = Applied
7
Japan makes the least use among countries compiling a TSA. It was interesting
that the TSA is used as basic data for setting tourism policy goals, and that the TSA was
used for simulation and forecasting in some countries.
5.2.Primary Tourism Statistics
5.2.1. Status of Primary Domestic Tourism Statistics
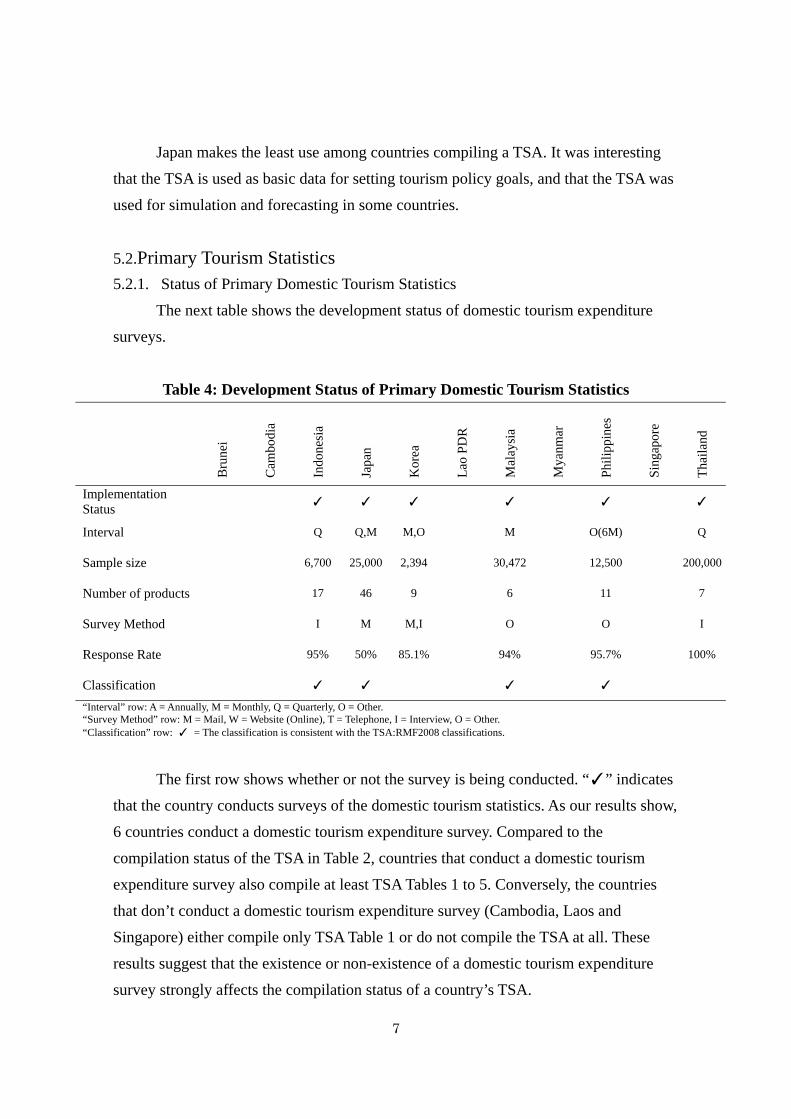
The next table shows the development status of domestic tourism expenditure
surveys.
Table 4: Development Status of Primary Domestic Tourism Statistics
Bru
nei
Cam
bodi
a
Indo
nesi
a
Japa
n
Kor
ea
Lao
PD
R
Mal
aysi
a
Mya
nmar
Phi
lippi
nes
Sin
gapo
re
Tha
iland
Implementation Status
✓ ✓ ✓ ✓ ✓ ✓
Interval Q Q,M M,O M O(6M) Q
Sample size 6,700 25,000 2,394 30,472 12,500 200,000
Number of products 17 46 9 6 11 7
Survey Method I M M,I O O I
Response Rate 95% 50% 85.1% 94% 95.7% 100%
Classification ✓ ✓ ✓ ✓
“Interval” row: A = Annually, M = Monthly, Q = Quarterly, O = Other. “Survey Method” row: M = Mail, W = Website (Online), T = Telephone, I = Interview, O = Other. “Classification” row: ✓ = The classification is consistent with the TSA:RMF2008 classifications.
The first row shows whether or not the survey is being conducted. “✓” indicates
that the country conducts surveys of the domestic tourism statistics. As our results show,
6 countries conduct a domestic tourism expenditure survey. Compared to the
compilation status of the TSA in Table 2, countries that conduct a domestic tourism
expenditure survey also compile at least TSA Tables 1 to 5. Conversely, the countries
that don’t conduct a domestic tourism expenditure survey (Cambodia, Laos and
Singapore) either compile only TSA Table 1 or do not compile the TSA at all. These
results suggest that the existence or non-existence of a domestic tourism expenditure
survey strongly affects the compilation status of a country’s TSA.
8
Brunei, for example, does not conduct a domestic tourism expenditure survey,
but it is working on compiling a TSA. In Brunei, other statistics such as the household
expenditure survey and the economic census are used to compile the TSA. Generally
speaking, when the household expenditure survey is used as basic data for the
compilation of the TSA, there may be problems with estimating tourism expenditure,
because the total expenditure cannot be divided into tourism expenditure and
non-tourism expenditure. However, to avoid these problems, Brunei has collected and is
using many different types of stakeholder information for the compilation of their TSA.
Meanwhile, Cambodia added some questions about domestic tourism
expenditure to its 2013 household expenditure survey. These cases can be good
examples of how to lower costs when compiling the TSA. Conducting a domestic
tourism expenditure survey is generally a necessary condition for making an accurate
TSA. However, if budgeting constraints make it impossible to conduct a domestic
tourism expenditure survey, a household expenditure survey or other types of data can
be an alternative way to compile the TSA without conducting another large scale survey.
As a practical proposition, we think it is necessary to develop another method to
compile an accurate TSA by using a household expenditure survey and adding some
questions or by conducting an additional simplified survey that is not as extensive as a
tourism expenditure survey.
The second row shows that every country conducts its survey in intervals of less
than a year. 6M for the Philippines means that they conduct their survey every six
months. Given the seasonal variation in tourism expenditure, it is necessary to conduct
the survey more frequently than every twelve months. However, conducting a tourism
expenditure survey so often obviously raises the cost. From this standpoint as well,
another compilation method that does not rely on conducting such large surveys would
benefit many countries.
The sample size and the number of sectors in the third and fourth rows are
different for each country. In Japan, the survey is conducted on 46 kinds of items. This
is much larger than in other countries. A detailed classification is applied to estimate the
economic ripple effect using the detailed I-O Table. However, Japan’s response rate is
much lower than that of other countries. Moreover, there is some doubt about whether
tourists can recall their expenditures for these 46 items accurately. Japan needs to
consider this issue in the future.
9
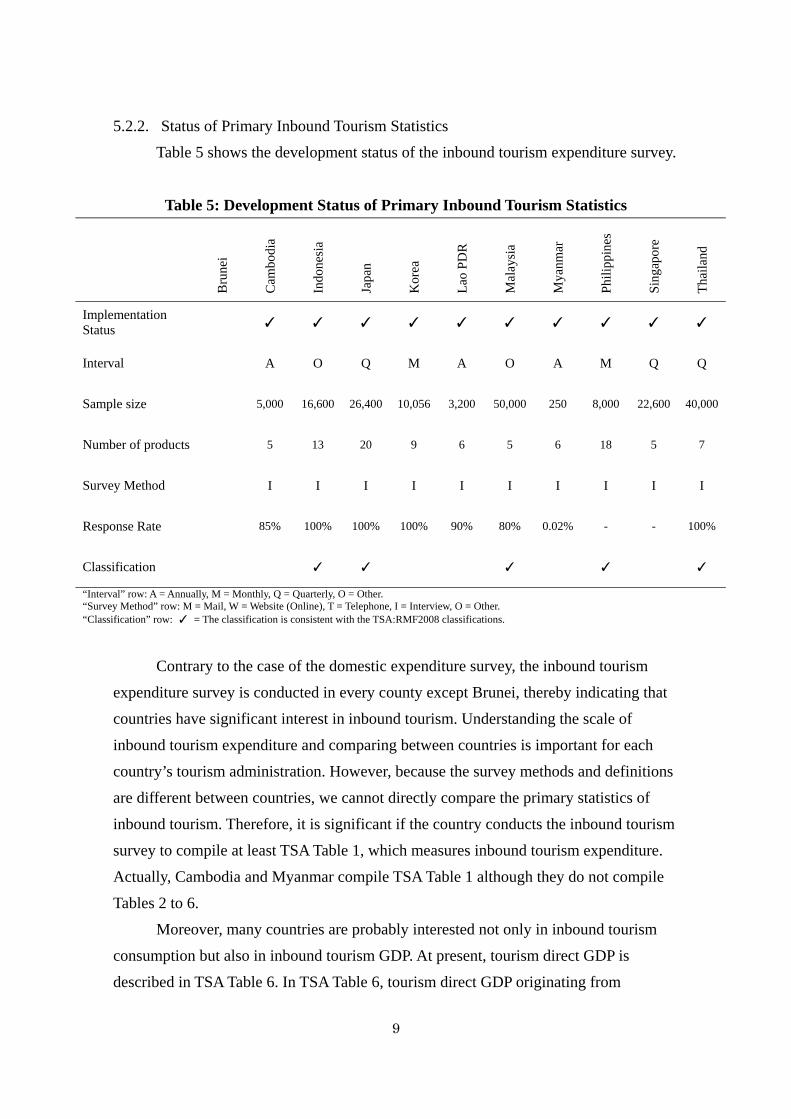
5.2.2. Status of Primary Inbound Tourism Statistics
Table 5 shows the development status of the inbound tourism expenditure survey.
Table 5: Development Status of Primary Inbound Tourism Statistics
Bru
nei
Cam
bodi
a
Indo
nesi
a
Japa
n
Kor
ea
Lao
PD
R
Mal
aysi
a
Mya
nmar
Phi
lippi
nes
Sin
gapo
re
Tha
iland
Implementation Status
✓ ✓ ✓ ✓ ✓ ✓ ✓ ✓ ✓ ✓
Interval A O Q M A O A M Q Q
Sample size 5,000 16,600 26,400 10,056 3,200 50,000 250 8,000 22,600 40,000
Number of products 5 13 20 9 6 5 6 18 5 7
Survey Method I I I I I I I I I I
Response Rate 85% 100% 100% 100% 90% 80% 0.02% - - 100%
Classification ✓ ✓ ✓ ✓ ✓
“Interval” row: A = Annually, M = Monthly, Q = Quarterly, O = Other. “Survey Method” row: M = Mail, W = Website (Online), T = Telephone, I = Interview, O = Other. “Classification” row: ✓ = The classification is consistent with the TSA:RMF2008 classifications.
Contrary to the case of the domestic expenditure survey, the inbound tourism
expenditure survey is conducted in every county except Brunei, thereby indicating that
countries have significant interest in inbound tourism. Understanding the scale of
inbound tourism expenditure and comparing between countries is important for each
country’s tourism administration. However, because the survey methods and definitions
are different between countries, we cannot directly compare the primary statistics of
inbound tourism. Therefore, it is significant if the country conducts the inbound tourism
survey to compile at least TSA Table 1, which measures inbound tourism expenditure.
Actually, Cambodia and Myanmar compile TSA Table 1 although they do not compile
Tables 2 to 6.
Moreover, many countries are probably interested not only in inbound tourism
consumption but also in inbound tourism GDP. At present, tourism direct GDP is
described in TSA Table 6. In TSA Table 6, tourism direct GDP originating from
10
domestic tourism consumption and tourism direct GDP originating from inbound
tourism consumption are not distinguished. From this viewpoint, if a new table
describing inbound tourism GDP is added to the TSA, it may compel more countries to
develop their TSA further. As a practical proposition, we tried to compile the new table
and it is shown in Section 6.
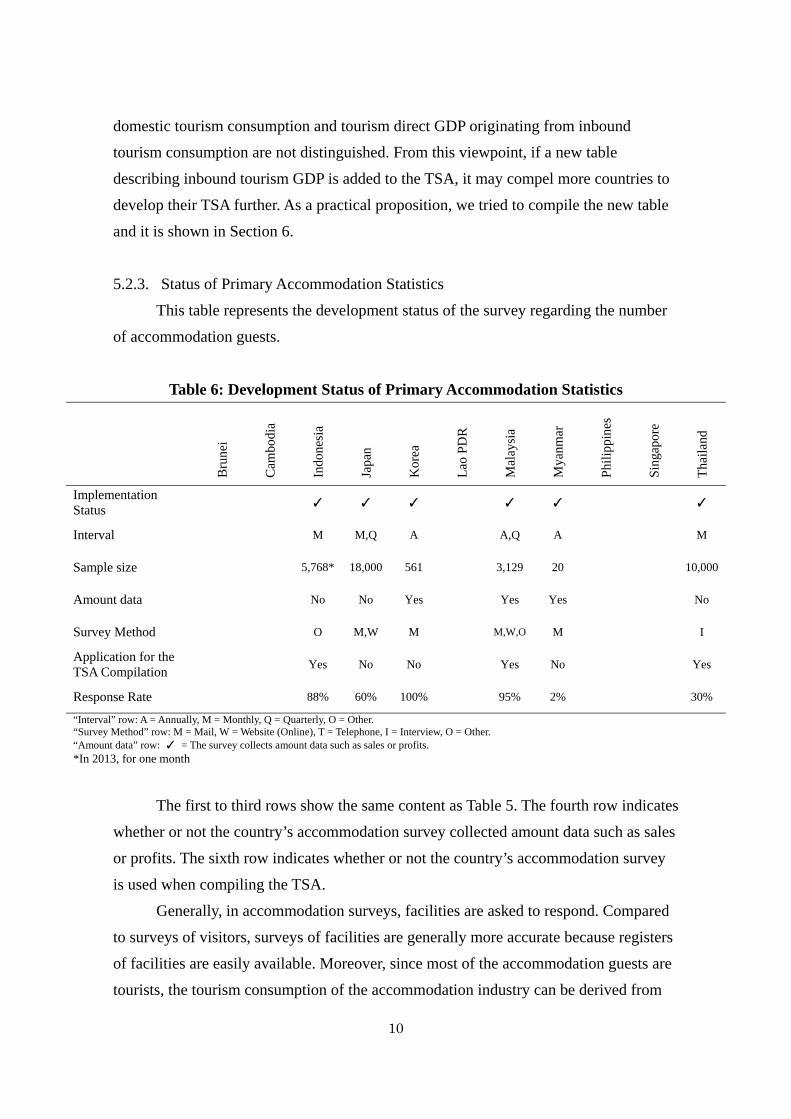
5.2.3. Status of Primary Accommodation Statistics
This table represents the development status of the survey regarding the number
of accommodation guests.
Table 6: Development Status of Primary Accommodation Statistics
Bru
nei
Cam
bodi
a
Indo
nesi
a
Japa
n
Kor
ea
Lao
PD
R
Mal
aysi
a
Mya
nmar
Phi
lippi
nes
Sin
gapo
re
Tha
iland
Implementation Status
✓ ✓ ✓ ✓ ✓ ✓
Interval M M,Q A A,Q A M
Sample size 5,768* 18,000 561 3,129 20 10,000
Amount data No No Yes Yes Yes No
Survey Method O M,W M M,W,O M I
Application for the TSA Compilation
Yes No No Yes No Yes
Response Rate 88% 60% 100% 95% 2% 30%
“Interval” row: A = Annually, M = Monthly, Q = Quarterly, O = Other. “Survey Method” row: M = Mail, W = Website (Online), T = Telephone, I = Interview, O = Other. “Amount data” row: ✓ = The survey collects amount data such as sales or profits. *In 2013, for one month
The first to third rows show the same content as Table 5. The fourth row indicates
whether or not the country’s accommodation survey collected amount data such as sales
or profits. The sixth row indicates whether or not the country’s accommodation survey
is used when compiling the TSA.
Generally, in accommodation surveys, facilities are asked to respond. Compared
to surveys of visitors, surveys of facilities are generally more accurate because registers
of facilities are easily available. Moreover, since most of the accommodation guests are
tourists, the tourism consumption of the accommodation industry can be derived from
11
the survey of accommodation facilities. Therefore, this type of survey can be useful in
the compilation of part of the TSA.
However, only 3 countries (Indonesia, Malaysia, and Thailand) use the
accommodation survey in compiling their TSAs, and only Malaysia actually collected
amount data. In Malaysia, even the value of gross output, intermediate input, value
added, value of assets, total number of persons engaged, and their salaries and wages
are collected for the accommodation survey. If such detailed information can be
collected, the accommodation survey will be an effective tool for estimates about the
accommodation industry in the TSA.
As previously mentioned, since the accommodation survey is conducted for
establishments, compared to a survey targeting visitors, there is a much higher
possibility of collecting robust data. From this perspective, for compiling the TSA, it is
important to develop a method like an accommodation survey for utilizing supply-side
establishment data.
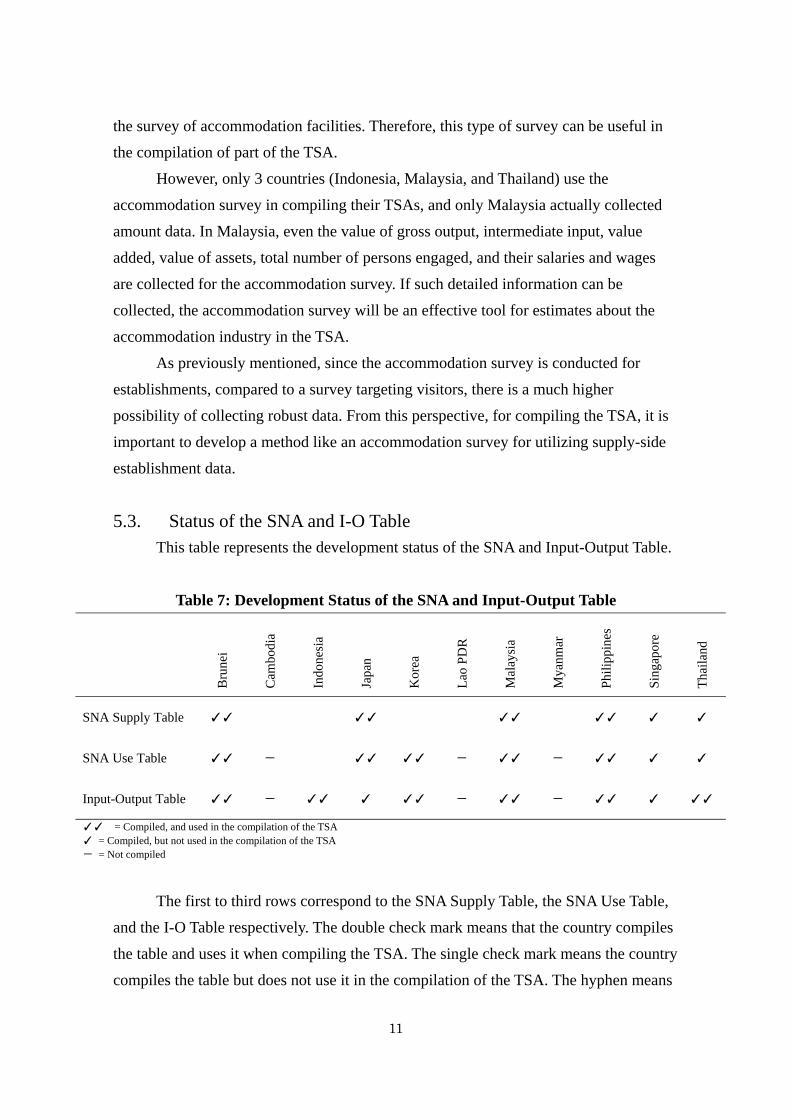
5.3. Status of the SNA and I-O Table This table represents the development status of the SNA and Input-Output Table.
Table 7: Development Status of the SNA and Input-Output Table
Bru
nei
Cam
bodi
a
Indo
nesi
a
Japa
n
Kor
ea
Lao
PD
R
Mal
aysi
a
Mya
nmar
Phi
lippi
nes
Sin
gapo
re
Tha
iland
SNA Supply Table ✓✓ - ✓✓ - - ✓✓ - ✓✓ ✓ ✓
SNA Use Table ✓✓ - ✓✓ ✓✓ - ✓✓ - ✓✓ ✓ ✓
Input-Output Table ✓✓ - ✓✓ ✓ ✓✓ - ✓✓ - ✓✓ ✓ ✓✓
✓✓ = Compiled, and used in the compilation of the TSA ✓ = Compiled, but not used in the compilation of the TSA - = Not compiled
The first to third rows correspond to the SNA Supply Table, the SNA Use Table,
and the I-O Table respectively. The double check mark means that the country compiles
the table and uses it when compiling the TSA. The single check mark means the country
compiles the table but does not use it in the compilation of the TSA. The hyphen means
12
the country does not compile the table at all.
Only Cambodia, Laos and Myanmar do not compile any of the tables. Cambodia
is planning to compile the Supply-Use Tables and the I-O Table in 2018. All cells for
Singapore are filled by single checks, since Singapore does not compile a TSA. Many of
the countries compiling a TSA make Supply and Use Tables, and use them to compile
the TSA. We should point out that the Supply and Use Tables are used to make Tables 5
and 6 in the TSA. Additionally, 6 countries use the I-O Table when compiling their
TSA.
It is noteworthy that many countries use the I-O Table in TSA compilation, even
though using the I-O Table as basic data in TSA compilation is not recommended by
TSA RMF 2008. As for the compilation of the I-O Table, the generally recommended
method is to compile the Supply and Use Tables first, and then use these tables to
compile a symmetric I-O Table. However, some countries in Asia compile a unique I-O
Table using different methods based on different concepts and definitions. For example,
in Japan, an asymmetric I-O Basic Table and Supply Table are compiled first, and only
then is a Use Table compiled. Unfortunately, we were unable to collect concrete
information about how the I-O Tables are used when compiling the TSA. However,
Asian countries may use the I-O Table for TSA compilation in unique ways.
5.4. Organizations The Table 8 shows the results concerning the organizations responsible for
tourism statistics, the SNA, and the TSA. The letters in the table signify the
organizations or departments in charge of the statistics. “T” means the National Tourism
Organization, “S” means the National Statistical Organization, “E” means Economic
Planning Organizations, and “B” means the Central Bank. Numbers shown in
parentheses indicate the number of people in charge.
The first and second rows correspond to the domestic tourism expenditure survey
and the inbound tourism expenditure survey respectively. In many countries, the
National Tourism Organization conducts the tourism expenditure surveys. In some
countries, the National Statistical Organization and the National Tourism Organization
are both in charge of the tourism expenditure surveys. On the other hand, the third and
fourth rows correspond to the SNA and the I-O Table. This shows that, in many
countries, the National Statistical Organization is responsible for the compilation of the
SNA and the I-O Table. However, in some countries, Economic Planning Organizations
13
and the Central Bank are responsible. The fifth row shows the department which
compiles the TSA.
Table 8: Organizations in Charge
B
rune
i
Cam
bodi
a
Indo
nesi
a
Japa
n
Kor
ea
Lao
PD
R
Mal
aysi
a
Mya
nmar
Phi
lippi
nes
Sin
gapo
re
Tha
iland
Statistics on domestic tourism expenditure
- T/S/B
(3) S
(2) T
(3) T -
S (6)
T/S/B T/S (8)
- T
(9*) Statistics on inbound tourism expenditure
- T
(3) T/S (4)
T (3)
T T T
(47) T
T (4)
T (10)
SNA E
(4) S
(4) S
E (63)
B - S
(51) -
S (13)
S (13)
E (35)
Input-Output table E
(4) T/S (5)
S S
(5) B -
S (18)
- S
(13) S
(13) E
(4)
TSA T
(5) T/S/B
(7) T/S (15)
T (3)
T - S
(7) -
T/S (8)
- T
T = National Tourism Organization, S = National Statistical Organization, E = Economic Planning Organizations, B = Central Bank( ) = Number of people in charge *Including people in charge of the TSA
In Cambodia, Indonesia and the Philippines, more than one department
collaborate on the compilation of the TSA, whereas in Malaysia, the statistics
department works alone in compiling the TSA. In these four countries, since the
department in charge of the SNA is involved in the compilation of the TSA, it can be
expected that the SNA and the TSA will be highly consistent.
Meanwhile, the departments in charge of the SNA do not participate in the
compilation of the TSA in three countries. Japan is one of the countries in which this is
the case. As mentioned in Section 4, the department responsible for the SNA provides
some data to the JTA, which in charge of the TSA. However, because of this
arrangement, it is difficult for the JTA to give either new or more detailed data to those
compiling the SNA. In the Japanese case, a more cooperative framework between the
departments in charge of the TSA and the SNA would be helpful in compiling a more
accurate TSA.
Moreover, we received some comments from countries that do not compile a
TSA. One comment was: “It is difficult to compile the TSA because of the absence of a
cooperative framework between the departments in charge of the TSA and the SNA.”
14
Another comment was: “Since only the tourism department compiles the TSA, some
international framework for professional technical support is needed.” We believe that it
will be necessary to establish a new international group providing technical support for
the compilation of the TSA, or a new framework for exchanging views about the TSA in
Asia.
6. Estimation of Inbound Tourism GDP The research indicated in the previous Section found that although statistical
surveys on inbound tourism are conducted in all countries except for Brunei, statistical
surveys on domestic travel are not conducted in Singapore and several other countries,
which shows that a TSA is not developed in those countries. Consequently, data for
statistical surveys on inbound tourism cannot be compared, as statistical standards and
methods are different in each country. To compare the scale of tourism in Asian
countries, it is crucial to develop secondary statistics followed by a common standard
such as a TSA. As a method to compare inbound tourism in each country, this Section
attempts to estimate inbound tourism GDP by creating TSA Table 6, focusing only on
inbound tourism.
In order to estimate inbound tourism GDP, the method applied was basically the
same as the method to estimate the usual tourism GDP in TSA Table 6 including
domestic tourism. The estimate was made as follows: First, based on the usual TSA
Table 5, the output value of tourism product by industry was estimated from the
inbound visitors’ expenditure by product shown in TSA Table 4, based on the
assumption that the industrial composition ratio in which each product is produced is
constant. The inbound tourism GDP of each industry was then estimated based on the
assumption that the gross value added ratio of industries is the same for inbound tourists
and domestic tourists.
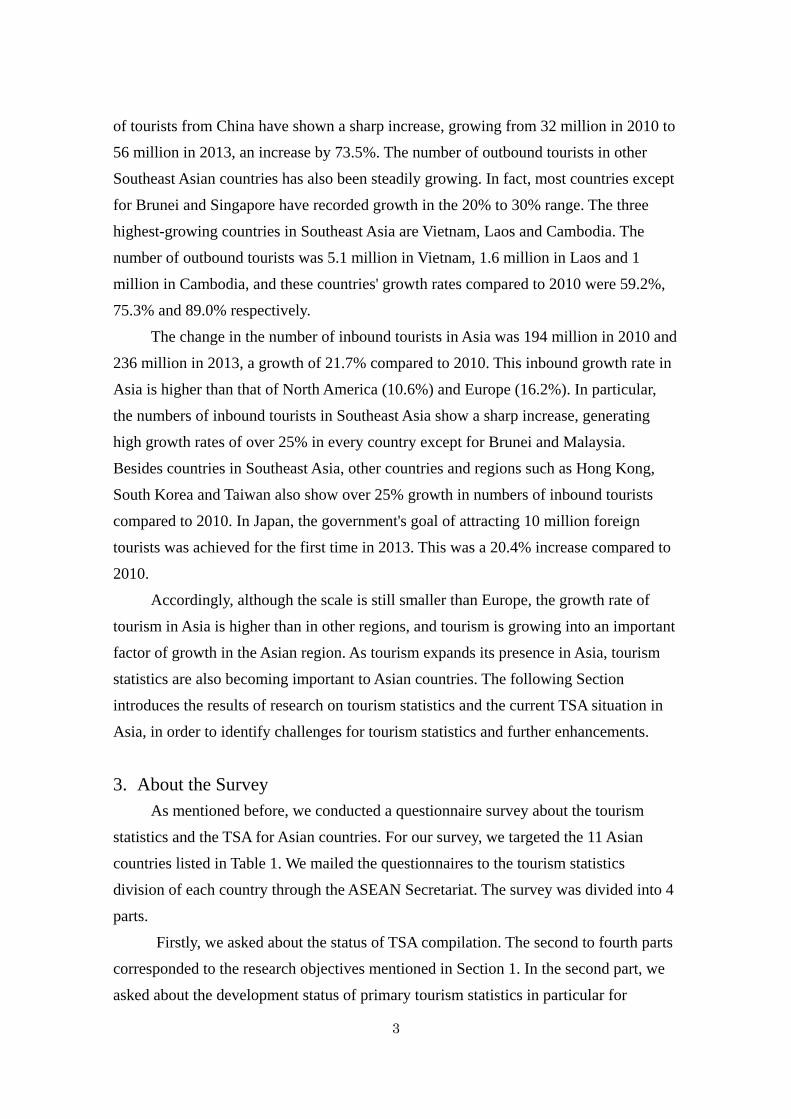
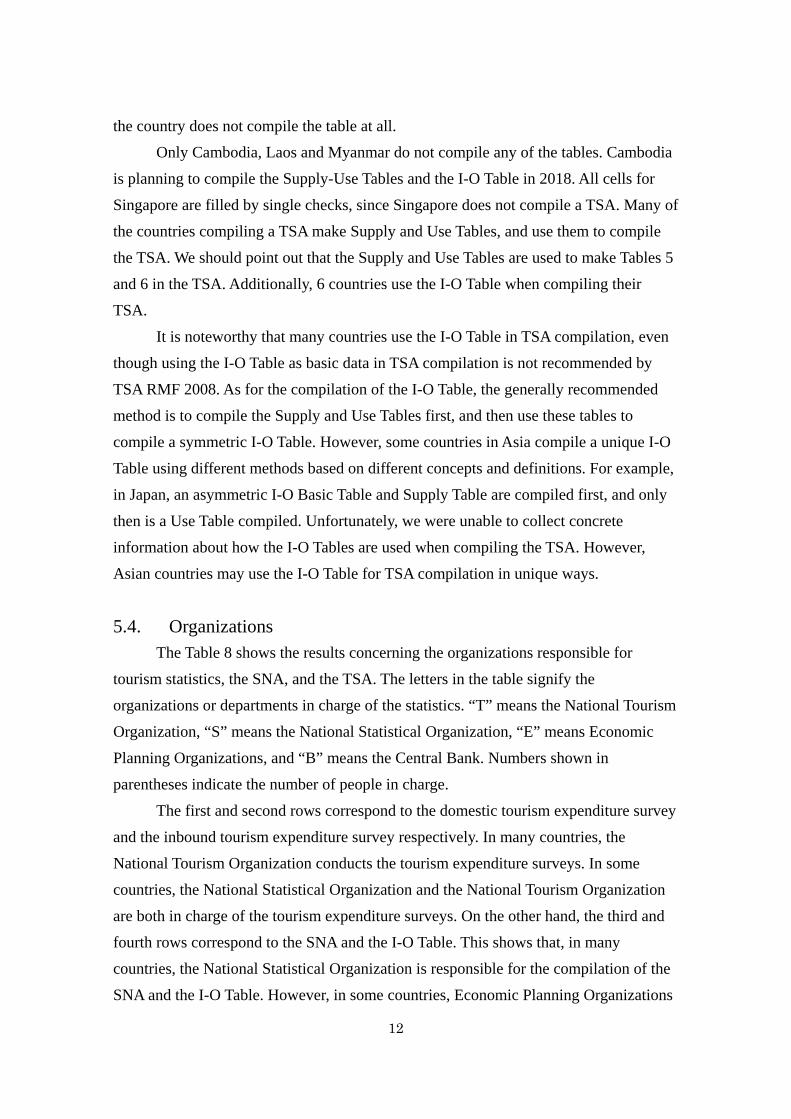
Figure 3 shows the changes in calculated provisional inbound tourism GDP and
domestic tourism GDP. Inbound tourism GDP in 2012 was 478 billion yen. In terms of
time series change, as domestic tourism GDP has been consistently decreasing, the ratio
of inbound tourism GDP to total tourism GDP showed a sharp increase from 3.1% in
2004 to 5.5% in 2012.
15
Figure 3. Japanese Inbound and Domestic Tourism GDP
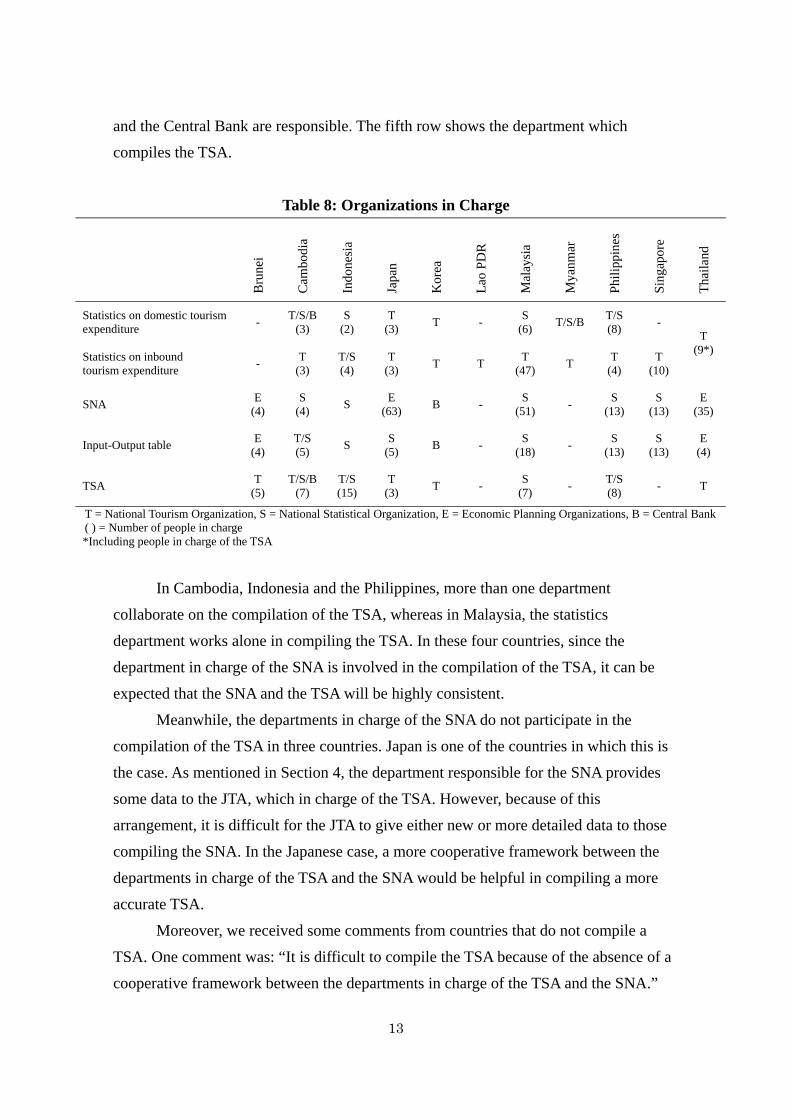
Furthermore, Figure 4 indicates inbound tourism GDP by industry for 2010, 2011
and 2012. In 2011, Japan was hit by a large earthquake which led to an accident at a
nuclear power plant. Inbound tourism GDP decreased from 2010 to 2011 in all
industries. In 2012, however, inbound tourism GDP rapidly recovered, exceeding 2010
levels in the hotel, restaurant and railway transportation businesses. By contrast,
recovery in air transportation was slower in 2011 to 2012, and in 2012, the level
remained lower than it had been in 2010. One factor behind this result may be that while
output value in accommodation, restaurants and railway passenger transport is rising as
more inbound visitors visit Japan, Japanese airlines may be losing their share due to the
increase in the number of LCCs, in particular foreign airline companies.
Figure 4. Japanese Inbound Tourism GDP by Industry
0
100
200
300
400
500
600
700
800
0
2,000
4,000
6,000
8,000
10,000
12,000
2004 2005 2006 2007 2008 2009 2010 2011 2012
Inbound TGDP (Billion Yen
)
Domestic TG
DP (Billion Yen
)
Domestic TGDP
Inbound TGDP
0
50
100
150
200
250
2010
2011
2012
16
One of the big advantages to the calculation of inbound tourism GDP by industry
is that it is able to identify, as it has here, the economic impact on industries caused by
changing the number of inbound tourists. If Asian countries shared the same kind of
framework indicated here, analysis of inbound tourism trends would become possible
through the comparison of inbound tourism GDPs by industry in each country. The
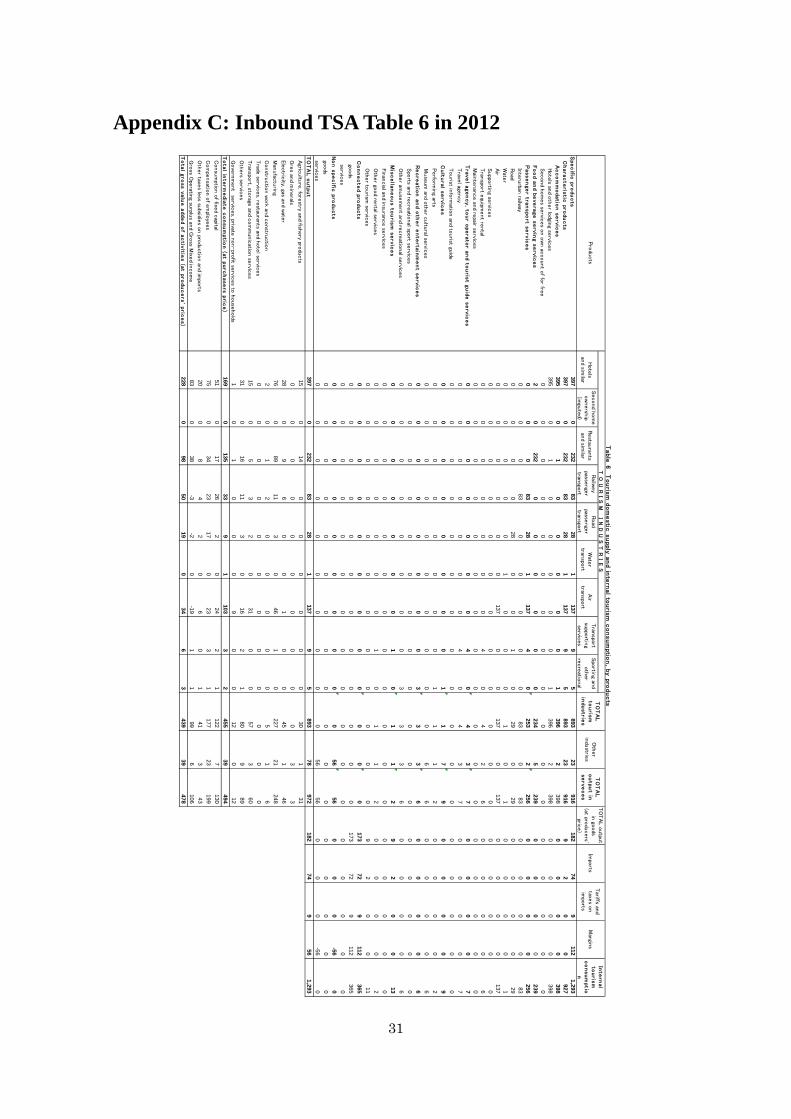
2012 Inbound TSA Table 6 is included in Appendix 3.
7. Conclusions To conclude, we summarize the results of our research and give some remarks
about the challenges facing further improvement of tourism statistics and the TSA in
Asia.
With regards to domestic tourism expenditure statistics, our research revealed
that countries that do not conduct a domestic tourism expenditure survey tend not to
compile a TSA. This indicates that domestic tourism expenditure statistics are essential
in compiling the current TSA. However, we also learned that it is often too expensive
for countries to conduct a domestic expenditure survey. Therefore, we need to develop a
new compilation method that allows for the compilation of the TSA using an existing
household expenditure survey or a more simplified tourism expenditure survey. We
believe that this may ultimately lead to more Asian countries’ becoming interested in
compiling their own TSAs.
Additionally, we conducted a survey about the inbound tourism expenditure
survey. We found that most countries conducted an inbound tourism expenditure survey,
suggesting that they are highly interested in inbound tourism. Yet our research also
found that, despite conducting an inbound tourism expenditure survey, some countries
do not compile even TSA Table 1. However, even without a domestic expenditure
survey, these countries are still able to compile TSA Table 1. Therefore, we recommend
that compiling at least TSA Table 1 would improve the comparability of inbound
tourism across Asian countries. Furthermore, if a new TSA format describing inbound
tourism GDP is developed, many countries may become more interested in the TSA.
From this perspective, one of the main achievements of this research was the
compilation of the trial table of the inbound TSA in this paper.
Moreover, the survey asked about the organizations responsible for compiling
tourism related statistics. In many countries, different departments are in charge of the
SNA and TSA. In some cases, the TSA is compiled by members of a country’s tourism

17
department who are not necessarily statistical experts. Due to organizational problems,
some countries want to establish a new international framework to provide technical
assistance and to exchange views about the TSA. If such a new framework is developed,
a more accurate TSA will provide a better understanding of the current tourism situation
in Asia.
18
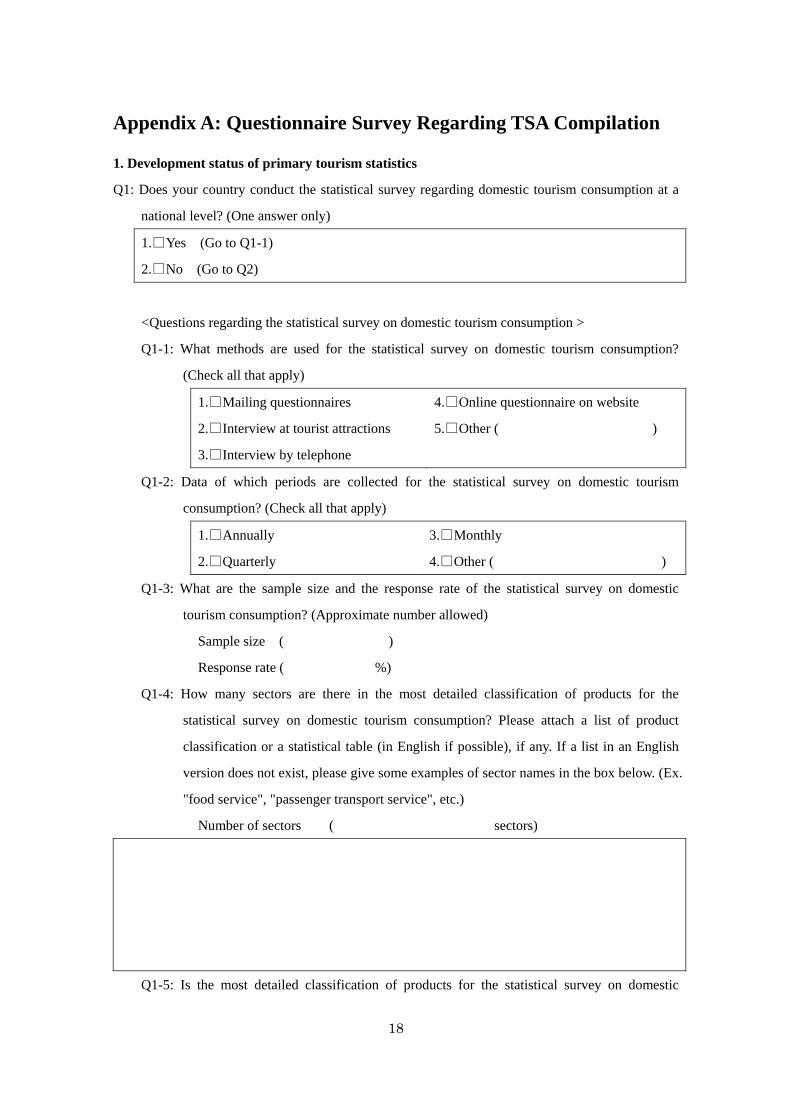
Appendix A: Questionnaire Survey Regarding TSA Compilation
1. Development status of primary tourism statistics
Q1: Does your country conduct the statistical survey regarding domestic tourism consumption at a
national level? (One answer only)
1.□Yes (Go to Q1-1)
2.□No (Go to Q2)
<Questions regarding the statistical survey on domestic tourism consumption >
Q1-1: What methods are used for the statistical survey on domestic tourism consumption?
(Check all that apply)
1.□Mailing questionnaires
2.□Interview at tourist attractions
3.□Interview by telephone
4.□Online questionnaire on website
5.□Other ( )
Q1-2: Data of which periods are collected for the statistical survey on domestic tourism
consumption? (Check all that apply)
1.□Annually
2.□Quarterly
3.□Monthly
4.□Other ( )
Q1-3: What are the sample size and the response rate of the statistical survey on domestic
tourism consumption? (Approximate number allowed)
Sample size ( )
Response rate ( %)
Q1-4: How many sectors are there in the most detailed classification of products for the
statistical survey on domestic tourism consumption? Please attach a list of product
classification or a statistical table (in English if possible), if any. If a list in an English
version does not exist, please give some examples of sector names in the box below. (Ex.
"food service", "passenger transport service", etc.)
Number of sectors ( sectors)
Q1-5: Is the most detailed classification of products for the statistical survey on domestic
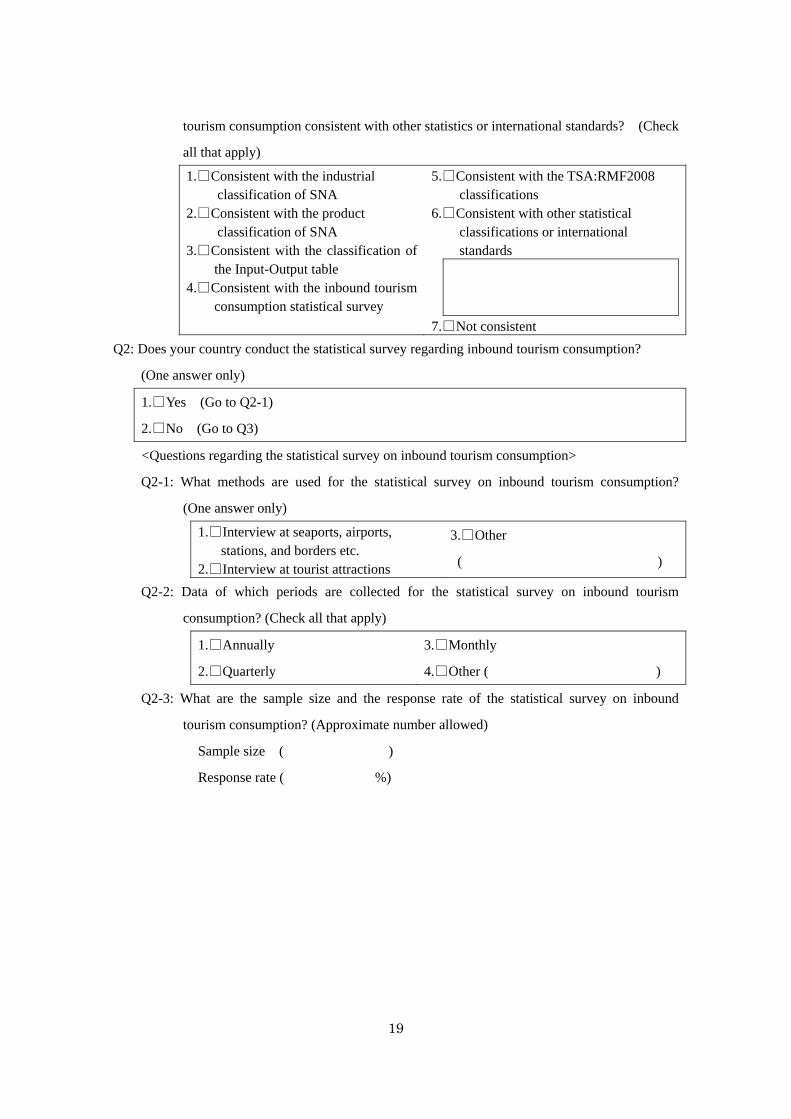
19
tourism consumption consistent with other statistics or international standards? (Check
all that apply)
1.□Consistent with the industrial classification of SNA
2.□Consistent with the product classification of SNA
3.□Consistent with the classification of the Input-Output table
4.□Consistent with the inbound tourism consumption statistical survey
5.□Consistent with the TSA:RMF2008 classifications 6.□Consistent with other statistical
classifications or international standards
7.□Not consistent
Q2: Does your country conduct the statistical survey regarding inbound tourism consumption?
(One answer only)
1.□Yes (Go to Q2-1)
2.□No (Go to Q3)
<Questions regarding the statistical survey on inbound tourism consumption>
Q2-1: What methods are used for the statistical survey on inbound tourism consumption?
(One answer only)
1.□Interview at seaports, airports, stations, and borders etc.
2.□Interview at tourist attractions
3.□Other
( )
Q2-2: Data of which periods are collected for the statistical survey on inbound tourism
consumption? (Check all that apply)
1.□Annually
2.□Quarterly
3.□Monthly
4.□Other ( )
Q2-3: What are the sample size and the response rate of the statistical survey on inbound
tourism consumption? (Approximate number allowed)
Sample size ( )
Response rate ( %)
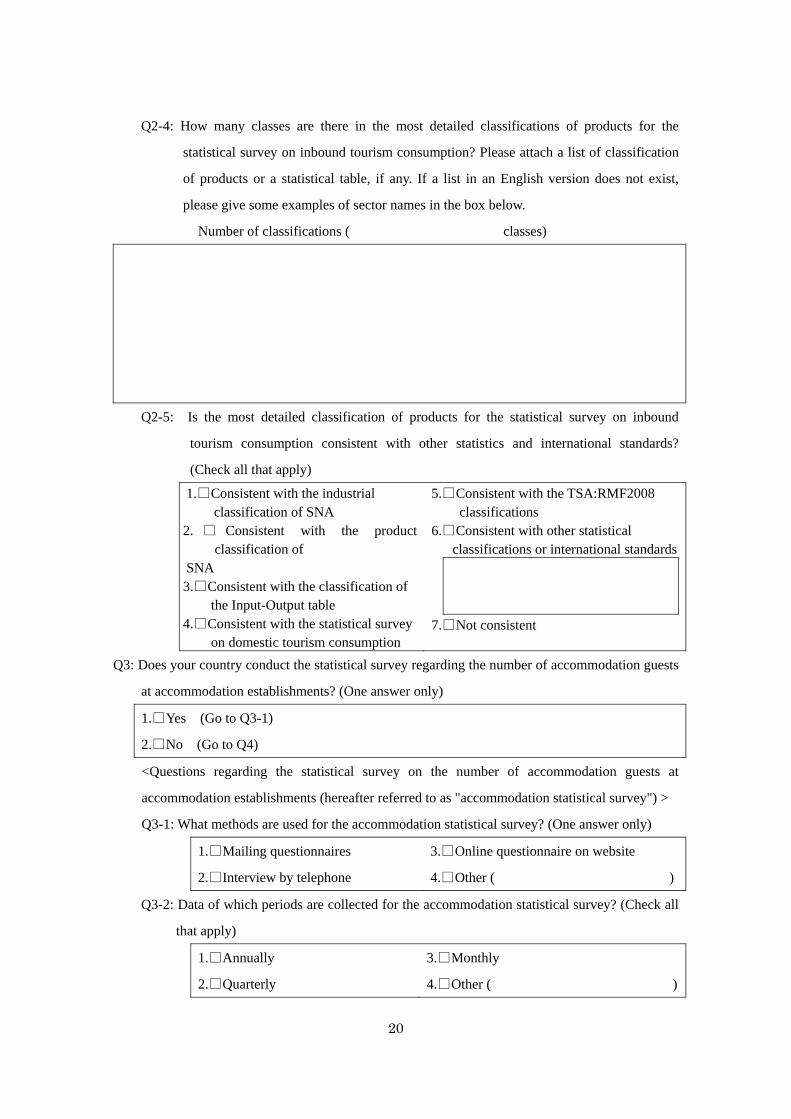
20
Q2-4: How many classes are there in the most detailed classifications of products for the
statistical survey on inbound tourism consumption? Please attach a list of classification
of products or a statistical table, if any. If a list in an English version does not exist,
please give some examples of sector names in the box below.
Number of classifications ( classes)
Q2-5: Is the most detailed classification of products for the statistical survey on inbound
tourism consumption consistent with other statistics and international standards?
(Check all that apply)
1.□Consistent with the industrial classification of SNA
2. □ Consistent with the product classification of
SNA 3.□Consistent with the classification of
the Input-Output table 4.□Consistent with the statistical survey
on domestic tourism consumption
5.□Consistent with the TSA:RMF2008 classifications 6.□Consistent with other statistical classifications or international standards
7.□Not consistent
Q3: Does your country conduct the statistical survey regarding the number of accommodation guests
at accommodation establishments? (One answer only)
1.□Yes (Go to Q3-1)
2.□No (Go to Q4)
<Questions regarding the statistical survey on the number of accommodation guests at
accommodation establishments (hereafter referred to as "accommodation statistical survey") >
Q3-1: What methods are used for the accommodation statistical survey? (One answer only)
1.□Mailing questionnaires
2.□Interview by telephone
3.□Online questionnaire on website
4.□Other ( )
Q3-2: Data of which periods are collected for the accommodation statistical survey? (Check all
that apply)
1.□Annually
2.□Quarterly
3.□Monthly
4.□Other ( )
21
Q3-3: What are the sample size and the response rate of the accommodation statistical survey?
(Approximate number allowed)
Sample size ( )
Response rate ( %)
Q3-4: How is the number of accommodation guests categorized in the accommodation
statistical survey? (Check all that apply)
1.□Sorted by domestic and foreign nationals 2.□Sorted by domestic guests within the area and outside the area (Ex. within or
outside the prefecture) 3.□Residential area of foreign nationals 4.□Other ( )
Q3-5: Is amount data such as sales or profits collected in the accommodation statistical survey?
(One answer only)
1.□Yes, amount data is filled out
2.□No, amount data is not filled out
Q3-6: Does your country use the accommodation statistical survey for compiling TSA? (One
answer only)
1.□Yes
2.□No
Q3-7: Please write an overview of how the accommodation statistical survey is used for
developing TSA.
Q4: What statistics other than the three statistics mentioned above are used in your country for TSA
compilation? (Ex. Economic Census, Housing and land survey, Balance of Payments statistics,
financial statements of airline companies, etc)
22
2. Development status of the SNA and Input-Output table
Q5: Does your country compile the SNA and Input-Output table? Please answer the compilation
status of SNA and Input-Output table (compilation cycle and last update year), and the status of
utilization for TSA. Please attach the latest versions of these tables (in English if possible) when
returning this questionnaire.
Compilation status
(One answer only)
Compilation cycle
(upper line)
Last update (lower line)
Status of utilization
for TSA
(One answer only)
SNA
Use Table
1.□Compiled
2.□Not compiled
(yr.)
(yr.)
1.□Yes
2.□No
SNA Supply table
(or Make Table)
1.□Compiled
2.□Not compiled
(yr.)
(yr.)
1.□Yes
2.□No
Input-Output table 1.□Compiled
2.□Not compiled
(yr.)
(yr.)
1.□Yes
2.□No
3. TSA compilation status and method
Q6: Please answer the compilation status of TSA tables 1 to 10 in your country. Please place a check
beside the tables compiled. Please attach the latest versions of these tables (in English if
possible) when returning this questionnaire.
Compiled
Table 1: Inbound tourism expenditure by products and classes of visitors □
Table 2: Domestic tourism expenditure by products and classes of visitors and types
of trips
□
Table 3: Outbound tourism expenditure by products and classes of visitors □
Table 4: Internal tourism consumption by products □
Table 5: Production accounts of tourism industries and other industries □
Table 6: Total domestic supply and internal tourism consumption □
Table 7: Employment in the tourism industries □
Table 8: Tourism gross fixed capital formation of tourism industries and other
industries
□
Table 9: Tourism collective consumption by products and levels of government □
Table 10: Non monetary indicators □
Go to Q6-1 if Table 6 is compiled.
Go to Q6-6 if Table 6 is not compiled.
23
<Questions regarding compilation methods of TSA (Table 6) in your country>
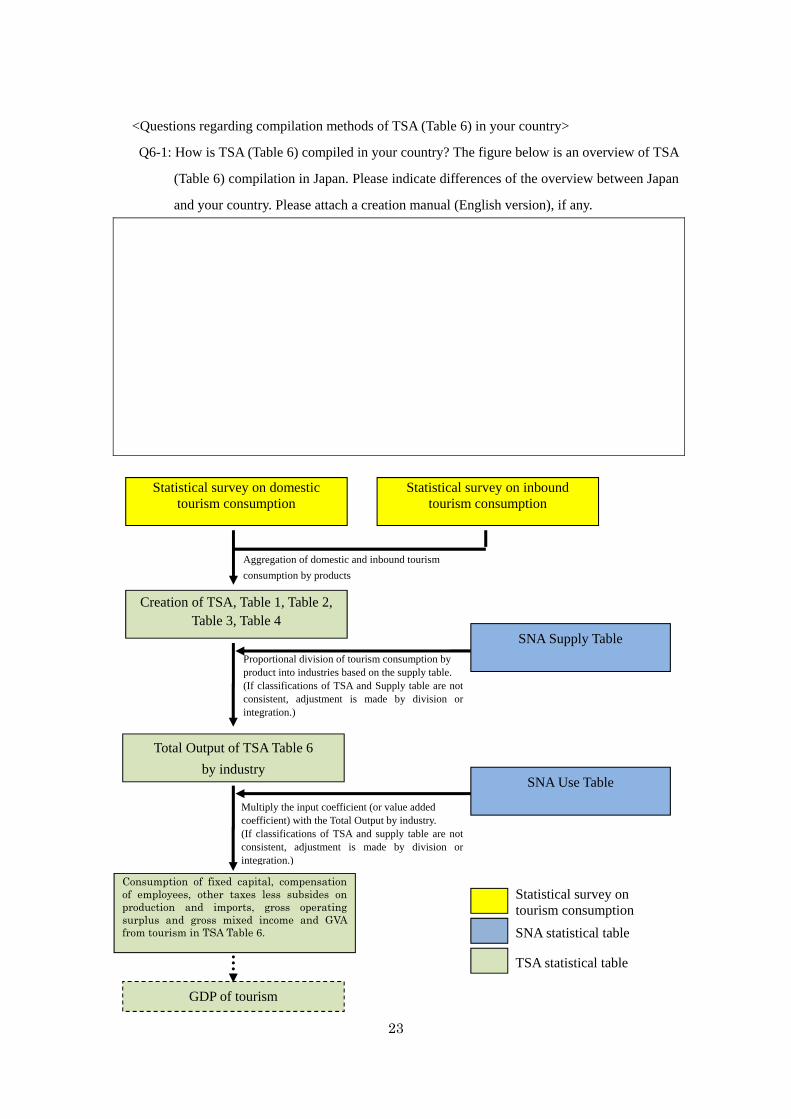
Q6-1: How is TSA (Table 6) compiled in your country? The figure below is an overview of TSA
(Table 6) compilation in Japan. Please indicate differences of the overview between Japan
and your country. Please attach a creation manual (English version), if any.
SNA Supply Table
Statistical survey on domestic tourism consumption
Creation of TSA, Table 1, Table 2, Table 3, Table 4
Total Output of TSA Table 6
by industry SNA Use Table
GDP of tourism
Proportional division of tourism consumption by product into industries based on the supply table. (If classifications of TSA and Supply table are not consistent, adjustment is made by division or integration.)
Multiply the input coefficient (or value added coefficient) with the Total Output by industry. (If classifications of TSA and supply table are not consistent, adjustment is made by division or integration.)
Aggregation of domestic and inbound tourism
consumption by products
Statistical survey on inbound tourism consumption
Statistical survey on tourism consumption
SNA statistical table
TSA statistical table
Consumption of fixed capital, compensation of employees, other taxes less subsides on production and imports, gross operating surplus and gross mixed income and GVA from tourism in TSA Table 6.
24
Q6-2: What kind of price is adopted in the TSA (Table 6) in your country? (Check all that apply)
If there are several pricing systems for Table 6, please indicate the corresponding items in
the parenthesis. (Ex. "Domestic Supply", "All items except Domestic Supply".)
1.□Basic price ( )
2.□Producer's price ( )
3.□Purchaser's price ( )
4.□Other ( )
Q6-3: How is the domestic output of travel agencies defined for TSA (Table 6) in your country?
(One answer only)
1.□Margin excluding procurement
2.□Total amount including procurement
3.□Aggregate responses from enterprises or
establishments as they are
4.□Other
Q6-4: How is the TSA applied in your country? (Check all that apply)
1.□For estimating the total gross value added from tourism and the share of tourism in
GDP
2.□As basic data to estimate the economic ripple effect by tourism
3.□For understanding the input-output structure of tourism related industries
4.□As basic data to set a tourism policy goal
5.□For international comparison with other countries
6.□For simulation and forecasting
7.□Other
Q6-5: What is the share of tourism in GDP of your country?
( )%
25
<Questions regarding the reason for not compiling TSA (Table 6)>
Q6-6: What is the reason for not compiling TSA (Table 6) in your country?
<Questions regarding the general idea of the number of workers if TSA (Table 7) is created>
Q7: Please answer the estimation method of the number of workers by industry in TSA Table 7 in
your country. (One answer only)
1.□Total number of workers in the corresponding industry
2.□Number of workers only in businesses related to tourism in the corresponding industry
3.□Number of workers calculated by multiplying the share of tourism (estimated based on
sales, etc. from tourists) with the total number of workers in the corresponding industry
4.□Other
4. Structure for TSA compilation
Q8: Describe the department in charge of compiling tourism statistics, SNA, and TSA in your
country.
Name of government office
(including the division)
Number of persons in
charge (estimate)
Statistics on domestic tourism consumption
persons
Statistics on inbound tourism consumption
persons
TSA persons
SNA persons
Input-Output table persons
26
Q9: The departments for tourism statistics and SNA compilation need to work in cooperation.
Which systems are built to encourage cooperation? (Check all that apply)
1.□Provision of detailed classification data from the SNA department
2.□Provision of detailed classification data from the tourism statistics department (including
individual data)
3.□Establishment of a technical advisory committee
4.□Formulation of a medium-term plan to establish a compilation method
5.□Technical support by the SNA department (or statistics bureau) to the TSA department
6.□Other
5. Feedback and Comments
Q10: Please comment freely if there are any issues, directions for future improvement, and requests
for TSA: RMF 2008 in relation to the development of tourism consumption statistics and TSA
in your country, or if there are any requests for international organizations.
Thank you for your cooperation.
27
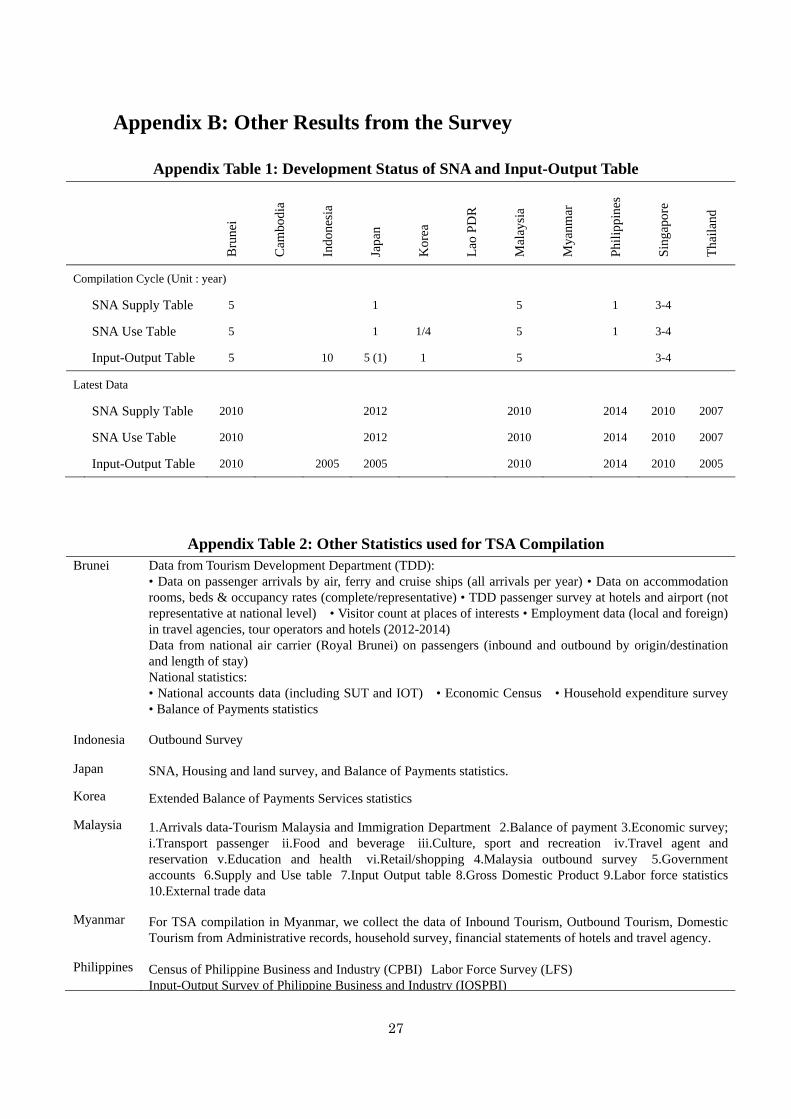
Appendix B: Other Results from the Survey
Appendix Table 1: Development Status of SNA and Input-Output Table
B
rune
i
Cam
bodi
a
Indo
nesi
a
Japa
n
Kor
ea
Lao
PD
R
Mal
aysi
a
Mya
nmar
Phi
lippi
nes
Sin
gapo
re
Tha
iland
Compilation Cycle (Unit : year)
SNA Supply Table 5 - 1 5 1 3-4
SNA Use Table 5 1 1/4 5 1 3-4
Input-Output Table 5 10 5 (1) 1 5 3-4
Latest Data
SNA Supply Table 2010 2012 2010 2014 2010 2007
SNA Use Table 2010 2012 2010 2014 2010 2007
Input-Output Table 2010 2005 2005 2010 2014 2010 2005
Appendix Table 2: Other Statistics used for TSA Compilation Brunei Data from Tourism Development Department (TDD):
• Data on passenger arrivals by air, ferry and cruise ships (all arrivals per year) • Data on accommodation rooms, beds & occupancy rates (complete/representative) • TDD passenger survey at hotels and airport (not representative at national level) • Visitor count at places of interests • Employment data (local and foreign) in travel agencies, tour operators and hotels (2012-2014) Data from national air carrier (Royal Brunei) on passengers (inbound and outbound by origin/destination and length of stay) National statistics: • National accounts data (including SUT and IOT) • Economic Census • Household expenditure survey• Balance of Payments statistics
Indonesia Outbound Survey
Japan SNA, Housing and land survey, and Balance of Payments statistics.
Korea Extended Balance of Payments Services statistics
Malaysia 1.Arrivals data-Tourism Malaysia and Immigration Department 2.Balance of payment 3.Economic survey;i.Transport passenger ii.Food and beverage iii.Culture, sport and recreation iv.Travel agent and reservation v.Education and health vi.Retail/shopping 4.Malaysia outbound survey 5.Government accounts 6.Supply and Use table 7.Input Output table 8.Gross Domestic Product 9.Labor force statistics10.External trade data
Myanmar For TSA compilation in Myanmar, we collect the data of Inbound Tourism, Outbound Tourism, Domestic Tourism from Administrative records, household survey, financial statements of hotels and travel agency.
Philippines Census of Philippine Business and Industry (CPBI) Labor Force Survey (LFS) Input-Output Survey of Philippine Business and Industry (IOSPBI)
28
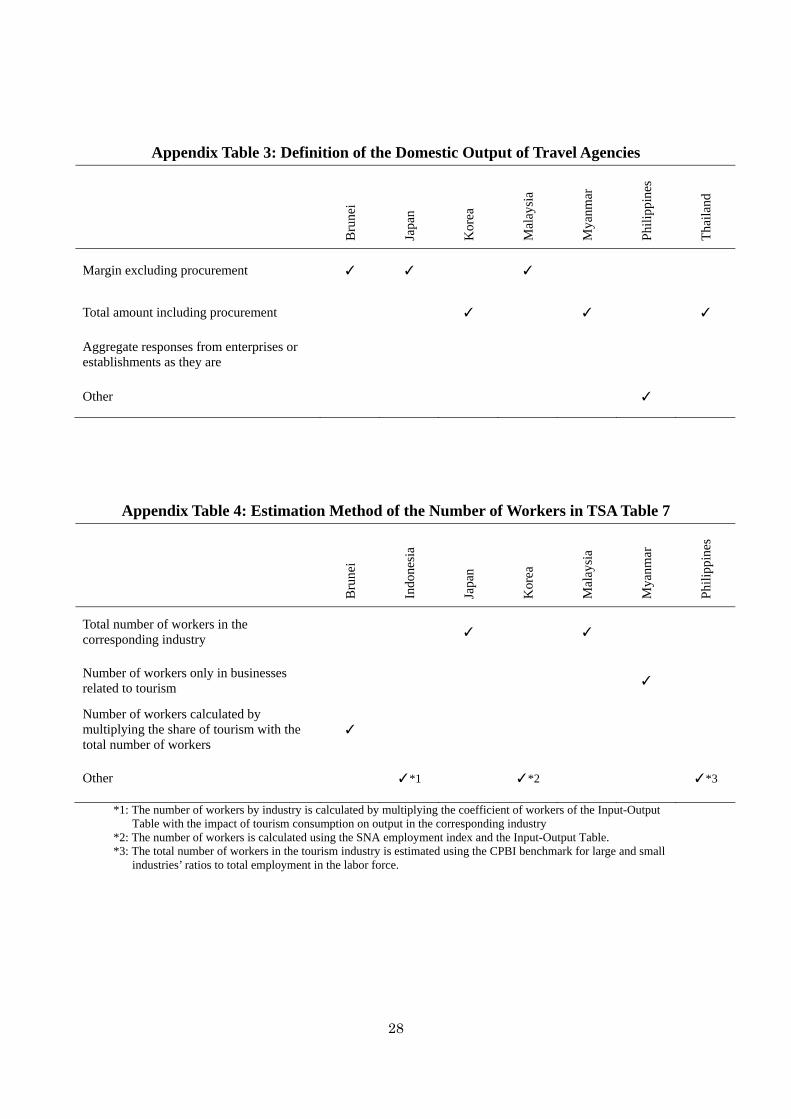
Appendix Table 3: Definition of the Domestic Output of Travel Agencies
Bru
nei
Japa
n
Kor
ea
Mal
aysi
a
Mya
nmar
Phi
lippi
nes
Tha
iland
Margin excluding procurement ✓ ✓ ✓
Total amount including procurement ✓ ✓ ✓
Aggregate responses from enterprises or establishments as they are
Other ✓
Appendix Table 4: Estimation Method of the Number of Workers in TSA Table 7
Bru
nei
Indo
nesi
a
Japa
n
Kor
ea
Mal
aysi
a
Mya
nmar
Phi
lippi
nes
Total number of workers in the corresponding industry
✓ ✓
Number of workers only in businesses related to tourism
✓
Number of workers calculated by multiplying the share of tourism with the total number of workers
✓
Other ✓*1 ✓*2 ✓*3
*1: The number of workers by industry is calculated by multiplying the coefficient of workers of the Input-Output Table with the impact of tourism consumption on output in the corresponding industry
*2: The number of workers is calculated using the SNA employment index and the Input-Output Table. *3: The total number of workers in the tourism industry is estimated using the CPBI benchmark for large and small
industries’ ratios to total employment in the labor force.
29
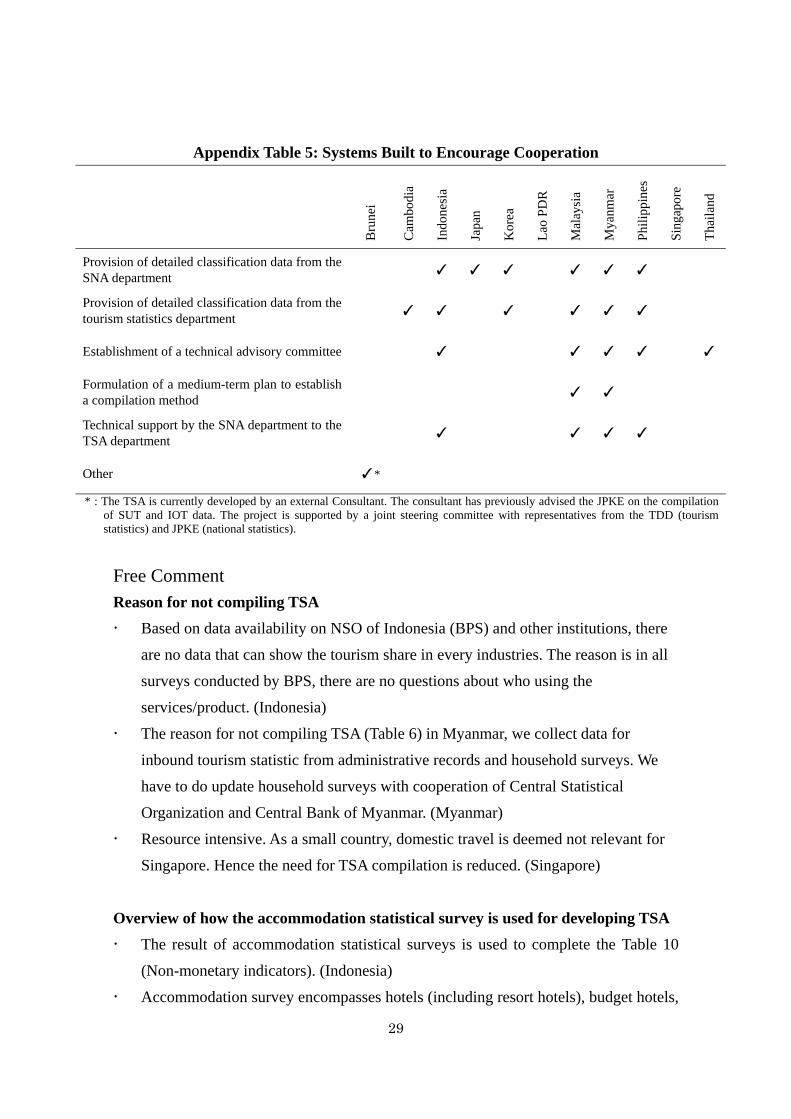
Appendix Table 5: Systems Built to Encourage Cooperation
Bru
nei
Cam
bodi
a
Indo
nesi
a
Japa
n
Kor
ea
Lao
PD
R
Mal
aysi
a
Mya
nmar
Phi
lippi
nes
Sin
gapo
re
Tha
iland
Provision of detailed classification data from the SNA department
✓ ✓ ✓ ✓ ✓ ✓
Provision of detailed classification data from the tourism statistics department
✓ ✓ ✓ ✓ ✓ ✓
Establishment of a technical advisory committee ✓ ✓ ✓ ✓ ✓
Formulation of a medium-term plan to establish a compilation method
✓ ✓
Technical support by the SNA department to the TSA department
✓ ✓ ✓ ✓
Other ✓*
* : The TSA is currently developed by an external Consultant. The consultant has previously advised the JPKE on the compilation of SUT and IOT data. The project is supported by a joint steering committee with representatives from the TDD (tourism statistics) and JPKE (national statistics).
Free Comment Reason for not compiling TSA
Based on data availability on NSO of Indonesia (BPS) and other institutions, there
are no data that can show the tourism share in every industries. The reason is in all
surveys conducted by BPS, there are no questions about who using the
services/product. (Indonesia)
The reason for not compiling TSA (Table 6) in Myanmar, we collect data for
inbound tourism statistic from administrative records and household surveys. We
have to do update household surveys with cooperation of Central Statistical
Organization and Central Bank of Myanmar. (Myanmar)
Resource intensive. As a small country, domestic travel is deemed not relevant for
Singapore. Hence the need for TSA compilation is reduced. (Singapore)
Overview of how the accommodation statistical survey is used for developing TSA
The result of accommodation statistical surveys is used to complete the Table 10
(Non-monetary indicators). (Indonesia)
Accommodation survey encompasses hotels (including resort hotels), budget hotels,
30
apartment hotels, chalets, rest house/ guesthouse/ hostel/ bed & breakfast and
camping grounds. Accommodation statistics provide information as below;
1.Number of establishments 2.Value of gross output, intermediate input and value
added 3.Value of assets 4.Total number of persons engaged, salary and wages.
These data are available during annual survey/census years. These indicators are
important to measure the tourism demand as well as for planning and policy
formulation for tourism industry. (Malaysia)
The accommodation statistical survey is used for developing TSA as following
fields: 1.Inbound Tourism 2.Outbound Tourism 3.Domestic Tourism (Myanmar)
Other Comments
Key issues ? Cambodia for future improvement & requests: ・Training in TSA
methodology, Supply and Use Tables and their compilation ・Technical assistance
on TSA (Cambodia)
Related compiling of Table 6, in my country still face the problem. This is beacuse
of data avaibility. Are there simple methods to solve the problem? This is main
reason why in our TSA to calculate the impact of tourism consumption on economy
uses multiplier matrix of input-output table. (Indonesia)
To conduct workshop on the manual itself especially on the Tourism Gross Fixed
Capital Formation precisely by the government and Tourism collective
consumption by products and levels of government and tourism ratio. Establish
expert/ technical group internationally to share on the findings and best practices of
TSA. (Malaysia)
The development of tourism consumption statistics and TSA in Myanmar, we
need to collect the data for inbound tourism ,outbound tourism and domestic
tourism with surveys team on monthly ,quarterly and annually at the airport, and
border check point . We have to build up formation of TSA frame work and
close cooperation with Central Bank of Myanmar and Central Statistical
Organization .And we need to collect data in tourist destination. (Myammar)
31
Appendix C: Inbound TSA Table 6 in 2012
Table
6 T
ouris
m d
om
estic
supply
and in
tern
al to
uris
m c
onsum
ptio
n, b
y p
roducts
T O
U R
I S M
I N D
U S
T R
I E S
Hote
lsan
d similar
Second h
om
eow
nersh
ip(im
pute
d)
Restau
rants
and sim
ilar
Railw
ey
passenge
rtran
s port
Road
passenge
rtran
s port
Wate
rtran
sport
Air
transpo
rt
Tran
sport
suppo
rting
servic
es
Spo
rting an
doth
er
recre
ational
Spe
cific
pro
du
cts
3970
23283
281
1379
5893
23916
18274
9112
1,293
C
hara
cte
ristic
pro
du
cts
3970
23283
281
1379
5893
23916
92
00
927
Ac
co
mm
odatio
n s
erv
ice
s395
01
00
00
01
3962
3980
00
0398
H
ote
ls and o
ther lo
dging se
rvices
3950
10
00
00
1396
2398
00
00
398
S
econd h
om
es se
rvices o
n o
wn ac
count o
f for fre
e0
00
00
00
00
00
00
00
00
Fo
od a
nd b
eve
rage
se
rvin
g s
erv
ice
s2
0232
00
00
00
2345
2390
00
0239
Passe
nge
r tran
spo
rt se
rvic
es
00
083
281
1374
0253
2256
00
00
256
In
teru
rban railw
ay0
00
830
00
00
830
830
00
083
R
oad
00
00
280
01
029
029
00
00
29
W
ater
00
00
01
00
01
01
00
00
1
A
ir0
00
00
0137
00
1370
1370
00
0137
S
uppo
rting se
rvices
00
00
00
00
00
00
00
00
0
T
ranspo
rt equ
ipment re
ntal
00
00
00
04
04
26
00
00
6
M
ainte
nan
ce an
d repair se
rvices
00
00
00
00
00
00
00
00
0
Tra
ve
l age
nc
y, to
ur o
pe
rato
r an
d to
uris
t gu
ide
se
rvic
es
00
00
00
04
04
37
00
00
7
T
ravel age
ncy
00
00
00
04
04
37
00
00
7
T
ourist in
form
ation an
d tourist gu
ide0
00
00
00
00
00
00
00
00
Cu
ltura
l se
rvic
es
00
00
00
00
11
79
00
00
9
P
erfo
rmin
g arts0
00
00
00
01
11
20
00
02
Muse
um
and o
ther c
ultu
ral servic
es
00
00
00
00
00
66
00
00
6
Re
cre
atio
n a
nd o
the
r en
terta
inm
en
t se
rvic
es
00
00
00
00
33
36
00
00
6
S
ports an
d recre
ational spo
rt servic
es
00
00
00
00
00
00
00
00
0
O
ther am
use
ment an
d recre
ational se
rvices
00
00
00
00
33
36
00
00
6
Mis
ce
llan
eo
us to
uris
m s
erv
ice
s0
00
00
00
10
11
29
20
013
Fin
ancial an
d insu
rance se
rvices
00
00
00
00
00
00
00
00
0
O
ther go
od re
ntal se
rvices
00
00
00
01
01
12
00
00
2
O
ther to
urism
servic
es
00
00
00
00
00
00
92
00
11
Co
nn
ec
ted p
rodu
cts
00
00
00
00
00
00
17372
9112
365
goods
00
00
00
00
00
00
17372
9112
365
servic
es
00
00
00
00
00
00
00
00
0
No
n s
pe
cific
pro
du
cts
00
00
00
00
00
5656
00
0-56
0
go
ods
00
00
00
00
00
00
00
00
0
se
rvices
00
00
00
00
00
5656
00
0-56
0
TO
TA
L o
utp
ut
3970
23283
281
1379
5893
78972
18274
956
1,293
A
gricultu
re, fo
restry an
d fishery pro
ducts
150
140
00
00
030
131
O
res an
d min
erals
00
00
00
00
00
33
Ele
ctric
ity, gas and w
ater
280
96
00
10
045
146
M
anufac
turin
g76
089
113
046
10
22721
248
C
onstru
ctio
n w
ork an
d constru
ctio
n2
01
20
00
00
51
6
T
rade se
rvices, re
stauran
ts and h
ote
l servic
es
00
00
00
00
00
00
T
ranspo
rt, storage
and c
om
munic
ation se
rvices
150
53
20
310
057
360
O
thers se
rvices
310
1611
30
162
180
989
G
ove
rnm
ent
servic
es, private
non-pro
fit servic
es to
house
holds
10
10
00
90
012
012
To
tal in
term
edia
te c
on
su
mptio
n (a
t pu
rch
ase
rs p
rice
)169
0135
339
1103
32
45539
494
C
onsu
mptio
n o
f fixed c
apital51
017
262
024
21
1227
130
C
om
pensatio
n o
f em
ploye
es
750
3423
170
233
1177
23199
O
ther taxe
s less su
bsidies o
n pro
ductio
n an
d impo
rts20
08
42
06
01
413
43
G
ross O
peratin
g surplu
s and G
ross M
ixed in
com
e83
038
-3-2
0-19
11
996
106
To
tal g
ross v
alu
e a
dde
d o
f ac
tivitie
s (a
t pro
du
ce
rs' p
rice
s)
2280
9850
190
346
3439
39478
Tariffs an
dtaxe
s on
impo
rtsM
argins
Inte
rnal
tou
rism
co
nsu
mptio
n
Pro
ducts
TO
TA
Lto
uris
min
du
strie
s
Oth
er
indu
stries
TO
TA
Lo
utp
ut in
se
rve
ce
s
TO
TA
L o
utpu
tin
goods
(at produ
cers'
price)
Impo
rts