Embed Size (px)
Citation preview
TRANSNET
NATIONAL
PORTS
AUTHORITY
TARIFF
APPLICATION
FOR FINANCIAL
YEAR 2016/17
Tariff Application to
the Ports Regulator in
terms of the National
Ports Act, 2005 (Act
No.12 of 2005)
Transnet National Ports Authority Tariff Application for Financial Year 2016/17 __________________
Page 1 of 85
Contents 1. Executive Summary ................................................................................................................................. 5
2. Introduction ........................................................................................................................................... 10
3. Legal Basis and Regulatory Requirements............................................................................................. 10
3.1 Section 72 of the Act sets out the Authority’s obligations in relation to its tariff book:
“Authority’s tariff book” ............................................................................................................................ 10
3.2 The Ports Directives ....................................................................................................................... 11
3.3 Regulatory Manual / Tariff Methodology ...................................................................................... 12
4. The Business of the Authority ............................................................................................................... 17
4.1 Introduction ................................................................................................................................... 17
4.2 Functions of the Authority............................................................................................................. 17
4.3 Transnet Market Demand Strategy (MDS) .................................................................................... 18
4.4 Tariffs in Perspective ..................................................................................................................... 22
5. Port Infrastructure Development Plan and Capital Expenditure .......................................................... 24
5.1 Port Investment planning .............................................................................................................. 24
5.2 The Authority’s Capital Investment Progamme ............................................................................ 25
6. The Authority’s Total Revenue .............................................................................................................. 27
6.1 Real Estate Revenue ...................................................................................................................... 27
6.2 Marine Business Revenue.............................................................................................................. 28
6.2.1 The Authority’s Volumes ............................................................................................................ 28
6.3 Cargo .............................................................................................................................................. 29
6.3.1 Containers .................................................................................................................................. 30
6.3.2 Automotives ............................................................................................................................... 32
6.3.3 Coal ............................................................................................................................................ 33
6.3.4 Iron Ore ...................................................................................................................................... 33
6.3.5 Manganese Ore ......................................................................................................................... 33
6.3.6 Liquid Bulk .................................................................................................................................. 34
6.3.7 Marine Services .......................................................................................................................... 34
7. Tariff Application Approach ................................................................................................................... 35
7.1 Revenue Requirement Formula..................................................................................................... 35
7.1.1 Regulatory Asset Base ............................................................................................................... 35
7.1.2 Weighted Average Cost of Capital ............................................................................................. 39
Transnet National Ports Authority Tariff Application for Financial Year 2016/17 __________________
Page 2 of 85
7.1.3 Valuation of the RAB ................................................................................................................. 40
7.1.4 Taxation ..................................................................................................................................... 41
7.1.5 Operating Costs ......................................................................................................................... 42
7.1.6 Revenue Claw-back .................................................................................................................... 42
7.2 Revenue Requirement ................................................................................................................... 46
7.3 Tariff Application ........................................................................................................................... 46
8. Tariff book ............................................................................................................................................. 49
8.1 The Authority’s Pricing Strategy .................................................................................................... 49
8.2 The Regulators Response to the Authority’s Pricing Strategy ....................................................... 50
8.3 Tariff Book Proposal for FY 2016/17.............................................................................................. 51
9. Port Efficiency ........................................................................................................................................ 53
9.1 Terminal Operations Licencing Oversight ..................................................................................... 55
10. Marine Operations Management .......................................................................................................... 56
10.1.1 Pilotage ...................................................................................................................................... 56
10.1.2 Towage ...................................................................................................................................... 57
10.1.3 Berthing Services ....................................................................................................................... 57
11. Conclusion ............................................................................................................................................. 58
ANNEXURE A: The Authority’s Tariff Book .................................................................................................... 59
ANNEXURE B: Capital Expenditure ................................................................................................................ 61
ANNEXURE C: Operating Expenditure ........................................................................................................... 70
ANNEXURE D: Additional Operating Cost Information ................................................................................. 80
ANNEXURE E: Required Revenue Calculation Based on Bilateral Contracts at Contract Rates .................... 83
Transnet National Ports Authority Tariff Application for Financial Year 2016/17 __________________
Page 3 of 85
ABBREVIATIONS AND ACRONYMS
AFS Annual Financial Statements APDP Automotive Production Development Program BER Bureau of Economic Research BRICS Brazil, Russia, India, China & South Africa CAGR Compounded Annual Growth Rate CAPEX Capital Expenditure CAPM Capital Asset Pricing Model CMEO Chief Marine Engineering Officer CPI Consumer Price Index CPT Cape Town CSI Corporate Social Investment CWIP Capital Work In Progress DBN Durban DBT Dry Bulk Terminal DCT Durban Container Terminal DDOP Durban Dig Out Port DIA (Old) Durban International Airport DMS Dimson, Marsh and Staunton DMTN Domestic Medium Term Note DORC Depreciated Optimised Replacement Cost DoT Department of Transport DRS Dredging Services EIMS Enterprise Information Management Services EL East London EPMO Enterprise Programme Management Office ETIMC Excessive Tariff Increase Margin Credit FEL Front End Loading FMCSA Ford Motor Company of Southern Africa GDP Gross Domestic Product GMTN Global Medium Term Note GPPCS Global Port Pricing Comparator Study GRT Gross Registered Tonnage HCM Human Capital Management HOPS Haulier-Road Operations Performance Standards IAS International Accounting Standards IDZ Industrial Development Zone IPMS Integrated Port Management System JOC Joint Operations Centres JSE Johannesburg Stock Exchange KAM Key Account Manager LTPF Long-term Transnet Planning Framework m Million MDS Market Demand Strategy MIDP Motor Industry Development Plan MOPS Marine Operations Performance Standards MPT Multi-Purpose Terminal MRP Market Risk Premium
Transnet National Ports Authority Tariff Application for Financial Year 2016/17 __________________
Page 4 of 85
MSOE Marine School of Excellence MTBSA Man Truck and Bus South Africa Mtpa Millions tonnes per annum NAAMSA National Association of Automobile Manufacturers of South Africa NBV Net Book Value NERSA National Energy Regulator of South Africa NGQ Ngqura NIMS National Infrastructure Maintenance Strategy NPA National Ports Authority NPCC National Port Consultative Committee NPP National Ports Plan OD Operating Divisions OEMs Original Equipment Manufacturers OPEC Organisation of Petroleum Exporting Countries Opex Operating Costs PCC Port Consultative Committee PE Port Elizabeth PLP Project Life Cycle Process RAB RR
Regulatory Asset Base Revenue Requirement
RfR Risk Free Rate
RBCT Richards Bay Coal Terminal RCB Richards Bay ROD Record of Decision ROPS Rail Operations Performance Standards SA South Africa SAMSA South African Maritime Safety Association SARB South African Reserve Bank SARS South African Revenue Services SBIDZ Saldanha Bay Industrial Development Zone SLD SOC
Saldanha Bay State Owned Company
SOE State Owned Enterprise SRAB Starting Regulatory Asset Base TCC Transnet Corporate Centre TEU Twenty-foot Equivalent Unit TOC Trended Original Cost TONS Tonnages TOPS Terminal Operator Performance Standards TP Transnet Properties TPT Transnet Port Terminals TSHD Trailing Suction Hopper Dredger UK United Kingdom USA United States of America VWSA Volkswagen South Africa WACC Weighted Average Cost of Capital WACD Weighted Average Cost of Debt
Transnet National Ports Authority Tariff Application for Financial Year 2016/17 __________________
Page 5 of 85
1. Executive Summary
In terms of Section 72 (1) (a) of the National Ports Act, 2005 (Act No. 12 of 2005) (”the Act”), Transnet
National Ports Authority, a division of Transnet SOC Limited (“the Authority”) is required, with the approval
of the Ports Regulator (“the Regulator”), to determine tariffs for services and facilities offered by the
Authority and to annually publish a tariff book containing those tariffs. The Port Directives were approved
on 13 July 2009 (gazetted on 06 August 2009) and amended on 29 January 2010. In terms of these
Directives, when considering the proposed tariffs for the Authority, the Regulator must ensure that such
tariffs allow the Authority to:
a) recover its investment in owning, managing, controlling and administering Ports and its investment in port services and facilities;
b) recover its costs in maintaining, operating, managing, controlling and administering Ports and its costs in providing port services and facilities; and
c) earn a return commensurate with the risk of owning, managing, controlling and administering ports and of providing port services and facilities.
In determining the tariffs, the Authority applies the prescribed Tariff Methodology issued by the Regulator
on 31 July 2014. The approved Tariff Methodology allows the Regulator to govern the Authority’s tariff
setting process and considers a multi-year approach, applicable to the 2015/16 to 2017/18 tariff years. It
further allows for an annual review and an annual adjustment of tariffs within the three year period as
opposed to fixing the tariffs for the full period.
The approach applicable to the tariff period FY2016/17, per the Tariff Methodology, is based on the
Revenue Requirement (RR) formula as follows:
Revenue Requirement
= Regulatory Asset Base (RAB) x Weighted Average Cost of Capital (WACC)
+ Operating Costs + Depreciation + Taxation Expense ±Claw-back
± Excessive Tariff Increase Margin Credit (ETIMC)

Transnet National Ports Authority Tariff Application for Financial Year 2016/17 __________________
Page 6 of 85
The components of the RR formula has been summarised in the Tariff Methodology as follows:
a) Regulatory Asset Base (RAB): The RAB represents the value of assets that the NPA is allowed to
earn a return on. The value of the assets in the RAB is indexed by inflation each year based on the
Trended Original Cost (‘TOC’) approach.
b) Vanilla Weighted Average Cost of Capital (WACC): The WACC represents the risk adjusted
opportunity costs of capital and is the minimum return for an investment in order to continue to
attract capital, given the risks. A real WACC is applied, given that the RAB is indexed by inflation.
c) Operating Costs: The Regulator will analyse the operating cost estimates for the period on a
detailed line by line basis. The NPA is required to provide detailed and complete motivation for each
of the expenses applied for.
d) Depreciation: The depreciation of the assets in the RAB will be calculated as a straight line 40 year
on the opening balance of the RAB.
e) Taxation Expense: The Regulator will use the pass-through tax approach where the vanilla WACC
will be applied to the average RAB for the period under consideration, less the interest cost of debt
and the corporate tax rate to determine the tax liability to be treated as an expense in the RR
calculation.
f) Claw-Back: The key purpose of applying the claw-back is to ensure that the NPA or any port user is
fairly treated and is not subjected to unfair gains and losses. The Regulator will spread the total
impact of over/under recovery of revenue over a period of two tariff determinations.
g) Excessive Tariff Increase Margin Credit (ETIMC): The Regulator considers it prudent to avoid future
tariff spikes by retaining and increasing the NPA’s ETIMC.
Transnet National Ports Authority Tariff Application for Financial Year 2016/17 __________________
Page 7 of 85
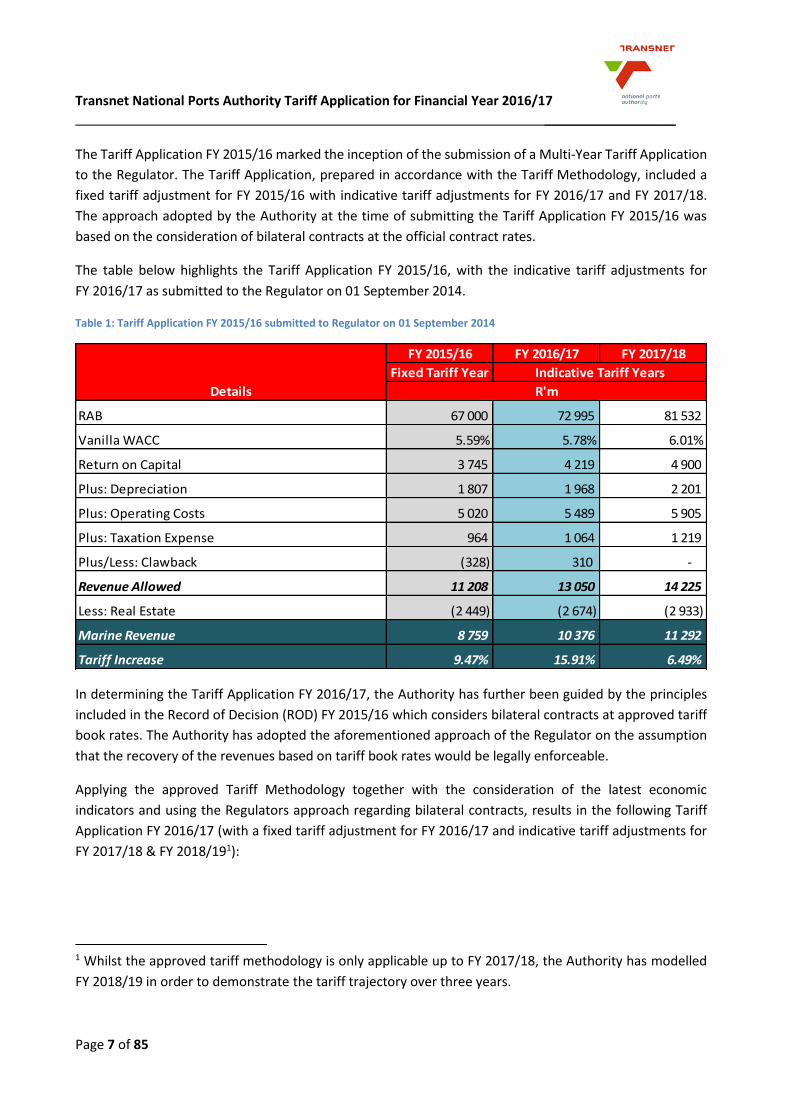
The Tariff Application FY 2015/16 marked the inception of the submission of a Multi-Year Tariff Application
to the Regulator. The Tariff Application, prepared in accordance with the Tariff Methodology, included a
fixed tariff adjustment for FY 2015/16 with indicative tariff adjustments for FY 2016/17 and FY 2017/18.
The approach adopted by the Authority at the time of submitting the Tariff Application FY 2015/16 was
based on the consideration of bilateral contracts at the official contract rates.
The table below highlights the Tariff Application FY 2015/16, with the indicative tariff adjustments for
FY 2016/17 as submitted to the Regulator on 01 September 2014.
Table 1: Tariff Application FY 2015/16 submitted to Regulator on 01 September 2014
In determining the Tariff Application FY 2016/17, the Authority has further been guided by the principles
included in the Record of Decision (ROD) FY 2015/16 which considers bilateral contracts at approved tariff
book rates. The Authority has adopted the aforementioned approach of the Regulator on the assumption
that the recovery of the revenues based on tariff book rates would be legally enforceable.
Applying the approved Tariff Methodology together with the consideration of the latest economic
indicators and using the Regulators approach regarding bilateral contracts, results in the following Tariff
Application FY 2016/17 (with a fixed tariff adjustment for FY 2016/17 and indicative tariff adjustments for
FY 2017/18 & FY 2018/191):
1 Whilst the approved tariff methodology is only applicable up to FY 2017/18, the Authority has modelled
FY 2018/19 in order to demonstrate the tariff trajectory over three years.
FY 2015/16 FY 2016/17 FY 2017/18
Fixed Tariff Year
RAB 67 000 72 995 81 532
Vanilla WACC 5.59% 5.78% 6.01%
Return on Capital 3 745 4 219 4 900
Plus: Depreciation 1 807 1 968 2 201
Plus: Operating Costs 5 020 5 489 5 905
Plus: Taxation Expense 964 1 064 1 219
Plus/Less: Clawback (328) 310 -
Revenue Allowed 11 208 13 050 14 225
Less: Real Estate (2 449) (2 674) (2 933)
Marine Revenue 8 759 10 376 11 292
Tariff Increase 9.47% 15.91% 6.49%
Details
Indicative Tariff Years
R'm

Transnet National Ports Authority Tariff Application for Financial Year 2016/17 __________________
Page 8 of 85
Table 2: Revenue Requirement FY 2016/17
As illustrated in Table 2 above, the Authority has proposed an increase to the Excessive Tariff Increase
Margin Credit (ETIMC) facility by R67m as the Authority forges ahead with the Transnet MDS programme.
The use of the ETIMC facility allows for a smoother tariff trajectory.
The resultant Revenue Requirement for FY 2016/17 is R11 895m comprising of Real Estate Business revenue
of R2 600m and Marine Business revenue of R9 295m. In order to determine the Marine Business revenue
to be derived from tariff adjustments, the required revenue of R9 295m is compared with the expected
revenue of R8 571m for FY 2015/16 and increased for the expected growth in volumes of 2.40% for FY
2016/17.
Accordingly, the same principles are applicable for FY 2017/18 and FY 2018/19 and are demonstrated in
Table 3 below.
Table 3: Marine Revenue for FY 2016/17 to FY 2018/19
FY 2015/16 FY 2016/17 FY 2017/18 FY 2018/19
ROD Fixed Tariff Year
R'm
RAB 66 789 73 483 80 326 89 203
Vanilla WACC 6.38% 5.31% 5.56% 5.63%
Return on Capital 4 261 3 902 4 466 5 022
Plus: Depreciation 1 791 1 928 2 117 2 355
Plus: Operating Costs 5 020 5 487 5 967 6 503
Plus: Taxation Expense 768 1 191 1 072 1 209
Plus/(Less): Clawback (581) (680) 66 -
Plus/(Less): ETIMC (150) 67 - -
Revenue Allowed 11 109 11 895 13 688 15 089
Less: Real Estate (2 449) (2 600) (2 874) (3 147)
Marine Revenue 8 660 9 295 10 814 11 942
Details
Indicative Tariff Years
R'm
FY 2016/17 FY 2017/18 FY 2018/19
Fixed Tariff Year
Prior Year Revenue 8 571 9 295 10 814
Estimated Volume Growth 2.40% 3.20% 2.60%
Revenue after volume growth 8 777 9 592 11 095
Required Revenue 9 295 10 814 11 942
Tariff Increase 5.90% 12.74% 7.63%
Marine Revenue
Indicative Tariff Years
R'm
Transnet National Ports Authority Tariff Application for Financial Year 2016/17 __________________
Page 9 of 85
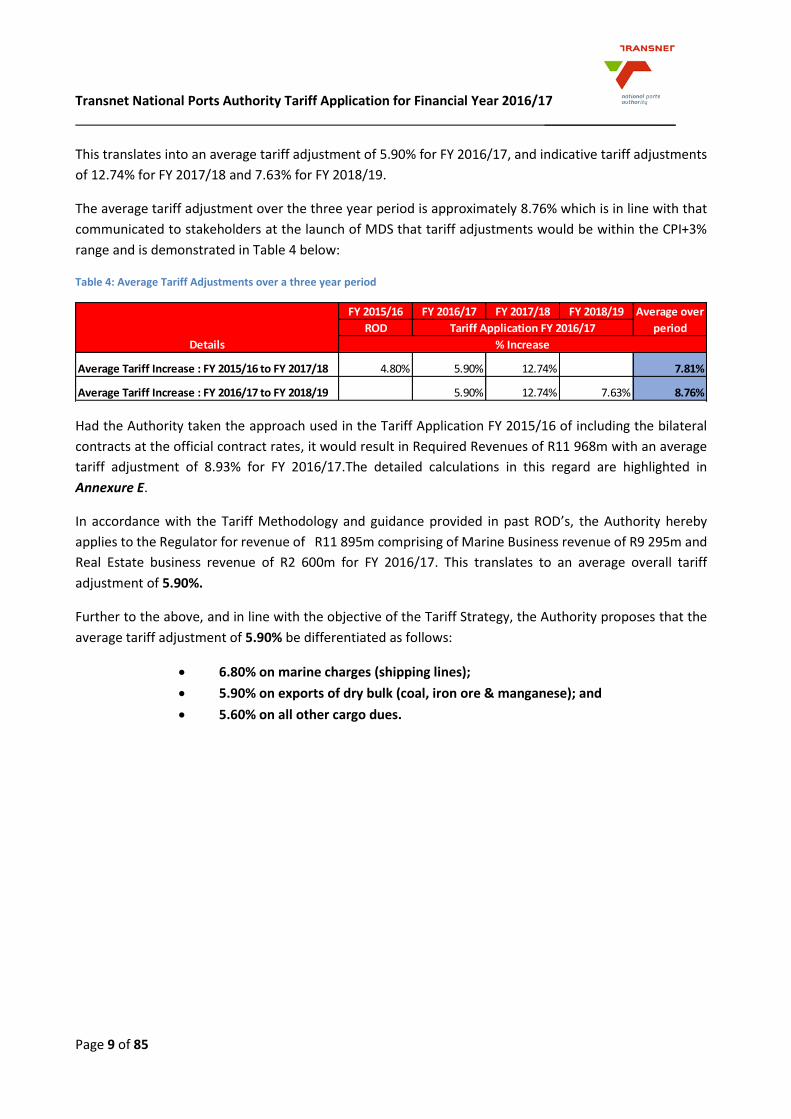
This translates into an average tariff adjustment of 5.90% for FY 2016/17, and indicative tariff adjustments
of 12.74% for FY 2017/18 and 7.63% for FY 2018/19.
The average tariff adjustment over the three year period is approximately 8.76% which is in line with that
communicated to stakeholders at the launch of MDS that tariff adjustments would be within the CPI+3%
range and is demonstrated in Table 4 below:
Table 4: Average Tariff Adjustments over a three year period
Had the Authority taken the approach used in the Tariff Application FY 2015/16 of including the bilateral
contracts at the official contract rates, it would result in Required Revenues of R11 968m with an average
tariff adjustment of 8.93% for FY 2016/17.The detailed calculations in this regard are highlighted in
Annexure E.
In accordance with the Tariff Methodology and guidance provided in past ROD’s, the Authority hereby
applies to the Regulator for revenue of R11 895m comprising of Marine Business revenue of R9 295m and
Real Estate business revenue of R2 600m for FY 2016/17. This translates to an average overall tariff
adjustment of 5.90%.
Further to the above, and in line with the objective of the Tariff Strategy, the Authority proposes that the
average tariff adjustment of 5.90% be differentiated as follows:
6.80% on marine charges (shipping lines);
5.90% on exports of dry bulk (coal, iron ore & manganese); and
5.60% on all other cargo dues.
FY 2015/16 FY 2016/17 FY 2017/18 FY 2018/19
ROD
Average Tariff Increase : FY 2015/16 to FY 2017/18 4.80% 5.90% 12.74% 7.81%
Average Tariff Increase : FY 2016/17 to FY 2018/19 5.90% 12.74% 7.63% 8.76%
Details % Increase
Average over
periodTariff Application FY 2016/17
Transnet National Ports Authority Tariff Application for Financial Year 2016/17 __________________
Page 10 of 85
2. Introduction
The Authority is the landlord in the South African port system. The Authority is responsible for the safe,
efficient and effective economic functioning of the national ports system which it manages, controls and
administers. The key business activities of the Authority are to provide and manage port infrastructure and
maritime services. In a broader context, the Authority also undertakes to facilitate the development of
trade and commerce through market collaboration for the economic benefit of the national economy.
This Tariff Application commences by introducing the primary legislation that deals with the Authority’s
tariffs and progresses to give an overview of the ports business and infrastructure plans. The tariff
application has been prepared in line with the approved Tariff Methodology in order to determine the
Revenue Requirement of the Authority, with the determinants for the Authority’s revenue being described
accordingly.
The Tariff Application that follows has been prepared for a three year period (FY 2016/17 to FY 2018/19)
with a fixed tariff adjustment for FY 2016/17 and indicative tariff adjustments for FY 2017/18 and FY
2018/19 (whilst the approved Tariff Methodology is only applicable up to FY 2017/18, the Authority has
included FY 2018/19 in order to demonstrate a fair tariff trajectory). The Tariff Application concludes
with an overview of efficiency improvements being implemented at the ports.
3. Legal Basis and Regulatory Requirements
The regulatory framework for the Authority’s tariffs is informed by the Act, and the Directives promulgated
by the Regulator. In terms of the regulatory framework the Authority is required, with the approval of the
Regulator, to determine tariffs for services and facilities offered by the Authority and to annually publish a
tariff book containing those tariffs.
3.1 Section 72 of the Act sets out the Authority’s obligations in relation to its tariff book: “Authority’s
tariff book”
72. (1) (a) The Authority must, with the approval of the Ports Regulator, determine tariffs for services
and facilities offered by the Authority and annually publish a tariff book containing those
tariffs;
(b) The Authority may, with the approval of the Ports Regulator, amend the tariff book
whenever it is necessary to do so.
(2) The Authority must, prior to any substantial alteration of a tariff, consult with the National
Port Consultative Committee.
(3) Subject to section 9 of the Competition Act, 1998 (Act No. 89 of 1998), the tariffs contemplated
in subsection (1) may vary between ports.
(4) Notwithstanding the provisions of this section, the Authority may enter into an agreement
with a licensed operator or a party to an agreement or a port user for the variation of any
tariff contemplated in subsection (1).

Transnet National Ports Authority Tariff Application for Financial Year 2016/17 __________________
Page 11 of 85
3.2 The Ports Directives
3.2.1 The Regulator developed the Directives, which were gazetted on 6 August 2009 and
amended on 29 January 2010. Of these, the most pertinent to the setting and approval of
tariffs are Directive 22 (which deals with the Approval and amendment of tariffs) and
Directive 23 (which deals with Tariff requirements).
3.2.2 Directive 23(1) requires the Regulator to consider whether the tariffs proposed by the
Authority reflect and balance:
a) A systematic tariff that is applicable on a comparable basis;
b) Fairness;
c) The avoidance of discrimination save where discrimination is in the public interest;
d) Simplicity and transparency;
e) Predictability and stability;
f) The avoidance of cross subsidisations save where cross subsidisation is in the public
interest; and
g) The promotion of access to ports and efficient and effective management and operation
in ports.
3.2.3 The opening statement of sub-directive 23(2), reads as follows: In considering the Authority's
proposed tariffs, and any subsequent proposed significant variations, the Regulator must
enable the Authority to;
(a) Recover its investment in owning, managing, controlling and administering ports and its
investment in port services and facilities;
(b) Recover its costs in maintaining, operating, managing, controlling and administering
ports and its costs in providing port services and facilities; and
(c) Make a profit commensurate with the risk of owning, managing, controlling and
administering ports and of providing port services and facilities.
3.2.4 This sub-directive prescribes that the Regulator must enable the Authority to recover its
investment, costs and to earn a profit commensurate with the risk it bears.
Transnet National Ports Authority Tariff Application for Financial Year 2016/17 __________________
Page 12 of 85
3.3 Regulatory Manual / Tariff Methodology
3.3.1 On 31 July 2014 the Regulator issued a Regulatory Manual (“Tariff Methodology”) applicable
for the tariff years 2015/16 to 2017/18. The Tariff Methodology will be multi-year in its
approach, with the aim of continued improvement in the level of transparency and
consistency in the tariff setting process.
3.3.2 The Tariff Methodology allows for an annual review and an annual adjustment of tariffs
within the three year period as opposed to fixing the prices for the full period.
3.3.3 Furthermore, the Regulator is of the view that guidelines contained in the Tariff Methodology
will assist in narrowing the gap between what is requested by the Authority and subsequently
granted by the Regulator.
3.3.4 The approach decided upon is based on the Revenue Requirement methodology with the
building blocks (as described in the Tariff Methodology) is set out below:
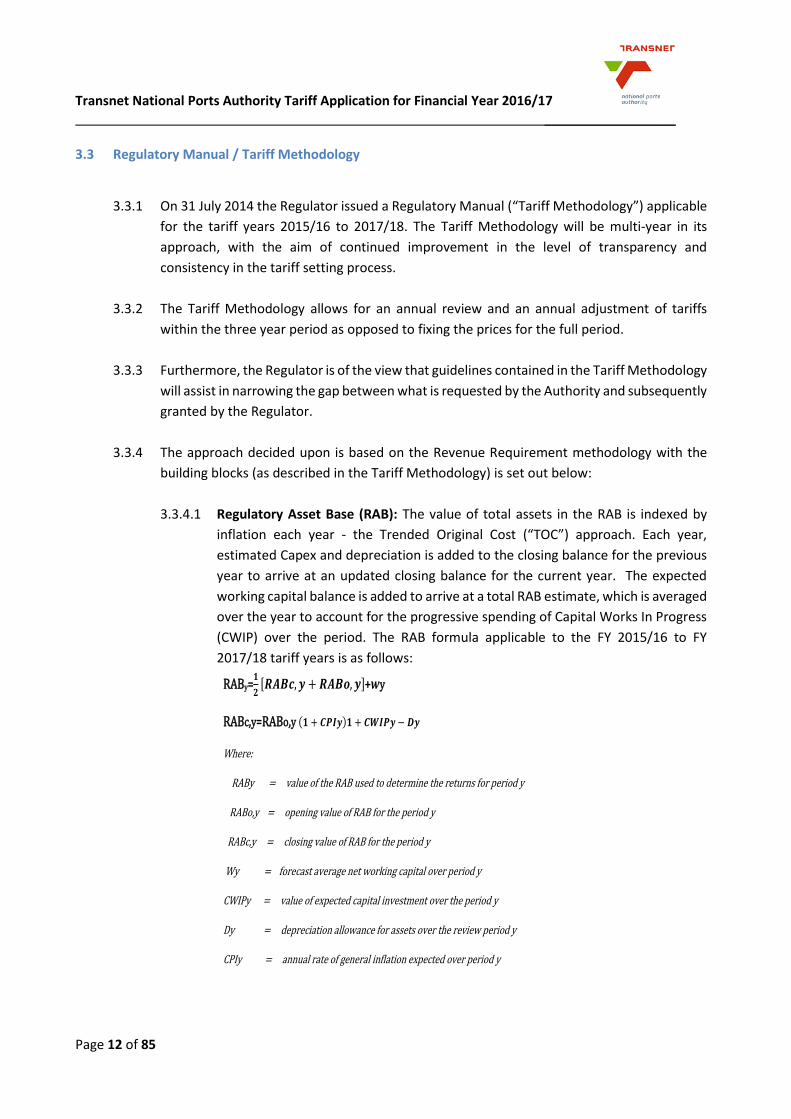
3.3.4.1 Regulatory Asset Base (RAB): The value of total assets in the RAB is indexed by
inflation each year - the Trended Original Cost (“TOC”) approach. Each year,
estimated Capex and depreciation is added to the closing balance for the previous
year to arrive at an updated closing balance for the current year. The expected
working capital balance is added to arrive at a total RAB estimate, which is averaged
over the year to account for the progressive spending of Capital Works In Progress
(CWIP) over the period. The RAB formula applicable to the FY 2015/16 to FY
2017/18 tariff years is as follows:
RABy=𝟏
𝟐 𝑹𝑨𝑩𝒄, 𝒚 + 𝑹𝑨𝑩𝒐, 𝒚 +𝒘y
RABc,y=RABo,y 𝟏 + 𝑪𝑷𝑰𝒚 𝟏 + 𝑪𝑾𝑰𝑷𝒚 − 𝑫𝒚
Where:
RABy = value of the RAB used to determine the returns for period y
RABo,y = opening value of RAB for the period y
RABc,y = closing value of RAB for the period y
Wy = forecast average net working capital over period y
CWIPy = value of expected capital investment over the period y
Dy = depreciation allowance for assets over the review period y
CPIy = annual rate of general inflation expected over period y
Transnet National Ports Authority Tariff Application for Financial Year 2016/17 __________________
Page 13 of 85
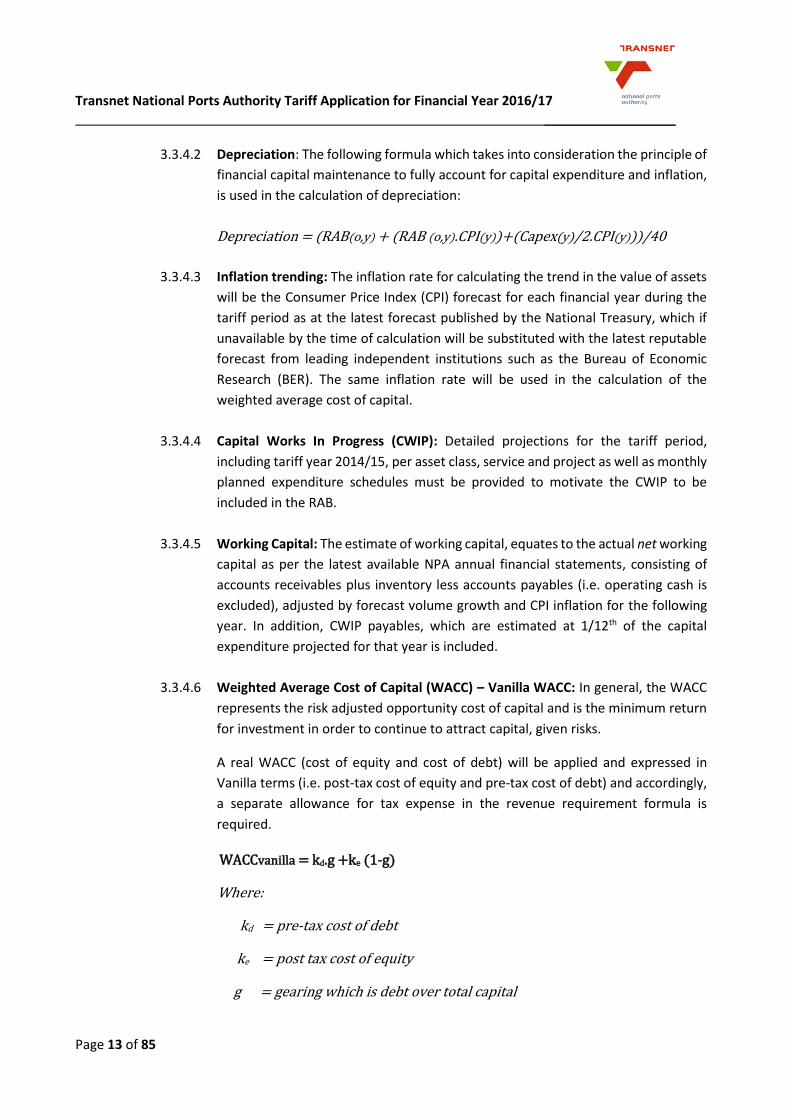
3.3.4.2 Depreciation: The following formula which takes into consideration the principle of
financial capital maintenance to fully account for capital expenditure and inflation,
is used in the calculation of depreciation:
Depreciation = (RAB(o,y) + (RAB (o,y).CPI(y))+(Capex(y)/2.CPI(y)))/40
3.3.4.3 Inflation trending: The inflation rate for calculating the trend in the value of assets
will be the Consumer Price Index (CPI) forecast for each financial year during the
tariff period as at the latest forecast published by the National Treasury, which if
unavailable by the time of calculation will be substituted with the latest reputable
forecast from leading independent institutions such as the Bureau of Economic
Research (BER). The same inflation rate will be used in the calculation of the
weighted average cost of capital.
3.3.4.4 Capital Works In Progress (CWIP): Detailed projections for the tariff period,
including tariff year 2014/15, per asset class, service and project as well as monthly
planned expenditure schedules must be provided to motivate the CWIP to be
included in the RAB.
3.3.4.5 Working Capital: The estimate of working capital, equates to the actual net working
capital as per the latest available NPA annual financial statements, consisting of
accounts receivables plus inventory less accounts payables (i.e. operating cash is
excluded), adjusted by forecast volume growth and CPI inflation for the following
year. In addition, CWIP payables, which are estimated at 1/12th of the capital
expenditure projected for that year is included.
3.3.4.6 Weighted Average Cost of Capital (WACC) – Vanilla WACC: In general, the WACC
represents the risk adjusted opportunity cost of capital and is the minimum return
for investment in order to continue to attract capital, given risks.
A real WACC (cost of equity and cost of debt) will be applied and expressed in
Vanilla terms (i.e. post-tax cost of equity and pre-tax cost of debt) and accordingly,
a separate allowance for tax expense in the revenue requirement formula is
required.
WACCvanilla = kd.g +ke (1-g)
Where:
kd = pre-tax cost of debt
ke = post tax cost of equity
g = gearing which is debt over total capital
Transnet National Ports Authority Tariff Application for Financial Year 2016/17 __________________
Page 14 of 85
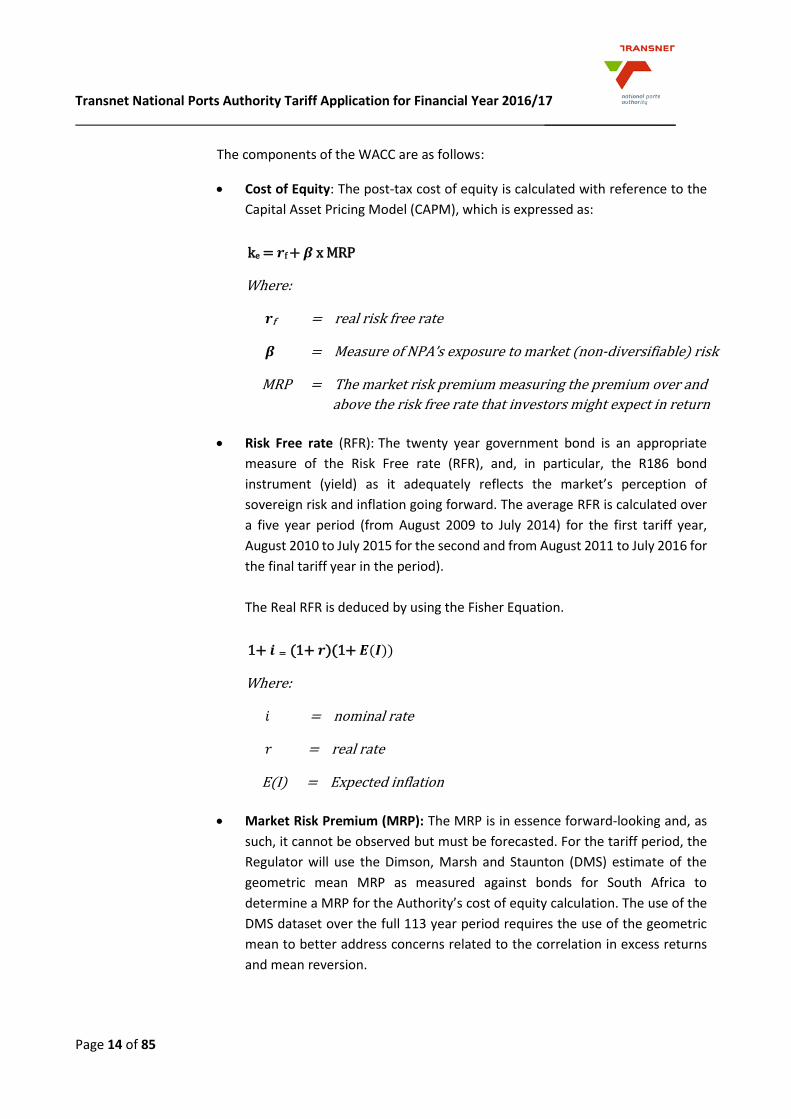
The components of the WACC are as follows:
Cost of Equity: The post-tax cost of equity is calculated with reference to the
Capital Asset Pricing Model (CAPM), which is expressed as:
Risk Free rate (RFR): The twenty year government bond is an appropriate
measure of the Risk Free rate (RFR), and, in particular, the R186 bond
instrument (yield) as it adequately reflects the market’s perception of
sovereign risk and inflation going forward. The average RFR is calculated over
a five year period (from August 2009 to July 2014) for the first tariff year,
August 2010 to July 2015 for the second and from August 2011 to July 2016 for
the final tariff year in the period).
The Real RFR is deduced by using the Fisher Equation.
Market Risk Premium (MRP): The MRP is in essence forward-looking and, as
such, it cannot be observed but must be forecasted. For the tariff period, the
Regulator will use the Dimson, Marsh and Staunton (DMS) estimate of the
geometric mean MRP as measured against bonds for South Africa to
determine a MRP for the Authority’s cost of equity calculation. The use of the
DMS dataset over the full 113 year period requires the use of the geometric
mean to better address concerns related to the correlation in excess returns
and mean reversion.
ke = 𝒓f + 𝜷 x MRP
Where:
𝒓f = real risk free rate
𝜷 = Measure of NPA’s exposure to market (non-diversifiable) risk
MRP = The market risk premium measuring the premium over and
above the risk free rate that investors might expect in return
1+ 𝒊 = (1+ 𝒓)(1+ 𝑬(𝑰))
Where:
𝑖 = nominal rate
𝑟 = real rate
E(I) = Expected inflation
Transnet National Ports Authority Tariff Application for Financial Year 2016/17 __________________
Page 15 of 85
Beta (𝜷 : Due to the Authority not being a traded company, there is no beta
(𝛽) published reflecting its risk relative to firms listed on the Johannesburg
Stock Exchange (JSE). A beta has to be set to reflect the risks faced by NPA
under the RR methodology. This must ensure an appropriate return for the risk
faced.
The inclusion of a claw-back mechanism reduces exposure to systematic risk
and the existence of an interventionist regulatory regime requires the
Regulator to use a Beta substantially lower than large firms listed on the JSE
such as the JSE Top 40.
For the tariff period covered, the Regulator will use the 0.50 asset beta decided
upon and motivated in the previous Records of Decision (ROD).
The Hamada equation is used to re-lever the asset beta resulting in an equity
beta of 0.86.
Gearing (g): The appropriate gearing for the entity for period is 50%.
Cost of Debt: NPA’s actual, embedded debt costs should be used to determine
the cost of debt applied within the WACC. The average embedded Transnet
group cost of debt (pre-tax nominal) of Transnet SOC Ltd should be used for
the 2015/16 tariff year, as no current alternative exists.
3.3.4.7 Taxation Expense (t): A corporate tax rate of 28% will be used for the period. The
pass-through tax approach, where the vanilla WACC will be applied to the average
RAB for the period under consideration, less the interest cost of debt and wear and
tear, and other tax allowances. The corporate tax rate will be used to determine
the tax liability which shall be treated as an expense in the RR calculation.
Tax allowance = (Net revenue before tax allowance)/ (1-t)*t
The calculation of tax allowance must also reflect the flow of funds related to any
claw-back calculated as well as ETIMC allowances to ensure adequate tax cover for
the NPA.
3.3.4.8 Operating Costs: The NPA is required to provide detailed and complete motivation
for the applied expenses, especially on large items like labour and energy costs.
Transnet group costs will be included in the total allowed expenses subject to the
requirement that the NPA submits detailed explanation and motivation for the
amount to be transferred to Transnet group.
Transnet National Ports Authority Tariff Application for Financial Year 2016/17 __________________
Page 16 of 85
In addition, the NPA shall provide externally audited financial reports with all
supporting documentation and detailed explanations including basis of allocation
and policy documents that support such allocations.
3.3.4.9 Claw-back: The key purpose of applying claw-back is to ensure that the NPA or any
port user is fairly treated and is not subjected to any unfair gains or losses that are
a result of incorrect forecasting, inaccurate information and system shocks. Its main
application is to reduce the impact of differences between the allowed revenue
(based on a number of forecasts and assumptions) calculated at the time of the
tariff application and actual audited figures.
The variables to be estimated in line with the Tariff Methodology, annually, prior to
the start of the following tariff year for claw-back purposes are the:
RAB (including capex)
Depreciation
Operating Expenditure
Tax allowance
Volumes
Inflation (CPI)
The total impact of over/under recovery of revenue will be spread over a period of
two tariff determinations.
3.3.4.10 Excessive Tariff Increase Margin Credit (ETIMC): The Regulator regulates in the
long term interest of the industry. This requires that the Regulator not only confine
itself to the immediate tariff decision, but also consider ways to ease any future
shocks to the system. It is generally accepted that capital expenditure will spike at
some point in the foreseeable future, but that these projects have not as yet been
specified to a level of detail that allows for accurate prediction. As such, the
Regulator considers it prudent to avoid future tariff spikes by retaining and
increasing the Authority’s ETIMC.
The Regulator may authorise the release of part or the whole of the value of the
ETIMC facility to influence tariff levels whenever it deems necessary including, but
not limited to spikes in tariffs (defined as an average tariff increase in excess of the
inflation forecast) due to sharp increase in capital expenditure, volume volatility, or
and market related factors. The Regulator may also consider national objectives in
any decision to add to, or to utilise the ETIMC facility to adjust tariffs.
Transnet National Ports Authority Tariff Application for Financial Year 2016/17 __________________
Page 17 of 85
3.3.4.11 Volume Forecast: The NPA is required to submit detailed volume forecasts with
reasons as well as well as revenue calculations based on the forecast volumes and
current tariff levels as well as proposed tariffs for the period.
3.3.4.12 Introduction of efficiency incentive: The Regulator will continue to monitor
progress of the results of the Terminal Operator Performance Standards (TOPS) as
well as Marine Operators Performance Standards (MOPS) and will introduce an
efficiency component to the tariff determination when the Regulator is satisfied
that a credible efficiency monitoring system has been established.
4. The Business of the Authority
4.1 Introduction
The Authority operates within the port industry, providing services to its target market comprising of port
users, which include terminal operators, shipping lines, ship agents, cargo owners and the clearing and
forwarding industry. The Authority owns and manages nine ports within South Africa namely, Port Nolloth,
Saldanha Bay, Cape Town, Mossel Bay, Port Elizabeth, Ngqura, East London, Durban and Richards Bay.
Port Nolloth is currently not a commercial port and renders maritime services of a basic nature supporting
fishing and supply vessels.
Port infrastructure and maritime services are provided in five market segments namely, containers, dry
bulk, liquid bulk, break-bulk and automotive. The major commodities handled at the ports are coal, iron
ore, manganese, containers, automotive, steel, fruit, ferrochrome and petroleum products. Growth of
these commodities is a function of global demand, logistics infrastructure capacity and supply chain
efficiencies which include port efficiencies.
Port users fall into three main categories, namely, terminal operators, shipping lines and cargo owners.
While numerous other parties utilise the port, they do so to a lesser extent than these principal port users.
4.2 Functions of the Authority
The National Commercial Ports Policy requires that the Authority be responsible for the management of
the national commercial port system as a landlord port authority. Being a landlord port authority means
that the Authority:
owns, develops and maintains port infrastructure;
does not engage in port operations (except as operator of last resort);
does not employ cargo handling labour;
fulfils a port regulatory function including oversight and port landowner function; and
owns all port land.
Transnet National Ports Authority Tariff Application for Financial Year 2016/17 __________________
Page 18 of 85
The Authority’s core functions (as set out in Section 11 of the Act) can be summarised in the table as follows:
Table 5: The Authority’s Core Functions
Function Detail
Landlord Promote the use, improvement and development of ports, and control
land use within the ports, having the power to lease port land under
conditions it determines.
Master planner Plan, improve, develop and maintain port infrastructure.
Controller of ports navigation Make and apply rules to control navigation within port limits and
approaches, ensure protection of the environment and ensure safety and
security within port limits.
Controller of ports services
and facilities
Ensure that port services and facilities are provided, and may enter into
agreements or license other parties to provide these.
Marketer and administrator Ensure that adequate, affordable, equitable and efficient port services
and facilities are provided for port users.
Change agent Ensure non-discriminatory, fair, transparent access to port services and
facilities; advancement of previously disadvantaged people; promotion
of representation and participation in terminal operations; enhanced
transparency in port management.
Coordinator with other State
Agencies
Advise on all matters relating to the port sector, and liaise with all
stakeholders.
4.3 Transnet Market Demand Strategy (MDS)
The South African ports occupy a central position in the transport and logistics chain with 98% of cargo
volumes passing through them annually. Ports are inherently required to play a leading role in influencing
economic growth to respond to market conditions.
The MDS will enable growth in key commodities in the long term and will position South Africa globally as
a key exporter of bulk commodities. According to a May 2014 Creamers Media Report on Global Iron Ore
Trade, South Africa has now moved into third position on the global ranking of iron ore exporters. South
Africa is also the fourth largest supplier of iron ore to China, leading manganese exporter globally, and the
leading logistics hub for sub-Saharan Africa.
The MDS anticipates R336.6bn capital expenditure programme over the next 7 years for Transnet with the
following successes to date:
Transnet invested in renewal, upgrade of rolling stock and accepted approximately 186 locomotives
into operations from the inception of the MDS and 7 044 wagons were built in the same period –
with an additional 1 300 new locomotives to be delivered over the next 3 years.
Transnet National Ports Authority Tariff Application for Financial Year 2016/17 __________________
Page 19 of 85
maintaining and improving the financial sustainability of the Company with a stand-alone
investment grade credit rating at one notch above the Sovereign’s rating.
the expansion of the Iron ore rail infrastructure to 60,0mtpa with the port capacity to 65,0mt was
completed in September 2012.
New Multi-Product Pipeline (NMPP) - The 24-inch trunk-line from Durban to Jameson Park was
operationalised in January 2012 and is currently transporting diesel.
successful second issuance of the Transnet Dollar Denominated Bond Maturing in year 2022
(TNUS 22 -July 2012) under the Global Medium – Term Note (GMTN) Programme at a coupon of
4%, Lowest ever 10-year US$ bond coupon and largest order book by a South African issuer;
first SA Issuer to issue a Global ZAR bond (November 2013) in the international debt capital
markets; and
successful re-entry in the domestic debt capital markets with the issuance of the Transnet Bond
Maturing in year 2030 (TN30) and Transnet Bond Maturing in year 2040 (TN40 ) under the Domestic
Medium – Term Note (DMTN - September 2014).
Over the next seven years, the anticipated funding requirement amounts to R125.6bn, with the funding
requirements relatively evenly spread over the next seven years by Transnet.
Transnet will continue to access the numerous funding sources established over time, such as the DMTN
programme, GMTN programme, Export Credit Agency’s (ECAs), Development Financial Institutions (DFIs)
and financial institutions to explore alternative new sources ensuring that Transnet has diversified funding
sources and sufficient liquidity available in challenging market conditions whilst still maintaining its
investment grade credit rating (to the extent that this is within Transnet’s control).
The majority of the MDS’s investments will be in general freight and additional capacity across all other
commodities. MDS is geared to improve rail connectivity ensuring that the port capacity will not be
compromised by less than efficient railway operations.
The Authority is committed to its core strategy which is aligned to the MDS and Shareholder expectations.
The Authority’s total capital expenditure on MDS to date is R5.8bn with the following key successes:
The expansion of the Cape Town Container Terminal capacity from 0,9m TEUs to 1,5m TEUs was
completed in December 2012.
Phase 2A of the expansion of the Ngqura Container Terminal was completed in August 2012 creating 1,5m TEU’s of additional capacity.
Award of contract to local supplier for the delivery of 9 Tugs. First Tug delivery will be in FY 2015/16.
Award of a contract for 5,500m3 Trailer Suction Hopper Dredger (TSHD), planned delivery in 2015/16.
Implementation of the pilot phase of the Integrated Port Management System (IPMS) to provide a strategic technology base towards the realisation of a “smart port”.
The Authority’s planned investment programme contributes R42.9bn (excluding the Durban Dig Out Port)
to the Transnet MDS Capex programme. The key pillars of the Authority’s core strategy, which are aimed
at lowering the cost of doing business and driving growth in the economy, are as follows:
Transnet National Ports Authority Tariff Application for Financial Year 2016/17 __________________
Page 20 of 85
Create and manage infrastructure capacity ahead of demand;
Improving port efficiency through increased productivity and operations oversight; and
To facilitate an integrated logistics chain that will establish the port system as an integrated
gateway for trade.
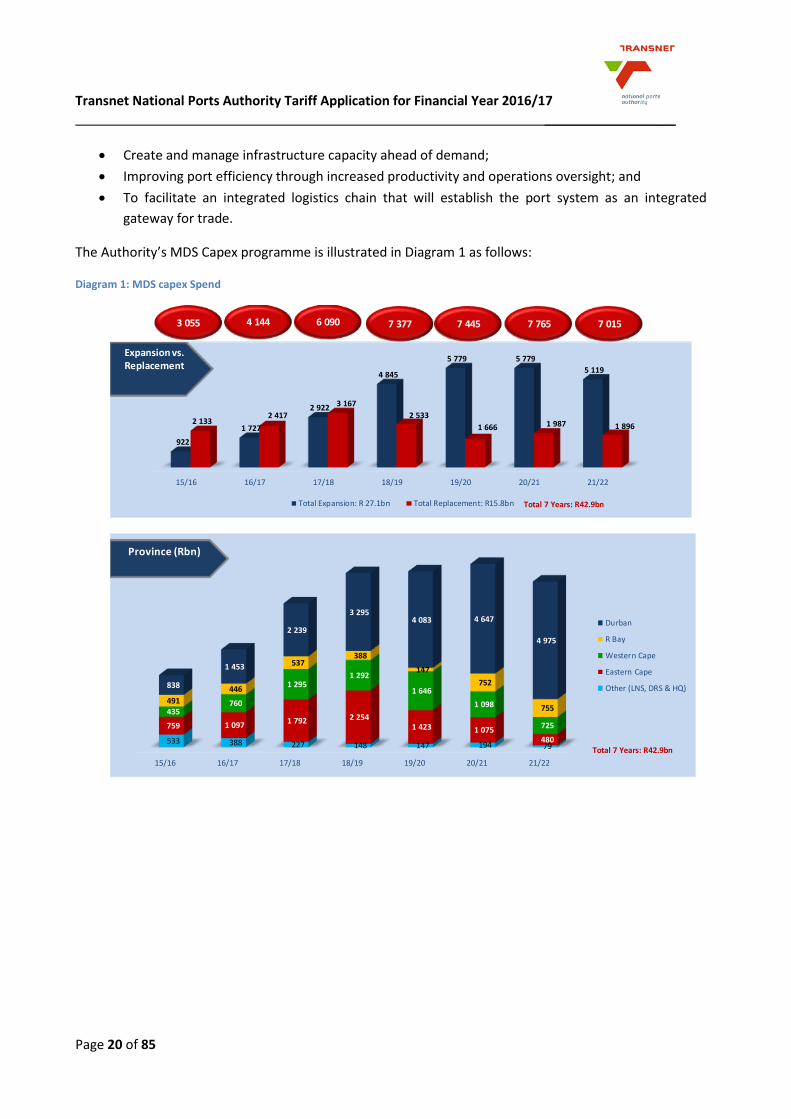
The Authority’s MDS Capex programme is illustrated in Diagram 1 as follows:
Diagram 1: MDS capex Spend
15/16 16/17 17/18 18/19 19/20 20/21 21/22
533 388 227 148 147 194 79
759 1 097 1 792 2 254
1 423 1 075 480
435 760
1 295 1 292
1 646
1 098
725
491
446
537 388
147
752
755
838
1 453
2 239
3 295 4 083 4 647
4 975
Durban
R Bay
Western Cape
Eastern Cape
Other (LNS, DRS & HQ)
Province (Rbn)
Total 7 Years: R42.9bn
15/16 16/17 17/18 18/19 19/20 20/21 21/22
922
1 727
2 922
4 845
5 779 5 779
5 119
2 133 2 417
3 167
2 533
1 666 1 987 1 896
Total Expansion: R 27.1bn Total Replacement: R15.8bn
Expansion vs. Replacement
Total 7 Years: R42.9bn
3 055 4 144 7 377 7 445 7 765 7 0156 090

Transnet National Ports Authority Tariff Application for Financial Year 2016/17 __________________
Page 21 of 85
Operation Phakisa
The launch of Operation Phakisa by the State President (July 2014) resulted in an analysis of the economic
potential of South Africa’s oceans. Operation Phakisa aimed to assess how the oceans economy can
contribute to increased GDP contribution and increased employment within the marine transport and
manufacturing sector, aligned to the priorities of the National Development Plan. The recommendations
highlighted that South Africa can achieve GDP growth and job creation by pursuing the development of new
port repair facilities and to ensure that existing repair facilities are maintained to promote further growth
in the vessel repair market. The recommendations from Operation Phakisa strongly underlined and
supported the role of the Authority as set out in Section 11 of the Act, which indicates that the Authority
must plan, provide, maintain and improve port infrastructure.
The recommendations of Operation Phakisa also demonstrated that growth within the oceans economy
cannot be realised unless the proposed new port facilities are delivered as integrated industry solutions,
with strong partnerships between the ports, IDZ’s and the repair industry. Operation Phakisa will create
opportunities for industry to invest and operate port facilities that will create capacity and unlock
opportunities within the repair sector. One of the primary initiatives will be to establish dedicated port
facilities to attract such opportunities within the Oil and Gas sector.
The Authority is committed to the delivery of Operation Phakisa. To deliver Operation Phakisa, new vessel
repair facility opportunities will be pursued at the Ports of Saldanha, Richards Bay and East London, whilst
maintenance and refurbishment of existing vessel repair facilities have been prioritised at the Ports of
Durban, East London, Port Elizabeth, Mossel Bay and Cape Town. Further to this, boat building capabilities
will be explored at the Port of East London.
The repair facilities to be established at the Port of Saldanha, aims to position the port as an offshore Oil
and Gas services complex with dedicated rig and other vessel repair capabilities. Development will be
aligned with the Saldanha Bay Industrial Development Zone (SBIDZ). The SBIDZ will likely attract companies
that will provide land-based facilities to support offshore operations in terms of logistics, equipment
servicing, rig repair and fabrication, as well as companies interested in dedicated infrastructure and
quayside access for vessel fabrication, logistics and repairs.
Operation Phakisa will create opportunities for the private sector to invest in port facilities. The investment
in new facilities will support both the oil and gas industry and expanding marine manufacturing within ports.
The Authority will invest portion of the funds in the refurbishment of existing facilities within the ports and
with the remainder being outsourced. The Authority’s planned expenditure relating to Operation Phakisa
is captured in this tariff application.
The Authority will follow a Section 56 process which requires bidders to respond to a Request for Proposal
(RfP) with the process commencing initially with the Port of Saldanha for the outsourced funding.
Transnet National Ports Authority Tariff Application for Financial Year 2016/17 __________________
Page 22 of 85
4.4 Tariffs in Perspective
The Authority, like any other port authority, needs to generate revenue by charging tariffs for the services
that it renders, and to achieve the aforementioned MDS targets. The Authority may charge fees, in
accordance with tariffs approved by the Regulator in order to fulfil the functions it must perform in terms
of the Act.
As a landlord port authority, the Authority’s core services, as specified in the Act, result in a number of
revenue streams, which are utilised by the Authority to fulfil its responsibility for the safe, efficient and
effective economic functioning of the national ports system.
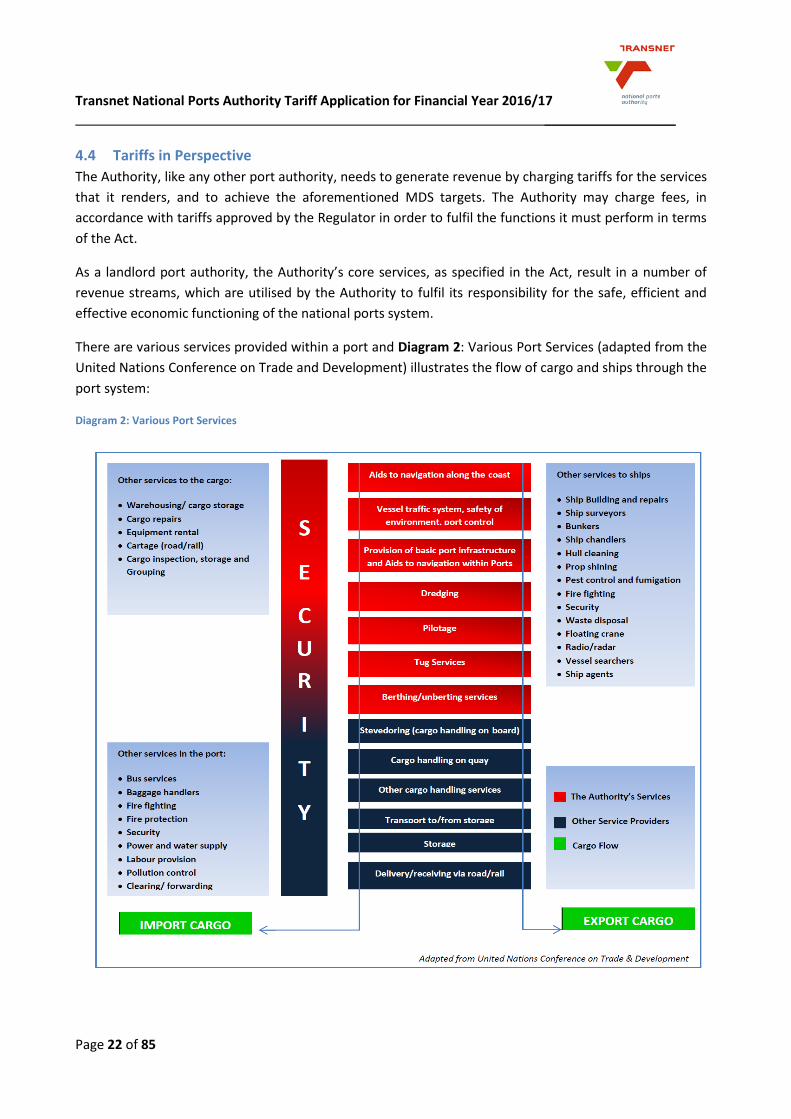
There are various services provided within a port and Diagram 2: Various Port Services (adapted from the
United Nations Conference on Trade and Development) illustrates the flow of cargo and ships through the
port system:
Diagram 2: Various Port Services
Transnet National Ports Authority Tariff Application for Financial Year 2016/17 __________________
Page 23 of 85
The Authority’s services at the ports can be divided into two basic groups:
Basic port infrastructure; and
Operational services to port users.
The Authority’s services and their respective revenue streams are set out in the table below:
Table 6: The Authority's Services and Corresponding Revenue Streams
Port Infrastructure Revenue Stream
Port land and
terminals
Lease port land to terminal operators and other port
service and port facility providers in the port(s).
Lease income (rentals)
Wet
infrastructure
Lighthouse services infrastructure (lighthouses,
buoys, beacons and electronic / radio navigation
equipment) , port control and safety, entrance
channels, breakwaters, turning basins, aids to
navigation within port limits, vessel traffic services,
maintenance dredging within ports.
Light dues, port dues, vessel
traffic services fees
Dry
infrastructure
Quay walls, roads, rail lines, buildings, fencing, port
security, lighting (outside terminals), bulk services
and in certain cases terminal infrastructure
Cargo dues, berth dues
Ship repair
services
Provide and maintain ship repair facilities Preparation fee, docking and
undocking fees (vessels at repair
facilities), berth dues (vessels at
repair quays)
Marine
services
Pilotage, tug assistance, berthing, running of lines,
floating cranes
Pilotage dues, tug assistance fees,
berthing fees, running of line fees,
floating crane hire fees
In the context of the South African ports system and the Act, the revenue generated from the Authority’s
services is utilised inter alia to:
maintain basic port infrastructure;
provide future port infrastructure;
maintain and provide the current and future marine fleet; and
maintain and provide current and future ship repair facilities
This makes the South African port system distinct from most ports internationally, where typically, some
port capital costs are funded through State or Municipal budgets. The Authority’s Tariff Book sets out the
various tariffs that are charged by the Authority to maintain and develop the South African port system
(Refer to Annexure A).
Apart from the services that the Authority itself renders, the Authority is also the controller of port services
and facilities that are provided by others in the ports. The Authority exercises such control in accordance
Transnet National Ports Authority Tariff Application for Financial Year 2016/17 __________________
Page 24 of 85
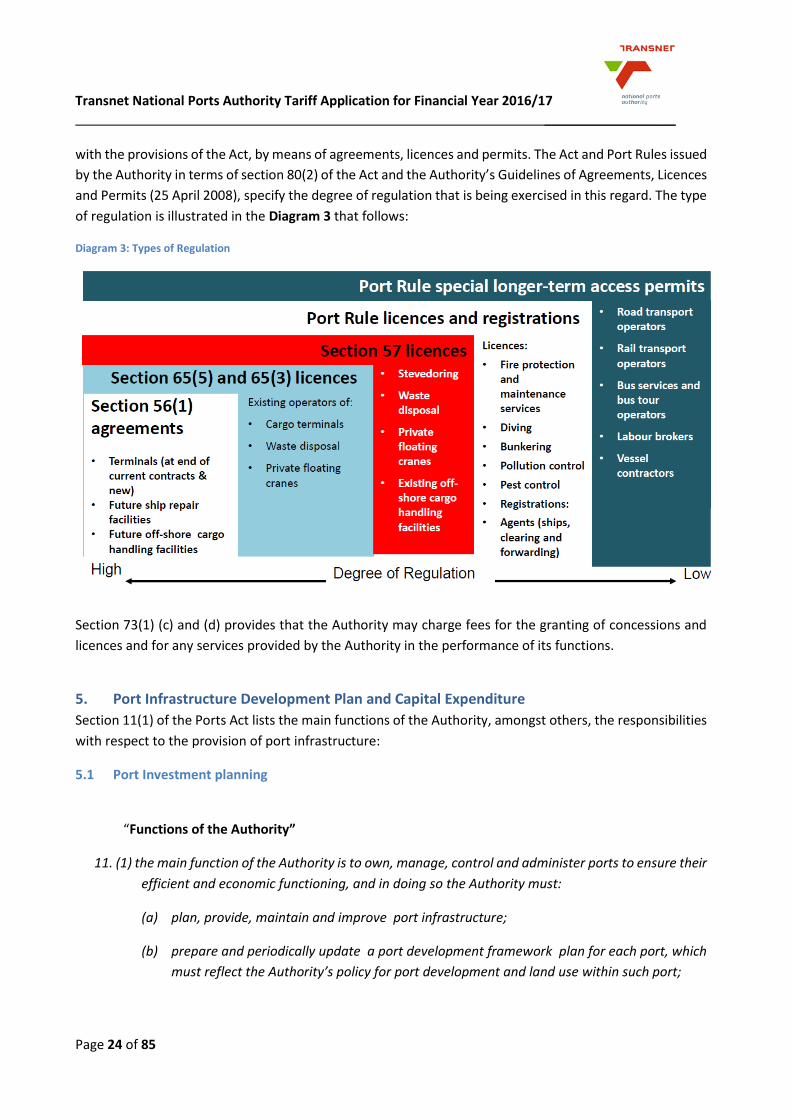
with the provisions of the Act, by means of agreements, licences and permits. The Act and Port Rules issued
by the Authority in terms of section 80(2) of the Act and the Authority’s Guidelines of Agreements, Licences
and Permits (25 April 2008), specify the degree of regulation that is being exercised in this regard. The type
of regulation is illustrated in the Diagram 3 that follows:
Diagram 3: Types of Regulation
Section 73(1) (c) and (d) provides that the Authority may charge fees for the granting of concessions and
licences and for any services provided by the Authority in the performance of its functions.
5. Port Infrastructure Development Plan and Capital Expenditure
Section 11(1) of the Ports Act lists the main functions of the Authority, amongst others, the responsibilities
with respect to the provision of port infrastructure:
5.1 Port Investment planning
“Functions of the Authority”
11. (1) the main function of the Authority is to own, manage, control and administer ports to ensure their
efficient and economic functioning, and in doing so the Authority must:
(a) plan, provide, maintain and improve port infrastructure;
(b) prepare and periodically update a port development framework plan for each port, which
must reflect the Authority’s policy for port development and land use within such port;
Transnet National Ports Authority Tariff Application for Financial Year 2016/17 __________________
Page 25 of 85
(c) control land use within ports, and has the power to lease land under such conditions as the
Authority may determine;
(d) provide or arrange for road and rail access within ports;
(e) arrange for such services such as water, light, power and sewerage and telecommunications
within ports;
(f) Maintain the sustainability of the ports and their surroundings;
5.2 The Authority’s Capital Investment Progamme
The Authority’s investment spending is primarily influenced by its detailed strategic initiatives which aim at
providing adequate port infrastructure ahead of demand, improve vessel and cargo turnaround; and
improve the productive use of assets.
In developing the capex plans, the following activities are considered by the Authority:
Long-term Framework Plans: The Authority prepares a National Ports Plan on an annual basis
which includes the individual Port Development Framework Plans. These Plans outline the
proposed investments across the ports to create capacity to meet anticipated demand. The latest
version available is the National Ports Plan (NPP) 2015. The NPP 2015 informs the ports Chapter of
Transnet’s Long Term Planning Framework (LTPF).
Capacity studies: The Authority uses a robust simulation tool to assess the capacity of current
infrastructure and to simulate future infrastructure capacity. The capacity studies are updated
annually.
Volume Studies: The forecasted volumes used in the Authority’s development plans are based on
the Transnet Corporate Plan for the short-term investment guidelines. The long-term investment
guidelines use the forecasted volumes from Transnet’s Freight Demand Model, which provides the
volume studies for all Transnet Operating Divisions. The Transnet Freight Demand Model is a
demand forecasting tool developed and utilised in association with the University of Stellenbosch.
Prioritization: Development projects are prioritized by safety; and secondly to meet demand
forecasted.
Interaction with Transnet: The Authority maintains close interaction with Transnet Planning;
Transnet Commercial and Transnet Capital Integration during the planning cycle and the
development research process. The plan developed by the Authority is incorporated into the
Transnet Plans.
Port Consultative Committees (PCC’s) & National Port Consultative Committees (NPCC’s): The
Authority adopts a consultative approach to the drafting of the Port Development Framework Plans
and the execution of the resultant Capital Investment Plan. Port Development Framework Plans
projected for the short, medium and long term as well as the current and 5 year Capital Investment
Plans have been consulted with port users. This consultation was conducted on a port-by-port basis
during a process facilitated by the Department of Transport (DoT) in May and June 2015 with the
South African Maritime Safety Association (SAMSA) as secretariat. In addition, the aforementioned
Port Development Framework Plans and Capital Investment Plans are consulted per port at each
Transnet National Ports Authority Tariff Application for Financial Year 2016/17 __________________
Page 26 of 85
PCC as well as at the NPCC’s. These plans are informed by the aforementioned Transnet Freight
Demand Model (developed by the University of Stellenbosch). The model was presented to the
NPCC at a workshop held in June 2015 to ensure that these plans are understood by port users.
The following initiatives of the Authority are aimed at supporting the MDS and volume growth:
improve management and delivery of capital projects;
ensure compliance to Project Lifecycle Process (PLP) model;
tracking of capital projects delivery by the Enterprise Programme Management Office (EPMO);
improve capital planning and budgeting processes;
improve procurement process to reduce turnaround time;
ensure disciplined execution of the capital and maintenance programmes;
implement integrated commercial management and integrated capacity planning processes with a
total supply chain focus to improve customer service and achieve wider integration of the port
system;
increase focus on business development; and
improve land and other asset utilization.
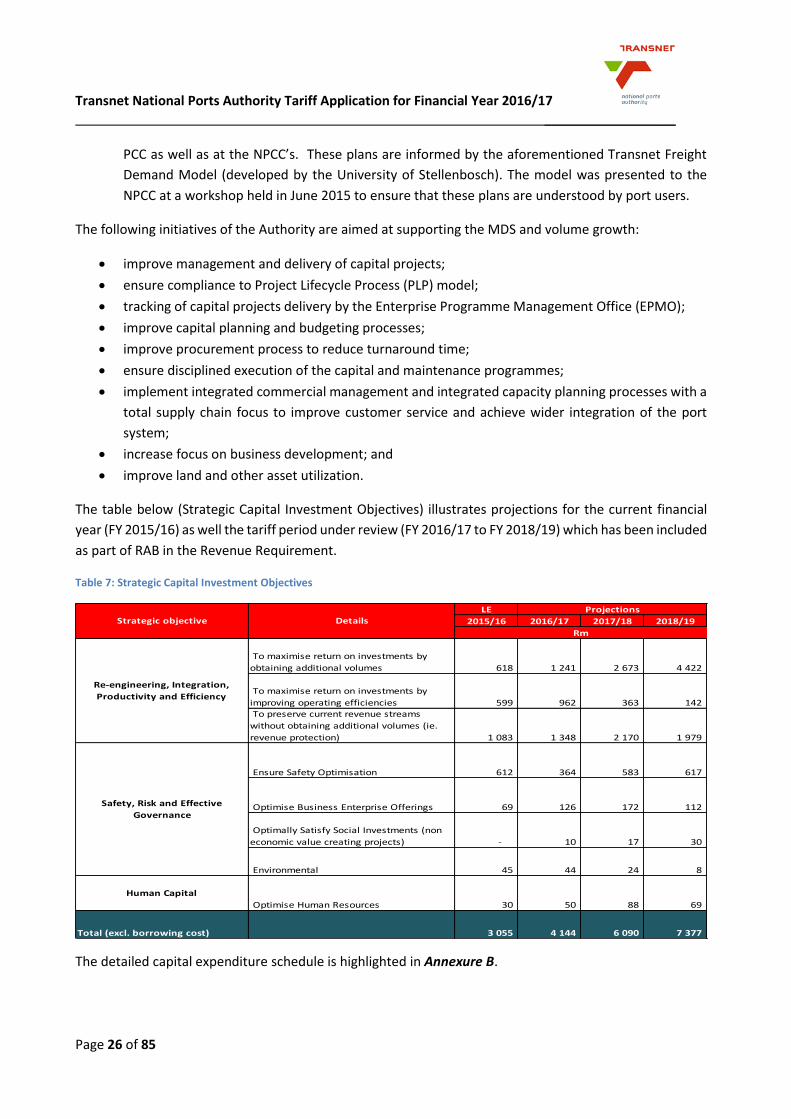
The table below (Strategic Capital Investment Objectives) illustrates projections for the current financial
year (FY 2015/16) as well the tariff period under review (FY 2016/17 to FY 2018/19) which has been included
as part of RAB in the Revenue Requirement.
Table 7: Strategic Capital Investment Objectives
The detailed capital expenditure schedule is highlighted in Annexure B.
LE
2015/16 2016/17 2017/18 2018/19
To maximise return on investments by
obtaining additional volumes 618 1 241 2 673 4 422
To maximise return on investments by
improving operating efficiencies 599 962 363 142 To preserve current revenue streams
without obtaining additional volumes (ie.
revenue protection) 1 083 1 348 2 170 1 979
Ensure Safety Optimisation 612 364 583 617
Optimise Business Enterprise Offerings 69 126 172 112
Optimally Satisfy Social Investments (non
economic value creating projects) - 10 17 30
Environmental 45 44 24 8
Human Capital
Optimise Human Resources 30 50 88 69
Total (excl. borrowing cost) 3 055 4 144 6 090 7 377
Safety, Risk and Effective
Governance
Re-engineering, Integration,
Productivity and Efficiency
Strategic objective DetailsProjections
Rm
Transnet National Ports Authority Tariff Application for Financial Year 2016/17 __________________
Page 27 of 85
6. The Authority’s Total Revenue
6.1 Real Estate Revenue
The Authority has positioned itself as a landlord port authority, managing all fixed assets under its control
in a responsible and productive manner.
Real Estate Management is driven by key principles that seek to support the vision of creating a world-class
port system in South Africa, that supports the development goals of our country and the region as a conduit
for import and export trade between South Africa and the world. The Authority leases out land to achieve
optimum productivity within the ports.
Third party tenants enter into short/long term leases to enable them to invest and develop facilities for
their operations. Rentals are negotiated on a case by case basis and are therefore not reflected in the
Authority’s Tariff Book.
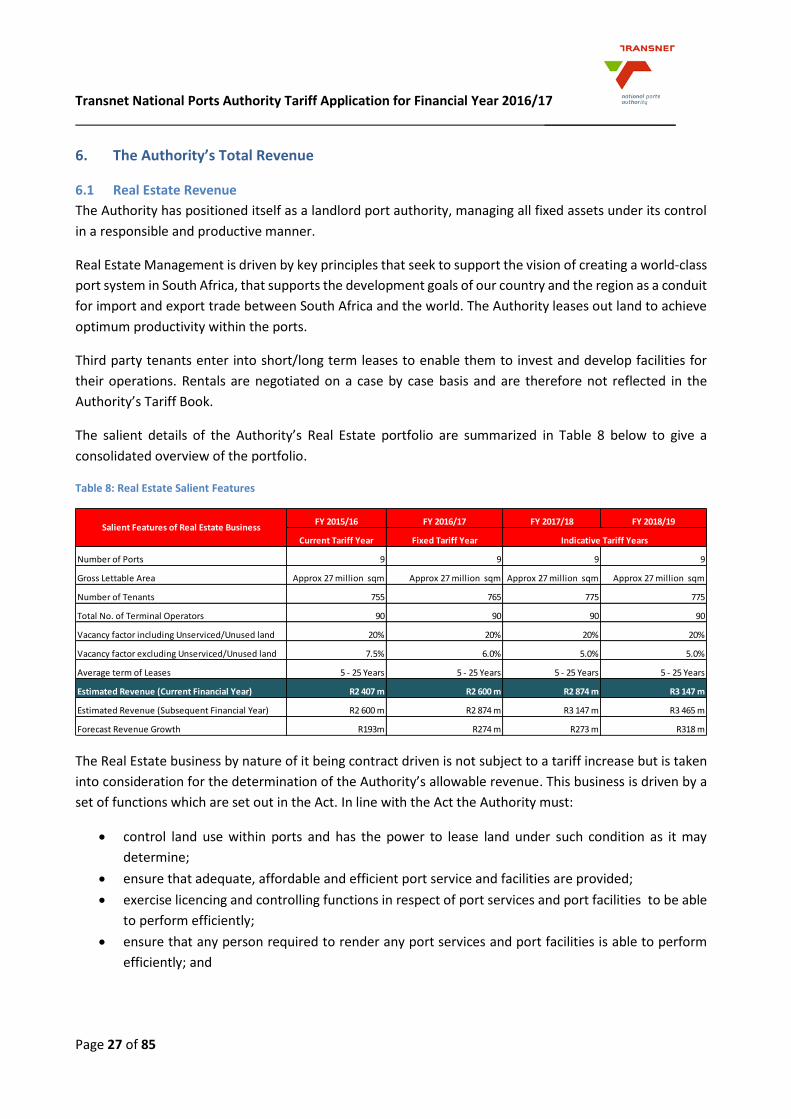
The salient details of the Authority’s Real Estate portfolio are summarized in Table 8 below to give a
consolidated overview of the portfolio.
Table 8: Real Estate Salient Features
The Real Estate business by nature of it being contract driven is not subject to a tariff increase but is taken
into consideration for the determination of the Authority’s allowable revenue. This business is driven by a
set of functions which are set out in the Act. In line with the Act the Authority must:
control land use within ports and has the power to lease land under such condition as it may
determine;
ensure that adequate, affordable and efficient port service and facilities are provided;
exercise licencing and controlling functions in respect of port services and port facilities to be able
to perform efficiently;
ensure that any person required to render any port services and port facilities is able to perform
efficiently; and
FY 2015/16 FY 2016/17 FY 2017/18 FY 2018/19
Current Tariff Year Fixed Tariff Year
Number of Ports 9 9 9 9
Gross Lettable Area Approx 27 million sqm Approx 27 million sqm Approx 27 million sqm Approx 27 million sqm
Number of Tenants 755 765 775 775
Total No. of Terminal Operators 90 90 90 90
Vacancy factor including Unserviced/Unused land 20% 20% 20% 20%
Vacancy factor excluding Unserviced/Unused land 7.5% 6.0% 5.0% 5.0%
Average term of Leases 5 - 25 Years 5 - 25 Years 5 - 25 Years 5 - 25 Years
Estimated Revenue (Current Financial Year) R2 407 m R2 600 m R2 874 m R3 147 m
Estimated Revenue (Subsequent Financial Year) R2 600 m R2 874 m R3 147 m R3 465 m
Forecast Revenue Growth R193m R274 m R273 m R318 m
Indicative Tariff Years
Salient Features of Real Estate Business
Transnet National Ports Authority Tariff Application for Financial Year 2016/17 __________________
Page 28 of 85
promote the achievement of equality by measures designed to advance persons or categories of
persons historically disadvantaged by unfair discrimination in the operation of facilities in the ports
environment.
Further to the above, in terms of Section 11 (r) of the Act, the Authority must promote greater
representivity, in particular to increase participation in terminal operations of historically disadvantaged
persons. In order to achieve compliance with the Act, the Authority has considered measures to achieve
75% of Level 4 B-BBEE status in lease contracts.
6.2 Marine Business Revenue
The Authority generates revenue by providing services to port users, which include terminal operators,
shipping lines, ship agents, cargo owners and the clearing and forwarding industry. Port Infrastructure and
maritime services are provided by the Authority for the five commodity categories namely; containers, dry
bulk, liquid bulk, break-bulk and automotives. The main source of revenue is the tariffs which are charged
by the Authority for providing the aforementioned services with approval by the Regulator. In determining
the tariffs of the Authority consideration is given to the forecasted volume growth which is influenced by
the economic outlook.
6.2.1 The Authority’s Volumes
The volumes of the Authority are mainly driven by Cargo and Marine services.
The annual and forthcoming yearly projections for the Authority’s volume budget process usually
commence in October and spans until the Transnet Board approves the budgets in February of the following
year.
The budget process generally gives an indication of the current year’s performance (Latest Estimates); the
following year’s volumes (budget period) and the forecast for the next six years. This in essence allows
Transnet to plan its goals for the short to medium term and determine its profitability over the period.
The volumes budget compilation follows a bottom-up approach, commencing with the Authority’s Key
Account Managers (KAM’s) at port level communicating and liaising with customers concerning their
operational and strategic plans and how this translates into volume forecasts for the six year period. The
KAM’s also liaise with all Port Terminals operating within their Ports for alignment purposes and will then
consolidate at Port Level for all different cargo categories and forward to Head Office for consolidation.
During the budget evaluation process that follows various key factors such as historic, prevailing and
anticipated future market conditions, operational efficiencies, and infrastructure capacity levels and
anticipated improvements through-out the value chain are considered in order to validate the
reasonableness of commodity volume projections over the period.
Transnet has also implemented periodic volume validation exercises which entail a formal interaction
platform with key customers to validate customer volume forecasts. All divisions of Transnet participate in
these volume validation exercises, with the objective of integrated and synchronised volume planning
through the entire commodity value chain.
Transnet National Ports Authority Tariff Application for Financial Year 2016/17 __________________
Page 29 of 85
6.3 Cargo
Growth in cargo volumes through the port system is driven largely by both local and global demand and
supply. The Authority has various categories of cargo that traverse port infrastructure and therefore
generate revenue in the form of cargo dues. Cargo types are categorised according to the manner in which
they are handled.
These cargo types are further differentiated between imports, exports, coastwise and transhipments.
Imports are classified as cargo emanating from an international destination destined for South
African Ports
Exports are cargo shipped from any South African port destined for an international destination.
Coastwise cargo is cargo emanating from within the borders of South Africa shipped from one South
African port and destined to another South African port.
Transhipment cargo is cargo emanating from an international source destined for another
international destination (except South Africa), which is handled at a South African port. This cargo
could be termed “cargo in transit”.
Transnet National Ports Authority Tariff Application for Financial Year 2016/17 __________________
Page 30 of 85
The Authority’s actual volumes for FY 2014/15 together with budgeted volumes for FY 2015/16 together
with the volume projections and growth for FY 2016/17 to FY 2018/19 differentiated into the various cargo
types are highlighted in the table below.
Table 9: Authority’s Volume Growth
6.3.1 Containers
The volume projection for the South African port system is estimated at approximately 5.1m Twenty-foot
Equivalent Units (TEUs) for FY 2016/17. This results in a projected annual average growth rate of 4% for the
FY 2016/17.
The global container industry had shown resilience since 2013. The domestic container sector in line with
the global container movements has weakened. This is a direct reflection of the deteriorating domestic
economic activity and consumption as well as economic activity in South Africa’s main trading partners.
Drewry forecasts container volumes across Africa to grow by 4.5% in 2015 from a 3.4% growth rate in 2014,
with the Authority’s own volume forecasts indicating a 3.66% for South African ports over the tariff period.
The container sector volumes is envisaged to reflect a subdued domestic economic outlook in the medium-
term particularly due to the low domestic manufacturing activity. Manufacturing sector posted zero growth
Actual
Latest
Estimate % Forecast % Forecast % Forecast %
FY 2014/15 FY 2015/16 Deviation FY 2016/17 Deviation FY 2017/18 Deviation FY 2018/19 Deviation
Containers (TEUs)
Deepsea Full: Imports 1 434 668 1 435 055 0% 1 484 081 3% 1 530 332 3% 1 573 909 3%
Deepsea Full: Exports 1 083 534 1 194 146 9% 1 234 759 3% 1 273 382 3% 1 310 562 3%
Transhipments 1 102 705 1 163 635 5% 1 241 143 6% 1 319 431 6% 1 372 385 4%
Other 1 078 258 1 111 777 3% 1 149 835 3% 1 187 084 3% 1 217 660 3%
Total 4 699 165 4 904 613 4% 5 109 818 4% 5 310 229 4% 5 474 516 3%
Vehicles (Units)
Vehicle: Imports 359 948 391 443 8% 409 250 4% 448 514 9% 471 531 5%
Vehicle: Exports 265 989 252 051 -6% 263 832 4% 276 450 5% 288 931 4%
Other 42 384 6 728 -530% 7 091 5% 7 481 5% 7 870 5%
Total 668 321 650 222 -3% 680 173 4% 732 445 7% 768 332 5%
Break Bulk (Metric Tons)
Break Bulk : Imports 3 212 736 2 454 546 -31% 2 452 233 0% 2 506 353 2% 2 580 588 3%
Break Bulk: Exports 5 967 281 6 037 746 1% 6 509 241 7% 6 727 398 3% 6 955 172 3%
Other 281 312 88 495 -218% 92 284 4% 92 389 0% 92 464 0%
Total 9 461 329 8 580 787 -10% 9 053 758 5% 9 326 140 3% 9 628 224 3%
Dry Bulk (Metric Tons)
Coal Exports 78 188 933 77 040 000 -1% 80 998 000 5% 87 007 880 7% 90 980 353 4%
Iro Ore Exports 57 200 167 60 500 000 5% 60 500 000 0% 60 500 000 0% 60 500 000 0%
Manganese Ore Exports 10 677 828 10 200 000 -5% 10 300 000 1% 10 300 000 0% 10 300 000 0%
Other Dry Bulk 25 540 921 23 529 419 -9% 28 255 002 17% 30 461 661 7% 31 483 851 3%
Total 171 607 849 171 269 419 0% 180 053 002 5% 188 269 541 4% 193 264 204 3%
Liquid Bulk (kl)
Petroleum 39 503 989 33 357 603 -18% 34 533 102 3% 35 378 596 2% 36 907 557 4%
Chemicals 2 179 697 2 226 465 2% 2 256 856 1% 2 321 286 3% 2 381 964 3%
Other Liquid bulk 1 101 262 1 190 972 8% 1 194 605 0% 1 205 344 1% 1 354 237 11%
Total 42 784 948 36 775 040 -16% 37 984 563 3% 38 905 226 2% 40 643 758 4%
Details
Transnet National Ports Authority Tariff Application for Financial Year 2016/17 __________________
Page 31 of 85
during 2014 having grown by 1.9% and 0.7% during 2012 and 2013, respectively. Imports in input materials
for manufacturing purposes have remained low. Household consumption (i.e. retail sector) remains
subdued due to lower consumer confidence with rising inflation, low income growth, tight credit conditions
and persistently high unemployment levels. A sharp decline in the retail sector consumption has a direct
impact on the volumes of container imports (i.e. 0% increase in Deepsea full imports between FY 2014/15
and FY 2015/16).
Other factors that have negatively influenced container volumes are highlighted below:
subsiding trade activity between South Africa and its major trading partners being particularly the
Euro area and China. China is forecasted to grow by less than 7% during 2015, which poses
significant risks to container volumes;
the Euro area’s economic prospects also remains muted such that trade with South Africa will
remain depressed for some time. South-South trades, which have been significant in the recent
past, where emerging markets and developing economies have been driving global trade, seem to
be changing. These economies have been slowing down from about 5% real growth recorded during
2013 to 4.3% growth expected during 2015. The overall impact of this economic slowdown is likely
to be greater than the strengthening of other major export trading partners such as Germany,
United States of America (USA) and the United Kingdom (UK);
South Africa’s own peculiar challenges such as electricity rationing and a weak exchange rate
rendering the imports of manufacturing components expensive; and
declining commodity prices, increasing fuel prices and overall rising input costs has led to major
industries scaling down production.
Despite subdued growth in container volumes (due to the reasons above) there remain elements that
contribute to growth, as detailed below:
positive global economic prospects should further stimulate demand for domestic manufactured
products thus supporting a moderate increase in containerized exports and also imports of inputs
into the manufacturing and production process;
increase in reefer shipping particularly of the agricultural products exported to Europe, USA and
Asia;
additional cargo handling equipment capacity to be deployed in the next two and a half years will
allow increased transshipments at the Port of Ngqura, coupled with tariff incentives aimed at
promoting transshipments through the SA port system;
the switch in mode of transport from RoRo’s to containers;
the containerization of dry bulk; and
increase in Transhipment cargo.
The current declining Chinese economy poses a short term threat which if the trend continues, will become
a medium term threat as the country is one of SA’s biggest trading partners. Labour unrest remains a real
threat which can impact volumes intermittently, along with fuel prices, electricity supply disruptions and
market/industry protectionism.
Transnet National Ports Authority Tariff Application for Financial Year 2016/17 __________________
Page 32 of 85
6.3.2 Automotives
According to current global production signals, the automotive industry is returning to pre-2009 annual
growth of around 4%. Even with tumbling markets in some BRICS countries, poor profitability among
European players and excessive profitability in Chine (i.e. which is likely to be corrected by the markets) the
Automotive sector outlook is positive. The outlook of South Africa’s main trading partners (UK & USA)
indicates the recovery in automotive production. The Authority’s automotive volumes for FY 2015/16 are
expected to decline by 3% compared to the previous year, with a slight improvement in FY 2016/17 and an
average annual growth rate of approximately 5% over the 3 year period ending March 2019.
The main risk to the domestic auto manufacturing is the continued power supply disruptions amongst other
economic factors. The bulk of South African automotive exports are destined for Australia, Europe, Africa,
Asia and North America. With the positive global economic outlook on the automotive industry, particularly
the United States and Europe, during FY 2016/17 the export volume growth is expected to stabilize at
approximately 4%.
The following factors further support growth in the export automotives:
Government’s proposed Medium and Heavy Commercial Vehicle Automotive Investment Scheme
(MHSC-AIS) together with the Automotive Production and Development Programme (APDP) incentive
should continue to boost the auto industry thereby increasing export volumes;
FAW Vehicle Manufacturers South Africa (FAW SA) has started the production of truck and tipper bodies at
a new body shop facility, located in the Eastern Cape and they estimate that 60% of the production will be
exported, which should support automotive export volumes;
The Department of Trade and Industry's (DTI) incentive namely APDP has been extended to among
others, Ford Motor Company of Southern Africa (FMCSA) to boost its manufacturing competiveness
against rival manufacturers in countries such as Thailand and Brazil. The incentive programme allowed
FMCSA to maximise its production capacity and export two-thirds of its locally produced vehicles to
about 140 countries, enabling it to develop a significant export base and offset its geographical
disadvantage;
Volkswagen South Africa (VWSA) expects the recent launch of its new model called “UP” to close a gap
in the entry-level market. VWSA is targeting “UP” sales of around 250-300 units per month. Some of
these units might be exported to other markets.
MAN Truck & Bus South Africa (MTBSA), has unveiled a grid-connected solar photovoltaic rooftop system
at its assembly plant in Durban. The 580 kW, 2,320-panel system can generate up to 810,000 kWh annually,
and is also capable of supplying additional energy to the eThekwini metropolitan grid. The system will allow
the company to operate even during periods of power outages. This implies that MTBSA will be able to
meet its production requirements both for the domestic market and for export destinations. Thus no
deviation is expected against the forecasted MAN volumes passing through the ports. However, MAN
expects flat sales for 2015, due to lack of funding in the bus market.
Transnet National Ports Authority Tariff Application for Financial Year 2016/17 __________________
Page 33 of 85
6.3.3 Coal
Coal exports are expected to grow by an annual average rate of 5.3% over the 3 year period ending March
2019. The decrease in volumes from FY 2014/15 to FY 2015/16 is mainly driven by the oversupply in the
market. Declining coal prices also adversely affected producer margins, which resulted in elevated port
inventory levels instead of higher export volumes. The coal market remains vulnerable to global economic
recovery and performance especially from our trading partners such as China. The declining price trend is
expected to continue on the back of the flat growth rates.
The weakening Chinese economy does not support the export coal market. China’s economic growth has
traditionally relied on large investment projects and heavy industries which fueled demand for coal. The
increased use of natural gas in particular amid efforts to curb air pollution, efficiency advancements in coal
conversion technology and low capacity utilisation rates for coal fired power stations (from 60% in 2011 to
56% in 2014) suggest that China’s coal consumption is on a decline.
By contrast, India and Japan are expected to increase their reliance on coal imports which may support the
global coal seaborne market.
Competition for export volumes could come from South Africa’s own domestic consumption as more coal
production may be diverted towards Eskom new coal power stations (i.e. Medupi, Kusile) as well as any
other existing power stations due for coal contract extensions. While this may offer short-term relief for
some domestic producers given the weak global demand environment, Eskom requires long-term
agreements which may be more punitive in the medium-term given the low domestic coal price and it
would be difficult to divert production back to the export market once global demand recovers. Further,
the response to climate change in efforts to reduce carbon emissions mean alternative fuel sources are
likely to be promoted at the expense of coal.
6.3.4 Iron Ore
A rapid increase in the global supply market of iron ore, combined with moderate demand growth in China,
resulted in the price falling nearly 50% in 2014. Iron Ore volumes reflect an increase of 5% for FY 2015/16
and remain stagnant for the subsequent three years ending March 2019 and is mainly due to the port air
emissions license conditions.
The Port of Saldanha is the dedicated port for iron ore exports with a capacity of 58.5 million tons per
annum (Mtpa). The Multipurpose Terminal at the port will also handle Iron Ore volumes in order to alleviate
some of the pressure on the Bulk Terminal in Saldanha. While channel capacity expansion plans are in
progress, iron ore volumes will however remain flat over the forecast period until such time as the
expansion is complete.
6.3.5 Manganese Ore
Manganese ore volumes are anticipated to decrease by 5% for 2015/16; increase by only 1% for 2016/17
and remain static for the following three years mainly due to infrastructure capacity constraints. The Port
of Port Elizabeth (PE) is the primary exporter of manganese with a capacity of 4.9Mtpa. The Port of PE is
capped at 4.9Mtpa as a result of ageing cargo handling equipment. Other ports which handle manganese
in the interim are the Port of Durban, with an estimated capacity of 2Mtpa, as well as the Port of Saldanha

Transnet National Ports Authority Tariff Application for Financial Year 2016/17 __________________
Page 34 of 85
(MPT) with an estimated capacity of 1.6Mtpa. This interim capacity at Durban and Saldanha has been made
available due to the decommissioning of the PE Bulk Terminal in 2019. The current capacity which is in the
region of 8.5Mtpa on all the manganese channels combined, does not meet the current demand from the
South African exporters.
The relocation of the Manganese Terminal from Port Elizabeth to Port of Ngqura should substantially
increase capacity from 8.5Mtpa to 16Mtpa by FY 2019/20, with the first ore expected at the newly
commissioned terminal during February 2019. The decommissioning of the Port Elizabeth Bulk Terminal is
earmarked for August 2019.
6.3.6 Liquid Bulk
Fluctuating oil prices on a global scale is one of the liquid bulk industry’s main and most disruptive issues.
OPEC is controlling 40% of the world's supply of oil and it sets the production levels necessary to meet
global demand. The price fell from a peak of above $100 a barrel to below $50 a barrel in the current year.
In essence the fall in oil prices was due to a lower demand for oil in Europe and China, coupled with a steady
over supply of oil from OPEC. This resulted in an excess supply of oil causing oil prices to fall sharply.
Growth in the South African liquid bulk volumes have remained relatively flat with annual volume demands
fluctuating between 36 million kiloliters (m kl) and 42m kl in the recent past.
The lower GDP growth over the period has resulted in lower demand for liquid bulk products. The
continuing large-scale switching from petrol to diesel-powered motor vehicles is one of the factors
contributing to slower growth in demand, as one of the benefits of diesel is a lower consumption rate per
operating hour. In addition, storage capacity is limited which affects imports of finished products. Thus,
even at low energy prices, imports will always be limited to the storage capacity. In addition, the increased
import volumes of liquid bulk should also be driven by economic activity. Thus, investment in the industry
appears restricted due to limited profitability of existing refineries with operators citing low returns on
investment as well as a lack of clarity on relevant regulations as reasons for their reluctance to upgrade or
expand their facilities.
Furthermore, a continuing commercial risk to the industry and the country as a whole considering that SA
is a net importer of crude oil is the instability in the international crude prices which is an important
consideration for production and supply. Overall, the industry continues to experience low demand
conditions and volatile rand exchange rate that has led to declining margins. The export of chemicals is
largely affected by global market conditions and the state of European economies in particular, and this
major market for South African exports is forecasted to be positive in FY 2015/16.
6.3.7 Marine Services
Marine volumes comprise of the number of ships arriving at South African ports and their associated Gross
Registered Tonnage (GRT). The size of the vessel and the number of days spent in the port dictates the
amount that shipping lines will pay for utilising basic port infrastructure and marine services operational
charges, i.e. tugs, berthing and pilot assistance.
The vessel traffic/ calls is demand driven as it dependents on growth in volumes per cargo commodity.
Based on the current economic outlook, the Authority projects approximately the same number of vessels
Transnet National Ports Authority Tariff Application for Financial Year 2016/17 __________________
Page 35 of 85
arriving at the Ports as shipping lines continue to utilize larger vessels and consolidate cargo volumes to
reduce costs. Furthermore, these vessels are in turn sailing over longer routes. As a result there is subdued
growth in the number of the vessels arriving at the Authority’s ports.
7. Tariff Application Approach
The tariff application for FY 2016/17 has been prepared in accordance with the approved Tariff
Methodology issued by the Regulator. The section that follows illustrates the application of the components
of the Tariff Methodology.
7.1 Revenue Requirement Formula
The Revenue Requirement (RR) approach as per the Tariff Methodology for FY 2015/16 to FY 2017/18 forms
the basis upon which the Regulator will determine the appropriate revenues for the Authority. The formula
as prescribed is as follows:
Revenue Requirement
= Regulatory Asset Base (RAB) x Weighted Average Cost of Capital (WACC)
+ Operating Costs + Depreciation + Taxation Expense ±Claw-back
± Excessive Tariff Increase Margin Credit (ETIMC)
The application of this formula is demonstrated in the sections that follow.
7.1.1 Regulatory Asset Base
The Authority is responsible for the management of the South African national ports system and owns,
develops and maintains port land infrastructure.
7.1.1.1 Asset Base
The RAB on which the Authority is allowed to earn a return on by the Regulator involves all assets of the
Authority. The Regulator retains the discretion to disallow any portion of the RAB as it deems necessary
such as assets that fall outside the ambit of the National Ports Act.
The RAB of the Authority has been trended using the latest inflation forecast from National Treasury per
the Regulatory Manual.
The process used to determine the RAB is as follows:
a) In order to determine the value of the RAB on which a return will be calculated in the allowed
revenue formula, both the closing and opening values of the RAB including capital expenditure are
averaged throughout the period. This is done to recognise availability and incurrence of capital
expenditure throughout the financial year rather than on the first day of the financial year.
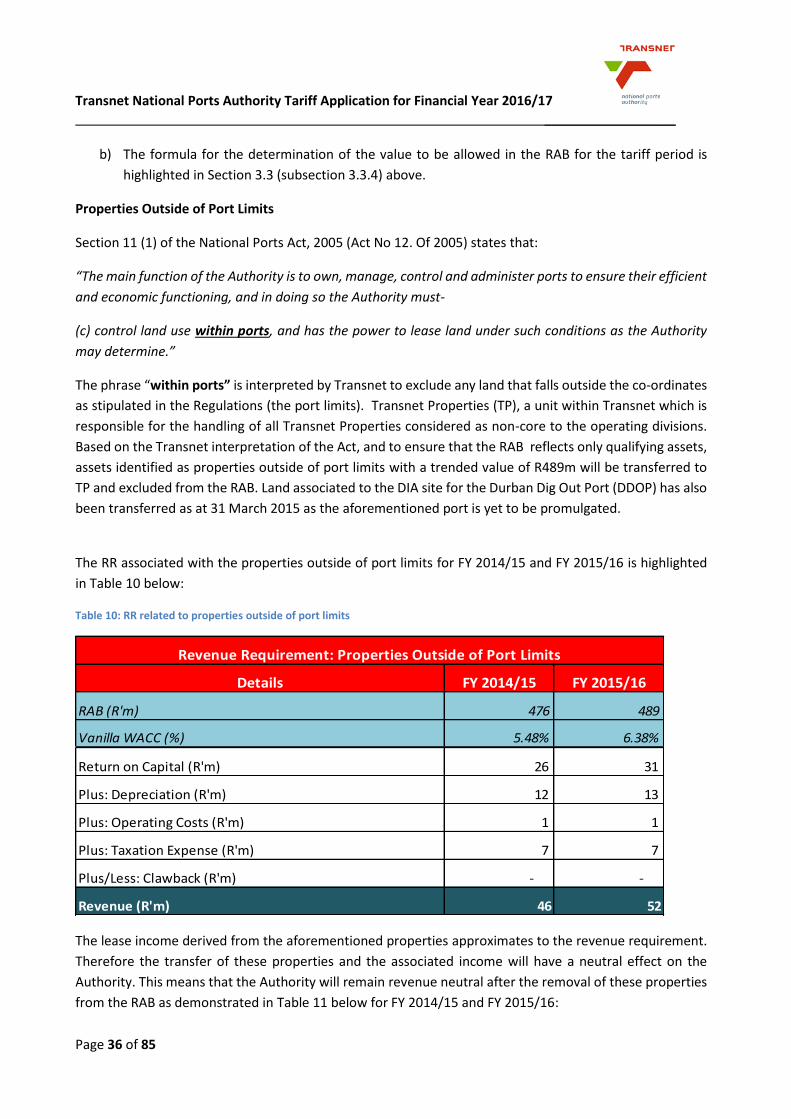
Transnet National Ports Authority Tariff Application for Financial Year 2016/17 __________________
Page 36 of 85
b) The formula for the determination of the value to be allowed in the RAB for the tariff period is
highlighted in Section 3.3 (subsection 3.3.4) above.
Properties Outside of Port Limits
Section 11 (1) of the National Ports Act, 2005 (Act No 12. Of 2005) states that:
“The main function of the Authority is to own, manage, control and administer ports to ensure their efficient
and economic functioning, and in doing so the Authority must-
(c) control land use within ports, and has the power to lease land under such conditions as the Authority
may determine.”
The phrase “within ports” is interpreted by Transnet to exclude any land that falls outside the co-ordinates
as stipulated in the Regulations (the port limits). Transnet Properties (TP), a unit within Transnet which is
responsible for the handling of all Transnet Properties considered as non-core to the operating divisions.
Based on the Transnet interpretation of the Act, and to ensure that the RAB reflects only qualifying assets,
assets identified as properties outside of port limits with a trended value of R489m will be transferred to
TP and excluded from the RAB. Land associated to the DIA site for the Durban Dig Out Port (DDOP) has also
been transferred as at 31 March 2015 as the aforementioned port is yet to be promulgated.
The RR associated with the properties outside of port limits for FY 2014/15 and FY 2015/16 is highlighted
in Table 10 below:
Table 10: RR related to properties outside of port limits
The lease income derived from the aforementioned properties approximates to the revenue requirement.
Therefore the transfer of these properties and the associated income will have a neutral effect on the
Authority. This means that the Authority will remain revenue neutral after the removal of these properties
from the RAB as demonstrated in Table 11 below for FY 2014/15 and FY 2015/16:
Details FY 2014/15 FY 2015/16
RAB (R'm) 476 489
Vanilla WACC (%) 5.48% 6.38%
Return on Capital (R'm) 26 31
Plus: Depreciation (R'm) 12 13
Plus: Operating Costs (R'm) 1 1
Plus: Taxation Expense (R'm) 7 7
Plus/Less: Clawback (R'm) - -
Revenue (R'm) 46 52
Revenue Requirement: Properties Outside of Port Limits
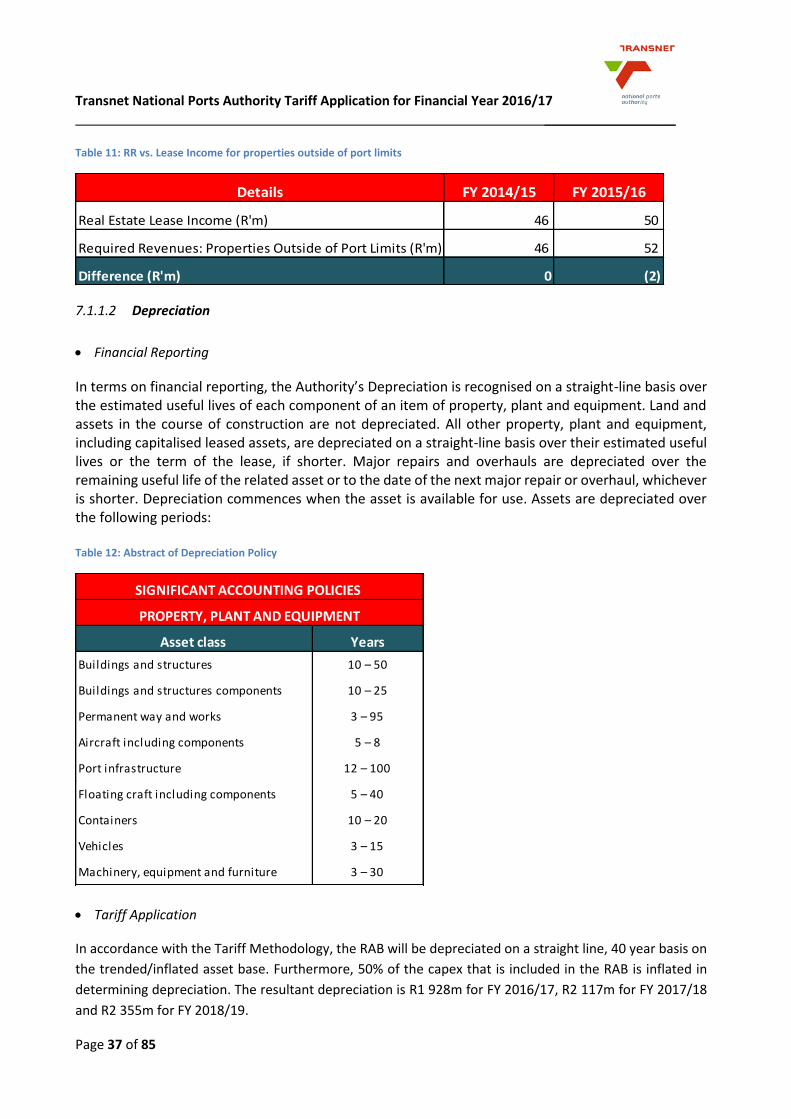
Transnet National Ports Authority Tariff Application for Financial Year 2016/17 __________________
Page 37 of 85
Table 11: RR vs. Lease Income for properties outside of port limits
7.1.1.2 Depreciation
Financial Reporting
In terms on financial reporting, the Authority’s Depreciation is recognised on a straight-line basis over the estimated useful lives of each component of an item of property, plant and equipment. Land and assets in the course of construction are not depreciated. All other property, plant and equipment, including capitalised leased assets, are depreciated on a straight-line basis over their estimated useful lives or the term of the lease, if shorter. Major repairs and overhauls are depreciated over the remaining useful life of the related asset or to the date of the next major repair or overhaul, whichever is shorter. Depreciation commences when the asset is available for use. Assets are depreciated over the following periods: Table 12: Abstract of Depreciation Policy
Tariff Application
In accordance with the Tariff Methodology, the RAB will be depreciated on a straight line, 40 year basis on
the trended/inflated asset base. Furthermore, 50% of the capex that is included in the RAB is inflated in
determining depreciation. The resultant depreciation is R1 928m for FY 2016/17, R2 117m for FY 2017/18
and R2 355m for FY 2018/19.
FY 2014/15 FY 2015/16
Real Estate Lease Income (R'm) 46 50
Required Revenues: Properties Outside of Port Limits (R'm) 46 52
Difference (R'm) 0 (2)
Details
Asset class Years
Buildings and structures 10 – 50
Buildings and structures components 10 – 25
Permanent way and works 3 – 95
Aircraft including components 5 – 8
Port infrastructure 12 – 100
Floating craft including components 5 – 40
Containers 10 – 20
Vehicles 3 – 15
Machinery, equipment and furniture 3 – 30
SIGNIFICANT ACCOUNTING POLICIES
PROPERTY, PLANT AND EQUIPMENT
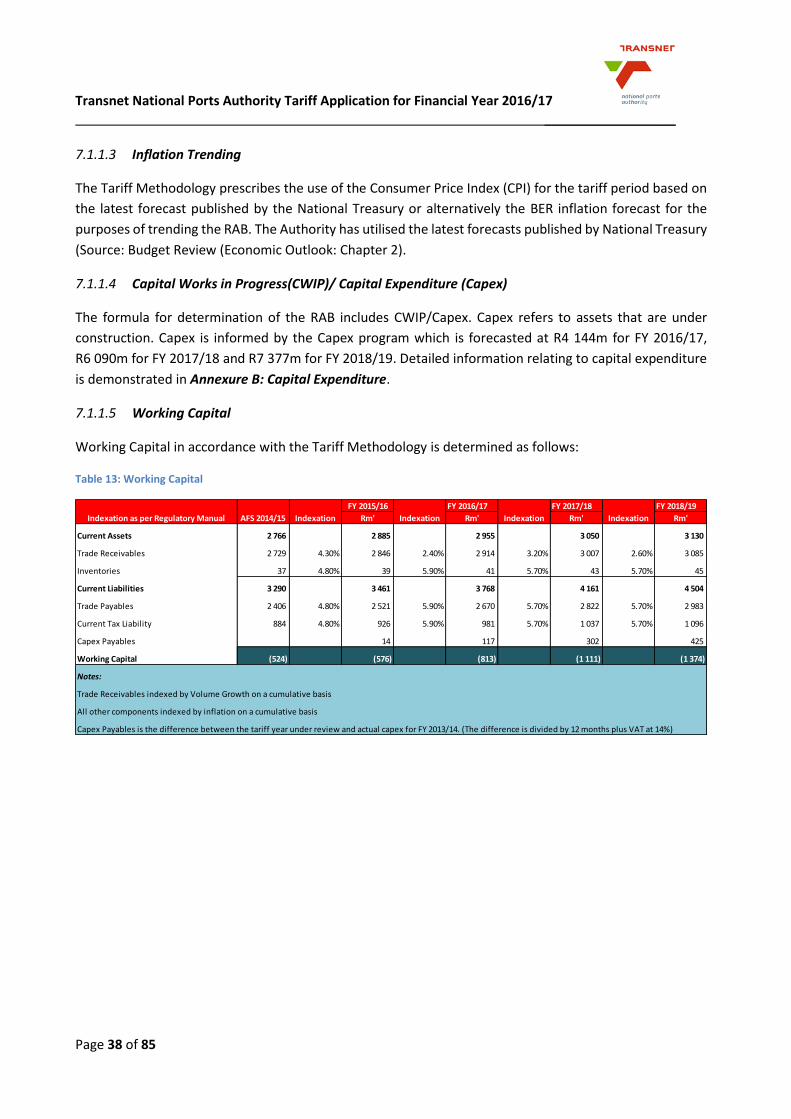
Transnet National Ports Authority Tariff Application for Financial Year 2016/17 __________________
Page 38 of 85
7.1.1.3 Inflation Trending
The Tariff Methodology prescribes the use of the Consumer Price Index (CPI) for the tariff period based on
the latest forecast published by the National Treasury or alternatively the BER inflation forecast for the
purposes of trending the RAB. The Authority has utilised the latest forecasts published by National Treasury
(Source: Budget Review (Economic Outlook: Chapter 2).
7.1.1.4 Capital Works in Progress(CWIP)/ Capital Expenditure (Capex)
The formula for determination of the RAB includes CWIP/Capex. Capex refers to assets that are under
construction. Capex is informed by the Capex program which is forecasted at R4 144m for FY 2016/17,
R6 090m for FY 2017/18 and R7 377m for FY 2018/19. Detailed information relating to capital expenditure
is demonstrated in Annexure B: Capital Expenditure.
7.1.1.5 Working Capital
Working Capital in accordance with the Tariff Methodology is determined as follows:
Table 13: Working Capital
FY 2015/16 FY 2016/17 FY 2017/18 FY 2018/19
AFS 2014/15 Indexation Rm' Indexation Rm' Indexation Rm' Indexation Rm'
Current Assets 2 766 2 885 2 955 3 050 3 130
Trade Receivables 2 729 4.30% 2 846 2.40% 2 914 3.20% 3 007 2.60% 3 085
Inventories 37 4.80% 39 5.90% 41 5.70% 43 5.70% 45
Current Liabilities 3 290 3 461 3 768 4 161 4 504
Trade Payables 2 406 4.80% 2 521 5.90% 2 670 5.70% 2 822 5.70% 2 983
Current Tax Liability 884 4.80% 926 5.90% 981 5.70% 1 037 5.70% 1 096
Capex Payables 14 117 302 425
Working Capital (524) (576) (813) (1 111) (1 374)
Indexation as per Regulatory Manual
Trade Receivables indexed by Volume Growth on a cumulative basis
All other components indexed by inflation on a cumulative basis
Capex Payables is the difference between the tariff year under review and actual capex for FY 2013/14. (The difference is divided by 12 months plus VAT at 14%)
Notes:
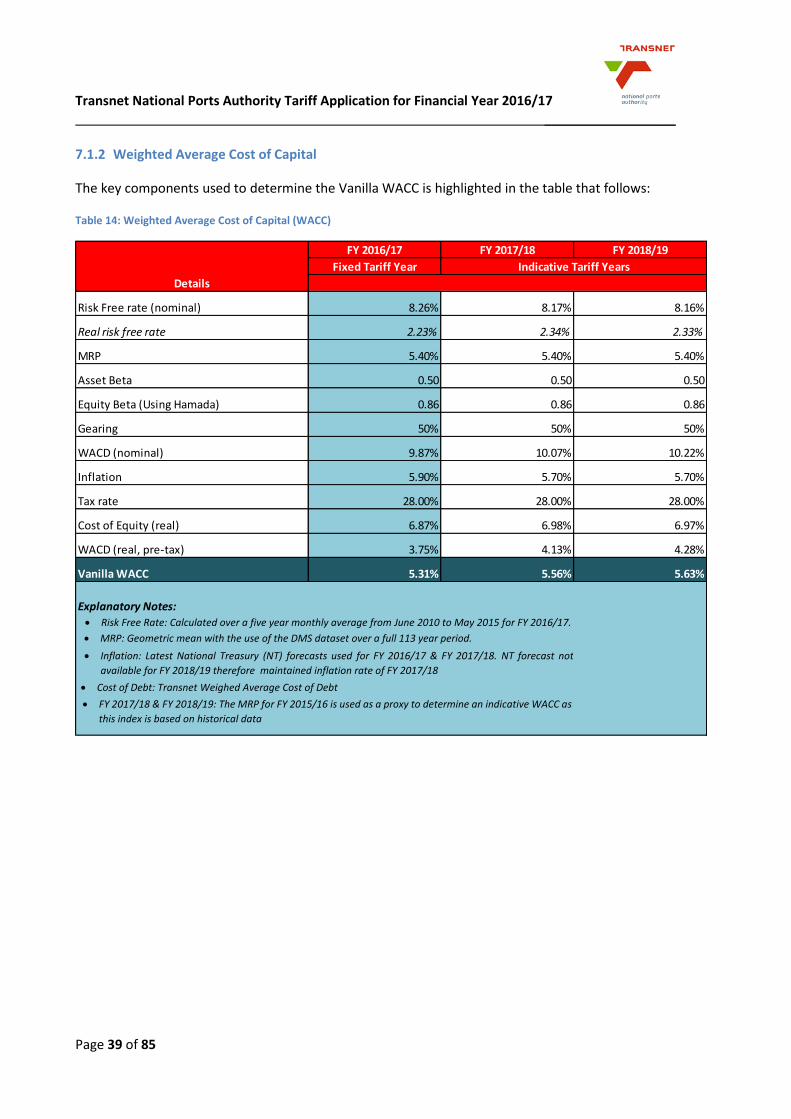
Transnet National Ports Authority Tariff Application for Financial Year 2016/17 __________________
Page 39 of 85
7.1.2 Weighted Average Cost of Capital
The key components used to determine the Vanilla WACC is highlighted in the table that follows:
Table 14: Weighted Average Cost of Capital (WACC)
FY 2016/17 FY 2017/18 FY 2018/19
Fixed Tariff Year
Risk Free rate (nominal) 8.26% 8.17% 8.16%
Real risk free rate 2.23% 2.34% 2.33%
MRP 5.40% 5.40% 5.40%
Asset Beta 0.50 0.50 0.50
Equity Beta (Using Hamada) 0.86 0.86 0.86
Gearing 50% 50% 50%
WACD (nominal) 9.87% 10.07% 10.22%
Inflation 5.90% 5.70% 5.70%
Tax rate 28.00% 28.00% 28.00%
Cost of Equity (real) 6.87% 6.98% 6.97%
WACD (real, pre-tax) 3.75% 4.13% 4.28%
Vanilla WACC 5.31% 5.56% 5.63%
Details
Indicative Tariff Years
Explanatory Notes: Risk Free Rate: Calculated over a five year monthly average from June 2010 to May 2015 for FY 2016/17.
MRP: Geometric mean with the use of the DMS dataset over a full 113 year period.
Cost of Debt: Transnet Weighed Average Cost of Debt
Inflation: Latest National Treasury (NT) forecasts used for FY 2016/17 & FY 2017/18. NT forecast not
available for FY 2018/19 therefore maintained inflation rate of FY 2017/18
FY 2017/18 & FY 2018/19: The MRP for FY 2015/16 is used as a proxy to determine an indicative WACC as
this index is based on historical data
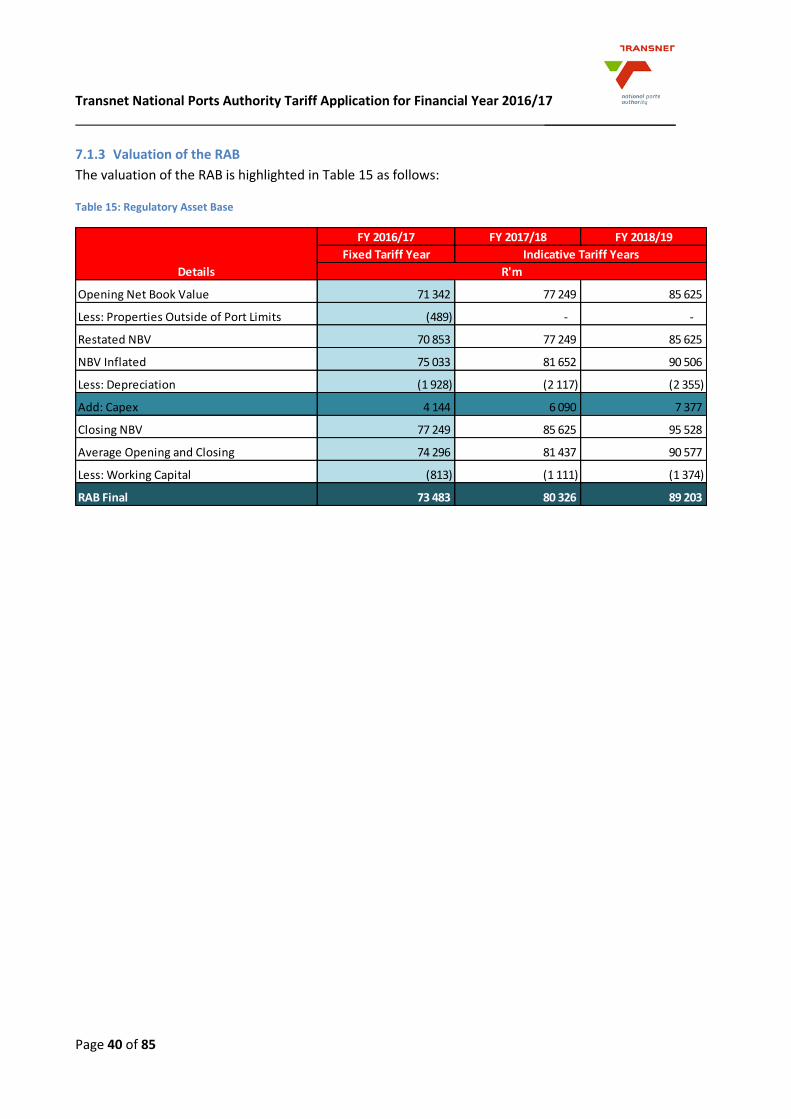
Transnet National Ports Authority Tariff Application for Financial Year 2016/17 __________________
Page 40 of 85
7.1.3 Valuation of the RAB
The valuation of the RAB is highlighted in Table 15 as follows:
Table 15: Regulatory Asset Base
FY 2016/17 FY 2017/18 FY 2018/19
Fixed Tariff Year
Opening Net Book Value 71 342 77 249 85 625
Less: Properties Outside of Port Limits (489) - -
Restated NBV 70 853 77 249 85 625
NBV Inflated 75 033 81 652 90 506
Less: Depreciation (1 928) (2 117) (2 355)
Add: Capex 4 144 6 090 7 377
Closing NBV 77 249 85 625 95 528
Average Opening and Closing 74 296 81 437 90 577
Less: Working Capital (813) (1 111) (1 374)
RAB Final 73 483 80 326 89 203
Indicative Tariff Years
Details R'm
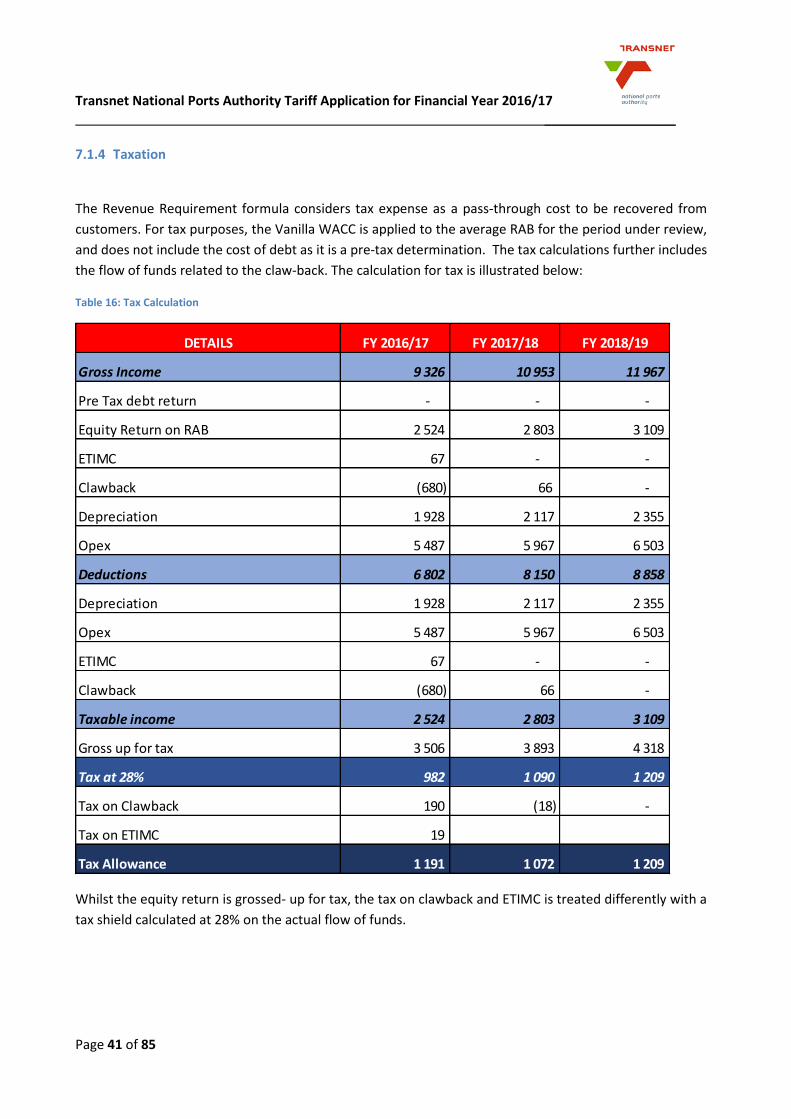
Transnet National Ports Authority Tariff Application for Financial Year 2016/17 __________________
Page 41 of 85
7.1.4 Taxation
The Revenue Requirement formula considers tax expense as a pass-through cost to be recovered from
customers. For tax purposes, the Vanilla WACC is applied to the average RAB for the period under review,
and does not include the cost of debt as it is a pre-tax determination. The tax calculations further includes
the flow of funds related to the claw-back. The calculation for tax is illustrated below:
Table 16: Tax Calculation
Whilst the equity return is grossed- up for tax, the tax on clawback and ETIMC is treated differently with a
tax shield calculated at 28% on the actual flow of funds.
DETAILS FY 2016/17 FY 2017/18 FY 2018/19
Gross Income 9 326 10 953 11 967
Pre Tax debt return - - -
Equity Return on RAB 2 524 2 803 3 109
ETIMC 67 - -
Clawback (680) 66 -
Depreciation 1 928 2 117 2 355
Opex 5 487 5 967 6 503
Deductions 6 802 8 150 8 858
Depreciation 1 928 2 117 2 355
Opex 5 487 5 967 6 503
ETIMC 67 - -
Clawback (680) 66 -
Taxable income 2 524 2 803 3 109
Gross up for tax 3 506 3 893 4 318
Tax at 28% 982 1 090 1 209
Tax on Clawback 190 (18) -
Tax on ETIMC 19
Tax Allowance 1 191 1 072 1 209
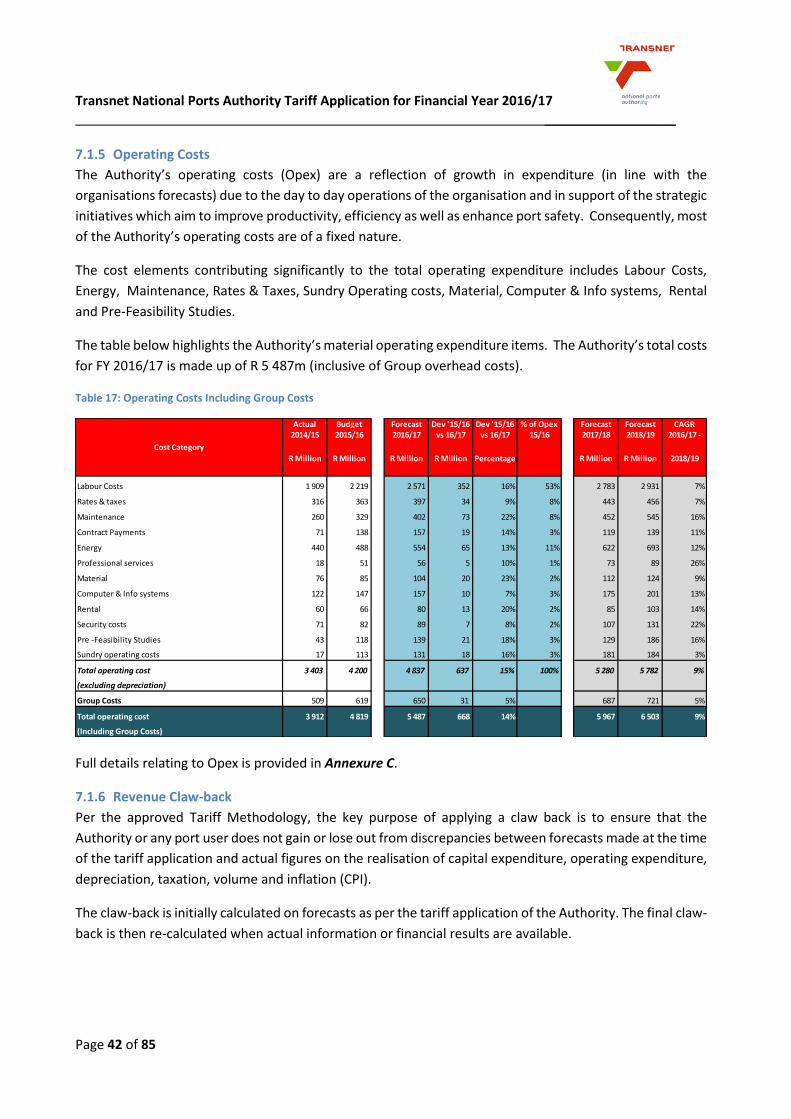
Transnet National Ports Authority Tariff Application for Financial Year 2016/17 __________________
Page 42 of 85
7.1.5 Operating Costs
The Authority’s operating costs (Opex) are a reflection of growth in expenditure (in line with the
organisations forecasts) due to the day to day operations of the organisation and in support of the strategic
initiatives which aim to improve productivity, efficiency as well as enhance port safety. Consequently, most
of the Authority’s operating costs are of a fixed nature.
The cost elements contributing significantly to the total operating expenditure includes Labour Costs,
Energy, Maintenance, Rates & Taxes, Sundry Operating costs, Material, Computer & Info systems, Rental
and Pre-Feasibility Studies.
The table below highlights the Authority’s material operating expenditure items. The Authority’s total costs
for FY 2016/17 is made up of R 5 487m (inclusive of Group overhead costs).
Table 17: Operating Costs Including Group Costs
Full details relating to Opex is provided in Annexure C.
7.1.6 Revenue Claw-back
Per the approved Tariff Methodology, the key purpose of applying a claw back is to ensure that the
Authority or any port user does not gain or lose out from discrepancies between forecasts made at the time
of the tariff application and actual figures on the realisation of capital expenditure, operating expenditure,
depreciation, taxation, volume and inflation (CPI).
The claw-back is initially calculated on forecasts as per the tariff application of the Authority. The final claw-
back is then re-calculated when actual information or financial results are available.
Actual Budget Forecast Dev '15/16 Dev '15/16 % of Opex Forecast Forecast CAGR2014/15 2015/16 2016/17 vs 16/17 vs 16/17 15/16 2017/18 2018/19 2016/17 -
R Million R Million R Million R Million Percentage R Million R Million 2018/19
Labour Costs 1 909 2 219 2 571 352 16% 53% 2 783 2 931 7%
Rates & taxes 316 363 397 34 9% 8% 443 456 7%
Maintenance 260 329 402 73 22% 8% 452 545 16%
Contract Payments 71 138 157 19 14% 3% 119 139 11%
Energy 440 488 554 65 13% 11% 622 693 12%
Professional services 18 51 56 5 10% 1% 73 89 26%
Material 76 85 104 20 23% 2% 112 124 9%
Computer & Info systems 122 147 157 10 7% 3% 175 201 13%
Rental 60 66 80 13 20% 2% 85 103 14%
Security costs 71 82 89 7 8% 2% 107 131 22%
Pre -Feasibility Studies 43 118 139 21 18% 3% 129 186 16%
Sundry operating costs 17 113 131 18 16% 3% 181 184 3%
Total operating cost 3 403 4 200 4 837 637 15% 100% 5 280 5 782 9%
(excluding depreciation)
Group Costs 509 619 650 31 5% 687 721 5%
Total operating cost 3 912 4 819 5 487 668 14% 5 967 6 503 9%
(Including Group Costs)
Cost Category
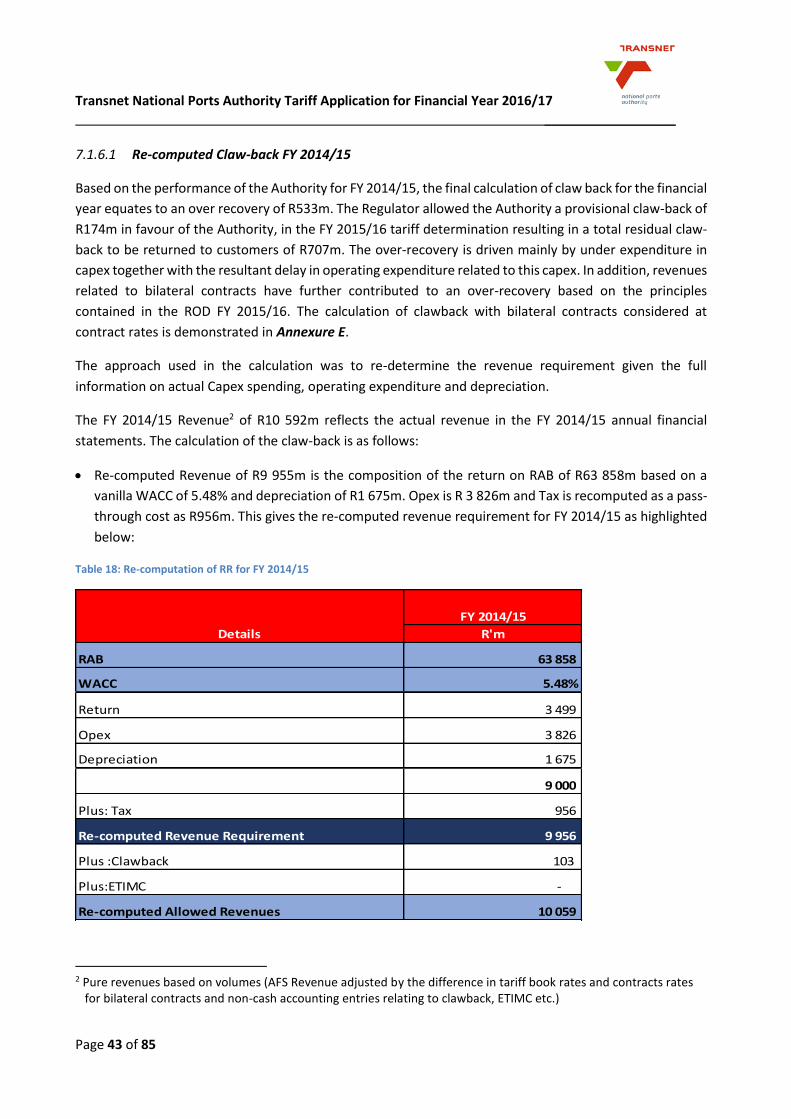
Transnet National Ports Authority Tariff Application for Financial Year 2016/17 __________________
Page 43 of 85
7.1.6.1 Re-computed Claw-back FY 2014/15
Based on the performance of the Authority for FY 2014/15, the final calculation of claw back for the financial
year equates to an over recovery of R533m. The Regulator allowed the Authority a provisional claw-back of
R174m in favour of the Authority, in the FY 2015/16 tariff determination resulting in a total residual claw-
back to be returned to customers of R707m. The over-recovery is driven mainly by under expenditure in
capex together with the resultant delay in operating expenditure related to this capex. In addition, revenues
related to bilateral contracts have further contributed to an over-recovery based on the principles
contained in the ROD FY 2015/16. The calculation of clawback with bilateral contracts considered at
contract rates is demonstrated in Annexure E.
The approach used in the calculation was to re-determine the revenue requirement given the full
information on actual Capex spending, operating expenditure and depreciation.
The FY 2014/15 Revenue2 of R10 592m reflects the actual revenue in the FY 2014/15 annual financial
statements. The calculation of the claw-back is as follows:
Re-computed Revenue of R9 955m is the composition of the return on RAB of R63 858m based on a
vanilla WACC of 5.48% and depreciation of R1 675m. Opex is R 3 826m and Tax is recomputed as a pass-
through cost as R956m. This gives the re-computed revenue requirement for FY 2014/15 as highlighted
below:
Table 18: Re-computation of RR for FY 2014/15
2 Pure revenues based on volumes (AFS Revenue adjusted by the difference in tariff book rates and contracts rates
for bilateral contracts and non-cash accounting entries relating to clawback, ETIMC etc.)
R'm
RAB 63 858
WACC 5.48%
Return 3 499
Opex 3 826
Depreciation 1 675
9 000
Plus: Tax 956
Re-computed Revenue Requirement 9 956
Plus :Clawback 103
Plus:ETIMC -
Re-computed Allowed Revenues 10 059
Details
FY 2014/15
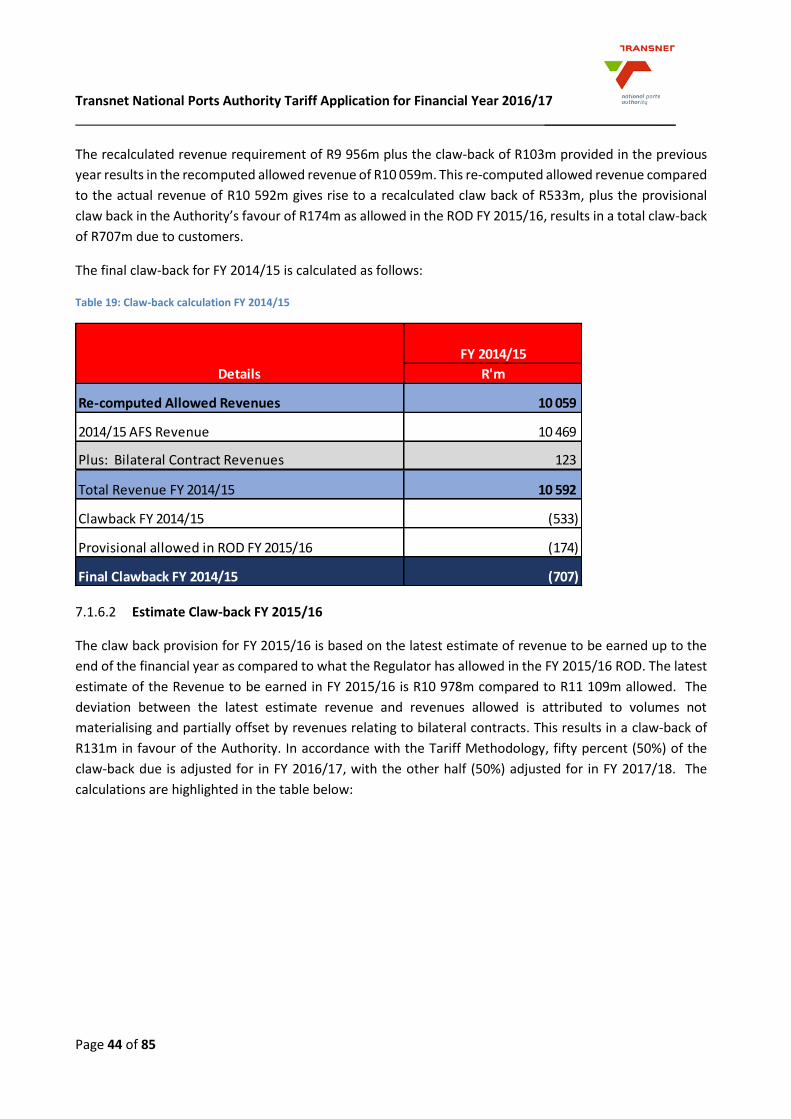
Transnet National Ports Authority Tariff Application for Financial Year 2016/17 __________________
Page 44 of 85
The recalculated revenue requirement of R9 956m plus the claw-back of R103m provided in the previous
year results in the recomputed allowed revenue of R10 059m. This re-computed allowed revenue compared
to the actual revenue of R10 592m gives rise to a recalculated claw back of R533m, plus the provisional
claw back in the Authority’s favour of R174m as allowed in the ROD FY 2015/16, results in a total claw-back
of R707m due to customers.
The final claw-back for FY 2014/15 is calculated as follows:
Table 19: Claw-back calculation FY 2014/15
7.1.6.2 Estimate Claw-back FY 2015/16
The claw back provision for FY 2015/16 is based on the latest estimate of revenue to be earned up to the
end of the financial year as compared to what the Regulator has allowed in the FY 2015/16 ROD. The latest
estimate of the Revenue to be earned in FY 2015/16 is R10 978m compared to R11 109m allowed. The
deviation between the latest estimate revenue and revenues allowed is attributed to volumes not
materialising and partially offset by revenues relating to bilateral contracts. This results in a claw-back of
R131m in favour of the Authority. In accordance with the Tariff Methodology, fifty percent (50%) of the
claw-back due is adjusted for in FY 2016/17, with the other half (50%) adjusted for in FY 2017/18. The
calculations are highlighted in the table below:
R'm
Re-computed Allowed Revenues 10 059
2014/15 AFS Revenue 10 469
Plus: Bilateral Contract Revenues 123
Total Revenue FY 2014/15 10 592
Clawback FY 2014/15 (533)
Provisional allowed in ROD FY 2015/16 (174)
Final Clawback FY 2014/15 (707)
Details
FY 2014/15
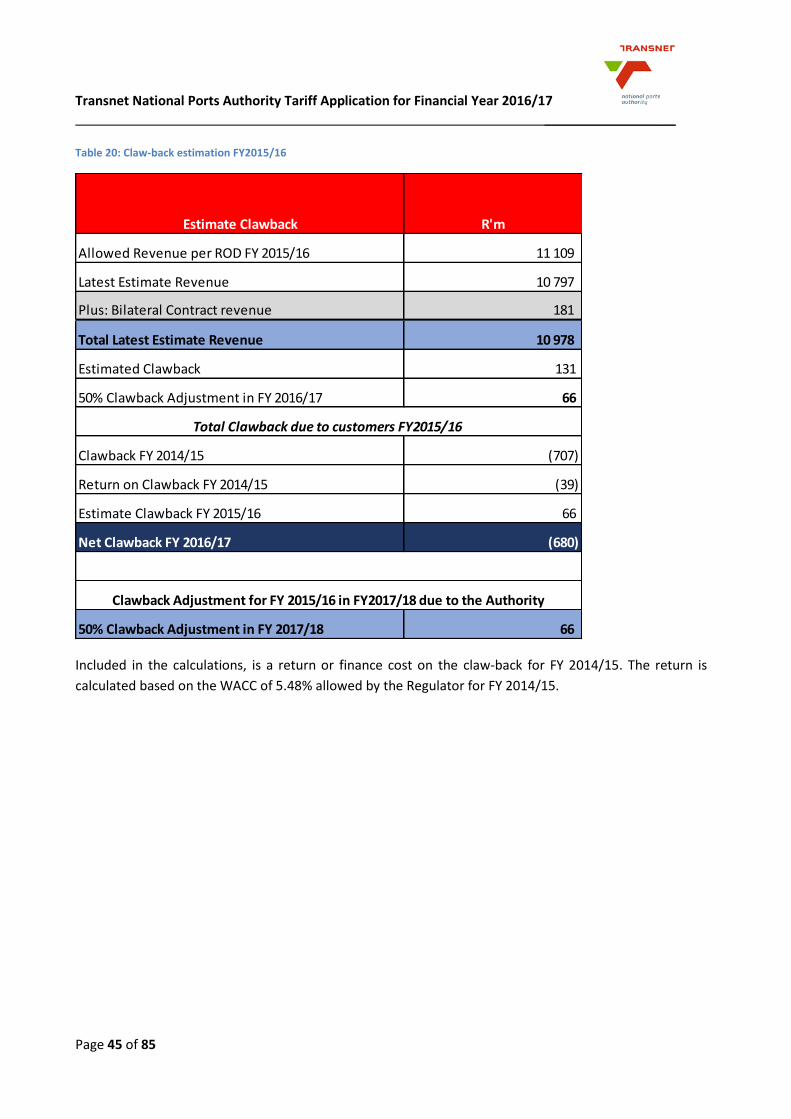
Transnet National Ports Authority Tariff Application for Financial Year 2016/17 __________________
Page 45 of 85
Table 20: Claw-back estimation FY2015/16
Included in the calculations, is a return or finance cost on the claw-back for FY 2014/15. The return is
calculated based on the WACC of 5.48% allowed by the Regulator for FY 2014/15.
R'm
Allowed Revenue per ROD FY 2015/16 11 109
Latest Estimate Revenue 10 797
Plus: Bilateral Contract revenue 181
Total Latest Estimate Revenue 10 978
Estimated Clawback 131
50% Clawback Adjustment in FY 2016/17 66
Clawback FY 2014/15 (707)
Return on Clawback FY 2014/15 (39)
Estimate Clawback FY 2015/16 66
Net Clawback FY 2016/17 (680)
50% Clawback Adjustment in FY 2017/18 66
Clawback Adjustment for FY 2015/16 in FY2017/18 due to the Authority
Estimate Clawback
Total Clawback due to customers FY2015/16
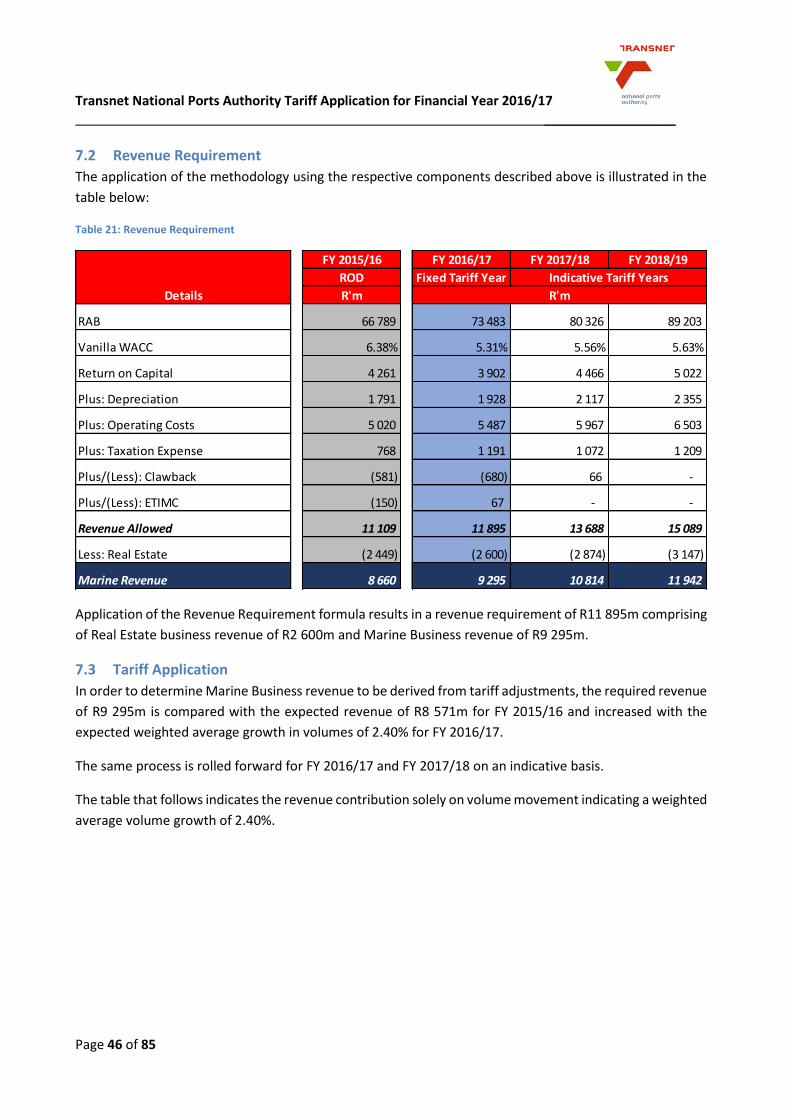
Transnet National Ports Authority Tariff Application for Financial Year 2016/17 __________________
Page 46 of 85
7.2 Revenue Requirement
The application of the methodology using the respective components described above is illustrated in the
table below:
Table 21: Revenue Requirement
Application of the Revenue Requirement formula results in a revenue requirement of R11 895m comprising
of Real Estate business revenue of R2 600m and Marine Business revenue of R9 295m.
7.3 Tariff Application
In order to determine Marine Business revenue to be derived from tariff adjustments, the required revenue
of R9 295m is compared with the expected revenue of R8 571m for FY 2015/16 and increased with the
expected weighted average growth in volumes of 2.40% for FY 2016/17.
The same process is rolled forward for FY 2016/17 and FY 2017/18 on an indicative basis.
The table that follows indicates the revenue contribution solely on volume movement indicating a weighted
average volume growth of 2.40%.
FY 2015/16 FY 2016/17 FY 2017/18 FY 2018/19
ROD Fixed Tariff Year
R'm
RAB 66 789 73 483 80 326 89 203
Vanilla WACC 6.38% 5.31% 5.56% 5.63%
Return on Capital 4 261 3 902 4 466 5 022
Plus: Depreciation 1 791 1 928 2 117 2 355
Plus: Operating Costs 5 020 5 487 5 967 6 503
Plus: Taxation Expense 768 1 191 1 072 1 209
Plus/(Less): Clawback (581) (680) 66 -
Plus/(Less): ETIMC (150) 67 - -
Revenue Allowed 11 109 11 895 13 688 15 089
Less: Real Estate (2 449) (2 600) (2 874) (3 147)
Marine Revenue 8 660 9 295 10 814 11 942
Details
Indicative Tariff Years
R'm

Transnet National Ports Authority Tariff Application for Financial Year 2016/17 __________________
Page 47 of 85
Table 22: Revenues related to volume growth (FY 2016/17)
FY 2015/16 FY 2015/16 FY 2015/16 FY 2016/17
Volumes : Latest
Estimate
Revenue : Tariff
Book Latest
Estimate
R million
Volumes :
Increase Budget
Revenue :
Volume increase
before Tariff
Increase Budget
R million
Containers TEU's
Deepsea Full: Imports 1 435 055 2 937 49 026 100
Deepsea Full: Exports 1 194 146 804 40 612 27
Transhipment 1 163 635 73 77 507 5
Other 1 111 777 56 38 059 2
Total Container (TEUs) 4 904 613 3 870 205 205 135
Vehicles (Units)
Vehicles: Imports 391 443 482 17 807 (15)
Vehicles: Exports 252 051 99 11 781 4
Other 6 728 0 363 0
Total Ro-Ro ( Units) 650 222 582 29 951 (12)
Breakbulk (Metric Tons)
Breakbulk: Imports 2 454 546 104 (2 313) (1)
Breakbulk: Exports 6 037 746 177 471 495 11
Other 88 495 1 (54 713) -
Total Breakbulk (Tons) 8 580 787 282 414 468 10
Dry Bulk (Metric Tons)
Coal Exports 77 040 000 260 3 958 000 13
Iron Ore Exports 60 500 000 508 - -
Manganese Ore Exports 10 200 000 86 100 000 1
Other 23 529 419 330 4 725 584 42
Total Dry Bulk (Tons) 171 269 419 1 184 8 783 583 56
Liquid Bulk (Kl)
Petroleum 33 357 603 419 1 182 811 15
Chemicals 2 226 465 112 30 391 1
Other 1 191 060 59 (3 679) 0
Total Liquid Bulk (Kilo litres) 36 775 128 591 1 209 523 17
Cargo Dues Revenue 6 508 206
Details
FY 2015/16 FY 2016/17 FY 2016/17 FY 2016/17
Revenue Latest
Estimate
R million
Weighted
Average
Revenue %
Revenue:
Volume Increase
R million
Revenue: Before
Tariff Increase
R million
Containers 3 870 3.5% 135 4 004
Automotive 582 -2.0% (12) 570
Break Bulk 282 3.7% 10 292
Dry Bulk 1 184 4.7% 56 1 240
Liquid Bulk 591 2.8% 17 607
TOTAL CARGO DUES AFTER REBATE 6 508 3.2% 206 6 713
Marine & other revenue 2 063 0.0% (1) 2 062
TOTAL TARIFF BOOK REVENUE 8 571 2.4% 205 8 775
Real estate revenue 2 407 8.0% 193 2 600
TOTAL REVENUE 10 978 3.6% 398 11 375
Details
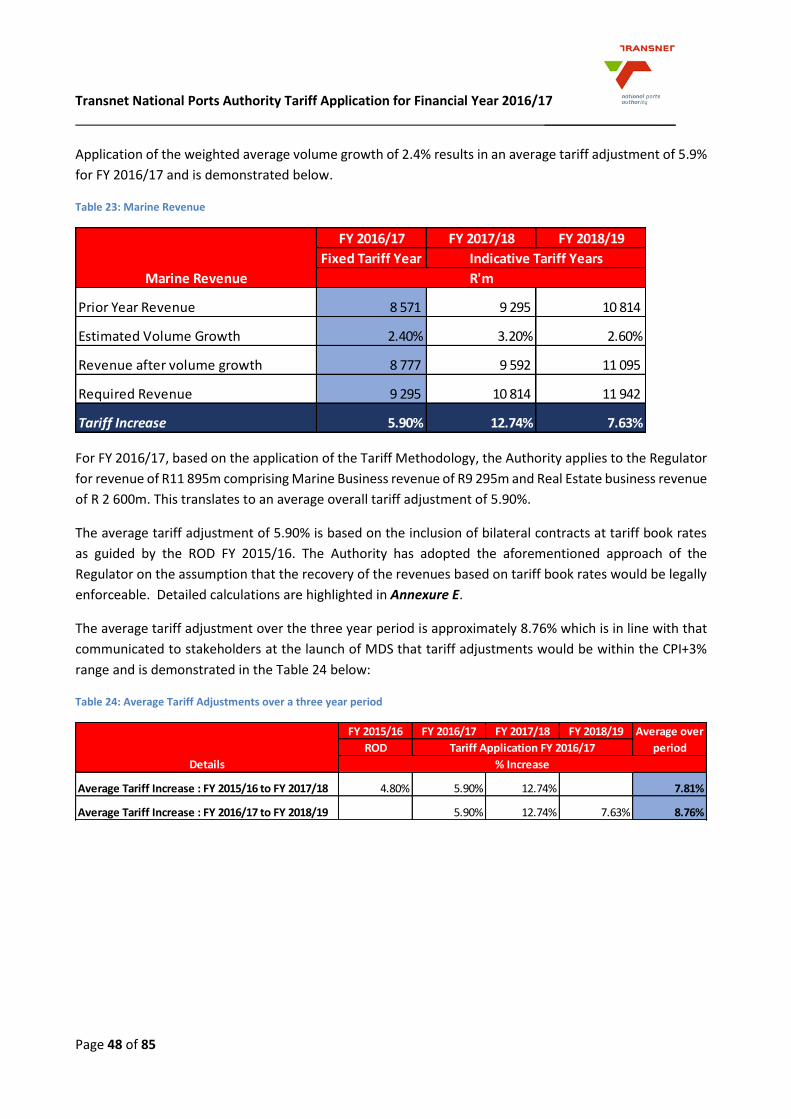
Transnet National Ports Authority Tariff Application for Financial Year 2016/17 __________________
Page 48 of 85
Application of the weighted average volume growth of 2.4% results in an average tariff adjustment of 5.9%
for FY 2016/17 and is demonstrated below.
Table 23: Marine Revenue
For FY 2016/17, based on the application of the Tariff Methodology, the Authority applies to the Regulator
for revenue of R11 895m comprising Marine Business revenue of R9 295m and Real Estate business revenue
of R 2 600m. This translates to an average overall tariff adjustment of 5.90%.
The average tariff adjustment of 5.90% is based on the inclusion of bilateral contracts at tariff book rates
as guided by the ROD FY 2015/16. The Authority has adopted the aforementioned approach of the
Regulator on the assumption that the recovery of the revenues based on tariff book rates would be legally
enforceable. Detailed calculations are highlighted in Annexure E.
The average tariff adjustment over the three year period is approximately 8.76% which is in line with that
communicated to stakeholders at the launch of MDS that tariff adjustments would be within the CPI+3%
range and is demonstrated in the Table 24 below:
Table 24: Average Tariff Adjustments over a three year period
FY 2016/17 FY 2017/18 FY 2018/19
Fixed Tariff Year
Prior Year Revenue 8 571 9 295 10 814
Estimated Volume Growth 2.40% 3.20% 2.60%
Revenue after volume growth 8 777 9 592 11 095
Required Revenue 9 295 10 814 11 942
Tariff Increase 5.90% 12.74% 7.63%
Marine Revenue
Indicative Tariff Years
R'm
FY 2015/16 FY 2016/17 FY 2017/18 FY 2018/19
ROD
Average Tariff Increase : FY 2015/16 to FY 2017/18 4.80% 5.90% 12.74% 7.81%
Average Tariff Increase : FY 2016/17 to FY 2018/19 5.90% 12.74% 7.63% 8.76%
Details % Increase
Average over
periodTariff Application FY 2016/17
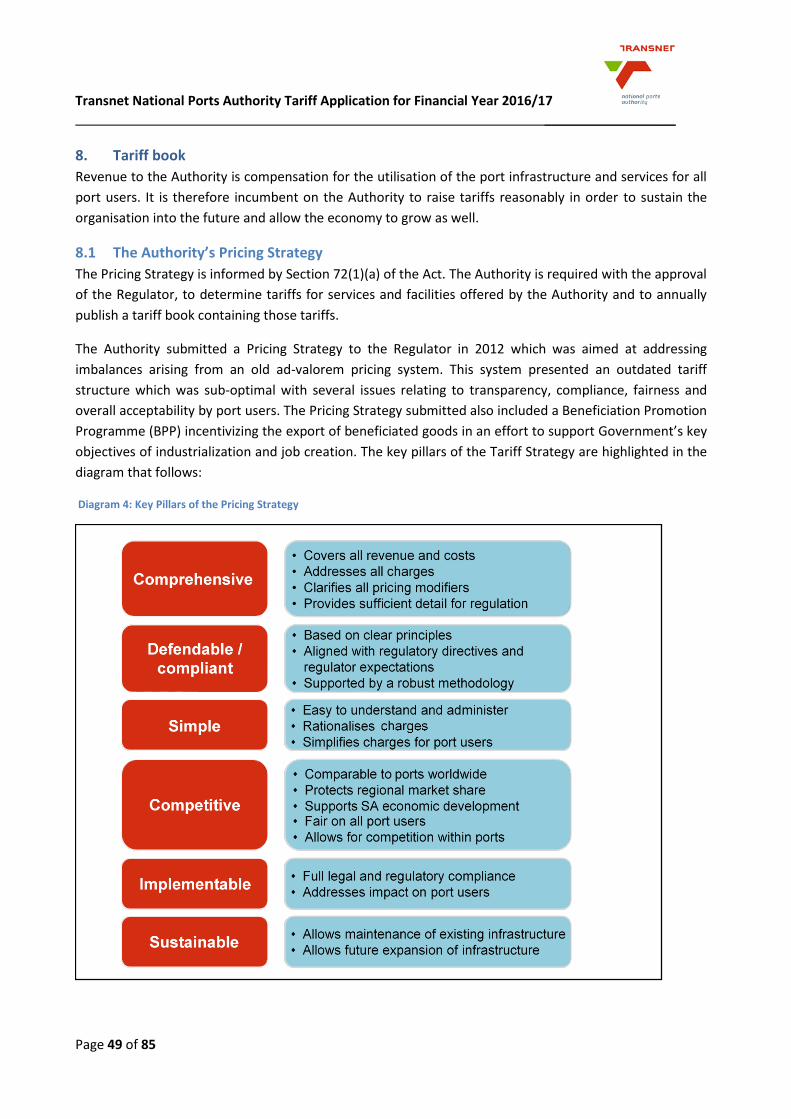
Transnet National Ports Authority Tariff Application for Financial Year 2016/17 __________________
Page 49 of 85
8. Tariff book
Revenue to the Authority is compensation for the utilisation of the port infrastructure and services for all
port users. It is therefore incumbent on the Authority to raise tariffs reasonably in order to sustain the
organisation into the future and allow the economy to grow as well.
8.1 The Authority’s Pricing Strategy
The Pricing Strategy is informed by Section 72(1)(a) of the Act. The Authority is required with the approval
of the Regulator, to determine tariffs for services and facilities offered by the Authority and to annually
publish a tariff book containing those tariffs.
The Authority submitted a Pricing Strategy to the Regulator in 2012 which was aimed at addressing
imbalances arising from an old ad-valorem pricing system. This system presented an outdated tariff
structure which was sub-optimal with several issues relating to transparency, compliance, fairness and
overall acceptability by port users. The Pricing Strategy submitted also included a Beneficiation Promotion
Programme (BPP) incentivizing the export of beneficiated goods in an effort to support Government’s key
objectives of industrialization and job creation. The key pillars of the Tariff Strategy are highlighted in the
diagram that follows:
Diagram 4: Key Pillars of the Pricing Strategy
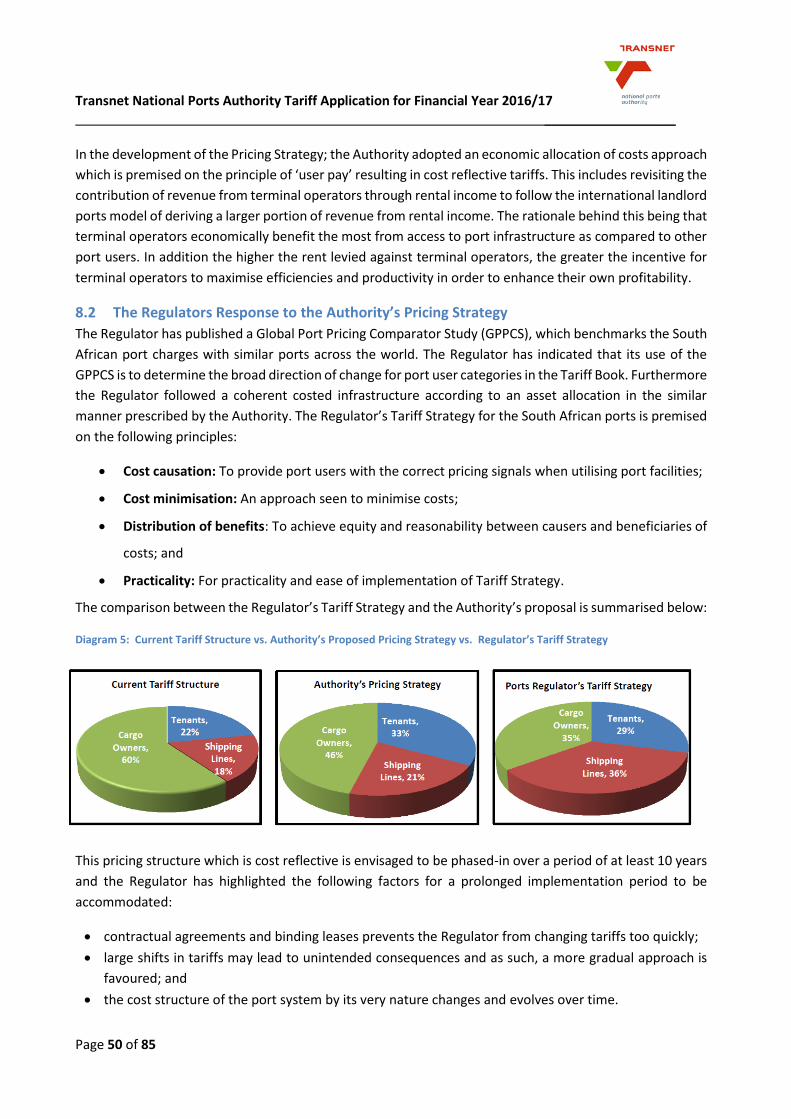
Transnet National Ports Authority Tariff Application for Financial Year 2016/17 __________________
Page 50 of 85
In the development of the Pricing Strategy; the Authority adopted an economic allocation of costs approach
which is premised on the principle of ‘user pay’ resulting in cost reflective tariffs. This includes revisiting the
contribution of revenue from terminal operators through rental income to follow the international landlord
ports model of deriving a larger portion of revenue from rental income. The rationale behind this being that
terminal operators economically benefit the most from access to port infrastructure as compared to other
port users. In addition the higher the rent levied against terminal operators, the greater the incentive for
terminal operators to maximise efficiencies and productivity in order to enhance their own profitability.
8.2 The Regulators Response to the Authority’s Pricing Strategy
The Regulator has published a Global Port Pricing Comparator Study (GPPCS), which benchmarks the South
African port charges with similar ports across the world. The Regulator has indicated that its use of the
GPPCS is to determine the broad direction of change for port user categories in the Tariff Book. Furthermore
the Regulator followed a coherent costed infrastructure according to an asset allocation in the similar
manner prescribed by the Authority. The Regulator’s Tariff Strategy for the South African ports is premised
on the following principles:
Cost causation: To provide port users with the correct pricing signals when utilising port facilities;
Cost minimisation: An approach seen to minimise costs;
Distribution of benefits: To achieve equity and reasonability between causers and beneficiaries of
costs; and
Practicality: For practicality and ease of implementation of Tariff Strategy.
The comparison between the Regulator’s Tariff Strategy and the Authority’s proposal is summarised below:
Diagram 5: Current Tariff Structure vs. Authority’s Proposed Pricing Strategy vs. Regulator’s Tariff Strategy
This pricing structure which is cost reflective is envisaged to be phased-in over a period of at least 10 years
and the Regulator has highlighted the following factors for a prolonged implementation period to be
accommodated:
contractual agreements and binding leases prevents the Regulator from changing tariffs too quickly;
large shifts in tariffs may lead to unintended consequences and as such, a more gradual approach is
favoured; and
the cost structure of the port system by its very nature changes and evolves over time.
Transnet National Ports Authority Tariff Application for Financial Year 2016/17 __________________
Page 51 of 85
The phased approach as envisaged by the Regulator will lead to the following tariff increase over the
envisaged 10 year period:
Cargo Owners: 5.2% real price decrease on an annual basis;
Shipping Lines: 7.2% real price increase on an annual basis; and
Tenants: 2.8% real increase on lease revenue on an annual basis.
It is envisaged that this proposal will result in steep reduction in the contribution of Containers and Automotives cargo category to the overall Revenue Requirement and slightly higher increases to Dry and Break bulk categories with immaterial changes to liquid bulk category.
8.3 Tariff Book Proposal for FY 2016/17
With reference to the Tariff Strategy, the Authority will continue with the exercise of tariff rebalancing to
fairly allocate costs to all port user groups as it has done in the previous tariff cycles. This includes
reductions to container and Ro-Ro’s tariffs and slightly higher increases in Bulk categories. The Marine tariff
charges (i.e. recoverable from shipping lines) will receive a higher tariff in line with the Tariff Strategy.
Furthermore the Authority would still re-iterate its support of Government’s economic objectives of
differentiation between export and import tariffs to ensure the development of the industrial sector with
a specific focus on value adding activities. The Regulator has acknowledged the BPP included in the Pricing
Strategy proposal and its objectives to enhance the competitiveness of the country’s goods and services.
The BPP has generally received support; in particular from the Department of Trade & Industry. As part of
the Tariff Strategy, the Regulator has mapped out a plan where it will consider the BPP into ports pricing
through consultation with stakeholders. The Regulator has already completed the first phase of
consultations in roadshows and workshops with stakeholders and decisions on implementation as well as
other phases of consultations will be made soon.
These initiatives will increasingly receive attention in the tariff cycles to come as the Tariff Strategy is
implemented.
The proposed Tariff Strategy coincides with an economic environment that is experiencing subdued growth
and therefore needs to consider these peculiar aspects of the South African economy:
the South African economy is heavily reliant on exports of minerals and as a result dependent on the
economic performance (growth) of major trading partners;
slower economic growth in comparison to the major trading partners like China and India;
major export partners including Germany and America growing at much lower rates; and
other perceptions of risk in emerging markets leading to fluctuations of currencies, risk of capital
outflows, rising interest rates and fuel prices etc. (such as China & Greece).
In line with the above and the need to promote the productive use of port infrastructure and efficiency, the
Authority proposes differentiated tariffs as follows:
6.80% on marine charges (shipping lines);
5.90% on exports of dry bulk (coal, iron ore & manganese); and
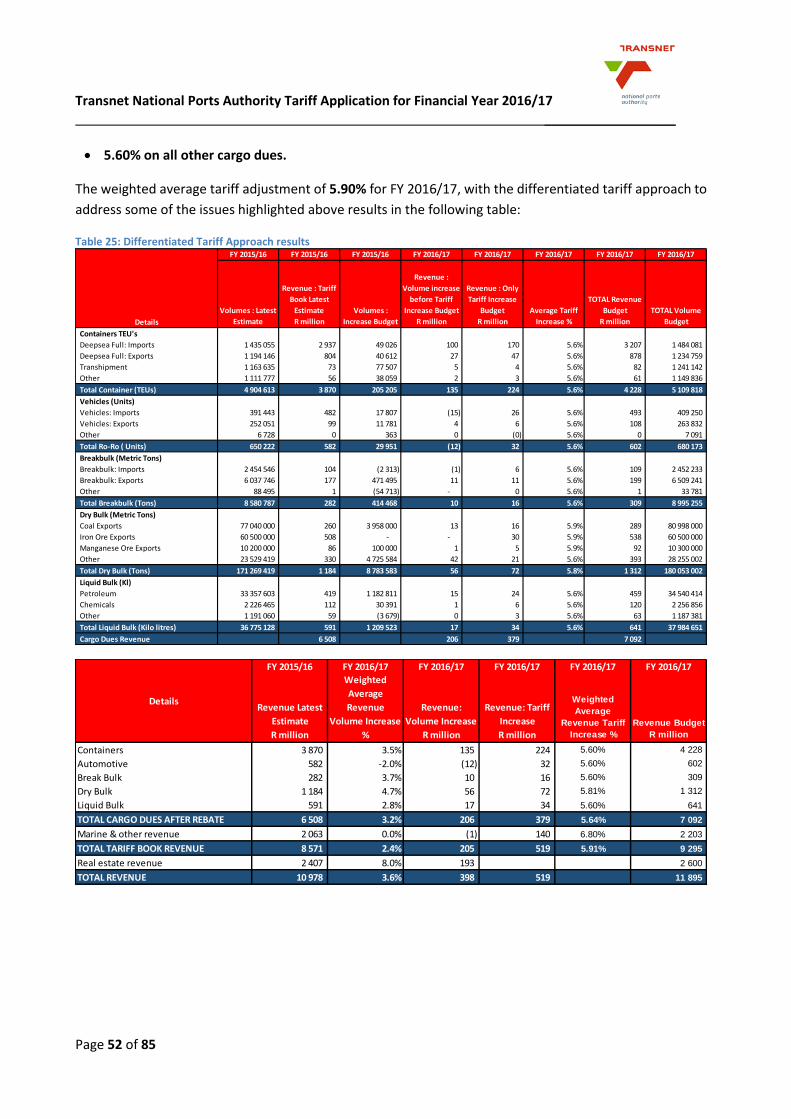
Transnet National Ports Authority Tariff Application for Financial Year 2016/17 __________________
Page 52 of 85
5.60% on all other cargo dues.
The weighted average tariff adjustment of 5.90% for FY 2016/17, with the differentiated tariff approach to
address some of the issues highlighted above results in the following table:
Table 25: Differentiated Tariff Approach results
FY 2015/16 FY 2015/16 FY 2015/16 FY 2016/17 FY 2016/17 FY 2016/17 FY 2016/17 FY 2016/17
Volumes : Latest
Estimate
Revenue : Tariff
Book Latest
Estimate
R million
Volumes :
Increase Budget
Revenue :
Volume increase
before Tariff
Increase Budget
R million
Revenue : Only
Tariff Increase
Budget
R million
Average Tariff
Increase %
TOTAL Revenue
Budget
R million
TOTAL Volume
Budget
Containers TEU's
Deepsea Full: Imports 1 435 055 2 937 49 026 100 170 5.6% 3 207 1 484 081
Deepsea Full: Exports 1 194 146 804 40 612 27 47 5.6% 878 1 234 759
Transhipment 1 163 635 73 77 507 5 4 5.6% 82 1 241 142
Other 1 111 777 56 38 059 2 3 5.6% 61 1 149 836
Total Container (TEUs) 4 904 613 3 870 205 205 135 224 5.6% 4 228 5 109 818
Vehicles (Units)
Vehicles: Imports 391 443 482 17 807 (15) 26 5.6% 493 409 250
Vehicles: Exports 252 051 99 11 781 4 6 5.6% 108 263 832
Other 6 728 0 363 0 (0) 5.6% 0 7 091
Total Ro-Ro ( Units) 650 222 582 29 951 (12) 32 5.6% 602 680 173
Breakbulk (Metric Tons)
Breakbulk: Imports 2 454 546 104 (2 313) (1) 6 5.6% 109 2 452 233
Breakbulk: Exports 6 037 746 177 471 495 11 11 5.6% 199 6 509 241
Other 88 495 1 (54 713) - 0 5.6% 1 33 781
Total Breakbulk (Tons) 8 580 787 282 414 468 10 16 5.6% 309 8 995 255
Dry Bulk (Metric Tons)
Coal Exports 77 040 000 260 3 958 000 13 16 5.9% 289 80 998 000
Iron Ore Exports 60 500 000 508 - - 30 5.9% 538 60 500 000
Manganese Ore Exports 10 200 000 86 100 000 1 5 5.9% 92 10 300 000
Other 23 529 419 330 4 725 584 42 21 5.6% 393 28 255 002
Total Dry Bulk (Tons) 171 269 419 1 184 8 783 583 56 72 5.8% 1 312 180 053 002
Liquid Bulk (Kl)
Petroleum 33 357 603 419 1 182 811 15 24 5.6% 459 34 540 414
Chemicals 2 226 465 112 30 391 1 6 5.6% 120 2 256 856
Other 1 191 060 59 (3 679) 0 3 5.6% 63 1 187 381
Total Liquid Bulk (Kilo litres) 36 775 128 591 1 209 523 17 34 5.6% 641 37 984 651
Cargo Dues Revenue 6 508 206 379 7 092
Details
FY 2015/16 FY 2016/17 FY 2016/17 FY 2016/17 FY 2016/17 FY 2016/17
Revenue Latest
Estimate
R million
Weighted
Average
Revenue
Volume Increase
%
Revenue:
Volume Increase
R million
Revenue: Tariff
Increase
R million
Weighted
Average
Revenue Tariff
Increase %
Revenue Budget
R million
Containers 3 870 3.5% 135 224 5.60% 4 228
Automotive 582 -2.0% (12) 32 5.60% 602
Break Bulk 282 3.7% 10 16 5.60% 309
Dry Bulk 1 184 4.7% 56 72 5.81% 1 312
Liquid Bulk 591 2.8% 17 34 5.60% 641
TOTAL CARGO DUES AFTER REBATE 6 508 3.2% 206 379 5.64% 7 092
Marine & other revenue 2 063 0.0% (1) 140 6.80% 2 203
TOTAL TARIFF BOOK REVENUE 8 571 2.4% 205 519 5.91% 9 295
Real estate revenue 2 407 8.0% 193 2 600
TOTAL REVENUE 10 978 3.6% 398 519 11 895
Details
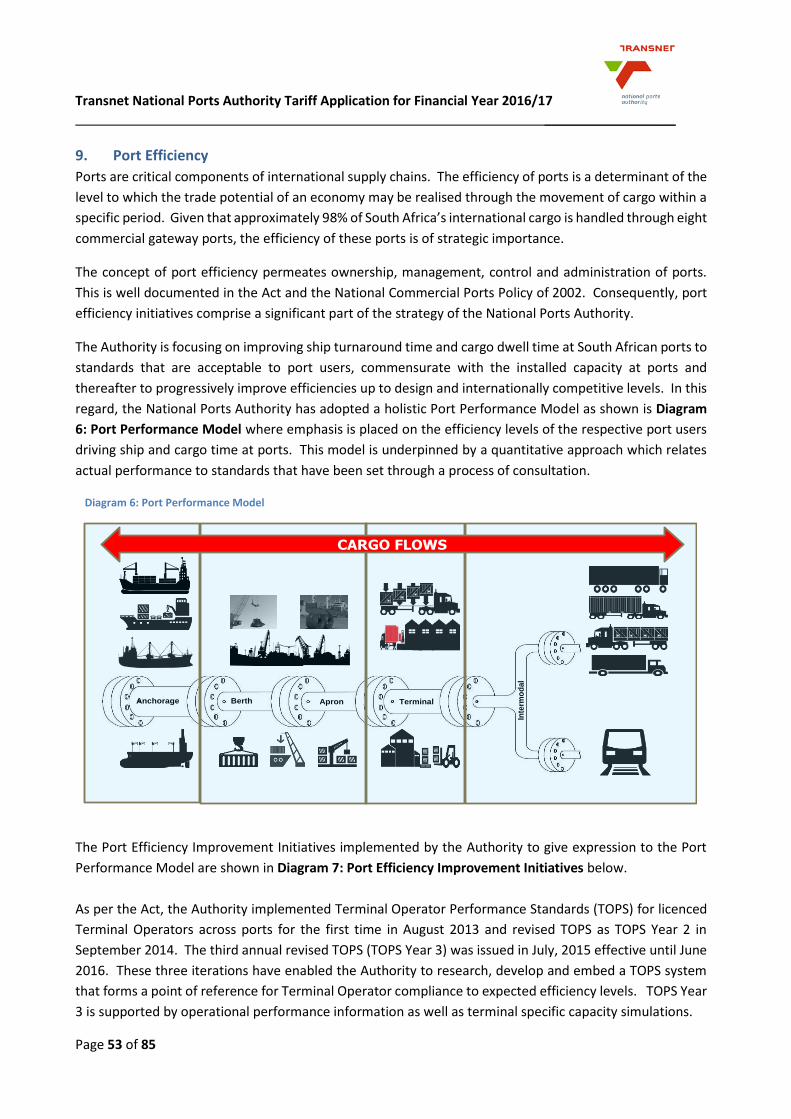
Transnet National Ports Authority Tariff Application for Financial Year 2016/17 __________________
Page 53 of 85
9. Port Efficiency
Ports are critical components of international supply chains. The efficiency of ports is a determinant of the
level to which the trade potential of an economy may be realised through the movement of cargo within a
specific period. Given that approximately 98% of South Africa’s international cargo is handled through eight
commercial gateway ports, the efficiency of these ports is of strategic importance.
The concept of port efficiency permeates ownership, management, control and administration of ports.
This is well documented in the Act and the National Commercial Ports Policy of 2002. Consequently, port
efficiency initiatives comprise a significant part of the strategy of the National Ports Authority.
The Authority is focusing on improving ship turnaround time and cargo dwell time at South African ports to
standards that are acceptable to port users, commensurate with the installed capacity at ports and
thereafter to progressively improve efficiencies up to design and internationally competitive levels. In this
regard, the National Ports Authority has adopted a holistic Port Performance Model as shown is Diagram
6: Port Performance Model where emphasis is placed on the efficiency levels of the respective port users
driving ship and cargo time at ports. This model is underpinned by a quantitative approach which relates
actual performance to standards that have been set through a process of consultation.
Diagram 6: Port Performance Model
The Port Efficiency Improvement Initiatives implemented by the Authority to give expression to the Port
Performance Model are shown in Diagram 7: Port Efficiency Improvement Initiatives below.
As per the Act, the Authority implemented Terminal Operator Performance Standards (TOPS) for licenced
Terminal Operators across ports for the first time in August 2013 and revised TOPS as TOPS Year 2 in
September 2014. The third annual revised TOPS (TOPS Year 3) was issued in July, 2015 effective until June
2016. These three iterations have enabled the Authority to research, develop and embed a TOPS system
that forms a point of reference for Terminal Operator compliance to expected efficiency levels. TOPS Year
3 is supported by operational performance information as well as terminal specific capacity simulations.
Anchorage Apron TerminalBerth
Inte
rmo
da
l
CARGO FLOWS
Transnet National Ports Authority Tariff Application for Financial Year 2016/17 __________________
Page 54 of 85
TOPS is underpinned by consultation with a wide spectrum of port users and stakeholders. Consultation on
the setting of TOPS receives specific attention by a TOPS Sub Committee of each PCC.
TOPS is at a point of readiness for the Authority to commence engagements with Terminal Operators and
port users on the TOPS Penalty for repeated non-compliance to performance standards as envisaged in the
Terminal Operator Licence as well as the attribution of efficiency improvements above performance
standard levels for possible use in the Tariff Model.
The Authority has given regard to the role by other port users towards ship turnaround time in the Port
Performance Model. The first instance of Marine Operator Performance Standards (MOPS) has been
implemented for the Authority’s Marine Services and Shipping Lines along with a marine slot booking
system at each port. This will enable efficiency and service level monitoring of waterside operations against
a structured booking schedule, isolate marine related delays and effect improvements. The Authority has
commenced with development of initiatives informed by similar principles for rail operations as Rail
Operator Performance Standards (ROPS). The Authority has commenced with the development of Haulier
– (Road) Operations Performance Standards (HOPS) with the implementation of a control system for the
Truck Staging Area at the Port of Richards Bay and a pilot HOPS project for road traffic at the Port of Durban.
The ROPS and HOPS initiatives will progress during FY 2015/16.
The institutional capacity of the Authority to ensure that port efficiency oversight is achieved at the correct
levels is being improved through the establishment of an Operations Department led by a Senior Operations
Manager per port (per port precinct in Durban) to concentrate on creating the necessary environment for
port users to achieve the expected levels of port performance.
The Authority is in the process of implementing the modules of a “Smart Port” in order to improve
information exchange between the Authority and port users. The Integrated Port Management System
(IPMS) implemented and piloted at the Port of Durban in July 2015 supports a range of information tools
and port user interfaces which will provide the strategic technology base towards the realisation of a “Smart
Port”. The Authority is at an advanced stage in the implementation of Port Operations Centres at all Ports
and Head Office. Construction of Port Operations Centres has been completed in 5 ports and the process
of resourcing is underway. Port Operations Centres will provide a holistic view of the ports supply chain
through the strategic technology base mentioned above in order to monitor port performance, identify
constraints and effect corrective action timeously. Port Operations Centres will be evolved into Joint
Operations Centres in a phased manner allowing key port users to jointly plan, monitor and control port
operations in order to improve logistics performance.
The development of an operations mindset amongst staff is a training priority which is considered as an
important component of the ability of the Authority to improve port efficiency.

Transnet National Ports Authority Tariff Application for Financial Year 2016/17 __________________
Page 55 of 85
Diagram 7: Port Efficiency Improvement Initiatives
The Authority has made significant progress towards developing institutional capacity and improving
human resource levels to address port efficiency improvement. Port Oversight Committees have been
established per port to administer efficiency improvement initiatives and oversight. Port Oversight
Committees will ensure, amongst others that remedial actions are implemented where performance
standards are not achieved in practice. The establishment of Port Operations Centres which will monitor
the performance of port operations against relevant targets or standards.
The Authority is confident that the above focus will lead to improved capacity utilisation and increased
levels of port efficiency.
9.1 Terminal Operations Licencing Oversight
The Terminal Operating Licence establishes the framework and the conditions that the Authority prescribes
for terminal operators within its respective port precincts.
Some of the key components of the Licence include the Safety, Health and Environmental Management
compliance, Maintenance regime for its assets, as well as the operational performance requirements.
Since the issue of the eighty nine (89) Terminal Operator Licences in July 2012, in terms of Section 57 read
with Section 65 of the Act, a detailed Oversight Regime has been developed and implemented. In terms of
Section 79 of the Act, an additional licence for the Ngqura container terminal was issued resulting in a total
of ninety (90) licences being issued.
Transnet National Ports Authority Tariff Application for Financial Year 2016/17 __________________
Page 56 of 85
Insofar as terminal operational performance is concerned, the various measures for the 90 terminals have
been finalised in conjunction with the Terminal Operators and are being monitored and refined on an
ongoing basis.
10. Marine Operations Management
The Authority is committed to ensuring a seamless marine service is provided to vessels arriving, departing
and shifting within South African ports.
This will include a process of stringent monitoring and measurement of the causative factors, which could
result in ships being delayed due to Pilotage, Tugs or Berthing Services (which are under the direct control
of the Authority). Approved targets have been set for each of the aforementioned categories and are
monitored at various managerial platforms.
10.1.1 Pilotage
Pilotage delays are caused due to pilot license restrictions or the pilot being occupied with other shipping
at the required service time.
In order to reduce the abovementioned type of delay the following initiatives are currently being
implemented:
• On-going focus of ensuring that pilots are qualified to higher license levels (up to open license)
thereby ensuring an appropriate spread of experience across all shifts; and
• On-going proficiency training which will include simulator training as well as in class training
sessions.
The first phase of this capacity development project commenced in the second half of FY 2012/13. The
progress regarding the aforementioned project is highlighted below:
• A total of 16 helicopter pilot trainees obtained formal qualifications in April 2014 and are currently
on experiential on the job training;
• A total of 7 helicopter pilot trainees being recruited in 2015 and will obtain licenses in December
2017
• A total of 6 helicopter maintenance engineering trainees were recruited in January 2013 and are
expected to qualify in December 2017;
• Another 10 helicopter maintenance engineering trainees being recruited in January 2015 and are
expected to qualify in December 2019.
• A total of thirty (39) aviation cadets are currently in training which includes 23 aviation pilots and
16 engineers.
Transnet National Ports Authority Tariff Application for Financial Year 2016/17 __________________
Page 57 of 85
10.1.2 Towage
Tug delays are caused by tugs not being available at the required service time due to mechanical
breakdowns, the tugs being busy with other shipping, or due to a shortage of tug capacity (which includes
manning levels).
In order to reduce the abovementioned types of delays, the following initiatives are currently being
implemented:
The on-going upgrade of the existing marine fleet which includes the delivery of new tugs which
are now operational in the various ports;
In August 2014, the Authority has also contracted the building of 8 x 70 Tonne and 1 x 100 Tonne
bollard pull tugs with a local shipyard in South Africa (SA Shipyards) over a period of 42 months;
These tugs are replacements for Saldanha, Port Elizabeth, Durban and Richards Bay;
On-going focus on the Tug Maintenance regime to ensure maximum availability;
Implementation of the Marine Operational Performance Standards [MOPS] to manage
performance; and
Initiatives to ramp up services in Durban, Richards Bay and Cape Town to ensure sufficient tug
capacity. This means increasing the number of personnel to man the additional craft to be
deployed.
The changes in the regulations namely Merchant Shipping Act, 1951 (Act No. 57 of 1951) - Merchant
Shipping (Safe Manning, Training and Certification) Regulations, 2013 come into force on the 01 January
2017. This means that the qualifications and certificates of competence required by the Authority to man
the tugs, must comply with the regulations. Hence, there is a significant effort by the Authority to ensure
that all the necessary training and development is in place to ensure compliance with SAMSA standards.
10.1.3 Berthing Services
Berthing delays are generally caused due to insufficient berthing teams that are allocated to a berth or not
being available at the required service time due to servicing another vessel.
In order to reduce the abovementioned type of delays, a quad shift system at the ports of Cape Town,
Durban, Saldanha and Richards Bay as well as additional number of personnel per team have been
implemented which will ensure that the berthing services shift patterns are aligned with the pilotage; tug
operations and that of the personnel in the teams are self-relieving (catering for personnel on leave and
training).
Marine Operations will review all marine operational processes, and this includes marine operational
planning, resourcing and fleet replacement strategy. The functional structures are continuously being
monitored to improve efficiency levels. It is expected that this will also ensure that the current number of
shipping delays are reduced, thereby further enhancing the overall efficiency of the ports system.
Efficiencies will be measured in accordance with the Marine Operations Performance Standards and will be
monitored and recorded by the Operations Centres.
Transnet National Ports Authority Tariff Application for Financial Year 2016/17 __________________
Page 58 of 85
11. Conclusion
Investment in infrastructure and growth of the economy are central to the South African Government’s
New Growth Plan and National Development Plan. By expanding port infrastructure, the MDS will have a
marked impact on the economy such as creation of direct and indirect employment, development of skills
and the improvement of port efficiencies resulting in lasting economic, social and environmental value to
South Africa.
The key drivers for the expansion of port infrastructures are highlighted below:
Economic changes. Seaborne trade has increased substantially, in part because of the massive
redistribution of manufacturing to low cost locations and in part because of ongoing economic
growth. This underlines the growing importance of port infrastructure to organize the resulting
complex distribution system.
Technical changes. The growth in ship size to better achieve economies of scale has been a
prevalent technical change. There is also a growing level of ship specialization (containerships, bulk
carriers, car carriers, and even cruise ships) that require dedicated port terminal facilities. All of the
above has been placing pressure on ports to upgrade and improve their facilities.
Organizational changes. The maritime and port industries are influenced by large shipping
companies and terminal operators that have engaged in strategic alliances as well as mergers and
acquisitions. Their goal is to provide a level of vertical and horizontal integration, which is improving
the performance of the port transport chain. This has led to the need of increased expansion in
ports infrastructure and intermodal connectivity.
Whilst the Authority continues with the implementation of the MDS capital programme to ensure port
infrastructure capacity ahead of demand, it remains committed to Governments objective of lowering the
cost of doing business in South Africa. In accordance with this objective, the Authority has considered a
tariff adjustment in line with inflation for FY 2016/17 whilst attempting to smooth the tariff trajectory in
future years.
In accordance with the approved Tariff Methodology issued by the Regulator and based on the Revenue
Requirement formula the Authority hereby applies to the Regulator for revenues of R11 895m comprising
Marine Business revenue of R9 295m and Real Estate business revenue of R2 600m. This translates to an
average overall tariff adjustment of 5.90% and indicative tariff adjustments of 12.74% for FY 2017/18 and
7.63% for FY 2018/193.
3 Whilst the approved tariff methodology is only applicable up to FY 2017/18, the Authority has modelled
FY 2018/19 in order to demonstrate the tariff trajectory over three years.
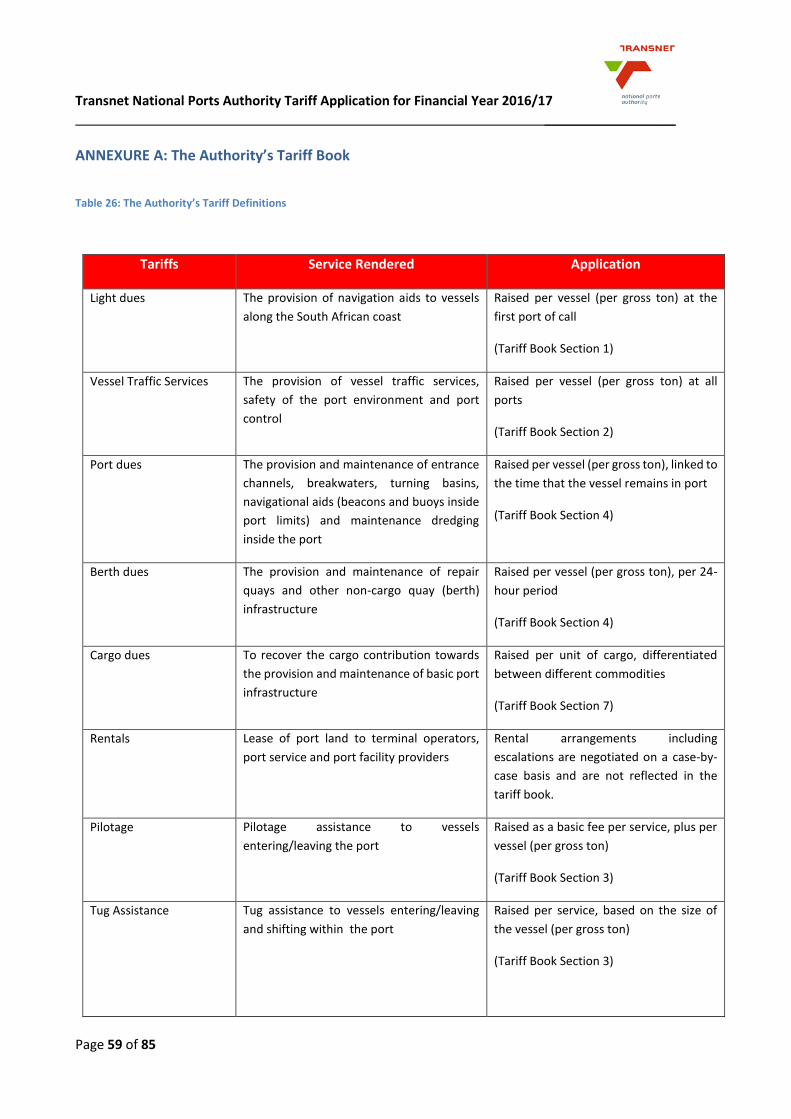
Transnet National Ports Authority Tariff Application for Financial Year 2016/17 __________________
Page 59 of 85
ANNEXURE A: The Authority’s Tariff Book
Table 26: The Authority’s Tariff Definitions
Tariffs Service Rendered Application
Light dues The provision of navigation aids to vessels
along the South African coast
Raised per vessel (per gross ton) at the
first port of call
(Tariff Book Section 1)
Vessel Traffic Services The provision of vessel traffic services,
safety of the port environment and port
control
Raised per vessel (per gross ton) at all
ports
(Tariff Book Section 2)
Port dues The provision and maintenance of entrance
channels, breakwaters, turning basins,
navigational aids (beacons and buoys inside
port limits) and maintenance dredging
inside the port
Raised per vessel (per gross ton), linked to
the time that the vessel remains in port
(Tariff Book Section 4)
Berth dues The provision and maintenance of repair
quays and other non-cargo quay (berth)
infrastructure
Raised per vessel (per gross ton), per 24-
hour period
(Tariff Book Section 4)
Cargo dues To recover the cargo contribution towards
the provision and maintenance of basic port
infrastructure
Raised per unit of cargo, differentiated
between different commodities
(Tariff Book Section 7)
Rentals Lease of port land to terminal operators,
port service and port facility providers
Rental arrangements including
escalations are negotiated on a case-by-
case basis and are not reflected in the
tariff book.
Pilotage Pilotage assistance to vessels
entering/leaving the port
Raised as a basic fee per service, plus per
vessel (per gross ton)
(Tariff Book Section 3)
Tug Assistance Tug assistance to vessels entering/leaving
and shifting within the port
Raised per service, based on the size of
the vessel (per gross ton)
(Tariff Book Section 3)
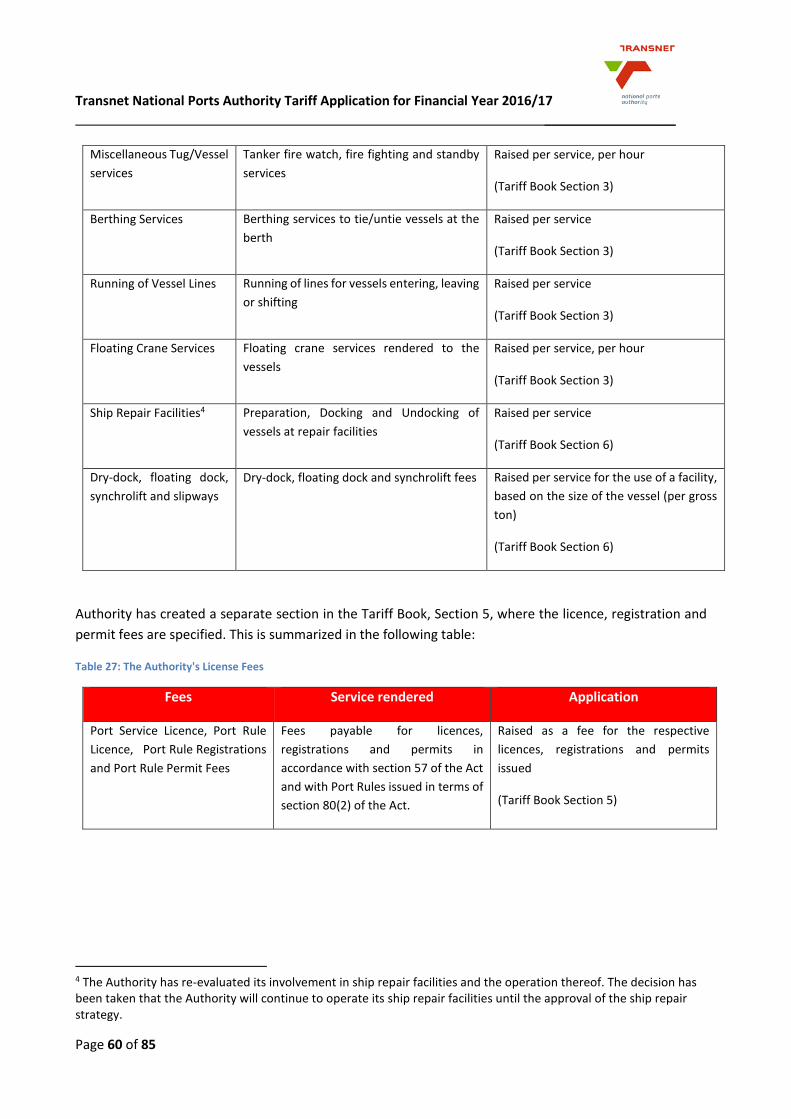
Transnet National Ports Authority Tariff Application for Financial Year 2016/17 __________________
Page 60 of 85
Authority has created a separate section in the Tariff Book, Section 5, where the licence, registration and
permit fees are specified. This is summarized in the following table:
Table 27: The Authority's License Fees
Fees Service rendered Application
Port Service Licence, Port Rule
Licence, Port Rule Registrations
and Port Rule Permit Fees
Fees payable for licences,
registrations and permits in
accordance with section 57 of the Act
and with Port Rules issued in terms of
section 80(2) of the Act.
Raised as a fee for the respective
licences, registrations and permits
issued
(Tariff Book Section 5)
4 The Authority has re-evaluated its involvement in ship repair facilities and the operation thereof. The decision has been taken that the Authority will continue to operate its ship repair facilities until the approval of the ship repair strategy.
Miscellaneous Tug/Vessel
services
Tanker fire watch, fire fighting and standby
services
Raised per service, per hour
(Tariff Book Section 3)
Berthing Services Berthing services to tie/untie vessels at the
berth
Raised per service
(Tariff Book Section 3)
Running of Vessel Lines Running of lines for vessels entering, leaving
or shifting
Raised per service
(Tariff Book Section 3)
Floating Crane Services Floating crane services rendered to the
vessels
Raised per service, per hour
(Tariff Book Section 3)
Ship Repair Facilities4 Preparation, Docking and Undocking of
vessels at repair facilities
Raised per service
(Tariff Book Section 6)
Dry-dock, floating dock,
synchrolift and slipways
Dry-dock, floating dock and synchrolift fees Raised per service for the use of a facility,
based on the size of the vessel (per gross
ton)
(Tariff Book Section 6)
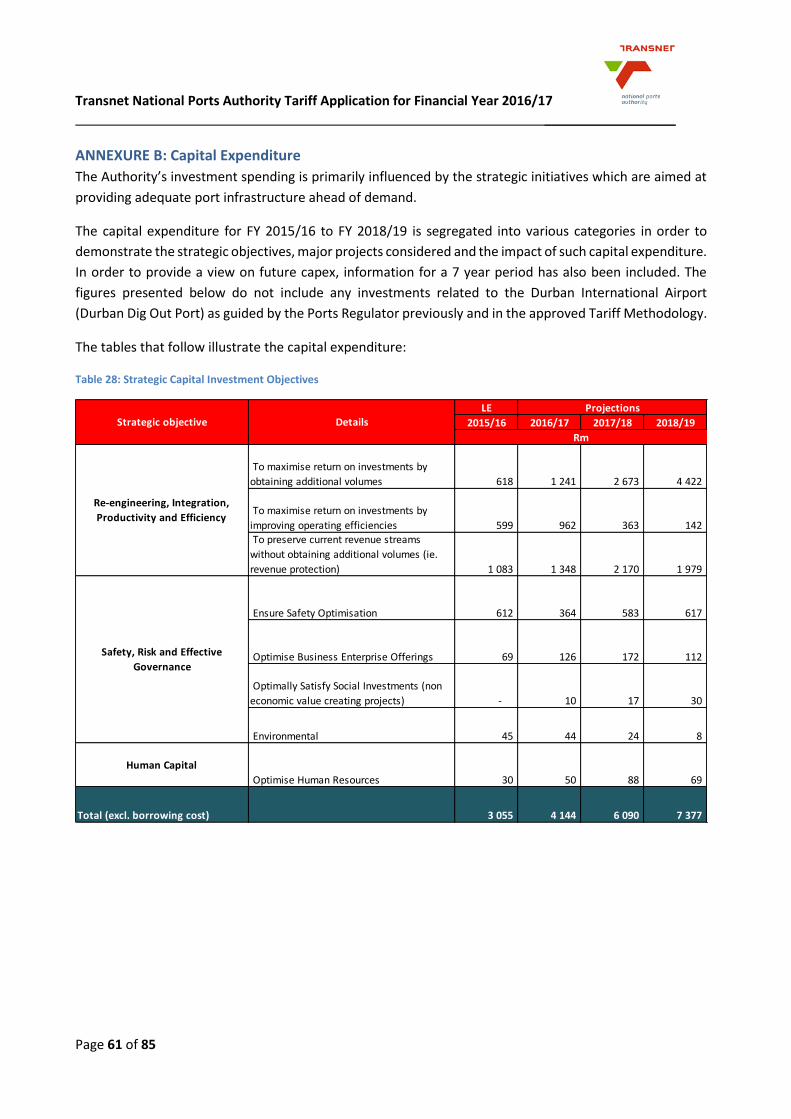
Transnet National Ports Authority Tariff Application for Financial Year 2016/17 __________________
Page 61 of 85
ANNEXURE B: Capital Expenditure
The Authority’s investment spending is primarily influenced by the strategic initiatives which are aimed at
providing adequate port infrastructure ahead of demand.
The capital expenditure for FY 2015/16 to FY 2018/19 is segregated into various categories in order to
demonstrate the strategic objectives, major projects considered and the impact of such capital expenditure.
In order to provide a view on future capex, information for a 7 year period has also been included. The
figures presented below do not include any investments related to the Durban International Airport
(Durban Dig Out Port) as guided by the Ports Regulator previously and in the approved Tariff Methodology.
The tables that follow illustrate the capital expenditure:
Table 28: Strategic Capital Investment Objectives
LE
2015/16 2016/17 2017/18 2018/19
To maximise return on investments by
obtaining additional volumes 618 1 241 2 673 4 422
To maximise return on investments by
improving operating efficiencies 599 962 363 142 To preserve current revenue streams
without obtaining additional volumes (ie.
revenue protection) 1 083 1 348 2 170 1 979
Ensure Safety Optimisation 612 364 583 617
Optimise Business Enterprise Offerings 69 126 172 112
Optimally Satisfy Social Investments (non
economic value creating projects) - 10 17 30
Environmental 45 44 24 8
Human Capital
Optimise Human Resources 30 50 88 69
Total (excl. borrowing cost) 3 055 4 144 6 090 7 377
Safety, Risk and Effective
Governance
Re-engineering, Integration,
Productivity and Efficiency
Strategic objective DetailsProjections
Rm
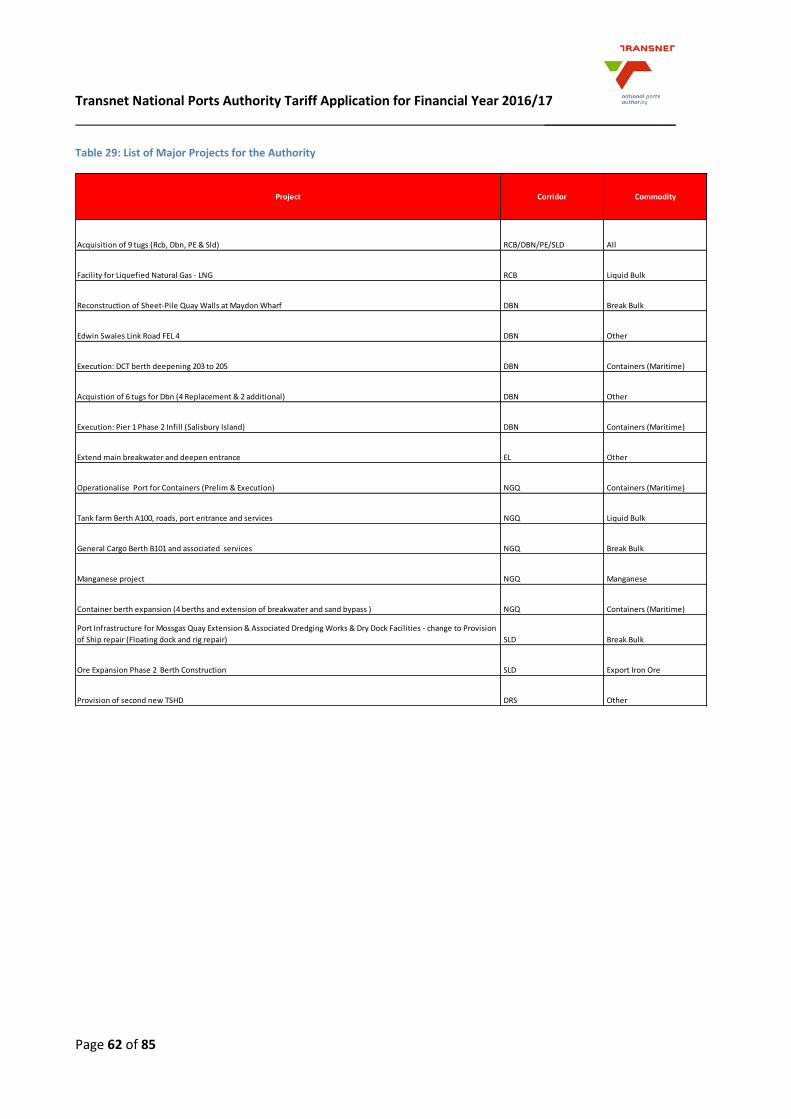
Transnet National Ports Authority Tariff Application for Financial Year 2016/17 __________________
Page 62 of 85
Table 29: List of Major Projects for the Authority
Acquisition of 9 tugs (Rcb, Dbn, PE & Sld) RCB/DBN/PE/SLD All
Facility for Liquefied Natural Gas - LNG RCB Liquid Bulk
Reconstruction of Sheet-Pile Quay Walls at Maydon Wharf DBN Break Bulk
Edwin Swales Link Road FEL 4 DBN Other
Execution: DCT berth deepening 203 to 205 DBN Containers (Maritime)
Acquistion of 6 tugs for Dbn (4 Replacement & 2 additional) DBN Other
Execution: Pier 1 Phase 2 Infill (Salisbury Island) DBN Containers (Maritime)
Extend main breakwater and deepen entrance EL Other
Operationalise Port for Containers (Prelim & Execution) NGQ Containers (Maritime)
Tank farm Berth A100, roads, port entrance and services NGQ Liquid Bulk
General Cargo Berth B101 and associated services NGQ Break Bulk
Manganese project NGQ Manganese
Container berth expansion (4 berths and extension of breakwater and sand bypass ) NGQ Containers (Maritime)
Port Infrastructure for Mossgas Quay Extension & Associated Dredging Works & Dry Dock Facilities - change to Provision
of Ship repair (Floating dock and rig repair) SLD Break Bulk
Ore Expansion Phase 2 Berth Construction SLD Export Iron Ore
Provision of second new TSHD DRS Other
Project Corridor Commodity
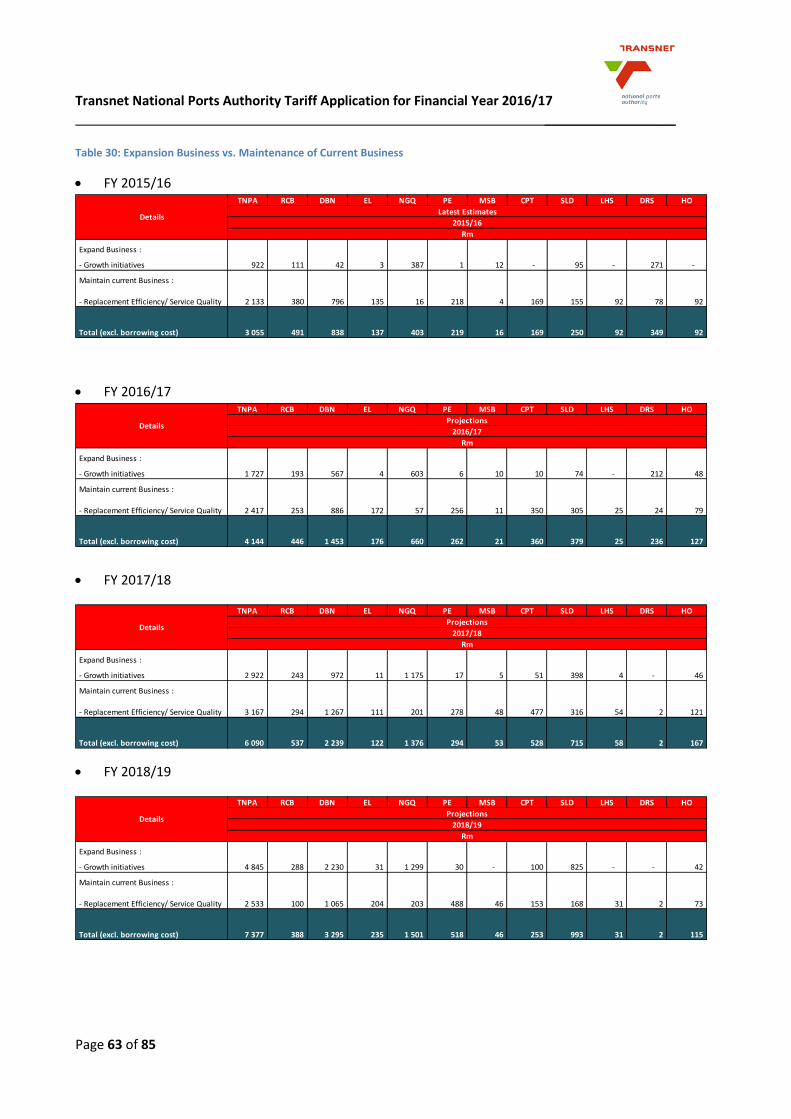
Transnet National Ports Authority Tariff Application for Financial Year 2016/17 __________________
Page 63 of 85
Table 30: Expansion Business vs. Maintenance of Current Business
FY 2015/16
FY 2016/17
FY 2017/18
FY 2018/19
TNPA RCB DBN EL NGQ PE MSB CPT SLD LHS DRS HO
Expand Business :
- Growth initiatives 922 111 42 3 387 1 12 - 95 - 271 -
Maintain current Business :
- Replacement Efficiency/ Service Quality 2 133 380 796 135 16 218 4 169 155 92 78 92
Total (excl. borrowing cost) 3 055 491 838 137 403 219 16 169 250 92 349 92
DetailsLatest Estimates
2015/16
Rm
TNPA RCB DBN EL NGQ PE MSB CPT SLD LHS DRS HO
Expand Business :
- Growth initiatives 1 727 193 567 4 603 6 10 10 74 - 212 48
Maintain current Business :
- Replacement Efficiency/ Service Quality 2 417 253 886 172 57 256 11 350 305 25 24 79
Total (excl. borrowing cost) 4 144 446 1 453 176 660 262 21 360 379 25 236 127
Projections
2016/17
Rm
Details
TNPA RCB DBN EL NGQ PE MSB CPT SLD LHS DRS HO
Expand Business :
- Growth initiatives 2 922 243 972 11 1 175 17 5 51 398 4 - 46
Maintain current Business :
- Replacement Efficiency/ Service Quality 3 167 294 1 267 111 201 278 48 477 316 54 2 121
Total (excl. borrowing cost) 6 090 537 2 239 122 1 376 294 53 528 715 58 2 167
DetailsProjections
2017/18
Rm
TNPA RCB DBN EL NGQ PE MSB CPT SLD LHS DRS HO
Expand Business :
- Growth initiatives 4 845 288 2 230 31 1 299 30 - 100 825 - - 42
Maintain current Business :
- Replacement Efficiency/ Service Quality 2 533 100 1 065 204 203 488 46 153 168 31 2 73
Total (excl. borrowing cost) 7 377 388 3 295 235 1 501 518 46 253 993 31 2 115
DetailsProjections
2018/19
Rm
Transnet National Ports Authority Tariff Application for Financial Year 2016/17 __________________
Page 64 of 85
Table 31: Ports Related Spending by Asset Type
FY 2015/16
FY 2016/17
FY 2017/18
TNPA RCB DBN EL NGQ PE MSB CPT SLD LHS DRS HO
Buildings and structures 524 372 66 34 - 14 12 18 4 4 - -
Aircraft - - - - - - - - - - - -
Land 13 6 6 - - - - - - - - -
Machinery, equipment and furniture 623 6 262 3 2 9 1 137 6 88 18 92
Permanent way and works 16 7 1 8 - - - - - - - -
Vehicles, Rolling stock & containers - - - - - - - - - - - -
Port Facilities 1 860 100 484 92 401 196 3 14 239 - 331 -
Other - - - - - - - - - - - -
Pipelines networks (etc) 19 - 19 - - - - - - - - -
Total (excl. borrowing cost) 3 055 491 838 137 403 219 16 169 250 92 349 92
Asset TypeLatest Estimates
2015/16
Rm
TNPA RCB DBN EL NGQ PE MSB CPT SLD LHS DRS HO
Buildings and structures 531 206 163 9 8 9 16 80 35 5 - -
Aircraft 152 30 122 - - - - - - - - -
Land 5 - 5 - - - - - - - - -
Machinery, equipment and furniture 435 13 116 3 4 6 1 135 6 20 4 127
Permanent way and works 124 62 2 16 - 44 - - - - - -
Vehicles, Rolling stock & containers 10 - - 5 5 - - - - - - -
Port Facilities 2 871 135 1 028 143 643 203 4 145 338 - 232 -
Other - - - - - - - - - - - -
Pipelines networks (etc) 16 - 16 - - - - - - - - -
Total (excl. borrowing cost) 4 144 446 1 453 176 660 262 21 360 379 25 236 127
Asset TypeProjectiona
2016/17
Rm
TNPA RCB DBN EL NGQ PE MSB CPT SLD LHS DRS HO
Buildings and structures 845 102 456 27 27 27 16 128 47 15 - -
Aircraft 167 137 30 - - - - - - - - -
Land 15 - 15 - - - - - - - - -
Machinery, equipment and furniture 745 15 238 2 3 53 6 215 4 43 2 167
Permanent way and works 200 143 50 - - 7 - - - - - -
Vehicles, Rolling stock & containers 16 - - 1 15 - - - - - - -
Port Facilities 4 094 140 1 442 93 1 331 208 31 185 664 - - -
Other - - - - - - - - - - - -
Pipelines networks (etc) 8 - 8 - - - - - - - - -
Total (excl. borrowing cost) 6 090 537 2 239 122 1 376 294 53 528 715 58 2 167
Asset TypeProjectiona
2017/18
Rm
Transnet National Ports Authority Tariff Application for Financial Year 2016/17 __________________
Page 65 of 85
FY 2018/19
Table 32: Capital expenditure and throughput per commodity
Containers
Liquid Bulk
TNPA RCB DBN EL NGQ PE MSB CPT SLD LHS DRS HO
Buildings and structures 904 82 569 44 87 5 8 57 53 - - -
Aircraft 170 85 85 - - - - - - - - -
Land 47 47 - - - - - - - - - -
Machinery, equipment and furniture 312 14 114 2 3 23 1 4 4 31 2 115
Permanent way and works 198 139 50 - - 9 - - - - - -
Vehicles, Rolling stock & containers 44 1 1 42 - - - - - - - -
Port Facilities 5 704 20 2 476 147 1 412 481 38 192 937 - - -
Other - - - - - - - - - - - -
Pipelines networks (etc) - - - - - - - - - - - -
Total (excl. borrowing cost) 7 377 388 3 295 235 1 501 518 46 253 993 31 2 115
2018/19
Rm
Asset TypeProjectiona
Details 2015/16 2016/17 2017/18 2018/19 2019/20 2020/21 2021/22
Containers 350 666 1 142 2 405 3 547 3 521 3 032 - Dbn: DCT berth deepening berth 203 to 205
-Expand 350 646 992 2 205 3 417 3 521 3 032 - Dbn: Pier 1 phase 2 Infill (Salisbury Island)
-Maintain - 20 150 200 130 - - - NGQ: Automated mooring system D101 -103
Volumes ('000 TEUs)
-Budget and Projections 4 905 5 110 5 310 5 475 5 728 5 902 6 110
-Capacity 8 543 8 543 8 543 8 543 8 943 8 943 10 143
Total capex spend to this year 11 631
Indicative return on capital 618
Depreciation 291
Additional Revenue Required 908
Containers
Major Capital ProjectsR'm
Details 2015/16 2016/17 2017/18 2018/19 2019/20 2020/21 2021/22
Liquid Bulk 196 342 1 301 1 143 629 868 595
- NGQ: tank farm Berth A100, roads, port
entrance and services
-Expand 32 89 853 980 573 863 585 - RCB: Facility for LNG
-Maintain 163 252 448 162 57 5 10
Volumes (mKl)
-Budget and Projections 37 38 39 41 41 43 44
-Capacity 77 77 78 78 80 80 81
Total capex spend to this year 4 478
Indicative return on capital 238
Depreciation 112
Additional Revenue Required 350
Liquid Bulk
Major Capital ProjectsR'm

Transnet National Ports Authority Tariff Application for Financial Year 2016/17 __________________
Page 66 of 85
Iron Ore
Coal
Manganese
Break-Bulk
Details 2015/16 2016/17 2017/18 2018/19 2019/20 2020/21 2021/22
Iron Ore 7 134 518 887 1 102 700 396
- SLD: Ore Expansion Phase 2 berth
Construction (to 82.5mtpa)
-Expand -2 12 367 772 1 102 700 396
-Maintain 9 122 151 115 - - -
Volumes (mt)
-Budget and Projections 61 61 61 61 61 61 61
-Capacity 67 67 67 67 83 83 83
Total capex spend to this year 3 348
Indicative return on capital 178
Depreciation 84
Additional Revenue Required 261
Iron Ore
Major Capital ProjectsR'm
Details 2015/16 2016/17 2017/18 2018/19 2019/20 2020/21 2021/22
Coal - - 3 1 5 119 10 - EL: Land preparation for coal export facility
-Expand - - 3 1 5 119 -
-Maintain - - - - - - 10
Volumes (mt)
-Budget and Projections 77 81 87 91 98 97 98
-Capacity 113 113 115 115 115 115 115
Coal
Major Capital ProjectsR'm
Details 2015/16 2016/17 2017/18 2018/19 2019/20 2020/21 2021/22
Manganese 24 256 208 5 - - 80 - NGQ: Manganese terminal
-Expand 24 256 208 5 - - -
-Maintain - - - - - - 80
Volumes (mt)
-Budget and Projections 10 10 10 10 10 11 13
-Capacity 10 10 24 24 24 24 24
Total capex spend to this year 494
Indicative return on capital 26
Depreciation 12
Additional Revenue Required 39
Manganese
Major Capital ProjectsR'm
Details 2015/16 2016/17 2017/18 2018/19 2019/20 2020/21 2021/22
Break Bulk 474 391 36 52 25 58 505
- DBN: Reconstruction of Sheet-Pile quay
Walls at Maydon Wharf
-Expand 96 56 3 43 25 53 500
- DBN: Berth Deepening Maydon Wharf 5-11
& 15
-Maintain 378 335 34 9 - 5 5
Volumes (mt)
-Budget and Projections 9 9 9 10 10 10 11
-Capacity 30 30 30 30 30 30 30
Break Bulk
Major Capital ProjectsR'm

Transnet National Ports Authority Tariff Application for Financial Year 2016/17 __________________
Page 67 of 85
Automotives
Other (Incl. LHS & Bulk Services)
Fleet- Craft & Dredging Services
Table 33: Multi-Year Strategic Objectives
Details 2015/16 2016/17 2017/18 2018/19 2019/20 2020/21 2021/22
Automotives - - - - - - -
- Increased capacity is due to additional slots
at Durban Car Terminal
-Expand - - - - - - -
-Maintain - - - - - - -
Volumes (units)
-Budget and Projections 650 222 680 173 732 445 768 332 806 085 851 521 904 268
-Capacity 850 000 890 000 890 000 890 000 1 010 000 1 010 000 1 010 000
Automotives
Major Capital ProjectsR'm
Details 2015/16 2016/17 2017/18 2018/19 2019/20 2020/21 2021/22
Other (incl LHS & Bulk Services) 1 312 1 588 2 618 2 563 1 554 1 493 1 673
-Expand 36 212 392 668 358 402 605
-Maintain 1 276 1 376 2 226 1 895 1 196 1 091 1 068
Other (incl LHS & Bulk Services)
Major Capital ProjectsR'm
- This includes all other investments at Ports
including port entrances, roads, electrical
networks, sewerage networks etc
Details 2015/16 2016/17 2017/18 2018/19 2019/20 2020/21 2021/22
Fleet - Craft 343 530 261 320 582 915 720 - DRS: Provision of 2nd TSHD
-Expand 113 242 104 170 300 121 -
- Tugs: Acquisition of 9 tugs
(RCB,DBN,PE,SLD)
-Maintain 230 288 157 150 282 794 720 - Tugs: Acquisition of 6 tugs (DBN)
Dredging Services 349 236 2 2 2 92 2
-Expand 271 212 - - - - -
-Maintain 78 24 2 2 2 92 2
Fleet-Craft and Dredging Services
Major Capital ProjectsR'm
LE
2015/16 2016/17 2017/18 2018/19 2019/20 2020/21 2021/22
To maximise return on investments by
obtaining additional volumes 618 1 241 2 673 4 422 5 564 5 595 4 864 24 977
To maximise return on investments by
improving operating efficiencies 599 962 363 142 98 62 - 2 224 To preserve current revenue streams
without obtaining additional volumes (ie.
revenue protection) 1 083 1 348 2 170 1 979 1 320 1 951 1 837 11 688
Ensure Safety Optimisation 612 364 583 617 339 133 119 2 767
Optimise Business Enterprise Offerings 69 126 172 112 70 - - 548
Optimally Satisfy Social Investments (non
economic value creating projects) - 10 17 30 13 - 80 149
Environmental 45 44 24 8 7 - - 127
Human Capital
Optimise Human Resources 30 50 88 69 35 25 115 412
Total (excl. borrowing cost) 3 055 4 144 6 090 7 377 7 445 7 765 7 015 42 891
Safety, Risk and Effective
Governance
Re-engineering, Integration,
Productivity and Efficiency
Strategic objective DetailsProjections
Total 7yr
Rm
Transnet National Ports Authority Tariff Application for Financial Year 2016/17 __________________
Page 68 of 85
Table 34: Multi-Year Capex Spending Per Port Service
Table 35: Multi-Year Ports Related Spending by Asset type
Table 36: Multi-Year Port Related Spending per Commodity
LE
Capex spend per Port Service / Facility 2015/16 2016/17 2017/18 2018/19 2019/20 2020/21 2021/22
Rm Rm Rm Rm Rm Rm Rm Rm
Infrastructure 2 271 3 353 5 769 7 024 6 790 6 660 6 219 38 087
Marine services 343 530 261 320 582 915 720 3 670
Lighthouse services 92 25 58 31 71 98 73 449
Dredging services 349 236 2 2 2 92 2 686
Total (excl. borrowing cost) 3 055 4 144 6 090 7 377 7 445 7 765 7 015 42 891
Projections
Total 7yr
LE
2015/16 2016/17 2017/18 2018/19 2019/20 2020/21 2021/22
Rm Rm Rm Rm Rm Rm Rm
Buildings and structures 524 531 845 904 656 677 680
Aircraft - 152 167 170 15 - -
Land 13 5 15 47 25 20 -
Machinery, equipment and furniture 623 435 745 312 264 298 436
Permanent way and works 16 124 200 198 73 144 -
Vehicles, Rolling stock & containers - 10 16 44 22 - -
Port Facilities 1 860 2 871 4 094 5 704 6 390 6 627 5 899
Other - - - - - - -
Pipelines networks (etc) 19 16 8 - - - -
Total (excl. borrowing cost) 3 055 4 144 6 090 7 377 7 445 7 765 7 015
Asset Types
Projections
LE
2015/16 2016/17 2017/18 2018/19 2019/20 2020/21 2021/22
Containers 350 666 1 142 2 405 3 547 3 521 3 032 14 663
Liquid Bulk 196 342 1 301 1 143 629 868 595 5 074
Iron Ore 7 134 518 887 1 102 700 396 3 744
Coal - - 3 1 5 119 10 138
Manganese 24 256 208 5 - - 80 574
Break Bulk 474 391 36 52 25 58 505 1 541
Automotive - - - - - - - -
Fleet - craft 343 530 261 320 582 915 720 3 670
Dredging Services 349 236 2 2 2 92 2 686
Other (incl LHS) 1 312 1 588 2 618 2 563 1 554 1 493 1 673 12 802
Total (excl. borrowing cost) 3 055 4 144 6 090 7 377 7 445 7 765 7 015 42 891
Projection
Total 7yr
Rm
Major Commodity
Transnet National Ports Authority Tariff Application for Financial Year 2016/17 __________________
Page 69 of 85
Table 37: Total Ship Repairs
LE
2015/16 2016/17 2017/18 2018/19 2019/20 2020/21 2021/22
Total Ship repair 262 317 456 239 45 20 177 1 516
Details
Projections
Total 7yr
Rm
Transnet National Ports Authority Tariff Application for Financial Year 2016/17 __________________
Page 70 of 85
ANNEXURE C: Operating Expenditure
Table 38: Operating Expenditure
The Authority’s total costs for FY 2016/17 is R 5 487m (inclusive of Group overhead costs).
The cost elements contributing significantly to the total operating expenditure includes Labour Costs,
Energy, Maintenance, Rates & Taxes, Sundry Operating costs, Material, Computer & Info systems, Rental
and Pre-Feasibility Studies.
The sections that follow provide a detailed explanation for each of the cost items per Table 38 above.
Labour Cost
Labour cost is a function of delivering on the Authority’s mandate in terms of operating efficiently,
oversight, project management and maintenance. The Authority remains a labour intensive organisation as
it executes its key deliverables in terms of its mandate. Labour costs therefore forms a substantial portion
of the overall operating expenditure, compromising of 53% of the total operating costs for FY 2016/17.
The expected growth of labour costs for FY 2016/17 is approximately 16% (R352m). The average growth in
labour over the 3 year tariff application period amounts to 7%.
Actual Budget Forecast Dev '15/16 Dev '15/16 % of Opex Forecast Forecast CAGR2014/15 2015/16 2016/17 vs 16/17 vs 16/17 15/16 2017/18 2018/19 2016/17 -
R Million R Million R Million R Million Percentage R Million R Million 2018/19
Labour Costs 1 909 2 219 2 571 352 16% 53% 2 783 2 931 7%
Rates & taxes 316 363 397 34 9% 8% 443 456 7%
Maintenance 260 329 402 73 22% 8% 452 545 16%
Contract Payments 71 138 157 19 14% 3% 119 139 11%
Energy 440 488 554 65 13% 11% 622 693 12%
Professional services 18 51 56 5 10% 1% 73 89 26%
Material 76 85 104 20 23% 2% 112 124 9%
Computer & Info systems 122 147 157 10 7% 3% 175 201 13%
Rental 60 66 80 13 20% 2% 85 103 14%
Security costs 71 82 89 7 8% 2% 107 131 22%
Pre -Feasibility Studies 43 118 139 21 18% 3% 129 186 16%
Sundry operating costs 17 113 131 18 16% 3% 181 184 3%
Total operating cost 3 403 4 200 4 837 637 15% 100% 5 280 5 782 9%
(excluding depreciation)
Group Costs 509 619 650 31 5% 687 721 5%
Total operating cost 3 912 4 819 5 487 668 14% 5 967 6 503 9%
(Including Group Costs)
Cost Category
Transnet National Ports Authority Tariff Application for Financial Year 2016/17 __________________
Page 71 of 85
The key drivers for growth in labour costs are mainly as follows:
o Headcount
In order to fully deliver on its mandate, the Authority requires additional resources. The table below
highlights the forecasted total number of permanent employees:
Table 39: Total Number of Employees
The key drivers for growth in headcount is as a result of the following:
increase in minimum manning levels of marine to 100% service and then to 120% to meet MOPS
requirements;
additional crew to man new craft being deployed by Dredging and Marine services;
increase in the tugs used per shift due to increased shipping volumes in order to improve and
ensure current marine service delivery at the ports of Dbn and RCB;
increase in Enterprise Risk Management (ERM) personnel to ensure oversight and compliance with
risk management requirements;
trainers required to establish marine engineering schools in the Ports of Durban, Cape Town,
Saldanha and East London;
manning of port operational centres to ensure systematic views of port performance;
the appointment of trainee helicopter pilots to in-house helicopter pilots; and
port engineering, project management and procurement resources to create adequate port
infrastructure capacity ahead of demand and maintaining existing and new assets.
o Remuneration
Remuneration is made up of annual salary adjustments, and is directly influenced by the aforementioned
growth in headcount.
o Training
In order for the effective execution of its mandate, it is incumbent upon the Authority to ensure adequate
training and development of human capital. Training and development is vital to ensure continuous growth
and advancement of the Authority and therefore remains a priority.
To this end the Authority has embarked on the introduction of four (4) Marine Engineering schools at the
Ports of Durban, Cape Town, Saldanha and East London. The objectives of the schools are to ensure the
development of critical maritime and engineering technical skills in order to create a shift from international
dependencies for the maintenance and expanding of marine fleet requirements.
Budget Forecast Deviation Deviation % Forecast Forecast
2015/16 2016/17 15/16 vs 16/17 15/16 vs 16/17 2017/18 2018/19
Total Number of Employees 4 909 5 368 459 9.4% 5 448 5 501
Cost Category
Transnet National Ports Authority Tariff Application for Financial Year 2016/17 __________________
Page 72 of 85
The Authority has also ensured training of critical staff involved in monitoring and planning functions of the
Joint Operations Centres (JOCs)
The Authority continues with the various training initiatives relating to marine cadet training, helicopter
pilot training and aircraft maintenance & aircraft avionics training.
Rates and Taxes
Rates and taxes relate to municipal rates and are based on the methodology employed by the municipalities
in accordance with the Municipal Rates and Taxes Act. An increase in this cost category is therefore not
aligned to the inflation rate.
The increase in Rates and Taxes for FY 2016/17 is approximately 9% (R34m). The average growth in rates
and taxes over the 3 year tariff application period amounts to 7%.
Maintenance
It is necessary for the Authority to ensure that port infrastructure and other assets are maintained in
accordance with required engineering standards. Maintenance is essential in order to ensure continuity in
operations and offer customers service certainty.
Maintenance is driven by planned maintenance, aged infrastructure, new infrastructure assets, new marine
craft (routine maintenance) and increased maintenance focused on the ship repair business.
Increase in maintenance for FY 2016/17 is approximately 22% - R73m (with an average growth in
maintenance over the three year period of approximately 16%) and is mainly attributed to the following:
Refurbishment of ageing infrastructure;
The National Infrastructure Maintenance Strategy (NIMS) provides maintenance benchmarks for
State Owned Enterprises (SOE’s) which is set at 5% of the book value of port infrastructure. The
Authority currently spends approximately 1% of book value on port infrastructure with the aim to
gradually align to benchmark level of 5%. The Authority intends on reaching an initial target of 2.5%
over a three year period resulting in accelerated spending on maintenance;
Changes to business operations have a direct result on the levels of maintenance required. As the
port system continues to handle larger container vessels than it is designed to accommodate;
frequent dredging of berths is required resulting in increased and additional maintenance of
dredgers; and
Ship repairs maintenance and refurbishment which involves the upgrading of existing facilities to
ensure its sustained and efficient use. The refurbishment includes:
o Civil: Concrete repairs, crane rail upgrade, water reticulation, enclosure;
o Electrical: Optimisation of electrical network, components replacements; and
o Mechanical: Crane refurbishment/replacement, pump and valve upgrades.

Transnet National Ports Authority Tariff Application for Financial Year 2016/17 __________________
Page 73 of 85
Contract Payments
The increase on contract payment for FY 2016/17 is approximately 14% with the average increase over the
three year tariff application period is approximately 11%. This is attributed to the costs relating to Operation
Phakisa in FEL1& FEL2 stages to the amount of R44.4m in FY 2015/16 and R 46.9m in FY 2016/17. Other
costs contributing to contract payments include helicopter pilot services and hiring of an external dredger
to assist with the backlog of dredging in Durban.
Energy
Energy costs are mainly attributable to the fuel and electricity consumption of the Authority. The increase
in costs for FY 2016/17 is approximately 13% (R65m) and mainly due to the following:
Average electricity tariff increases approved by the National Energy Regulator of South Africa
(NERSA) for Eskom (12.69%) and municipal distributors (12.21%) for FY 2015/16 used as an
indicative basis for FY 2016/17; and
Additional fuel costs relating to the new marine craft including the new dredgers with capacities
higher than the older craft.
The average increase over the three year period is approximately 12% and is mainly due to the anticipated
higher electricity tariffs as Eskom continues to struggle to meet demand together with the fluctuations in
the exchange rate inhibiting the benefits of lower oil prices.
Professional Services
Professional fees relate to internal and external audit fees (financial and operational/ environmental) and
legal fees whilst the remainder relates to other professional services.
The increase in Professional services costs for FY 2016/17 is approximately 10% (R5m) with the average
growth in costs over the 3 year tariff application period amounting to 26%.
The 10% (R5m) increase on professional services for FY 2016/17 is mainly due to the implementation of
Operations Centres and the establishment of Joint Operations Centres (JOCs) to ensure visibility of the port
system value chain enabling identification of challenges and timeous application of mitigation strategies.
Other professional fees relate to Operational Audits & Transnet Certification, and Real Estate projects
relating to Land use audit projects, Anticipated Section 56 consultants and Investment Property Valuation
Fees.
Transnet National Ports Authority Tariff Application for Financial Year 2016/17 __________________
Page 74 of 85
Material
Material costs relate to material used in the maintenance of marine fleet and civil maintenance and are
therefore directly influenced by maintenance activity. The material costs increase in FY 2016/17 is 23%
(R20m) with the average growth in material costs over the 3 year tariff application period amounting to 9%.
The explanations provided above under Maintenance are applicable to the increased material costs.
Computer and Information Systems
Computer and information systems include network costs, software licences, information system support,
development cost, computer consumables and on-going maintenance thereof.
The increase in computer and information systems costs for the FY2016/17 is marginally above inflation at
7% (R10m). The average growth in costs over the 3 year tariff application period amounts to 13%. The 7%
(R10m) increase in computer and information systems costs is due to an inflationary adjustment of R7m
with the remaining costs attributable to specific projects such as the establishment of JOCs, IPMS, new
revenue systems, records management and desktop back-up automation.
Rental
Rental costs relates to the hiring of internal and external land and buildings and leasing of vehicles,
equipment and furniture.
The increase in rental costs for the FY2015/16 is approximately 20% (R13m). The average growth in rental
costs over the 3 year tariff application period amounts to 14%. The increase in rental costs between FY
2015/16 and FY 2016/17 is mainly due to the leasing of computer equipment, office space for JOCs and
vehicle rentals for berthing, pilots, and water supply to vessels.
Security
Security costs relate to the use of private security firms at the ports and are expected to increase by 8%
(R7m) for FY 2016/17. The slightly higher than inflation increase in costs is due to new/additional security
contracts owing to the establishment of new operators.
Pre-Feasibility Studies
Pre-feasibility studies are undertaken to determine future capital investments in a pre-feasibility phase to
determine the best alternative for construction, preliminary design work and costing to assess overall
viability of the project.
The increase in pre-feasibility costs for FY 2016/17 is 18% (R21m) with the average increase over the three
year period being approximately 16%.
The major capital projects of the Authority are highlighted in Table 28 above. Pre-feasibility study costs for
FY 2016/17 includes studies relating to ship repair facilities for the port system in terms of the Operation
Phakisa initiative.
Transnet National Ports Authority Tariff Application for Financial Year 2016/17 __________________
Page 75 of 85
Other projects, amongst others, included in the pre-feasibility study costs include long-wave mitigation
measures, wind mitigation studies and land use planning studies.
Sundry Operating Costs
The detailed costs relating to sundry expenses are highlighted in Table 40 below. Sundry Costs include
expenses relating to insurance, stationery and printing, transport, promotions and advertising, cleaning
services, environmental and other miscellaneous operating expenditure.
Miscellaneous revenue captured under sundry operating costs relates to income received from penalties
and levies raised by the Authority from time to time.
The main cost drivers relating to sundry expenses are as follows:
Insurance costs (12%): Relate to the new marine craft and dredgers
Printing & Stationary (16%): Owing to increased headcount numbers
Promotions & Advertising (33%): Due to the development of a new marketing strategy
Further to the above, the request for proposals for the S56 projects and public hearings thereof will lead to
increased environmental management, legal fees, printing/stationary, promotions and advertising and
feasibility studies.
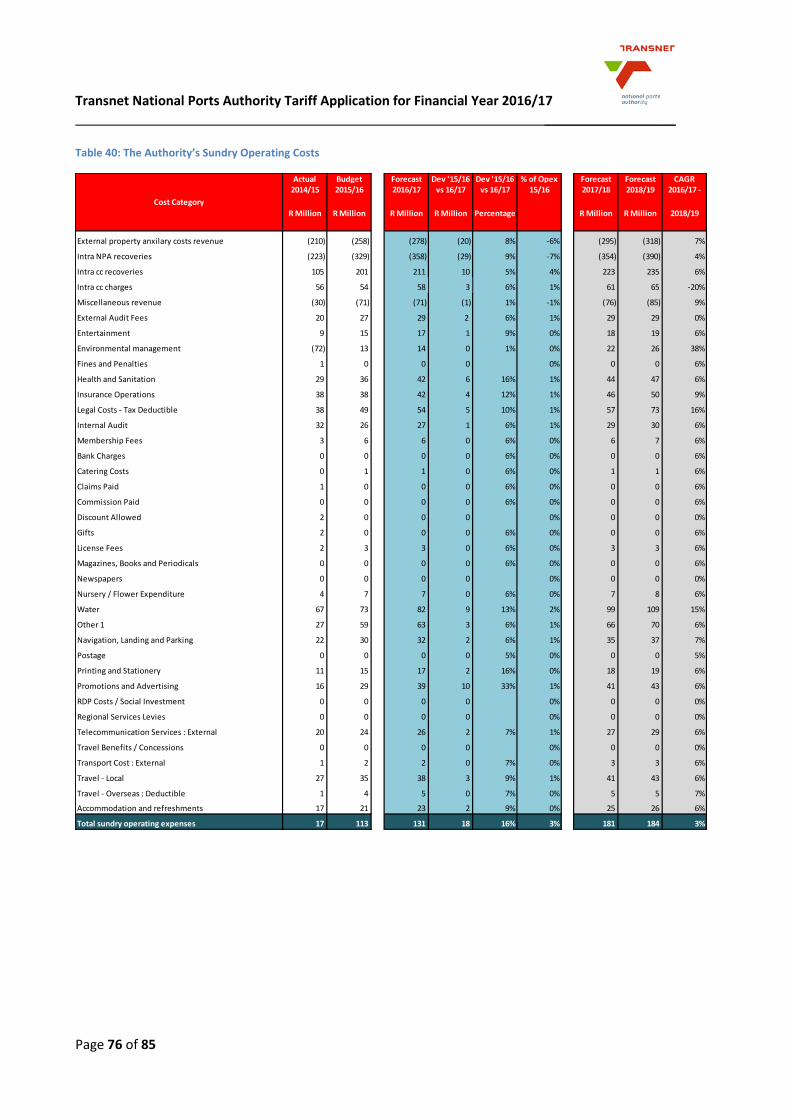
Transnet National Ports Authority Tariff Application for Financial Year 2016/17 __________________
Page 76 of 85
Table 40: The Authority’s Sundry Operating Costs
Actual Budget Forecast Dev '15/16 Dev '15/16 % of Opex Forecast Forecast CAGR2014/15 2015/16 2016/17 vs 16/17 vs 16/17 15/16 2017/18 2018/19 2016/17 -
R Million R Million R Million R Million Percentage R Million R Million 2018/19
External property anxilary costs revenue (210) (258) (278) (20) 8% -6% (295) (318) 7%
Intra NPA recoveries (223) (329) (358) (29) 9% -7% (354) (390) 4%
Intra cc recoveries 105 201 211 10 5% 4% 223 235 6%
Intra cc charges 56 54 58 3 6% 1% 61 65 -20%
Miscellaneous revenue (30) (71) (71) (1) 1% -1% (76) (85) 9%
External Audit Fees 20 27 29 2 6% 1% 29 29 0%
Entertainment 9 15 17 1 9% 0% 18 19 6%
Environmental management (72) 13 14 0 1% 0% 22 26 38%
Fines and Penalties 1 0 0 0 0% 0 0 6%
Health and Sanitation 29 36 42 6 16% 1% 44 47 6%
Insurance Operations 38 38 42 4 12% 1% 46 50 9%
Legal Costs - Tax Deductible 38 49 54 5 10% 1% 57 73 16%
Internal Audit 32 26 27 1 6% 1% 29 30 6%
Membership Fees 3 6 6 0 6% 0% 6 7 6%
Bank Charges 0 0 0 0 6% 0% 0 0 6%
Catering Costs 0 1 1 0 6% 0% 1 1 6%
Claims Paid 1 0 0 0 6% 0% 0 0 6%
Commission Paid 0 0 0 0 6% 0% 0 0 6%
Discount Allowed 2 0 0 0 0% 0 0 0%
Gifts 2 0 0 0 6% 0% 0 0 6%
License Fees 2 3 3 0 6% 0% 3 3 6%
Magazines, Books and Periodicals 0 0 0 0 6% 0% 0 0 6%
Newspapers 0 0 0 0 0% 0 0 0%
Nursery / Flower Expenditure 4 7 7 0 6% 0% 7 8 6%
Water 67 73 82 9 13% 2% 99 109 15%
Other 1 27 59 63 3 6% 1% 66 70 6%
Navigation, Landing and Parking 22 30 32 2 6% 1% 35 37 7%
Postage 0 0 0 0 5% 0% 0 0 5%
Printing and Stationery 11 15 17 2 16% 0% 18 19 6%
Promotions and Advertising 16 29 39 10 33% 1% 41 43 6%
RDP Costs / Social Investment 0 0 0 0 0% 0 0 0%
Regional Services Levies 0 0 0 0 0% 0 0 0%
Telecommunication Services : External 20 24 26 2 7% 1% 27 29 6%
Travel Benefits / Concessions 0 0 0 0 0% 0 0 0%
Transport Cost : External 1 2 2 0 7% 0% 3 3 6%
Travel - Local 27 35 38 3 9% 1% 41 43 6%
Travel - Overseas : Deductible 1 4 5 0 7% 0% 5 5 7%
Accommodation and refreshments 17 21 23 2 9% 0% 25 26 6%
Total sundry operating expenses 17 113 131 18 16% 3% 181 184 3%
Cost Category
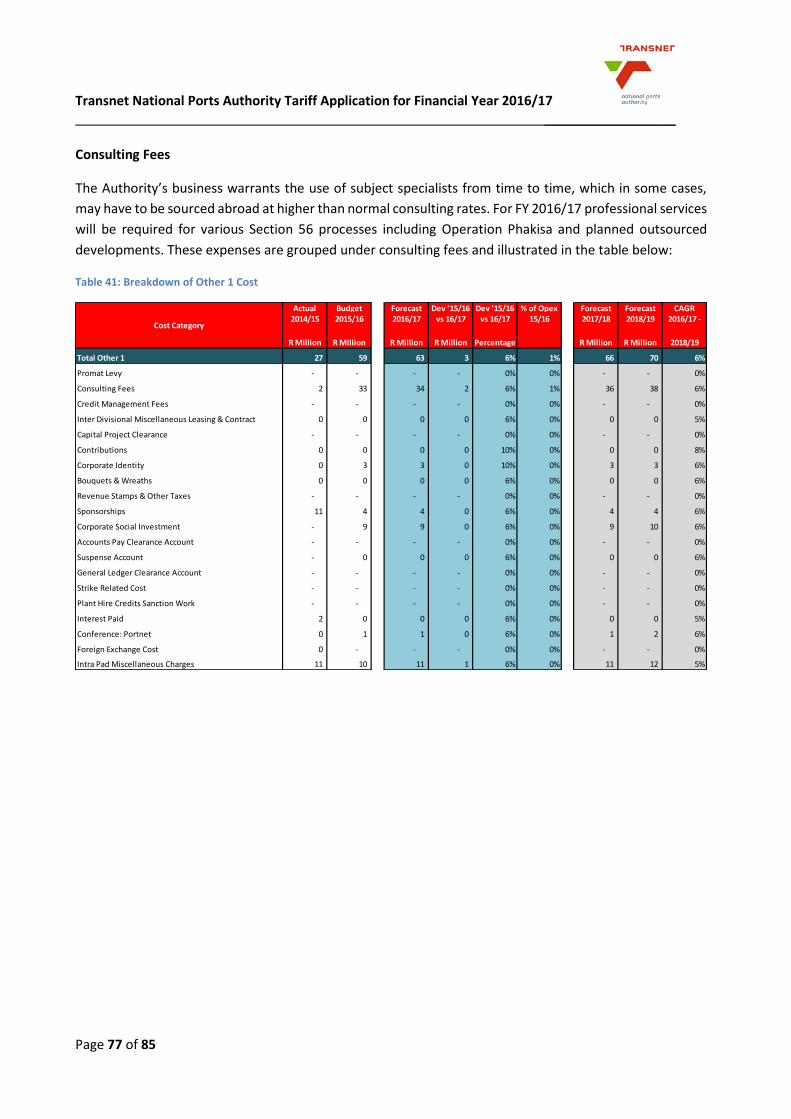
Transnet National Ports Authority Tariff Application for Financial Year 2016/17 __________________
Page 77 of 85
Consulting Fees
The Authority’s business warrants the use of subject specialists from time to time, which in some cases,
may have to be sourced abroad at higher than normal consulting rates. For FY 2016/17 professional services
will be required for various Section 56 processes including Operation Phakisa and planned outsourced
developments. These expenses are grouped under consulting fees and illustrated in the table below:
Table 41: Breakdown of Other 1 Cost
Actual Budget Forecast Dev '15/16 Dev '15/16 % of Opex Forecast Forecast CAGR2014/15 2015/16 2016/17 vs 16/17 vs 16/17 15/16 2017/18 2018/19 2016/17 -
R Million R Million R Million R Million Percentage R Million R Million 2018/19
Total Other 1 27 59 63 3 6% 1% 66 70 6%
Promat Levy - - - - 0% 0% - - 0%
Consulting Fees 2 33 34 2 6% 1% 36 38 6%
Credit Management Fees - - - - 0% 0% - - 0%
Inter Divisional Miscellaneous Leasing & Contract 0 0 0 0 6% 0% 0 0 5%
Capital Project Clearance - - - - 0% 0% - - 0%
Contributions 0 0 0 0 10% 0% 0 0 8%
Corporate Identity 0 3 3 0 10% 0% 3 3 6%
Bouquets & Wreaths 0 0 0 0 6% 0% 0 0 6%
Revenue Stamps & Other Taxes - - - - 0% 0% - - 0%
Sponsorships 11 4 4 0 6% 0% 4 4 6%
Corporate Social Investment - 9 9 0 6% 0% 9 10 6%
Accounts Pay Clearance Account - - - - 0% 0% - - 0%
Suspense Account - 0 0 0 6% 0% 0 0 6%
General Ledger Clearance Account - - - - 0% 0% - - 0%
Strike Related Cost - - - - 0% 0% - - 0%
Plant Hire Credits Sanction Work - - - - 0% 0% - - 0%
Interest Paid 2 0 0 0 6% 0% 0 0 5%
Conference: Portnet 0 1 1 0 6% 0% 1 2 6%
Foreign Exchange Cost 0 - - - 0% 0% - - 0%
Intra Pad Miscellaneous Charges 11 10 11 1 6% 0% 11 12 5%
Cost Category

Transnet National Ports Authority Tariff Application for Financial Year 2016/17 __________________
Page 78 of 85
Group Overhead Costs
The services provided by each Transnet corporate cost centre to the respective Operating Divisions (ODs)
of Transnet vary in accordance with OD requirements and the nature of its activities. Transnet allocates
these shared costs based on a top down costs centre allocation approach as opposed to a top down
expenditure line item allocation approach.
This effectively means that total costs relating to a particular cost centre are allocated to the ODs using a
cost driver predetermined by and agreed with the cost centre managers for that particular cost centre and
this consequently informs the allocation of the expenditure line items such as personnel costs, fuel costs
etc. within that cost centre.
Furthermore, where possible, identified costs per general ledger account that could be traced to ODs are
allocated directly without the use of predetermined cost drivers. An example in this regard is the Incentive
bonuses provision, Impairments on trade receivables and Other internal income recoveries in the FY
2016/17 allocation.
Year on year differences in allocated corporate overhead costs or differences between budgeted corporate
overhead costs allocations and actual corporate overhead costs allocations will always be primarily as a
result of changes in the base rand amounts (e.g. budgeted corporate overhead costs versus actual
corporate overhead costs per cost centre) as well as changes in cost driver percentages (per cost centre)
with cost driver remaining the same.
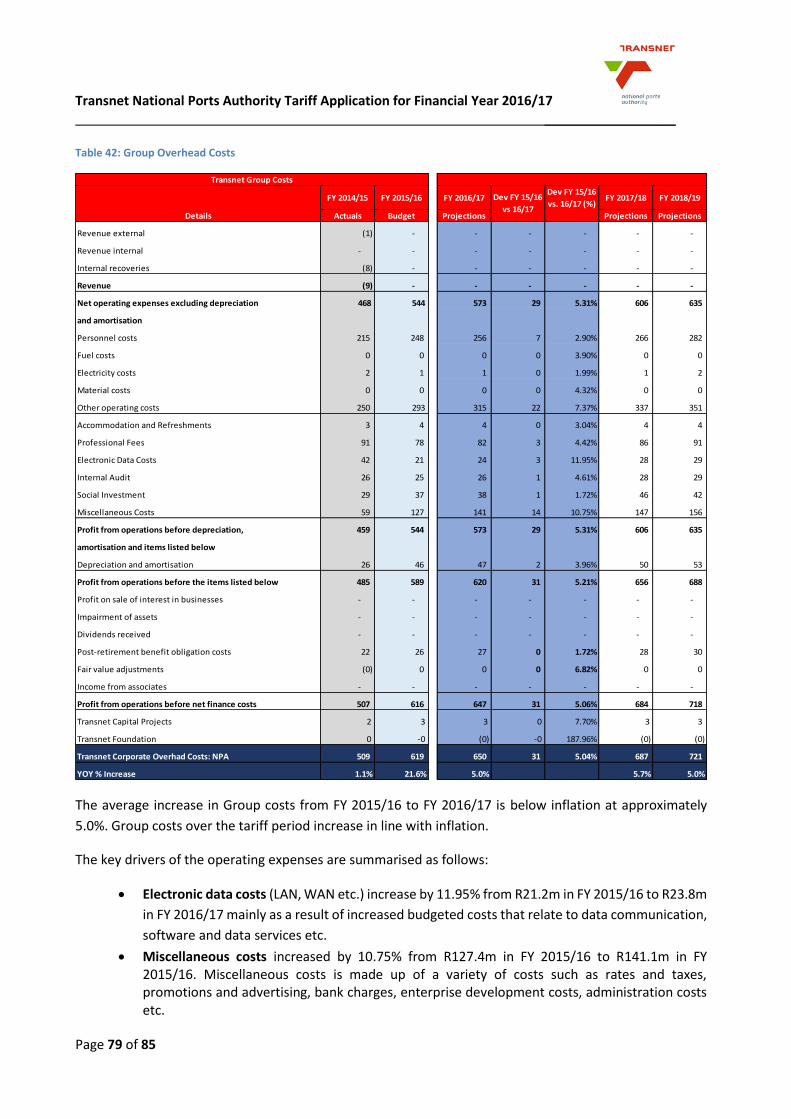
Transnet National Ports Authority Tariff Application for Financial Year 2016/17 __________________
Page 79 of 85
Table 42: Group Overhead Costs
The average increase in Group costs from FY 2015/16 to FY 2016/17 is below inflation at approximately
5.0%. Group costs over the tariff period increase in line with inflation.
The key drivers of the operating expenses are summarised as follows:
Electronic data costs (LAN, WAN etc.) increase by 11.95% from R21.2m in FY 2015/16 to R23.8m
in FY 2016/17 mainly as a result of increased budgeted costs that relate to data communication,
software and data services etc.
Miscellaneous costs increased by 10.75% from R127.4m in FY 2015/16 to R141.1m in FY 2015/16. Miscellaneous costs is made up of a variety of costs such as rates and taxes, promotions and advertising, bank charges, enterprise development costs, administration costs etc.
FY 2014/15 FY 2015/16 FY 2016/17Dev FY 15/16
vs. 16/17 (%)FY 2017/18 FY 2018/19
Actuals Budget Projections Projections Projections
Revenue external (1) - - - - - -
Revenue internal - - - - - - -
Internal recoveries (8) - - - - - -
Revenue (9) - - - - - -
Net operating expenses excluding depreciation 468 544 573 29 5.31% 606 635
and amortisation
Personnel costs 215 248 256 7 2.90% 266 282
Fuel costs 0 0 0 0 3.90% 0 0
Electricity costs 2 1 1 0 1.99% 1 2
Material costs 0 0 0 0 4.32% 0 0
Other operating costs 250 293 315 22 7.37% 337 351
Accommodation and Refreshments 3 4 4 0 3.04% 4 4
Professional Fees 91 78 82 3 4.42% 86 91
Electronic Data Costs 42 21 24 3 11.95% 28 29
Internal Audit 26 25 26 1 4.61% 28 29
Social Investment 29 37 38 1 1.72% 46 42
Miscellaneous Costs 59 127 141 14 10.75% 147 156
Profit from operations before depreciation, 459 544 573 29 5.31% 606 635
amortisation and items listed below
Depreciation and amortisation 26 46 47 2 3.96% 50 53
Profit from operations before the items listed below 485 589 620 31 5.21% 656 688
Profit on sale of interest in businesses - - - - - - -
Impairment of assets - - - - - - -
Dividends received - - - - - - -
Post-retirement benefit obligation costs 22 26 27 0 1.72% 28 30
Fair value adjustments (0) 0 0 0 6.82% 0 0
Income from associates - - - - - - -
Profit from operations before net finance costs 507 616 647 31 5.06% 684 718
Transnet Capital Projects 2 3 3 0 7.70% 3 3
Transnet Foundation 0 -0 (0) -0 187.96% (0) (0)
Transnet Corporate Overhad Costs: NPA 509 619 650 31 5.04% 687 721
YOY % Increase 1.1% 21.6% 5.0% 5.7% 5.0%
Dev FY 15/16
vs 16/17Details
Transnet Group Costs
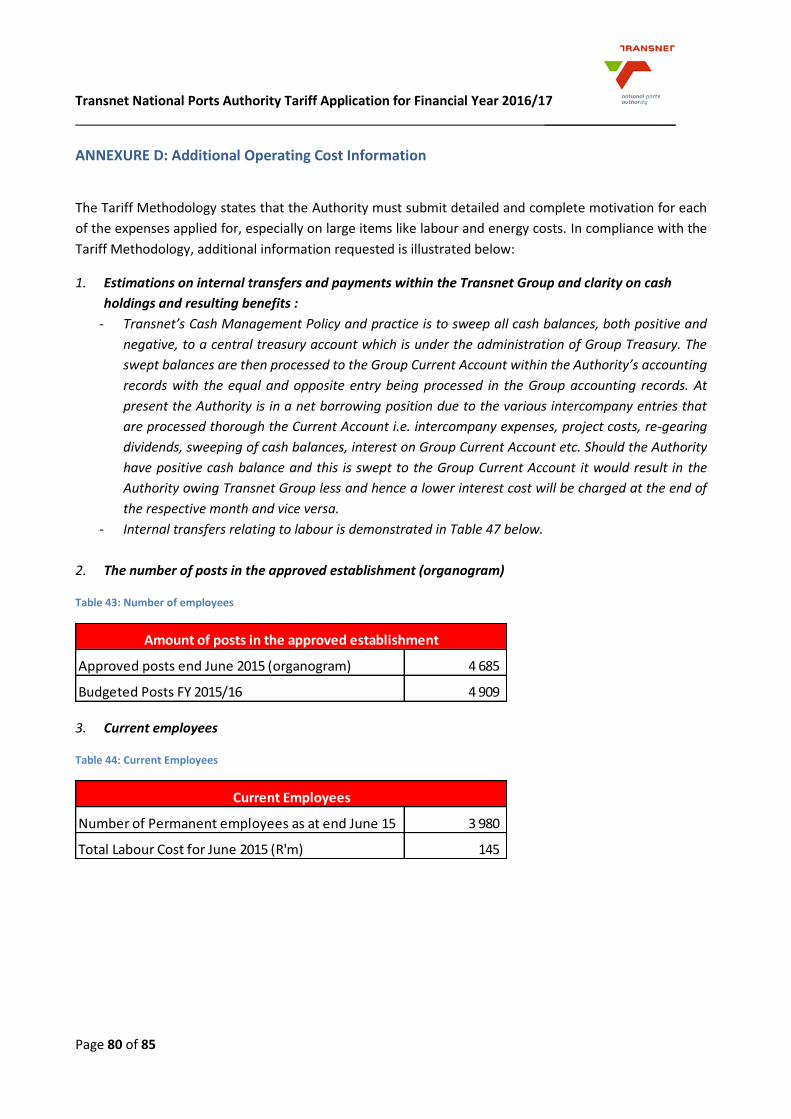
Transnet National Ports Authority Tariff Application for Financial Year 2016/17 __________________
Page 80 of 85
ANNEXURE D: Additional Operating Cost Information
The Tariff Methodology states that the Authority must submit detailed and complete motivation for each
of the expenses applied for, especially on large items like labour and energy costs. In compliance with the
Tariff Methodology, additional information requested is illustrated below:
1. Estimations on internal transfers and payments within the Transnet Group and clarity on cash
holdings and resulting benefits :
- Transnet’s Cash Management Policy and practice is to sweep all cash balances, both positive and
negative, to a central treasury account which is under the administration of Group Treasury. The
swept balances are then processed to the Group Current Account within the Authority’s accounting
records with the equal and opposite entry being processed in the Group accounting records. At
present the Authority is in a net borrowing position due to the various intercompany entries that
are processed thorough the Current Account i.e. intercompany expenses, project costs, re-gearing
dividends, sweeping of cash balances, interest on Group Current Account etc. Should the Authority
have positive cash balance and this is swept to the Group Current Account it would result in the
Authority owing Transnet Group less and hence a lower interest cost will be charged at the end of
the respective month and vice versa.
- Internal transfers relating to labour is demonstrated in Table 47 below.
2. The number of posts in the approved establishment (organogram)
Table 43: Number of employees
3. Current employees
Table 44: Current Employees
Approved posts end June 2015 (organogram) 4 685
Budgeted Posts FY 2015/16 4 909
Amount of posts in the approved establishment
Number of Permanent employees as at end June 15 3 980
Total Labour Cost for June 2015 (R'm) 145
Current Employees
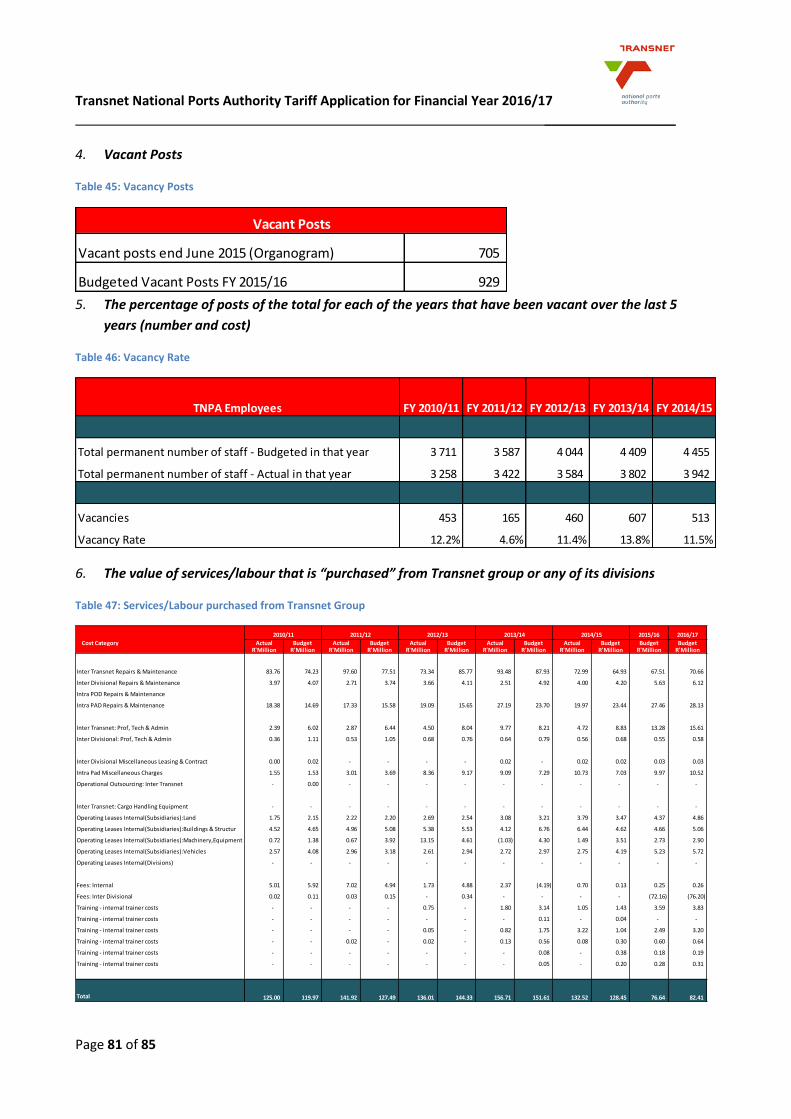
Transnet National Ports Authority Tariff Application for Financial Year 2016/17 __________________
Page 81 of 85
4. Vacant Posts
Table 45: Vacancy Posts
5. The percentage of posts of the total for each of the years that have been vacant over the last 5
years (number and cost)
Table 46: Vacancy Rate
6. The value of services/labour that is “purchased” from Transnet group or any of its divisions
Table 47: Services/Labour purchased from Transnet Group
Vacant posts end June 2015 (Organogram) 705
Budgeted Vacant Posts FY 2015/16 929
Vacant Posts
FY 2010/11 FY 2011/12 FY 2012/13 FY 2013/14 FY 2014/15
Total permanent number of staff - Budgeted in that year 3 711 3 587 4 044 4 409 4 455
Total permanent number of staff - Actual in that year 3 258 3 422 3 584 3 802 3 942
Vacancies 453 165 460 607 513
Vacancy Rate 12.2% 4.6% 11.4% 13.8% 11.5%
TNPA Employees
2015/16 2016/17
Cost Category Actual Budget Actual Budget Actual Budget Actual Budget Actual Budget Budget BudgetR'Million R'Million R'Million R'Million R'Million R'Million R'Million R'Million R'Million R'Million R'Million R'Million
Inter Transnet Repairs & Maintenance 83.76 74.23 97.60 77.51 73.34 85.77 93.48 87.93 72.99 64.93 67.51 70.66
Inter Divisional Repairs & Maintenance 3.97 4.07 2.71 3.74 3.66 4.11 2.51 4.92 4.00 4.20 5.63 6.12
Intra POD Repairs & Maintenance
Intra PAD Repairs & Maintenance 18.38 14.69 17.33 15.58 19.09 15.65 27.19 23.70 19.97 23.44 27.46 28.13
Inter Transnet: Prof, Tech & Admin 2.39 6.02 2.87 6.44 4.50 8.04 9.77 8.21 4.72 8.83 13.28 15.61
Inter Divisional: Prof, Tech & Admin 0.36 1.11 0.53 1.05 0.68 0.76 0.64 0.79 0.56 0.68 0.55 0.58
Inter Divisional Miscellaneous Leasing & Contract 0.00 0.02 - - - - 0.02 - 0.02 0.02 0.03 0.03
Intra Pad Miscellaneous Charges 1.55 1.53 3.01 3.69 8.36 9.17 9.09 7.29 10.73 7.03 9.97 10.52
Operational Outsourcing: Inter Transnet - 0.00 - - - - - - - - - -
Inter Transnet: Cargo Handling Equipment - - - - - - - - - - - -
Operating Leases Internal(Subsidiaries):Land 1.75 2.15 2.22 2.20 2.69 2.54 3.08 3.21 3.79 3.47 4.37 4.86
Operating Leases Internal(Subsidiaries):Buildings & Structur 4.52 4.65 4.96 5.08 5.38 5.53 4.12 6.76 6.44 4.62 4.66 5.06
Operating Leases Internal(Subsidiaries):Machinery,Equipment 0.72 1.38 0.67 3.92 13.15 4.61 (1.03) 4.30 1.49 3.51 2.73 2.90
Operating Leases Internal(Subsidiaries):Vehicles 2.57 4.08 2.96 3.18 2.61 2.94 2.72 2.97 2.75 4.19 5.23 5.72
Operating Leases Internal(Divisions) - - - - - - - - - - - -
Fees: Internal 5.01 5.92 7.02 4.94 1.73 4.88 2.37 (4.19) 0.70 0.13 0.25 0.26
Fees: Inter Divisional 0.02 0.11 0.03 0.15 - 0.34 - - - - (72.16) (76.20)
Training - internal trainer costs - - - - 0.75 - 1.80 3.14 1.05 1.43 3.59 3.83
Training - internal trainer costs - - - - - - - 0.11 - 0.04 - -
Training - internal trainer costs - - - - 0.05 - 0.82 1.75 3.22 1.04 2.49 3.20
Training - internal trainer costs - - 0.02 - 0.02 - 0.13 0.56 0.08 0.30 0.60 0.64
Training - internal trainer costs - - - - - - - 0.08 - 0.38 0.18 0.19
Training - internal trainer costs - - - - - - - 0.05 - 0.20 0.28 0.31
Total 125.00 119.97 141.92 127.49 136.01 144.33 156.71 151.61 132.52 128.45 76.64 82.41
2013/14 2014/152010/11 2011/12 2012/13
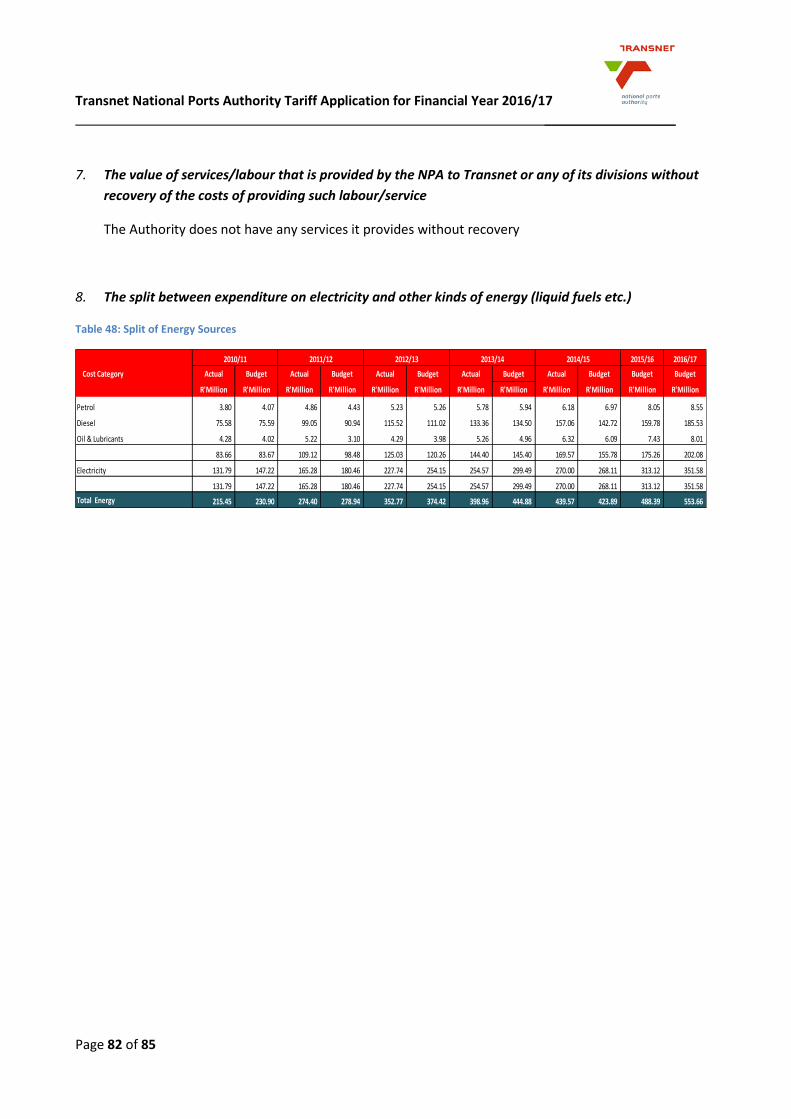
Transnet National Ports Authority Tariff Application for Financial Year 2016/17 __________________
Page 82 of 85
7. The value of services/labour that is provided by the NPA to Transnet or any of its divisions without
recovery of the costs of providing such labour/service
The Authority does not have any services it provides without recovery
8. The split between expenditure on electricity and other kinds of energy (liquid fuels etc.)
Table 48: Split of Energy Sources
2015/16 2016/17
Cost Category Actual Budget Actual Budget Actual Budget Actual Budget Actual Budget Budget Budget
R'Million R'Million R'Million R'Million R'Million R'Million R'Million R'Million R'Million R'Million R'Million R'Million
Petrol 3.80 4.07 4.86 4.43 5.23 5.26 5.78 5.94 6.18 6.97 8.05 8.55
Diesel 75.58 75.59 99.05 90.94 115.52 111.02 133.36 134.50 157.06 142.72 159.78 185.53
Oil & Lubricants 4.28 4.02 5.22 3.10 4.29 3.98 5.26 4.96 6.32 6.09 7.43 8.01
83.66 83.67 109.12 98.48 125.03 120.26 144.40 145.40 169.57 155.78 175.26 202.08
Electricity 131.79 147.22 165.28 180.46 227.74 254.15 254.57 299.49 270.00 268.11 313.12 351.58
131.79 147.22 165.28 180.46 227.74 254.15 254.57 299.49 270.00 268.11 313.12 351.58
Total Energy 215.45 230.90 274.40 278.94 352.77 374.42 398.96 444.88 439.57 423.89 488.39 553.66
2013/14 2014/152010/11 2011/12 2012/13
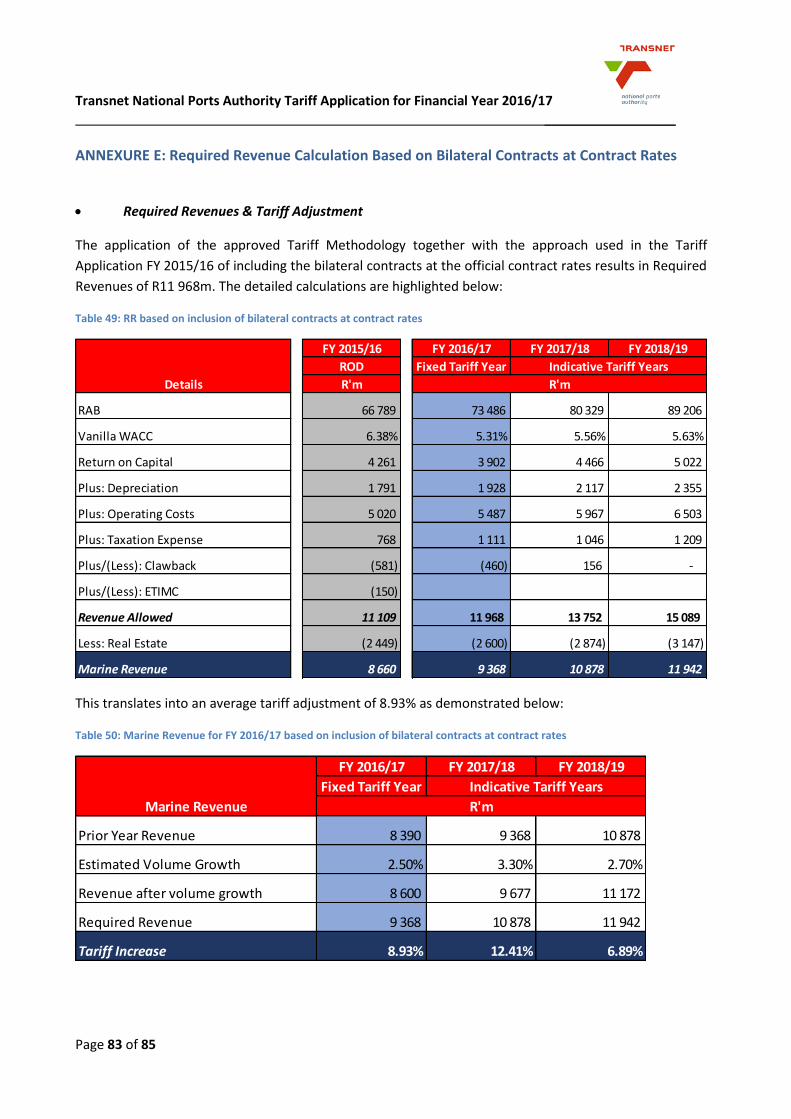
Transnet National Ports Authority Tariff Application for Financial Year 2016/17 __________________
Page 83 of 85
ANNEXURE E: Required Revenue Calculation Based on Bilateral Contracts at Contract Rates
Required Revenues & Tariff Adjustment
The application of the approved Tariff Methodology together with the approach used in the Tariff
Application FY 2015/16 of including the bilateral contracts at the official contract rates results in Required
Revenues of R11 968m. The detailed calculations are highlighted below:
Table 49: RR based on inclusion of bilateral contracts at contract rates
This translates into an average tariff adjustment of 8.93% as demonstrated below:
Table 50: Marine Revenue for FY 2016/17 based on inclusion of bilateral contracts at contract rates
FY 2015/16 FY 2016/17 FY 2017/18 FY 2018/19
ROD Fixed Tariff Year
R'm
RAB 66 789 73 486 80 329 89 206
Vanilla WACC 6.38% 5.31% 5.56% 5.63%
Return on Capital 4 261 3 902 4 466 5 022
Plus: Depreciation 1 791 1 928 2 117 2 355
Plus: Operating Costs 5 020 5 487 5 967 6 503
Plus: Taxation Expense 768 1 111 1 046 1 209
Plus/(Less): Clawback (581) (460) 156 -
Plus/(Less): ETIMC (150)
Revenue Allowed 11 109 11 968 13 752 15 089
Less: Real Estate (2 449) (2 600) (2 874) (3 147)
Marine Revenue 8 660 9 368 10 878 11 942
Details
Indicative Tariff Years
R'm
FY 2016/17 FY 2017/18 FY 2018/19
Fixed Tariff Year
Prior Year Revenue 8 390 9 368 10 878
Estimated Volume Growth 2.50% 3.30% 2.70%
Revenue after volume growth 8 600 9 677 11 172
Required Revenue 9 368 10 878 11 942
Tariff Increase 8.93% 12.41% 6.89%
Marine Revenue
Indicative Tariff Years
R'm
Transnet National Ports Authority Tariff Application for Financial Year 2016/17 __________________
Page 84 of 85
Clawback Calculations
The inclusion of the bilateral contracts at contract rates further impact the quantum of the clawback. The
resultant clawback calculations are highlighted in the tables that follow:
Table 51: Clawback FY 2014/15 based on bilateral contracts at contract rates
Table 52: Estimate Clawback FY 2015/15 based on bilateral contracts at contract rates
FY 2014/15
R'm
Re-computed Revenue Requirement 10 059
2014/15 AFS Revenue 10 469
Clawback FY 2014/15 (410)
Provisional allowed in ROD FY 2015/16 (174)
Final Clawback FY 2014/15 (584)
Actual Clawback
FY 2015/16
R'm
Allowed Revenue per ROD FY 2015/16 11 109
Latest Estimate Revenue 10 797
Estimated Clawback 312
50% Clawback Adjustment in FY 2016/17 156
Clawback FY 2014/15 (584)
Return on Clawback FY 2014/15 (32)
Estimate Clawback FY 2015/16 156
Net Clawback FY 2016/17 (460)
50% Clawback Adjustment in FY 2017/18 156
Estimate Clawback
Total Clawback due to customers FY2015/16
Clawback Adjustment for FY 2015/16 in FY2017/18 due to the Authority
Transnet National Ports Authority Tariff Application for Financial Year 2016/17 __________________
Page 85 of 85
Tax Computation
The aforementioned clawback calculations impact the tax computation as follows:
Table 53: Tax computation for scenario based on bilateral contracts at contract rates
End.
DETAILS FY 16/17 FY 17/18 FY 18/19
Gross Income 9 479 11 043 11 967
Pre Tax debt return - - -
Equity Return on RAB 2 524 2 803 3 109
ETIMC - - -
Clawback (460) 156 -
Depreciation 1 928 2 117 2 355
Opex 5 487 5 967 6 503
Deductions 6 955 8 240 8 858
Depreciation 1 928 2 117 2 355
Opex 5 487 5 967 6 503
ETIMC - - -
Clawback (460) 156 -
Taxable income 2 524 2 803 3 109
Gross up for tax 3 506 3 893 4 318
Tax at 28% 982 1 090 1 209
Tax on Clawback 129 (44) -
Tax on ETIMC - - -
Tax Allowance 1 111 1 046 1 209