Embed Size (px)
Citation preview

1
Transparencia, Gobernanza y Desarrollo: America Latina en Un Marco Empirico Mundial
Daniel Kaufmann, Instituto del Banco Mundialwww.worldbank.org/wbi/governance
www.govindicators.org
Presentacion duranteSemana de Transparencia y Valores Eticos,
organizadoda por FUSADES, FUNDE y TAG/USAID, 3-7 Diciembre, 2007,
San Salvador, El Salvador

2
Puntos Salientes del Marco Empirico• Poder de los Datos: Transparencia, Acceso
a Informacion y Gobernanza son Medibles, se pueden Monitorear
• Centro America y El Salvador en un marcocomparativo internacional: realidadcompleja, hay logros, y desafios
• Transparencia = Gobernanza = Corrupcion, estan ligados, pero nada automatico
• Concretamente para avanzar mas en el futuro -- prioridades para el debate
3
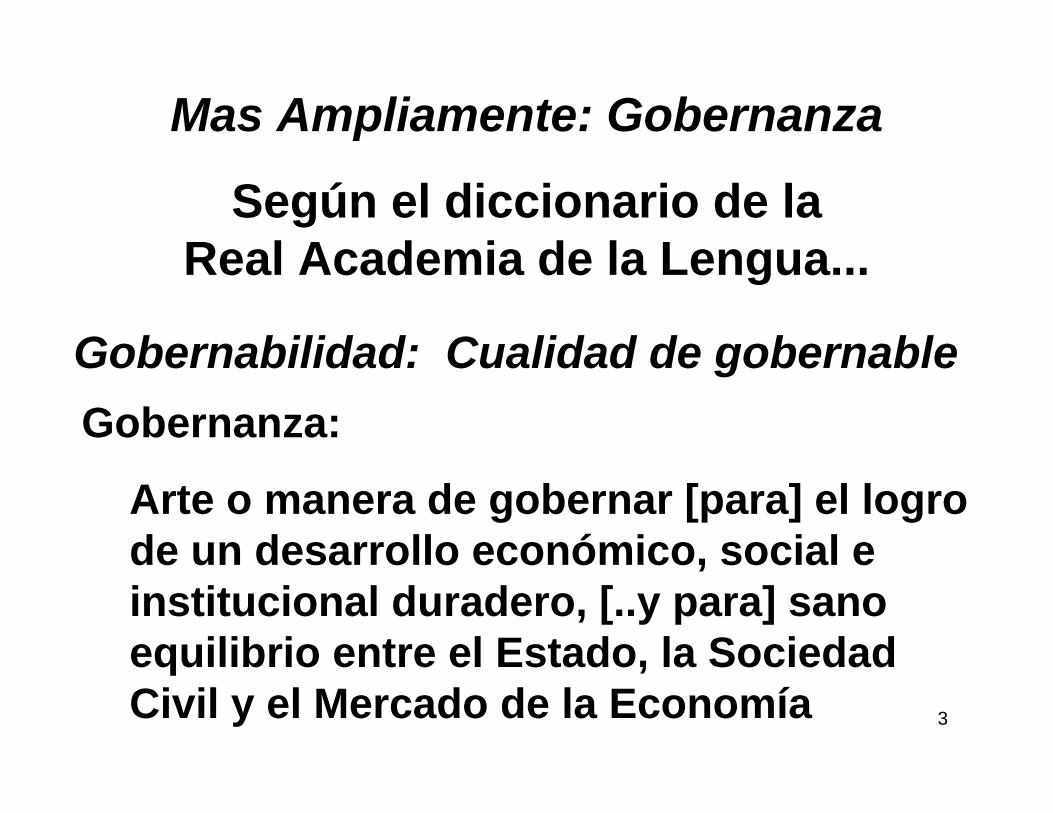
Mas Ampliamente: Gobernanza
Según el diccionario de la Real Academia de la Lengua...
Gobernabilidad: Cualidad de gobernableGobernanza:
Arte o manera de gobernar [para] el logro de un desarrollo económico, social e institucional duradero, [..y para] sano equilibrio entre el Estado, la Sociedad Civil y el Mercado de la Economía

4
El Nivel ‘Macro’ de la Gobernanza
• Definiendo y desagregando sucintamente
• Las 6 dimensiones de Gobernabilidad: como se derivan conceptualmente, como se miden
• El mapa mundial de gobernabilidad, & interactividad web: www.govindicators.org

5
La Multi-Dimensionalidad de Gobernanza
• El proceso por el cual aquellos en autoridad son seleccionados y remplazados– VOZ Y RENDICIÓN DE CUENTAS – ESTABILIDAD POLÍTICA & AUSENCIA DE
VIOLENCIA/TERRORISMO• La capacidad del gobierno para formular e
implementar políticas– EFECTIVIDAD DEL GOBIERNO– CALIDAD REGULATORIA
• Respeto de ciudadanos y el estado a instituciones que gobiernan las interacciones entre ellos – ESTADO DE DERECHO – CONTROL DE LA CORRUPCIÓN
Gobernanza: conjunto de tradiciones e instituciones a través de los cuales se ejercita la autoridad en un país
-- específicamente:

6
Fuentes de Datos de Gobernanza• Cross-Country Surveys of Firms: Global
Competitiveness Survey, World Competitiveness Yearbook, BEEPS
• Cross-Country Surveys of Individuals: Gallup World Poll, Global Corruption Barometer, Latinobarometro, Afrobarometer
• Expert Assessments from Commercial Risk Rating Agencies: Global Insight, Political Risk Services, BERI, Economist Intelligence Unit, Merchant International Group, IJET Travel Consultancy, Asia Risk Consultancy
• Expert Assessments from NGOs, Think Tanks:Reporters Without Borders, Heritage Foundation, Freedom House, Bertelsmann Foundation, Amnesty International, IREX, Global Integrity, Binghamton University, International Budget Project
• Expert Assessments from Governments, Multilaterals:World Bank CPIA, EBRD, AFDB, ADB, State Department, OECD, IFAD

7
Control de la Corrupcion, algunos paises, 2006
-2.5
0
2.5SO
MA
LIA
MY
ANM
AR
EQ. G
UIN
EA
HAIT
I
CAM
BO
DIA
SUD
AN
PAR
AG
UA
Y
KEN
YA
CAM
ERO
ON
CH
INA
ME
XIC
O
BRA
ZIL
EL
SAL
VAD
OR
ITA
LY
SLO
VA
KIA
CO
STA
RIC
A
GR
EEC
E
HUN
GA
RY
SO
UTH
AFR
ICA
URU
GU
AY
BOTS
WA
NA
EST
ONI
A
SLO
VE
NIA
UNIT
ED
STAT
ES
CH
ILE
JAP
AN
SIN
GA
POR
E
NE
W Z
EA
LAN
D
DE
NMA
RK
ICE
LAN
D
FIN
LAN
D
Poor Governance
GovernanceLevel
Margins of Error
Good Governance
DISCLAIMER: The data and research reported here do not reflect the official views of the World Bank, its Executive Directors, or the countries they represent. The WGI are not used by the World Bank Group to allocate resources or for any other official purpose.Source for data: 'Governance Matters VI: Governance Indicators for 1996-2006’, by D. Kaufmann, A. Kraay and M. Mastruzzi, June 2007, www.govindicators.org. Colors are assigned according to the following criteria: Dark Red: country is in the bottom 10th percentile rank (‘governance crisis’); Light Red: between 10th and 25th percentile rank; Orange: between 25th and 50th percentile rank; Yellow, between 50th and 75th; Light Green between 75th and 90th percentile rank; and Dark Green: between 90th and 100th percentile (exemplary governance). Estimates subject to margins of error.

8
Estado de Derecho, 2006
Source for map: 'Governance Matters VI: Governance Indicators for 1996-2006’, by D. Kaufmann, A.Kraay and M. Mastruzzi, June 2007 -www.govindicators.org. Colors are assigned according to the following criteria: Dark Red: country is in the bottom 10th percentile rank (‘governance crisis’); Light Red: between 10th and 25th percentile rank; Orange: between 25th and 50th percentile rank; Yellow, between 50th and 75th; Light Green between 75th and 90th percentile rank; and Dark Green: between 90th and 100th percentile (exemplary governance). Estimates subject to margins of error.

9
Estado de Derecho, 2006: ‘Americas’
Source for data: : 'Governance Matters VI: Governance Indicators for 1996-2006’, D. Kaufmann, A. Kraay and M. Mastruzzi, July 2007(http://www.worldbank.org/wbi/governance/govdata/); Colors are assigned according to the following criteria: Dark Red, bottom 10th percentile rank; Light Red between 10th and 25th ; Orange, between 25th and 50th ; Yellow, between 50th and 75th ; Light Green between 75th and 90th ; Dark Green above 90th.

10
Estado de Derecho, 2006: Centro-America
Source for data: : 'Governance Matters VI: Governance Indicators for 1996-2006’, D. Kaufmann, A. Kraay and M. Mastruzzi, July 2007(http://www.worldbank.org/wbi/governance/govdata/); Colors are assigned according to the following criteria: Dark Red, bottom 10th percentile rank; Light Red between 10th and 25th ; Orange, between 25th and 50th ; Yellow, between 50th and 75th ; Light Green between 75th and 90th ; Dark Green above 90th.

11
Control de la Corrupción, 2006: ‘Americas’
Source for data: : 'Governance Matters VI: Governance Indicators for 1996-2006’, D. Kaufmann, A. Kraay and M. Mastruzzi, July 2007(http://www.worldbank.org/wbi/governance/govdata/); Colors are assigned according to the following criteria: Dark Red, bottom 10th percentile rank; Light Red between 10th and 25th ; Orange, between 25th and 50th ; Yellow, between 50th and 75th ; Light Green between 75th and 90th ; Dark Green above 90th.

12
Control de la Corrupción, 2006: Centro America
Source for data: : 'Governance Matters VI: Governance Indicators for 1996-2006’, D. Kaufmann, A. Kraay and M. Mastruzzi, July 2007(http://www.worldbank.org/wbi/governance/govdata/); Colors are assigned according to the following criteria: Dark Red, bottom 10th percentile rank; Light Red between 10th and 25th ; Orange, between 25th and 50th ; Yellow, between 50th and 75th ; Light Green between 75th and 90th ; Dark Green above 90th.

13
Voz y Rendicion de Cuentas, 2006: ‘Americas’
Source for data: : 'Governance Matters VI: Governance Indicators for 1996-2006’, D. Kaufmann, A. Kraay and M. Mastruzzi, July 2007(http://www.worldbank.org/wbi/governance/govdata/); Colors are assigned according to the following criteria: Dark Red, bottom 10th percentile rank; Light Red between 10th and 25th ; Orange, between 25th and 50th ; Yellow, between 50th and 75th ; Light Green between 75th and 90th ; Dark Green above 90th.

14
Voz y Rendicion de Cuentas, 06: Centro America
Source for data: : 'Governance Matters VI: Governance Indicators for 1996-2006’, D. Kaufmann, A. Kraay and M. Mastruzzi, July 2007(http://www.worldbank.org/wbi/governance/govdata/); Colors are assigned according to the following criteria: Dark Red, bottom 10th percentile rank; Light Red between 10th and 25th ; Orange, between 25th and 50th ; Yellow, between 50th and 75th ; Light Green between 75th and 90th ; Dark Green above 90th.

15
-2
0
2TO
NG
A
ZIM
BABW
E
ERIT
REA
COTE
D'IV
OIR
E
BANG
LADE
SH
BELA
RUS
GAM
BIA
BOLI
VIA
NIC
ARAG
UA
BOTS
WA
NA
IND
IA
ZAM
BIA
DJIB
OUT
I
EL S
ALV
ADO
R
CO
LOM
BIA
TANZ
ANI
A
RWAN
DA
SER
BIA
LIBE
RIA
Major Deterioration
(selected countries)
Major Improvement
(selected countries)
Insignificant Change (selected countries)
Cambios en Control de la Corrupcion, 98-06
Changes were calculated on the basis of the differences in country estimates from 1998 and 2006. Classification for major deteriorations and improvements were based on 75% confidence interval. Source for data: 'Governance Matters VI: Governance Indicators for 1996-2006’, by D. Kaufmann, A.Kraay and M. Mastruzzi, June 2007 - www.govindicators.org

16

17

18

19
2006 Indicadores de Gobernabilidad
20
40
60
80
100
TigresAsiaticos
AmericaLatina
Caribe CentroAmerica
ELSALVADOR
Perc
entil
e R
ank
(0-1
00)
Voz/Rendicion de Cuentas Estado de Derecho Control Corrupcion
Source for data: 'Governance Matters VI: Governance Indicators for 1996-2006’, by D. Kaufmann, A.Kraay and M. Mastruzzi, July 2007 -www.govindicators.org. New Europe Countries: Czech Republic, Estonia, Hungary, Latvia, Lithuania, Poland, Slovak Republic, and Slovenia.

20
2006 Indicadores de Gobernabilidad
0
20
40
60
80
100
CHILE COSTA RICA HONDURAS MEXICO PERU ELSALVADOR
Perc
entil
e R
ank
(0-1
00)
Voz y Rendicion de Cuentas Estado de Derecho Control de la Corrupcion
Source for data: 'Governance Matters VI: Governance Indicators for 1996-2006’, by D. Kaufmann, A.Kraay and M. Mastruzzi, June 2007 - www.govindicators.org.

21
Transparencia Politica e Institucional, 2005
-2.5
0
2.5
ARGENTINA
BRAZIL
CHILE
COSTA RIC
AEL SALVADOR
MEXIC
O
PANAMA
PARAGUAY
PERUVENEZUELA
Tra
nspa
renc
y In
dex
UCM Institutional Transparency
UCM Political Transparency
Source: World Bank Institute, 2005. Index ranges from -2.5 (worst) to 2.5 (best).
High
Low
22
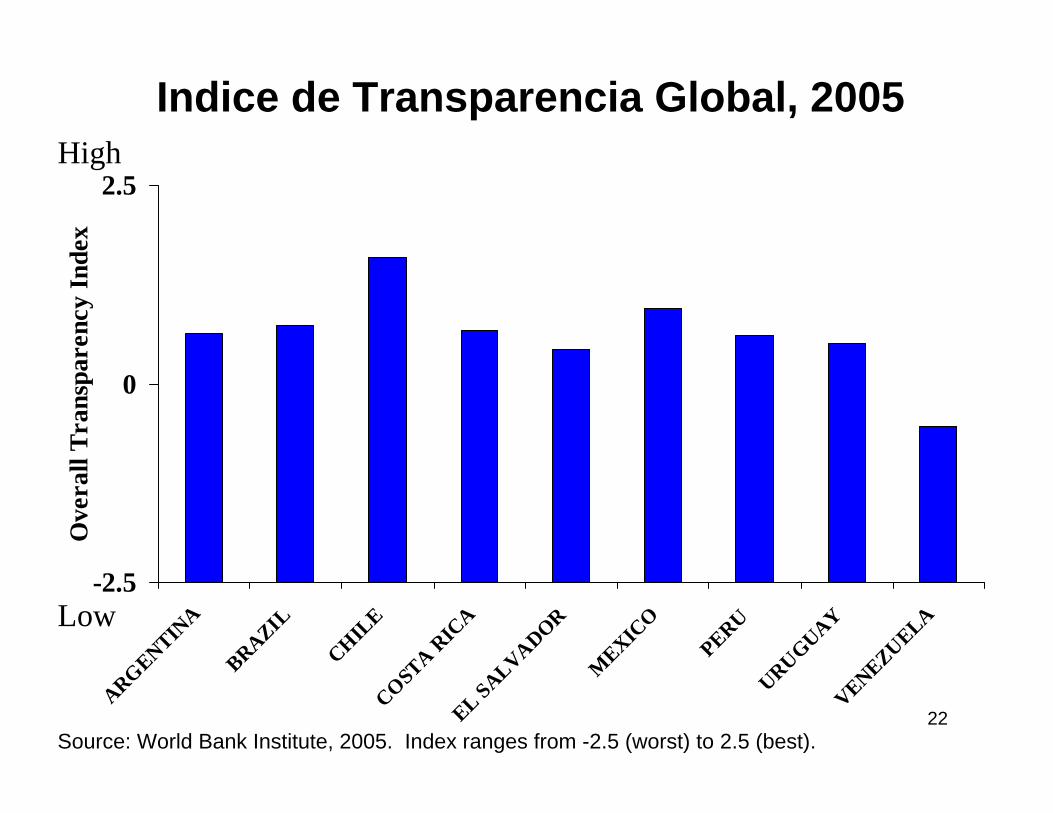
Indice de Transparencia Global, 2005
-2.5
0
2.5
ARGENTINA
BRAZIL
CHILE
COSTA R
ICA
EL SALVADOR
MEXIC
O
PERUURUGUAY
VENEZUELA
Ove
rall
Tran
spar
ency
Inde
x
Source: World Bank Institute, 2005. Index ranges from -2.5 (worst) to 2.5 (best).
High
Low

23
La Gobernanza y Transparencia Importa?‘Dividendo’ Enorme de buena Gobernanza
en el Mediano y Largo Plazo –De la mejor Gobernanza hacia:
• El excelente manejo Macro-Economico• Mas Inversiones (domesticas y FDI) y
mas Crecimiento Economico• Mas Inclusion y Equidad• Mas Competitividad
Cont. Crecimiento….

24
El ‘Dividendo’ de 300% de buena gobernanza1. Amplio Dividendo de Desarrollo de la Buena
Gobernabilidad: una mejora de una desviación estándar en gobernabilidad aumenta los ingresos per cápita en un país alrededor de un 300% en el largo plazo
2. Pero ¿es una disminución tal en la corrupción irrealmente amplia?: NO – una D.E. en Estado de Derecho es la diferencia de: Angola → Brasil →Estonia o Botswana → Canadá
3. El impacto es de gobernabilidad a ingresos, y no al revés -- ingresos más altos por sí mismos no lo lograrán

25
El 300% Dividendo de Desarrollo de mejoras en Gobernanza
Low Rule of Law Medium Rule of Law High Rule of Law
$300
$3,000
$30,000
Data Source for calculations: KK 2004. Y-axis measures predicted GDP per capita on the basis of Instrumental Variable (IV) results for each of the 3 categories. Estimations based on various authors’ studies, including Kaufmann and Kraay.

26
Estado de Derecho y Competitividad
ALB
DZAA R G
AUSAUT
AZE
BHR
BGD
BRB
BEL
BENBOL BIH
BWABRABGR
BFA
BDI
KHMCMR
CAN
TCD
C H L
CHN
COLCRI
HRV CYP
CZE
DOMECU
SLV
EST
ETH
FIN
FRA
GMB
GEO
DEU
GRC
GTM
GUY
HND
HKG
HUNINDIDN
I R L
ISR
ITA
JAM
JPN
JOR
KAZ
KEN
KOR
KWT
KGZ
LVA
LSO
LBY
LTU
LUX
MKD
MDG
MYS
MLI
MLT
MRT
MUSMEX
MDA MNG
MNP
MAR
MOZ
NAM
NPL
NLD
NZL
NIC
NGA
OMN
PAK
PAN
PRY
PER
PHL
POL
PRTPRI
QAT
ROM
RUS
SAU
SEN
YUG
SGP
SVK SVNZAF
ESP
LKA
SUR
SWECHE
SYR
TWN
TJK
TZA
THA
TMP
TTO
TUN
TUR
UGA
UKR
ARE
GBR
USA
URY
UZB
VEN
VNM
ZMB
ZWE
3
4
6
-2 0 2Rule of Law
Glo
bal C
ompe
titiv
e In
dex
Low High
High
r = 0.88
Source: EOS firm survey, WEF Global Competitiveness Survey 2007 & 'Governance Matters VI: Governance Indicators for 1996-2006’, by D. Kaufmann, A.Kraay and M. Mastruzzi, July 2007, www.govindicators.org.

27
Transparencia relacionada con Control de la Corrupción, 2004
DZA
AGO
ARG
AUT
BHR
BGD
BEL
BOL
BIH
BWA
BRABGR
CAN
TCD
CHL
CHN
COL
CRI
HRV
CYP
CZE
DNK
DOM
ECU
EGYSLV
EST
ETH
FIN
FRA
GMBGEO
GHA
GRC
GTMHND
HKG
HUN
ISL
IND
IDN
IRL
ISR
ITA
JAM
JPN
JOR
KEN
KORLVA LTU
LUX
MKD
MDG
MWI
MYS
MLI
MLT
MUS
MEXMAR
MOZ
NAM
NLD
NZL
NIC
NGA
NOR
PAK
PAN
PRY
PERPHL
POL
PRT
ROM
RUS
YUG
SGP
SVK
SVN
ZAF
ESP
LKA
SWECHE
TWN
TZA
THA
TTO
TUN
TUR
UGA UKR
ARE
GBR
USA
URY
VENVNM
ZMB
ZWE
-2
-1
0
1
2
3
-2 1 3Calidad Transparencia
Con
trol
de
Cor
rupt
ion
Low
Low High
High r = 0.79
Source: World Bank Institute, 2004.

28
Transparencia relacionada con Ingresos per capita
DZA
AGO
ARG
AUT
BHR
BGD
BEL
BOL
BIH
BWABRA
BGR
CAN
TCD
CHL
CHN
COLCRI
HRV
CYPCZE
DNK
DOMECUEGYSLV
EST
ETH
FINFRA
GMB
GEO
GHA
GRC
GTM
HND
HKG
HUN
ISL
IND
IDN
IRLISR
ITA
JAM
JPN
JOR
KEN
KOR
LVA LTU
LUX
MKD
MDGMWI
MYS
MLI
MLTMUS
MEX
MAR
MOZ
NAM
NLD
NZL
NIC
NGA
NOR
PAK
PANPRY
PER
PHL
POL
PRT
ROM
RUS
YUG
SGP
SVK
SVN
ZAF
ESP
LKA
SWECHE
TWN
TZA
THA
TTO
TUNTUR
UGA
UKR
AREGBR
USA
URY
VEN
VNM
ZMB
ZWE
-2 1 3Calidad Transparencia
Inco
me
per c
apita
(PPP
, log
)
Low High
$30,000
r = 0.74
Source: World Bank Institute, 2004.
$300
$3,000

29
0
25
50
75
100
Labor
Infra
structu
reBurea
ucracy
Educate
d Wor
kforce
Govern
ment in
stabil
ity
Crime
Corru
ption
Tax ra
tes
Infla
tion
America Latina Central America El Salvador
% de firmas reportan traba muy importante (top 3):
Obstaculos a las Empresas, America Latina, 2006
Source: EOS 2006. Question: Select among the above 14 constraints the five most problematic factors for doing business in your country.
30
0
20
40
60
80
100
Argentina Chile Costa Rica ElSalvador
Ireland Mexico Peru Slovakia
Inde
x of
Doi
ng B
usin
ess
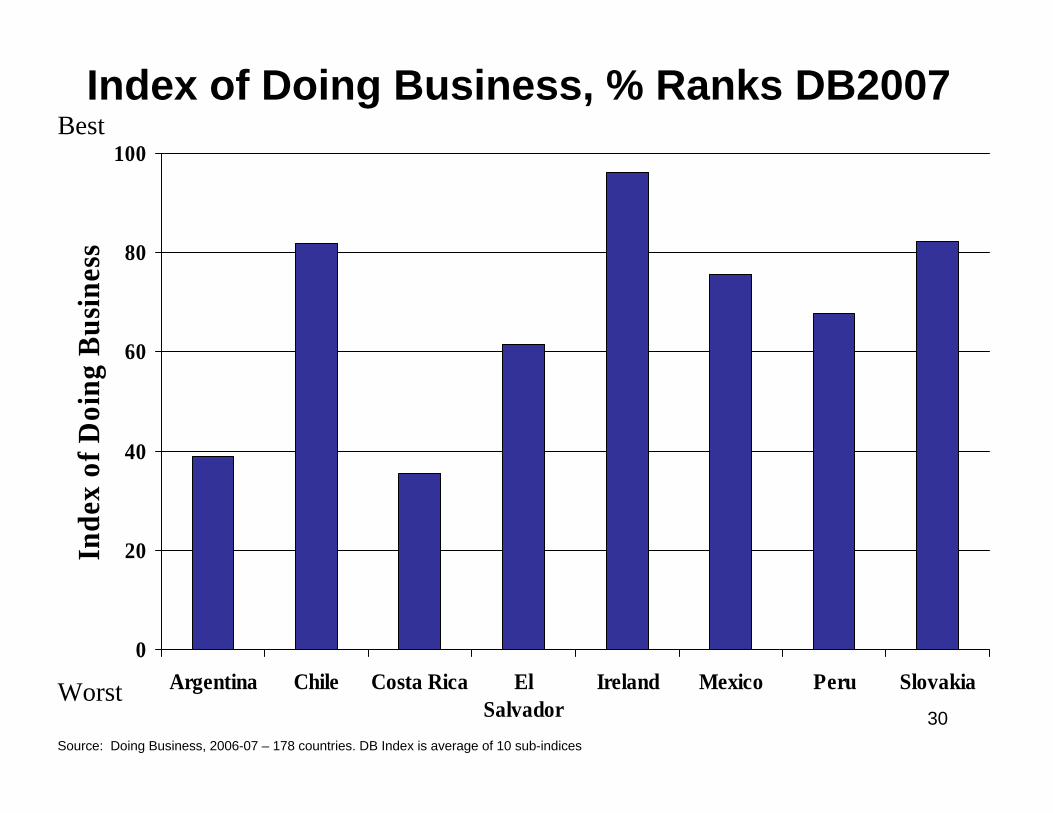
Index of Doing Business, % Ranks DB2007
Source: Doing Business, 2006-07 – 178 countries. DB Index is average of 10 sub-indices
Best
Worst

31
0
20
40
60
80
100
East Asia NICs Latin America Central America Newly AccessedEU
El Salvador
2003 2006
% empresas satisfechasEficacia de la Policia, EOS 2003-6
Source: EOS firm survey, WEF2003-06.

32
0
20
40
60
80
100
Latin America Costa Rica El Salvador Honduras Mexico
Freq
uenc
y of
Bri
bery
Licencias Coneccion a servicios publicosImpuestos Licitaciones publicasPoder Judicial Capture
El Salvador en una perspectiva comparativainternacional, Frecuencia de sobornos, EOS 2006
% Firmas que reportan frecuentes sobornos
Source: EOS firm survey, WEF2006 – 126 countries. Question: In your industry, how commonly firms make undocumented extra payments or bribes connected with permits / utilities / taxation / awarding of public contracts / judiciary? (common…never occurs).
Sobornos en:

33
Algunas lecciones de evidencia mundial1. Gobernanza es Medible: y medicion rigurosa,
sin sesgos, crucial para los reformistas2. Buena Gobernanza crucial para manejo Macro,
Crecimiento, Competitividad e Inclusion 3. La Gobernanza puede cambiar rapidamente:
mejoras y bajas en una decada, y suma varianzamundialmente en las tendencias (incentivos)
4. No funciona: Cortoplazismo, Parcialismo, Incrementalismo, y mas Leyes, IntervencionesRegulatorias y Comisiones (Etica, etc.)
5. Si funciona – algunas medidas audaces y profundas, cambiando incentivos: participacion + transparencia + marco de la ley
34
Ciertas Lecciones Generales Aprendidas sobre implementación Acceso Información
• Ambicion + Pragmatismo, sin Perfeccionismo• Informacion Difundida Proactivamente• Convertir Ley e Implementacion en Herramienta Util para Funcionario• Marco Institucional de Implementacion• Alianzas con otros actores -- especialmente con la Sociedad Civil, organismos publicos y los Medios

35
Sobre Transparencia y Derecho a la Informacion
• Ley de Acceso a Informacion: Importante• Mas alla de Acceso a Informacion:
Derecho a la Informacion• Mas alla de Derecho a la Informacion:
Transparencia + Rendicion de Cuentas del gobierno a los ciudadanos
• Cambio de enfoque, de mentalidad: Info• Ejemplo Mexico -- IFAE: labor ejemplar;
enfasis en reformas concretas al nivellocal/estatal; INFODF, reformaconstitucional importante Cont.

36
Program de Reformas Concretas: Transparencia1. Declaración Pública (con facil acceso) de Activos de
Politicos, Candidatos, Funcionarios Públicos, Legisladores, Jueces, y dependientes
2. Declaración Pública de contribuciones a Campañas Políticas por individuos y empresas, y tambien de gastos de campaña
3. Acceso publico inmediato a los Votos Parlamentarios, y a las deliberaciones borradores/propuestas de ley
4. Implementación Efectiva de Leyes de Conflicto de Intereses y Ley de Lobby, separando negocios, política, gobierno
5. Iniciativas concretas sobre el Sector Privado, incl. listado negro público de empresas que han sobornado
6. Implementación Ley de Libertad de Información7. Transparencia presupuestaria: centro y nivel local (web)8. Todas las Licitaciones en el web y competitivas9. Libertad de Prensa y de los Medios, sin trabas.10. Transparencia en materia de Datos, incluyendo Diagnosticos

37
El Salvador comparativo en Ingreso por capita 1980-2006 (in PPP Constant 2000 dollars)
0
5,000
10,000
15,000
20,000
25,000
30,000
35,000
40,000
45,000
1980 1985 1990 1995 2000 2005
Inco
me
per c
apita
(PPP
) Chile El Salvador Irlanda
Source for data: WDI 1980-2006. GDP per capita based on purchasing power parity (PPP). Data are in constant 2000 international dollars.

38
Datos para Analizar e Informar Consejos sobre Políticas; No para Clasificaciones Precisas
Todo dato de Gobernabilidad, Instituciones y Clima de Inversión está sujeto a un margen de error. Su objetivo no es clasificar países precisamente, sino investigar e ilustrar
fortalezas y debilidades relativas, y obtener lecciones analíticas. Los datos presentados aquí y en el reporte no
reflejan necesariamente opiniones oficiales sobre clasificaciones del Banco Mundial o su Junta Directiva.
Errores responsabilidad del autor. Los indicadores en esta presentacion refleja colaboracion con A. Kraay, M.
Mastruzzi, Ana Bellver y Marco Mendiburi.Materiales adicionales & acceso a datos interactivos:
General: www.worldbank.org/wbi/governanceDatos: www.govindicators.org