Embed Size (px)
Citation preview
Travel Model Two Development: Verification of
Model Mechanics
Technical Paper
Metropolitan Transportation Commission with Parsons Brinckerhoff, Inc.
January 26, 2015
i
Table of Contents
1 Introduction ....................................................................................................................................... 1
2 Networks ........................................................................................................................................... 2
2.1 Non-Motorized Network ........................................................................................................... 2
2.2 Highway Network ..................................................................................................................... 4
2.3 Transit Network ........................................................................................................................ 8
3 Non-Motorized Skims ..................................................................................................................... 10
3.1 Pedestrian and Bike MAZ-MAZ and MAZ-TAP, Bike TAZ-TAZ, Ped TAP-TAP .............. 10
4 Airport Trips ................................................................................................................................... 16
5 Motorized Skims ............................................................................................................................. 18
5.1 MAZ-MAZ ............................................................................................................................. 18
5.2 TAZ-TAZ ................................................................................................................................ 20
5.3 TAZ-TAP ................................................................................................................................ 25
6 Transit Skims .................................................................................................................................. 27
7 CT-RAMP ....................................................................................................................................... 47
8 Internal-External Trips .................................................................................................................... 53
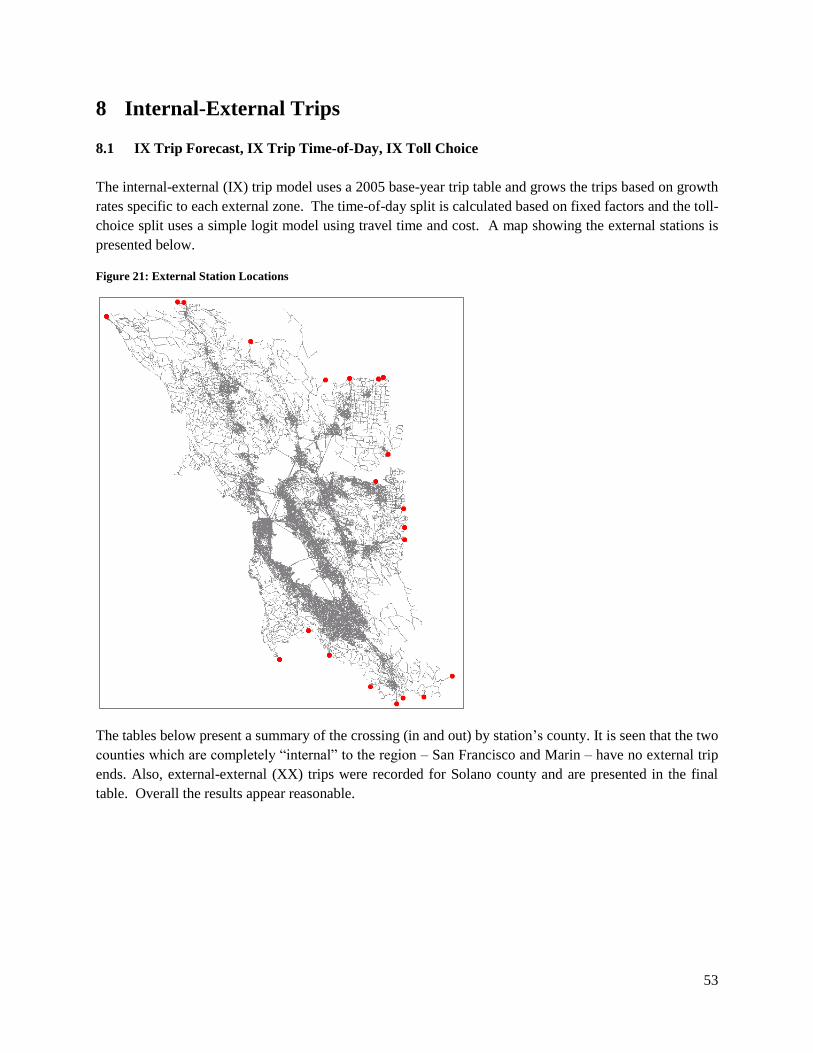
8.1 IE Trip Forecast, IE Trip Time-of-Day, IE Toll Choice ......................................................... 53
9 Truck Trips ...................................................................................................................................... 56
9.1 Truck Trip Generation, Distribution, Time-of-Day, and Toll Choice..................................... 56
10 Highway Assignment .................................................................................................................. 58
11 Transit Assignment ..................................................................................................................... 67
12 Model Runtimes .......................................................................................................................... 80
13 Conclusions ................................................................................................................................. 82
ii
List of Tables
Table 1 : Cross-Tabulation of CNTYPE by Facility Type for Pedestrian Network .................................. 2
Table 2 : Total Pedestrian Network Length by Facility Type ....................................................................... 3
Table 3 : Total Pedestrian Network Length by CNTYPE ............................................................................. 3
Table 4 : Cross-Tabulation of CNTYPE by Facility Type for Bicycle Network .......................................... 3
Table 5 : Total Bicycle Network Length by Facility Type ........................................................................... 4
Table 6 : Total Bicycle Network Length by CNTYPE ................................................................................. 4
Table 7: Cross-Tabulation of Facility Type by Area Type for the Highway Network ................................. 5
Table 8 : Cross-Tabulation of Facility Type by Free Flow Speed for the Highway Network ...................... 5
Table 9 : Cross-Tabulation of Facility Type by CNTYPE for the Highway Network ................................. 6
Table 10 : Average Free Flow Speed by Facility Type for the Highway Network ...................................... 7
Table 11 : Total Highway Network Length by Facility Type ....................................................................... 7
Table 12 : Total Highway Network Length by Area Type ........................................................................... 7
Table 13 : Transit Network Statistics by Time Period [Route Bundles in millions] .................................... 9
Table 14 : Non-Motorized Skim Summaries .............................................................................................. 14
Table 15 : Airport Model Trips by Mode and Airport ................................................................................ 16
Table 16 : Comparison of MAZ to MAZ Euclidean and Motorized Skimmed Distances .......................... 20
Table 17 : TAZ to TAZ Motorized Skim Summaries by Mode and Time Period ...................................... 21
Table 18A : Google Maps Drive Distance Between Selected Locations .................................................... 23
Table 19A : Google Maps Drive Time Between Selected Locations ......................................................... 24
Table 20 : TAZ-TAP Skim Summaries by Mode and Time Period ........................................................... 26
Table 21 : Transit Skim Settings ................................................................................................................. 27
Table 22: TAP-TAP SET1 Local Transit Skim Summaries by Time Period ............................................. 29
Table 23: TAP-TAP SET2 Local + Premium Transit Skim Summaries by Time Period .......................... 30
Table 24 : TAP-TAP SET2 Local + Premium Transit Skim Summaries by Time Period ........................ 31
Table 25 : Tour and Trip Summaries for Individual and Joint Tours ........................................................ 47
Table 26 : Individual tours by tour mode and tour purpose ....................................................................... 49
Table 27 : Individual trips by trip mode and tour purpose ......................................................................... 50
Table 28 : Joint tours by tour mode and tour purpose................................................................................ 51
Table 29 : Joint trips by trip mode and tour purpose ................................................................................. 52
Table 30 : Internal-External Trips by External Station .............................................................................. 54
Table 31 : External-Internal Trips by External Station .............................................................................. 54
Table 32 : External-External Trips by External Station ............................................................................. 55
iii
Table 33 : Truck Model Production, Attraction, and Trips by Mode ........................................................ 56
Table 34 : Zero-Volume Link Count Summary by Facility Type ............................................................. 59
Table 35 : Highway Assignment Vehicle Miles Travelled Summary by County and Time Period .......... 66
Table 36 : Transit Assignment Passenger Summary by Time Period ........................................................ 68
Table 37a: EA Transit Assignment Summary by Line Mode .................................................................... 70
Table 38a: AM Transit Assignment Summary by Line Mode ................................................................... 72
Table 39a: MD Transit Assignment Summary by Line Mode ................................................................... 74
Table 40a: PM Transit Assignment Summary by Line Mode ................................................................... 76
Table 41a: EV Transit Assignment Summary by Line Mode .................................................................... 78
Table 42 : Model Runtime Summary for Two-Feedback Iteration Model Run ......................................... 80
iv
List of Figures
Figure 1: Shortest Pedestrian Path from MAZ 514936 to MAZ 518648 .................................................... 10
Figure 2: Shortest Pedestrian Path from MAZ 10775 to MAZ 10767 ........................................................ 11
Figure 3: Shortest Bicycle Path from MAZ 211364 to MAZ 216486 ........................................................ 11
Figure 4: Shortest Bicycle Path from MAZ 10775 to MAZ 15722 ............................................................ 12
Figure 5: Shortest Bicycle Path from TAZ 400113 to TAZ 400166 .......................................................... 12
Figure 6: Shortest Bicycle Path from TAZ 200879 to TAZ 700165 .......................................................... 13
Figure 7: Pedestrian Shortest Path from TAP 590002 to TAP 590244 ................................................. 15
Figure 8: Trip Distance Distribution for Airport Trips ............................................................................... 16
Figure 9: Trip Time Distribution for Airport Trips ..................................................................................... 17
Figure 10: Drive Shortest Path for MAZ 328837 to MAZ 329032 ............................................................ 18
Figure 11: Drive Shortest Path for MAZ 12400 to MAZ 12303 ................................................................ 19
Figure 12: Transit Skim Settings ................................................................................................................ 28
Figure 13: TAPs accessible from Trans Bay Terminal [603] in AM Period .............................................. 33
Figure 14: TAPs accessible from a Local TAP close to Trans Bay Terminal [487] in AM Period ............ 34
Figure 15: TAPs accessible from Berkeley [4117] in PM Period ............................................................... 35
Figure 16: TAPs accessible from Central San Jose [2845] in PM Period................................................... 36
Figure 17a: Berkeley to San Francisco [MODEL] ..................................................................................... 38
Figure 18a: San Francisco Financial District to San Francisco Diamond Heights [MODEL] ................... 40
Figure 19a: San Francisco to Richmond [MODEL] ................................................................................... 42
Figure 20a: An example short transit trip produced by the model [MODEL] ............................................ 44
Figure 21: External Station Locations ........................................................................................................ 53
Figure 22: Truck Trip Distance Distribution by Mode ............................................................................... 57
Figure 23: Truck Trip Time Distribution by Mode ..................................................................................... 57
Figure 24: AM Highway Assignment Network Usage.............................................................................. 60
Figure 25: AM Highway Assignment Network Usage for San Francisco Peninsula .............................. 61
Figure 26: AM Highway Assignment Network Usage for Bay Bridge Interchange in San Francisco .. 62
Figure 27: Network Volume Map Legend ................................................................................................ 62
Figure 28: AM Peak Highway Assignment Volume Summary for Bay Bridge Interchange in San
Francisco ..................................................................................................................................................... 63
Figure 29: AM Peak Highway Assignment Volume Summary for Richmond-San Rafael Bridge
Interchange in San Rafael ........................................................................................................................... 64
v
Figure 30: AM Peak Highway Assignment Volume Summary for SJC Airport Area (SJC is “blank” area
in center of map) ......................................................................................................................................... 65
1
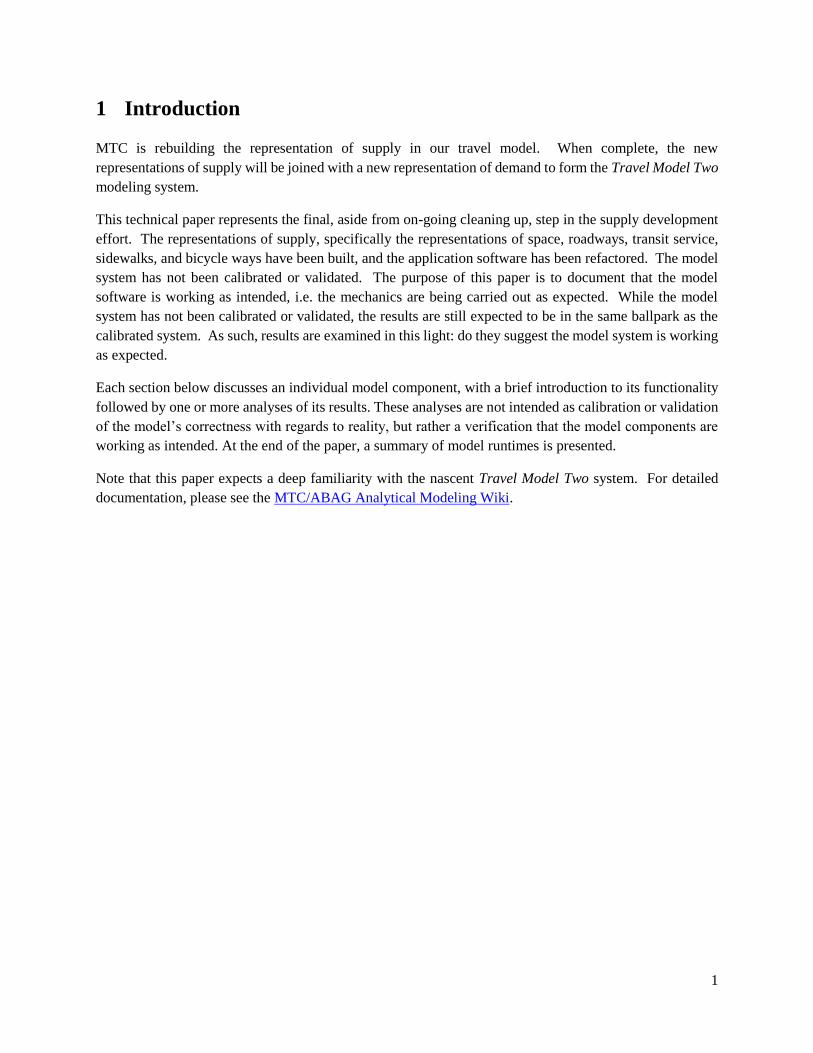
1 Introduction
MTC is rebuilding the representation of supply in our travel model. When complete, the new
representations of supply will be joined with a new representation of demand to form the Travel Model Two
modeling system.
This technical paper represents the final, aside from on-going cleaning up, step in the supply development
effort. The representations of supply, specifically the representations of space, roadways, transit service,
sidewalks, and bicycle ways have been built, and the application software has been refactored. The model
system has not been calibrated or validated. The purpose of this paper is to document that the model
software is working as intended, i.e. the mechanics are being carried out as expected. While the model
system has not been calibrated or validated, the results are still expected to be in the same ballpark as the
calibrated system. As such, results are examined in this light: do they suggest the model system is working
as expected.
Each section below discusses an individual model component, with a brief introduction to its functionality
followed by one or more analyses of its results. These analyses are not intended as calibration or validation
of the model’s correctness with regards to reality, but rather a verification that the model components are
working as intended. At the end of the paper, a summary of model runtimes is presented.
Note that this paper expects a deep familiarity with the nascent Travel Model Two system. For detailed
documentation, please see the MTC/ABAG Analytical Modeling Wiki.
2
2 Networks
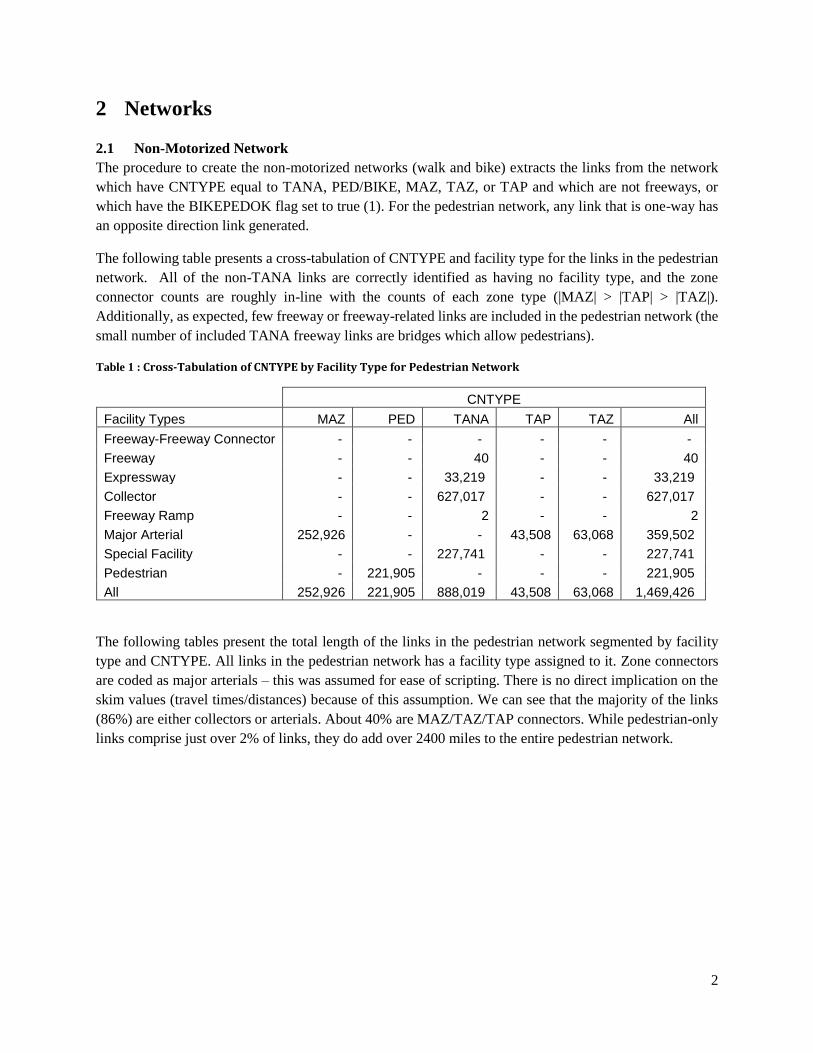
2.1 Non-Motorized Network
The procedure to create the non-motorized networks (walk and bike) extracts the links from the network
which have CNTYPE equal to TANA, PED/BIKE, MAZ, TAZ, or TAP and which are not freeways, or
which have the BIKEPEDOK flag set to true (1). For the pedestrian network, any link that is one-way has
an opposite direction link generated.
The following table presents a cross-tabulation of CNTYPE and facility type for the links in the pedestrian
network. All of the non-TANA links are correctly identified as having no facility type, and the zone
connector counts are roughly in-line with the counts of each zone type (|MAZ| > |TAP| > |TAZ|).
Additionally, as expected, few freeway or freeway-related links are included in the pedestrian network (the
small number of included TANA freeway links are bridges which allow pedestrians).
Table 1 : Cross-Tabulation of CNTYPE by Facility Type for Pedestrian Network
CNTYPE
Facility Types MAZ PED TANA TAP TAZ All
Freeway-Freeway Connector - - - - - -
Freeway - - 40 - - 40
Expressway - - 33,219 - - 33,219
Collector - - 627,017 - - 627,017
Freeway Ramp - - 2 - - 2
Major Arterial 252,926 - - 43,508 63,068 359,502
Special Facility - - 227,741 - - 227,741
Pedestrian - 221,905 - - - 221,905
All 252,926 221,905 888,019 43,508 63,068 1,469,426
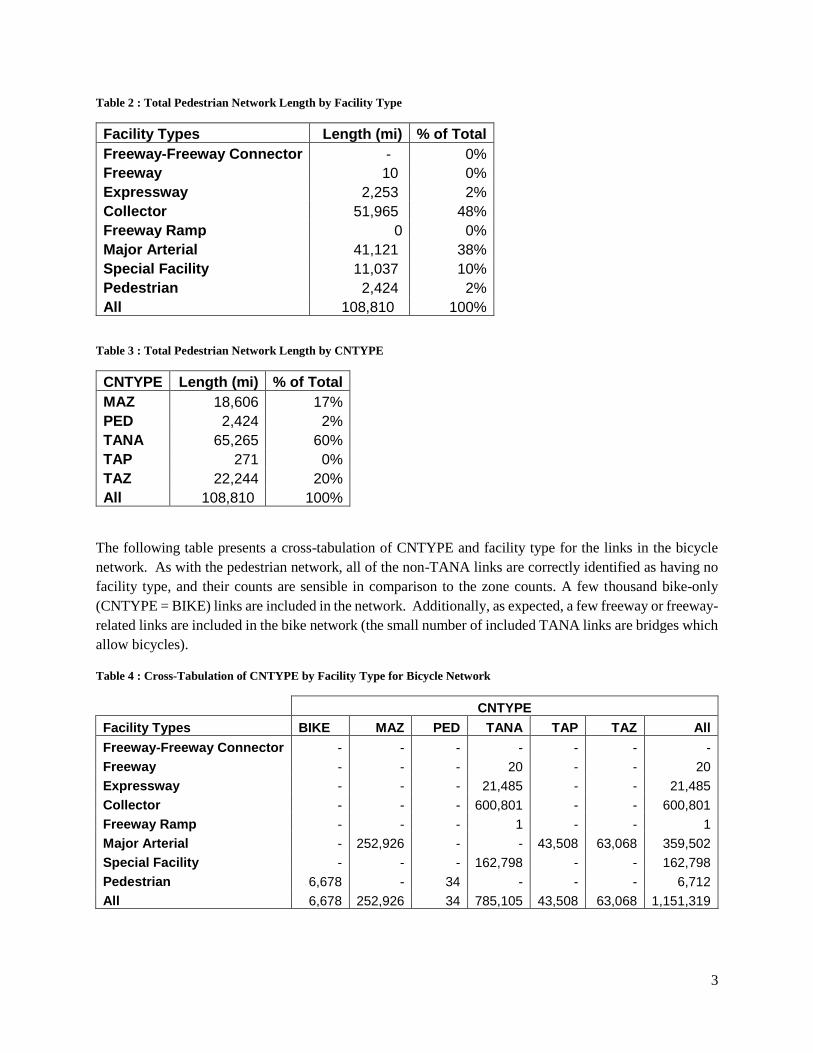
The following tables present the total length of the links in the pedestrian network segmented by facility
type and CNTYPE. All links in the pedestrian network has a facility type assigned to it. Zone connectors
are coded as major arterials – this was assumed for ease of scripting. There is no direct implication on the
skim values (travel times/distances) because of this assumption. We can see that the majority of the links
(86%) are either collectors or arterials. About 40% are MAZ/TAZ/TAP connectors. While pedestrian-only
links comprise just over 2% of links, they do add over 2400 miles to the entire pedestrian network.
3
Table 2 : Total Pedestrian Network Length by Facility Type
Facility Types Length (mi) % of Total
Freeway-Freeway Connector - 0%
Freeway 10 0%
Expressway 2,253 2%
Collector 51,965 48%
Freeway Ramp 0 0%
Major Arterial 41,121 38%
Special Facility 11,037 10%
Pedestrian 2,424 2%
All 108,810 100%
Table 3 : Total Pedestrian Network Length by CNTYPE
CNTYPE Length (mi) % of Total
MAZ 18,606 17%
PED 2,424 2%
TANA 65,265 60%
TAP 271 0%
TAZ 22,244 20%
All 108,810 100%
The following table presents a cross-tabulation of CNTYPE and facility type for the links in the bicycle
network. As with the pedestrian network, all of the non-TANA links are correctly identified as having no
facility type, and their counts are sensible in comparison to the zone counts. A few thousand bike-only
(CNTYPE = BIKE) links are included in the network. Additionally, as expected, a few freeway or freeway-
related links are included in the bike network (the small number of included TANA links are bridges which
allow bicycles).
Table 4 : Cross-Tabulation of CNTYPE by Facility Type for Bicycle Network
CNTYPE
Facility Types BIKE MAZ PED TANA TAP TAZ All
Freeway-Freeway Connector - - - - - - -
Freeway - - - 20 - - 20
Expressway - - - 21,485 - - 21,485
Collector - - - 600,801 - - 600,801
Freeway Ramp - - - 1 - - 1
Major Arterial - 252,926 - - 43,508 63,068 359,502
Special Facility - - - 162,798 - - 162,798
Pedestrian 6,678 - 34 - - - 6,712
All 6,678 252,926 34 785,105 43,508 63,068 1,151,319
4
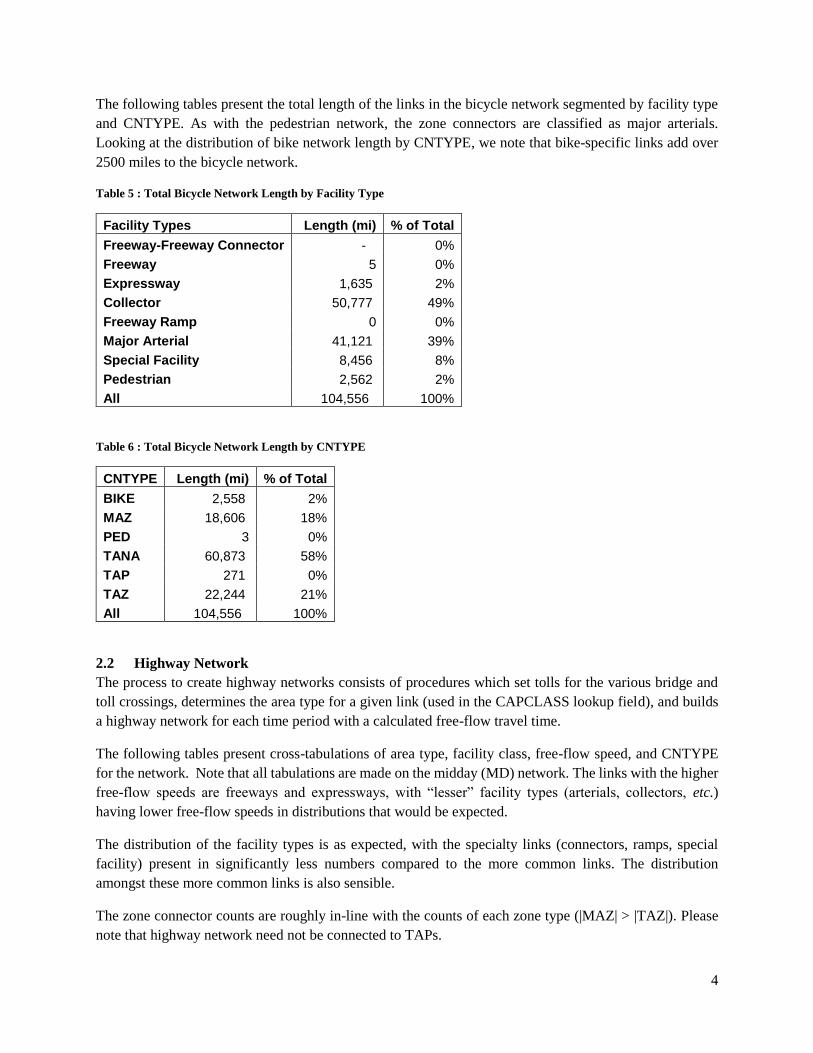
The following tables present the total length of the links in the bicycle network segmented by facility type
and CNTYPE. As with the pedestrian network, the zone connectors are classified as major arterials.
Looking at the distribution of bike network length by CNTYPE, we note that bike-specific links add over
2500 miles to the bicycle network.
Table 5 : Total Bicycle Network Length by Facility Type
Facility Types Length (mi) % of Total
Freeway-Freeway Connector - 0%
Freeway 5 0%
Expressway 1,635 2%
Collector 50,777 49%
Freeway Ramp 0 0%
Major Arterial 41,121 39%
Special Facility 8,456 8%
Pedestrian 2,562 2%
All 104,556 100%
Table 6 : Total Bicycle Network Length by CNTYPE
CNTYPE Length (mi) % of Total
BIKE 2,558 2%
MAZ 18,606 18%
PED 3 0%
TANA 60,873 58%
TAP 271 0%
TAZ 22,244 21%
All 104,556 100%
2.2 Highway Network
The process to create highway networks consists of procedures which set tolls for the various bridge and
toll crossings, determines the area type for a given link (used in the CAPCLASS lookup field), and builds
a highway network for each time period with a calculated free-flow travel time.
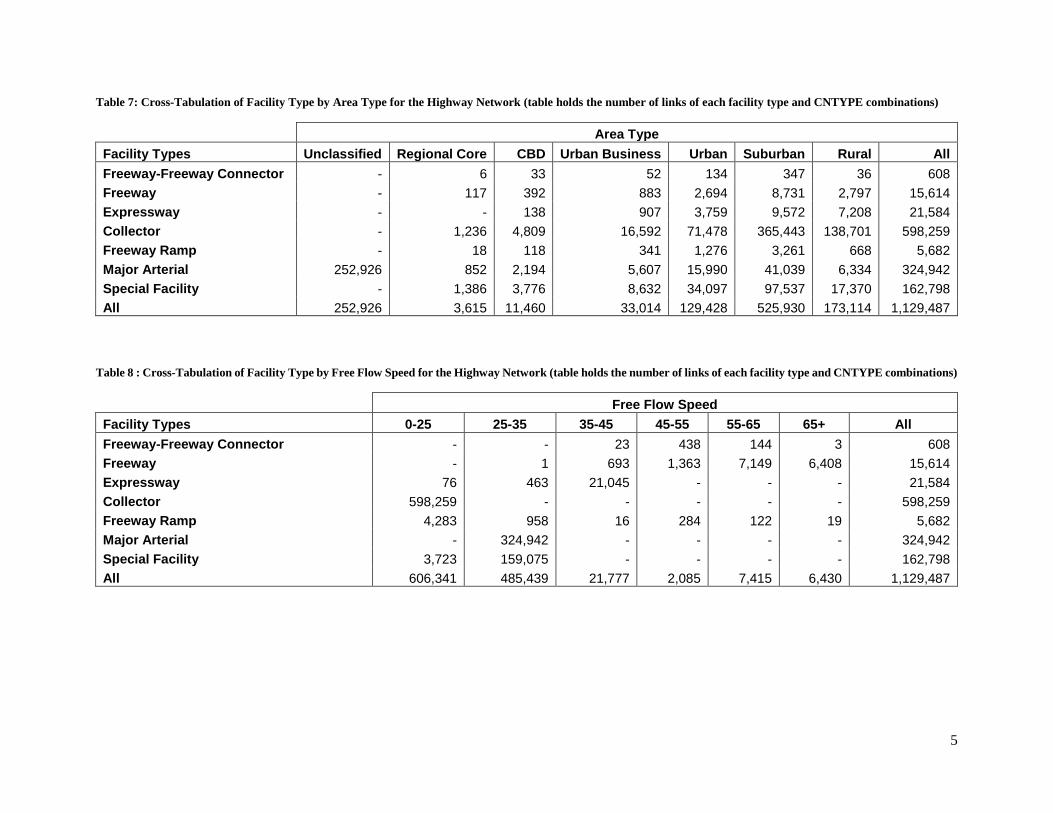
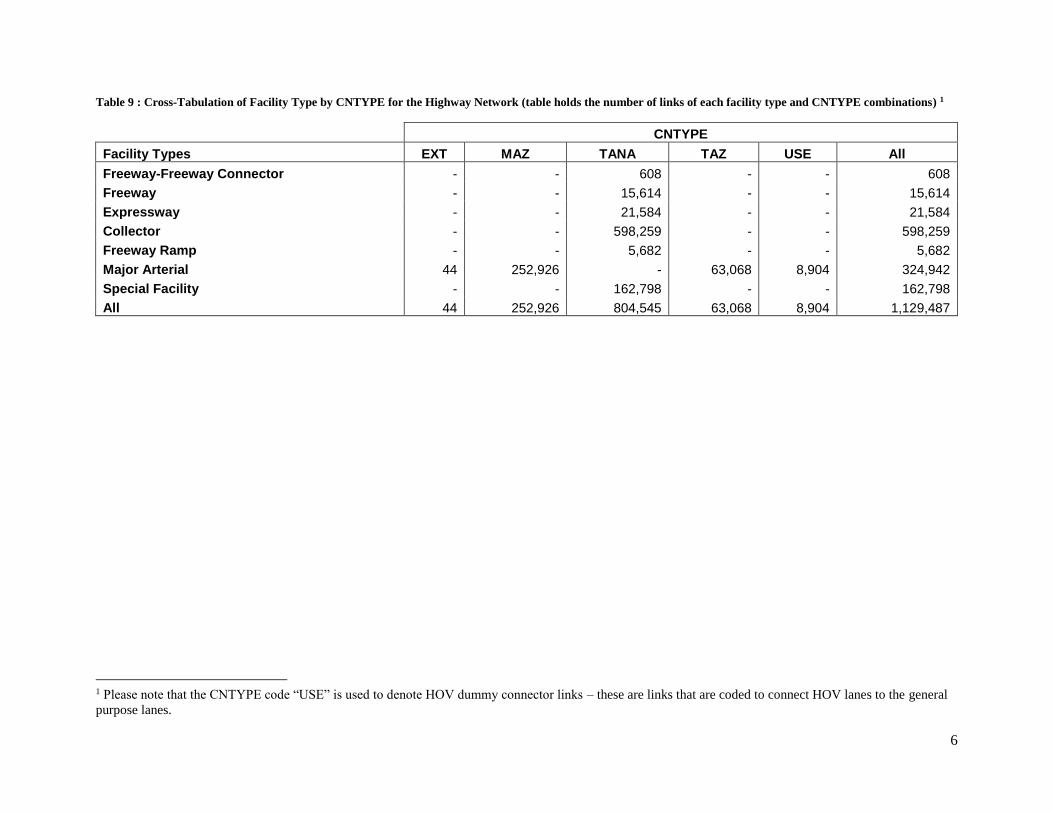
The following tables present cross-tabulations of area type, facility class, free-flow speed, and CNTYPE
for the network. Note that all tabulations are made on the midday (MD) network. The links with the higher
free-flow speeds are freeways and expressways, with “lesser” facility types (arterials, collectors, etc.)
having lower free-flow speeds in distributions that would be expected.
The distribution of the facility types is as expected, with the specialty links (connectors, ramps, special
facility) present in significantly less numbers compared to the more common links. The distribution
amongst these more common links is also sensible.
The zone connector counts are roughly in-line with the counts of each zone type (|MAZ| > |TAZ|). Please
note that highway network need not be connected to TAPs.
5
Table 7: Cross-Tabulation of Facility Type by Area Type for the Highway Network (table holds the number of links of each facility type and CNTYPE combinations)
Area Type
Facility Types Unclassified Regional Core CBD Urban Business Urban Suburban Rural All
Freeway-Freeway Connector - 6 33 52 134 347 36 608
Freeway - 117 392 883 2,694 8,731 2,797 15,614
Expressway - - 138 907 3,759 9,572 7,208 21,584
Collector - 1,236 4,809 16,592 71,478 365,443 138,701 598,259
Freeway Ramp - 18 118 341 1,276 3,261 668 5,682
Major Arterial 252,926 852 2,194 5,607 15,990 41,039 6,334 324,942
Special Facility - 1,386 3,776 8,632 34,097 97,537 17,370 162,798
All 252,926 3,615 11,460 33,014 129,428 525,930 173,114 1,129,487
Table 8 : Cross-Tabulation of Facility Type by Free Flow Speed for the Highway Network (table holds the number of links of each facility type and CNTYPE combinations)
Free Flow Speed
Facility Types 0-25 25-35 35-45 45-55 55-65 65+ All
Freeway-Freeway Connector - - 23 438 144 3 608
Freeway - 1 693 1,363 7,149 6,408 15,614
Expressway 76 463 21,045 - - - 21,584
Collector 598,259 - - - - - 598,259
Freeway Ramp 4,283 958 16 284 122 19 5,682
Major Arterial - 324,942 - - - - 324,942
Special Facility 3,723 159,075 - - - - 162,798
All 606,341 485,439 21,777 2,085 7,415 6,430 1,129,487
6
Table 9 : Cross-Tabulation of Facility Type by CNTYPE for the Highway Network (table holds the number of links of each facility type and CNTYPE combinations) 1
CNTYPE
Facility Types EXT MAZ TANA TAZ USE All
Freeway-Freeway Connector - - 608 - - 608
Freeway - - 15,614 - - 15,614
Expressway - - 21,584 - - 21,584
Collector - - 598,259 - - 598,259
Freeway Ramp - - 5,682 - - 5,682
Major Arterial 44 252,926 - 63,068 8,904 324,942
Special Facility - - 162,798 - - 162,798
All 44 252,926 804,545 63,068 8,904 1,129,487
1 Please note that the CNTYPE code “USE” is used to denote HOV dummy connector links – these are links that are coded to connect HOV lanes to the general
purpose lanes.
7
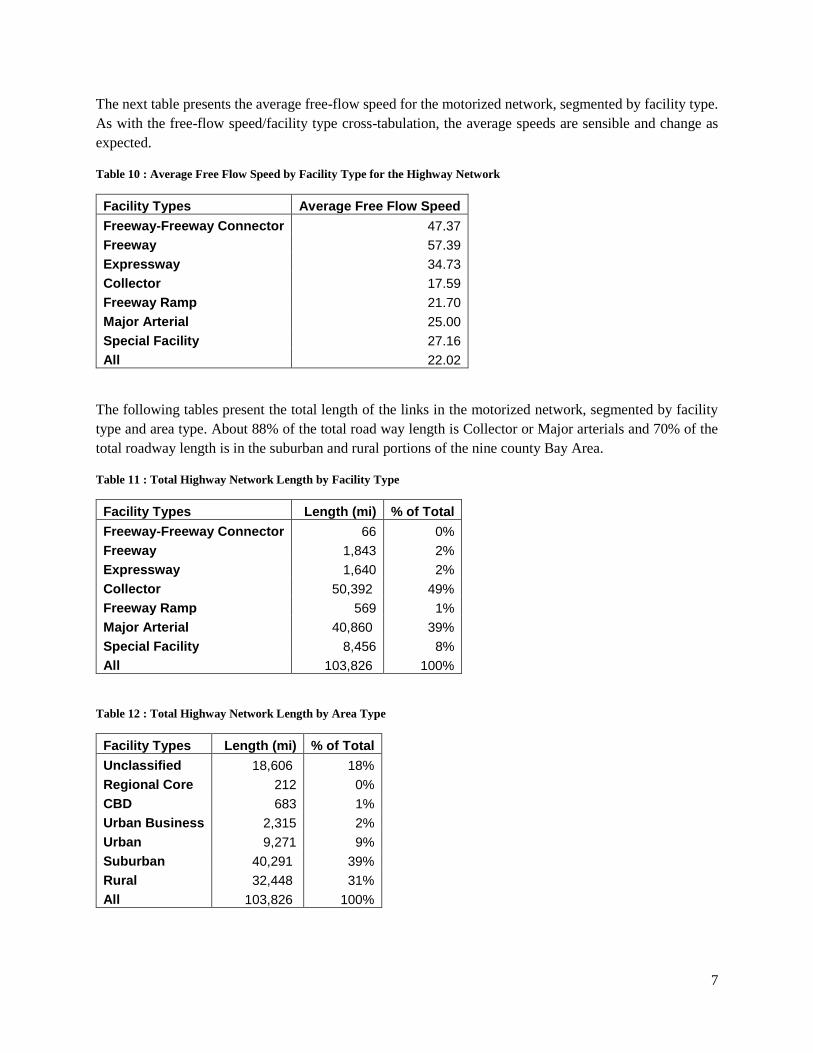
The next table presents the average free-flow speed for the motorized network, segmented by facility type.
As with the free-flow speed/facility type cross-tabulation, the average speeds are sensible and change as
expected.
Table 10 : Average Free Flow Speed by Facility Type for the Highway Network
Facility Types Average Free Flow Speed
Freeway-Freeway Connector 47.37
Freeway 57.39
Expressway 34.73
Collector 17.59
Freeway Ramp 21.70
Major Arterial 25.00
Special Facility 27.16
All 22.02
The following tables present the total length of the links in the motorized network, segmented by facility
type and area type. About 88% of the total road way length is Collector or Major arterials and 70% of the
total roadway length is in the suburban and rural portions of the nine county Bay Area.
Table 11 : Total Highway Network Length by Facility Type
Facility Types Length (mi) % of Total
Freeway-Freeway Connector 66 0%
Freeway 1,843 2%
Expressway 1,640 2%
Collector 50,392 49%
Freeway Ramp 569 1%
Major Arterial 40,860 39%
Special Facility 8,456 8%
All 103,826 100%
Table 12 : Total Highway Network Length by Area Type
Facility Types Length (mi) % of Total
Unclassified 18,606 18%
Regional Core 212 0%
CBD 683 1%
Urban Business 2,315 2%
Urban 9,271 9%
Suburban 40,291 39%
Rural 32,448 31%
All 103,826 100%
8
2.3 Transit Network
The transit network is built from a base node and link network layer with transit lines read on top of it using
Cube’s PUBLIC TRANSPORT program. During this process the network nodes are renumbered so the
TAP nodes become zones for skimming and assignment and the transit line files are also rebuilt using the
modified node numbers. Different transit networks are created for each time period, with different transit
lines enabled for each whether or not they are running in the period. The transit lines are read in during the
transit skimming and assignment procedures, and the summaries discussed here refer to the transit networks
built during transit skimming. Please refer to the transit skimming procedure for details regarding the path
builder settings.
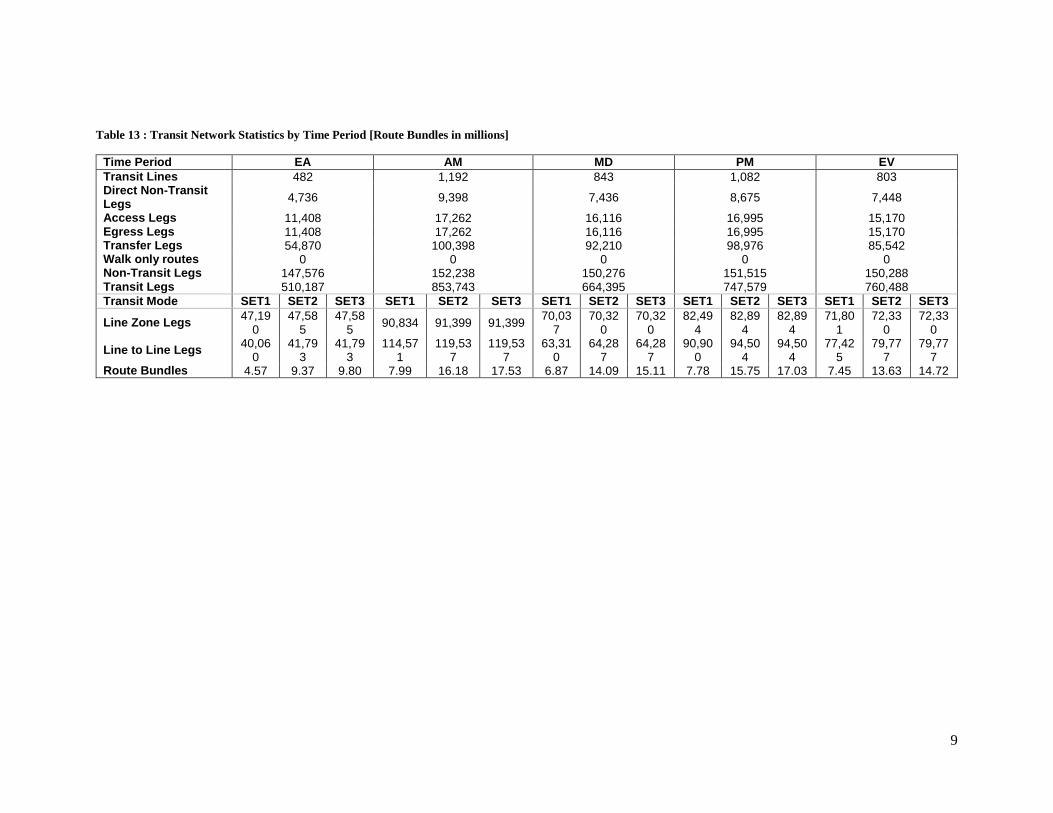
The table below presents some metrics reported during the transit network building process. Most of the
measures seem reasonable, with the AM and PM (peak) periods showing more transit lines. SET1 skims
have only local services enabled; while SET2 and SET3 have all services enabled – hence we see Cube PT
picking up more route bundles (sets of potential routes between zones) in these sets compared to local only
set. Also, there are no “walk only” routes. Presence of walk transfer legs indicates that the link generation
procedure for walk transfers is being applied correctly.
9
Table 13 : Transit Network Statistics by Time Period [Route Bundles in millions]
Time Period EA AM MD PM EV
Transit Lines 482 1,192 843 1,082 803 Direct Non-Transit Legs
4,736 9,398 7,436 8,675 7,448
Access Legs 11,408 17,262 16,116 16,995 15,170 Egress Legs 11,408 17,262 16,116 16,995 15,170 Transfer Legs 54,870 100,398 92,210 98,976 85,542 Walk only routes 0 0 0 0 0 Non-Transit Legs 147,576 152,238 150,276 151,515 150,288 Transit Legs 510,187 853,743 664,395 747,579 760,488
Transit Mode SET1 SET2 SET3 SET1 SET2 SET3 SET1 SET2 SET3 SET1 SET2 SET3 SET1 SET2 SET3
Line Zone Legs 47,19
0 47,58
5 47,58
5 90,834 91,399 91,399
70,037
70,320
70,320
82,494
82,894
82,894
71,801
72,330
72,330
Line to Line Legs 40,06
0 41,79
3 41,79
3 114,57
1 119,53
7 119,53
7 63,31
0 64,28
7 64,28
7 90,90
0 94,50
4 94,50
4 77,42
5 79,77
7 79,77
7 Route Bundles 4.57 9.37 9.80 7.99 16.18 17.53 6.87 14.09 15.11 7.78 15.75 17.03 7.45 13.63 14.72
10
3 Non-Motorized Skims
3.1 Pedestrian and Bike MAZ-MAZ and MAZ-TAP, Bike TAZ-TAZ, Ped TAP-TAP
The non-motorized skims are built using Cube’s built-in point-to-point shortest path procedure
(FUNCTION=BUILDPATH), with a maximum distance of 3 miles for all skims except bike TAZ-TAZ
(which has no effective limit) and pedestrian TAP-TAP, which has a 0.5 mile limit.
For a reasonableness check, the shortest path between a few zone pairs was calculated using Cube’s
interactive procedure. For each specific check, the same parameters, constraints, and networks were used
as with the actual skim.
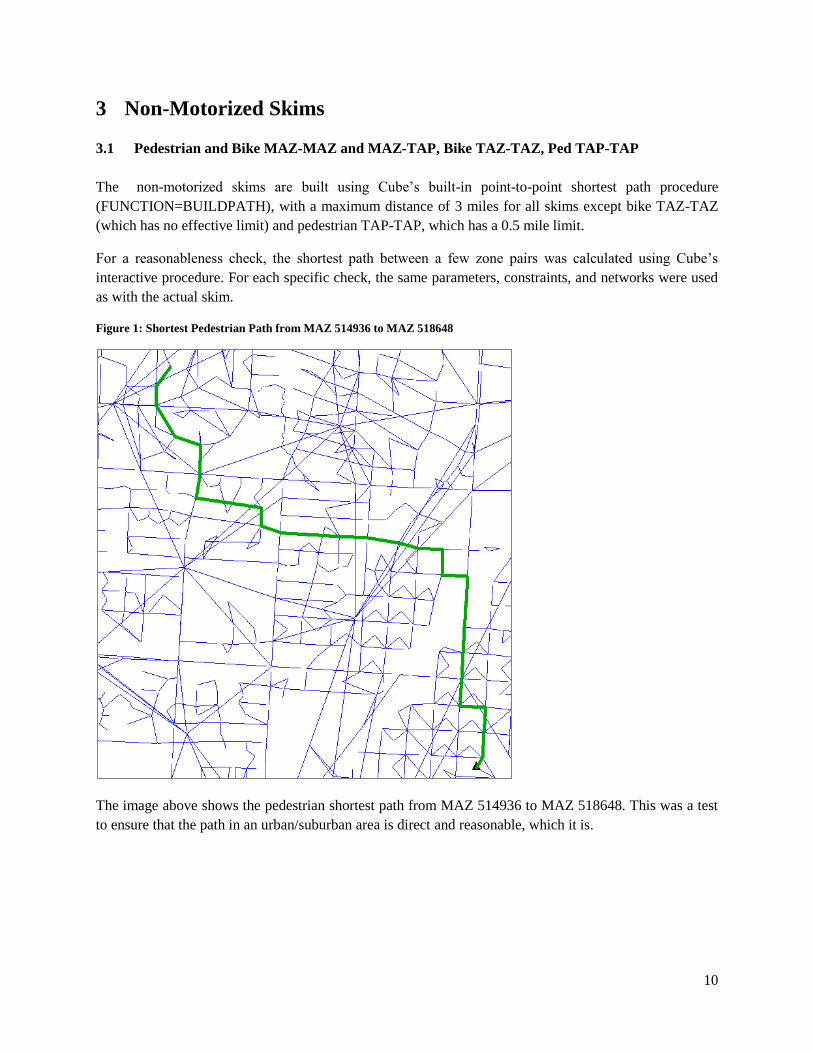
Figure 1: Shortest Pedestrian Path from MAZ 514936 to MAZ 518648
The image above shows the pedestrian shortest path from MAZ 514936 to MAZ 518648. This was a test
to ensure that the path in an urban/suburban area is direct and reasonable, which it is.
11
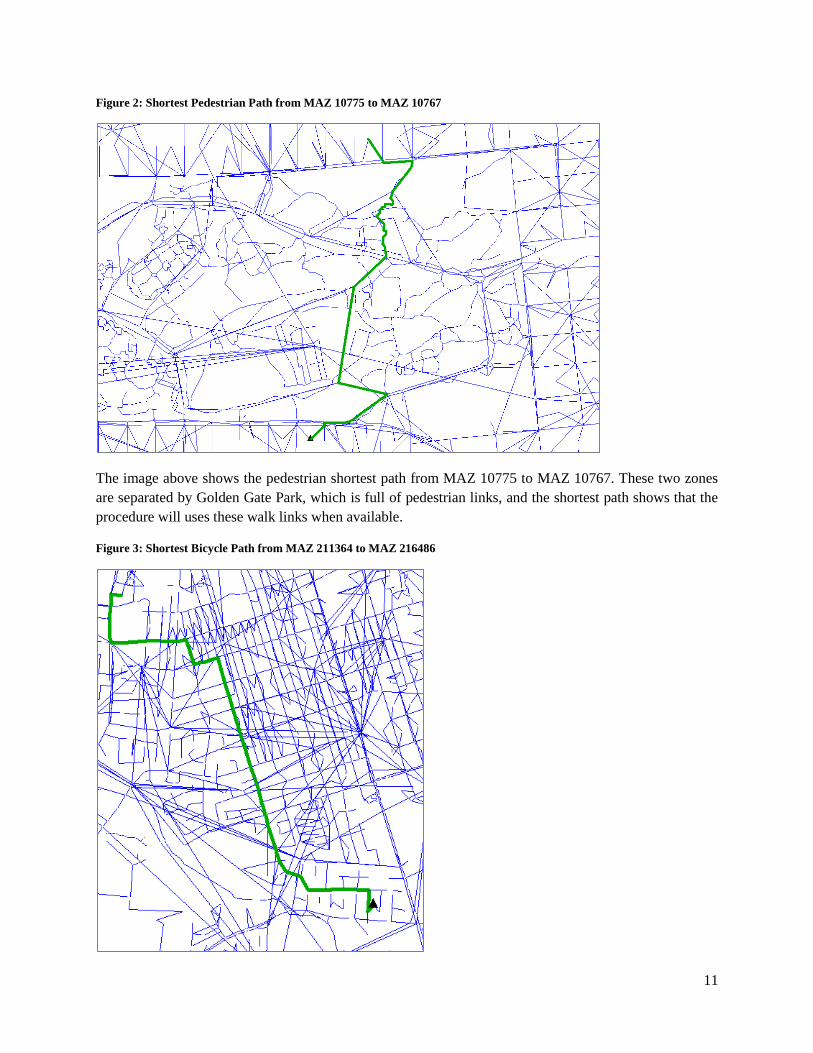
Figure 2: Shortest Pedestrian Path from MAZ 10775 to MAZ 10767
The image above shows the pedestrian shortest path from MAZ 10775 to MAZ 10767. These two zones
are separated by Golden Gate Park, which is full of pedestrian links, and the shortest path shows that the
procedure will uses these walk links when available.
Figure 3: Shortest Bicycle Path from MAZ 211364 to MAZ 216486
12
The image above shows the bicycle shortest path from MAZ 211364 to MAZ 216486. These two zones are
within a suburban area which is filled with lots of network detail (including many zone connectors which
should not be used). The path is straight and does not use any disallowed links.
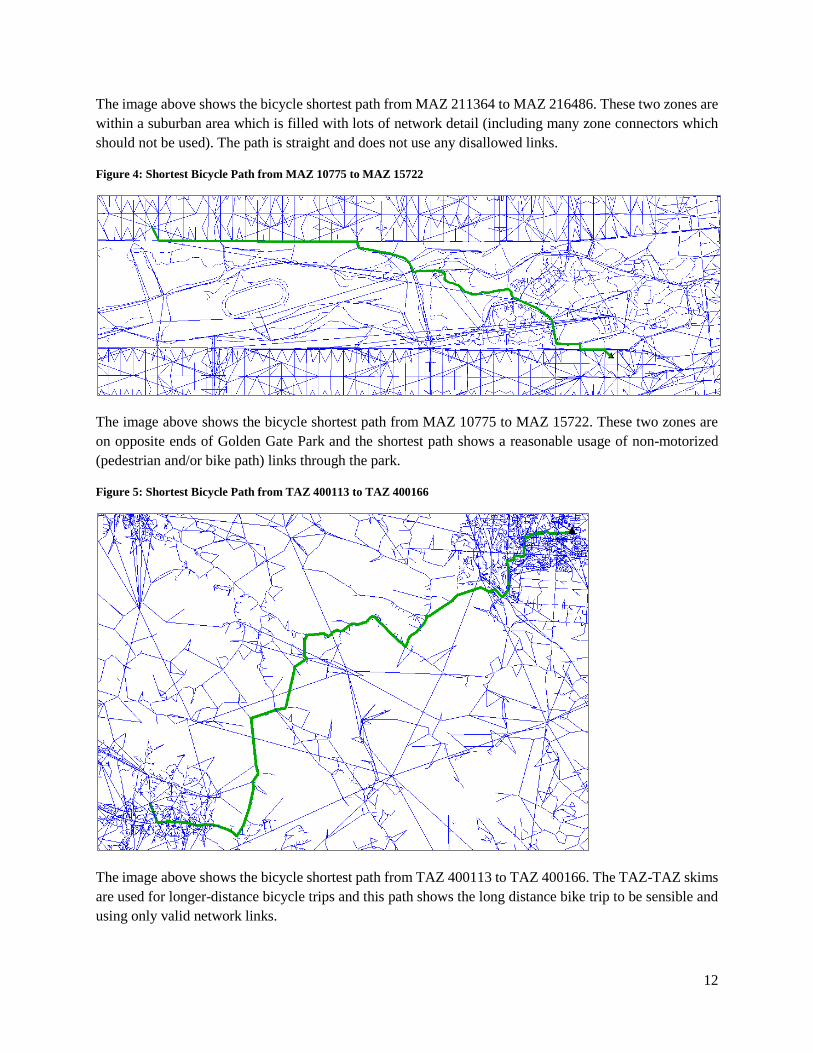
Figure 4: Shortest Bicycle Path from MAZ 10775 to MAZ 15722
The image above shows the bicycle shortest path from MAZ 10775 to MAZ 15722. These two zones are
on opposite ends of Golden Gate Park and the shortest path shows a reasonable usage of non-motorized
(pedestrian and/or bike path) links through the park.
Figure 5: Shortest Bicycle Path from TAZ 400113 to TAZ 400166
The image above shows the bicycle shortest path from TAZ 400113 to TAZ 400166. The TAZ-TAZ skims
are used for longer-distance bicycle trips and this path shows the long distance bike trip to be sensible and
using only valid network links.
13
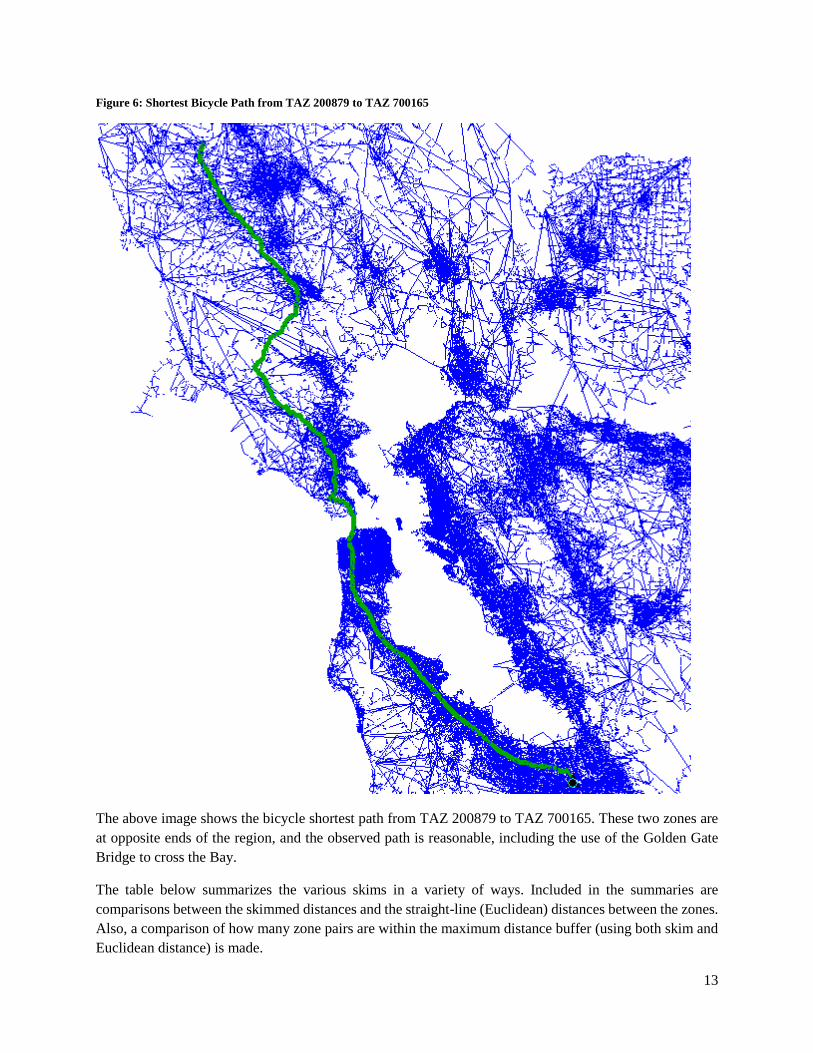
Figure 6: Shortest Bicycle Path from TAZ 200879 to TAZ 700165
The above image shows the bicycle shortest path from TAZ 200879 to TAZ 700165. These two zones are
at opposite ends of the region, and the observed path is reasonable, including the use of the Golden Gate
Bridge to cross the Bay.
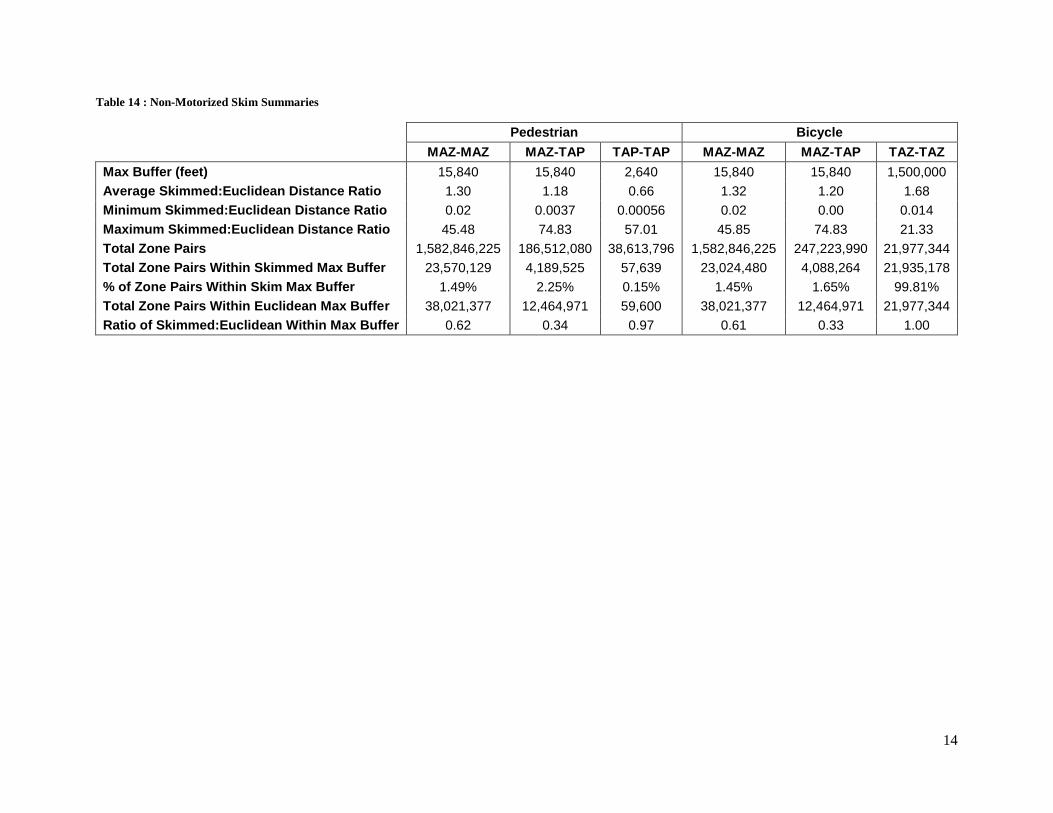
The table below summarizes the various skims in a variety of ways. Included in the summaries are
comparisons between the skimmed distances and the straight-line (Euclidean) distances between the zones.
Also, a comparison of how many zone pairs are within the maximum distance buffer (using both skim and
Euclidean distance) is made.
14
Table 14 : Non-Motorized Skim Summaries
Pedestrian Bicycle
MAZ-MAZ MAZ-TAP TAP-TAP MAZ-MAZ MAZ-TAP TAZ-TAZ
Max Buffer (feet) 15,840 15,840 2,640 15,840 15,840 1,500,000
Average Skimmed:Euclidean Distance Ratio 1.30 1.18 0.66 1.32 1.20 1.68
Minimum Skimmed:Euclidean Distance Ratio 0.02 0.0037 0.00056 0.02 0.00 0.014
Maximum Skimmed:Euclidean Distance Ratio 45.48 74.83 57.01 45.85 74.83 21.33
Total Zone Pairs 1,582,846,225 186,512,080 38,613,796 1,582,846,225 247,223,990 21,977,344
Total Zone Pairs Within Skimmed Max Buffer 23,570,129 4,189,525 57,639 23,024,480 4,088,264 21,935,178
% of Zone Pairs Within Skim Max Buffer 1.49% 2.25% 0.15% 1.45% 1.65% 99.81%
Total Zone Pairs Within Euclidean Max Buffer 38,021,377 12,464,971 59,600 38,021,377 12,464,971 21,977,344
Ratio of Skimmed:Euclidean Within Max Buffer 0.62 0.34 0.97 0.61 0.33 1.00
15
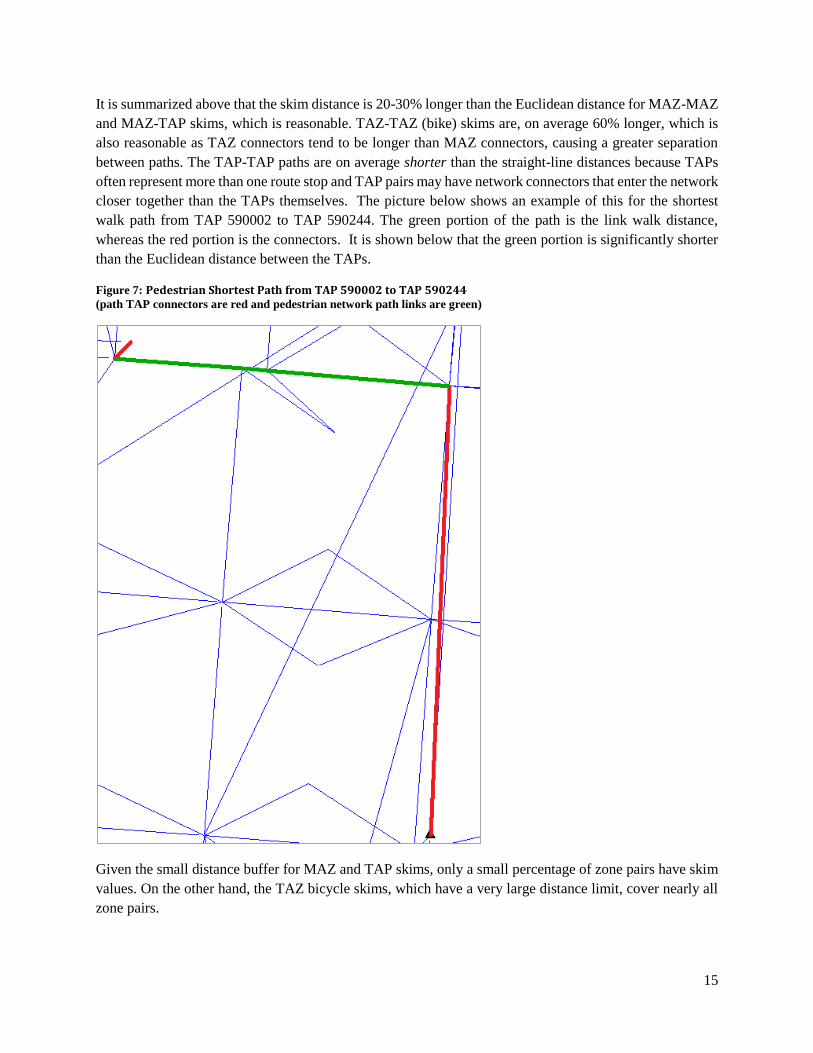
It is summarized above that the skim distance is 20-30% longer than the Euclidean distance for MAZ-MAZ
and MAZ-TAP skims, which is reasonable. TAZ-TAZ (bike) skims are, on average 60% longer, which is
also reasonable as TAZ connectors tend to be longer than MAZ connectors, causing a greater separation
between paths. The TAP-TAP paths are on average shorter than the straight-line distances because TAPs
often represent more than one route stop and TAP pairs may have network connectors that enter the network
closer together than the TAPs themselves. The picture below shows an example of this for the shortest
walk path from TAP 590002 to TAP 590244. The green portion of the path is the link walk distance,
whereas the red portion is the connectors. It is shown below that the green portion is significantly shorter
than the Euclidean distance between the TAPs.
Figure 7: Pedestrian Shortest Path from TAP 590002 to TAP 590244 (path TAP connectors are red and pedestrian network path links are green)
Given the small distance buffer for MAZ and TAP skims, only a small percentage of zone pairs have skim
values. On the other hand, the TAZ bicycle skims, which have a very large distance limit, cover nearly all
zone pairs.
16
4 Airport Trips
The airport trips model uses trip data/forecasts for 2007 and 2035, stratified by a wide variety of modes and
the major regional airports. A simple linear interpolation is used to calculate the trips for the year being
modeled, after which the trips are aggregated to the standard MTC modes. The following table shows the
trips by mode for each airport (San Francisco (SFO), Oakland (OAK), and San Jose (SJC)). The airport
demand model assumes there will be no tolls trips.
Table 15 : Airport Model Trips by Mode and Airport
SFO OAK SJC Total
Mode Inbound Outbound Inbound Outbound Inbound Outbound Inbound Outbound
Drive Alone 10,165 10,084 9,114 9,338 5,881 5,963 25,160 25,385
Shared Ride 2 8,081 8,140 6,464 6,538 4,418 4,555 18,963 19,233
Shared Ride 3+ 5,565 5,662 2,753 2,477 1,603 1,405 9,921 9,544
Drive Alone Toll - - - - - - - -
Shared Ride 2 Toll - - - - - - - -
Shared Ride 3+ Toll - - - - - - - -
Total 23,810 23,885 18,331 18,353 11,902 11,923 54,044 108,205
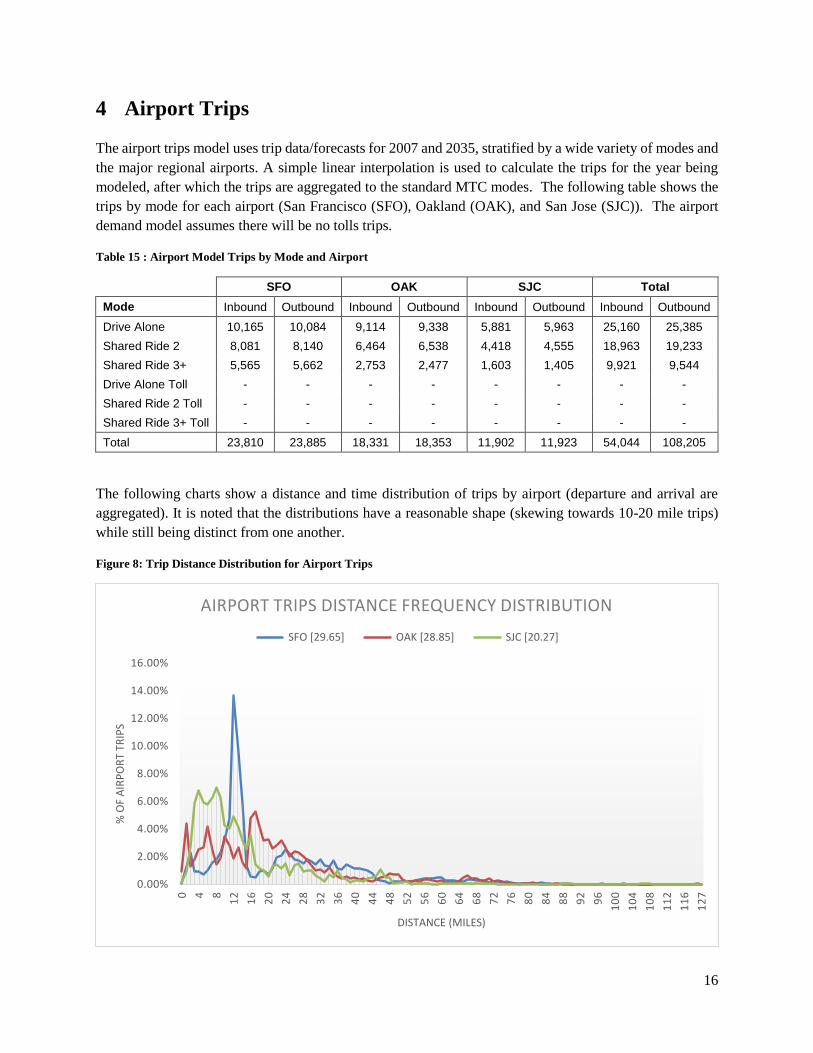
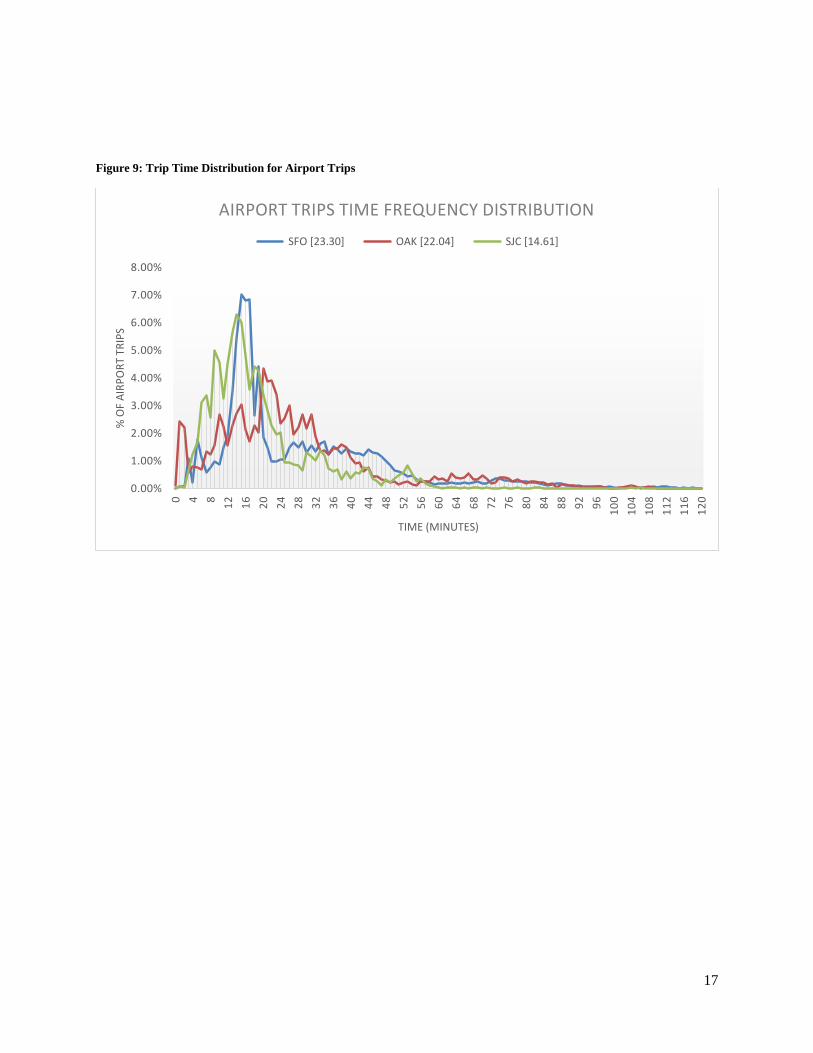
The following charts show a distance and time distribution of trips by airport (departure and arrival are
aggregated). It is noted that the distributions have a reasonable shape (skewing towards 10-20 mile trips)
while still being distinct from one another.
Figure 8: Trip Distance Distribution for Airport Trips
0.00%
2.00%
4.00%
6.00%
8.00%
10.00%
12.00%
14.00%
16.00%
0 4 8
12
16
20
24
28
32
36
40
44
48
52
56
60
64
68
72
76
80
84
88
92
96
10
0
10
4
10
8
11
2
11
6
12
7
% O
F A
IRP
OR
T TR
IPS
DISTANCE (MILES)
AIRPORT TRIPS DISTANCE FREQUENCY DISTRIBUTION
SFO [29.65] OAK [28.85] SJC [20.27]
17
Figure 9: Trip Time Distribution for Airport Trips
0.00%
1.00%
2.00%
3.00%
4.00%
5.00%
6.00%
7.00%
8.00%
0 4 8
12
16
20
24
28
32
36
40
44
48
52
56
60
64
68
72
76
80
84
88
92
96
10
0
10
4
10
8
11
2
11
6
12
0
% O
F A
IRP
OR
T TR
IPS
TIME (MINUTES)
AIRPORT TRIPS TIME FREQUENCY DISTRIBUTION
SFO [23.30] OAK [22.04] SJC [14.61]
18
5 Motorized Skims
5.1 MAZ-MAZ
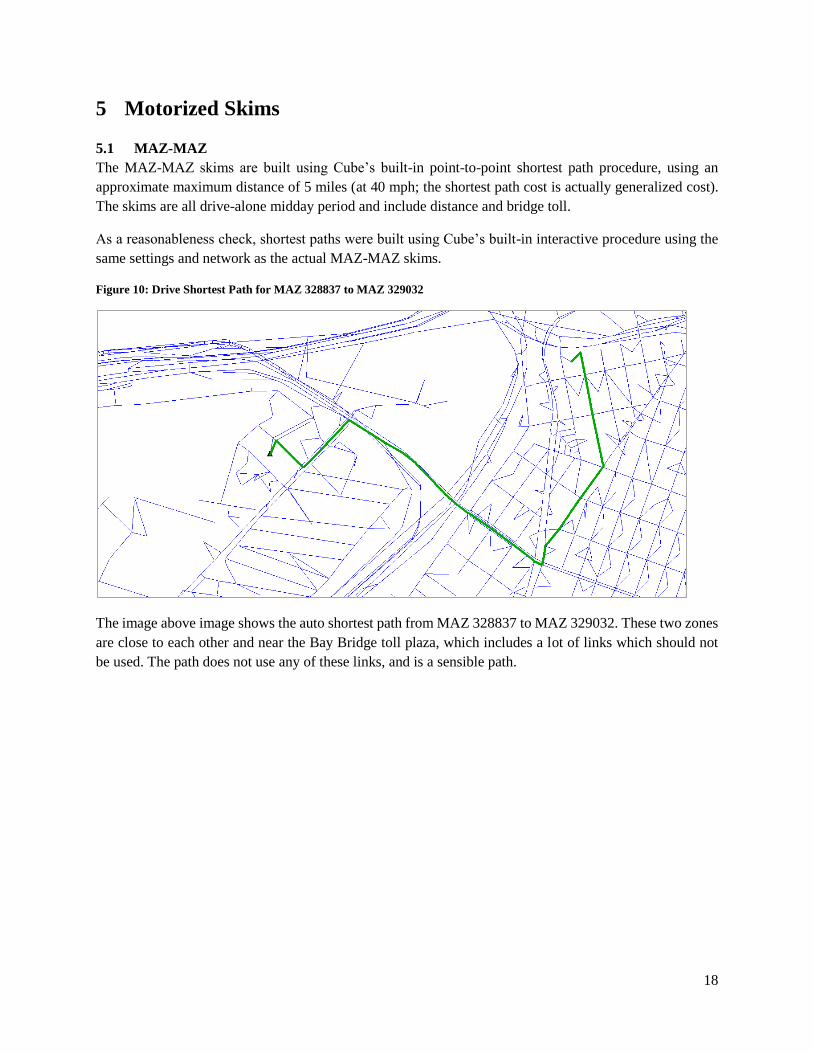
The MAZ-MAZ skims are built using Cube’s built-in point-to-point shortest path procedure, using an
approximate maximum distance of 5 miles (at 40 mph; the shortest path cost is actually generalized cost).
The skims are all drive-alone midday period and include distance and bridge toll.
As a reasonableness check, shortest paths were built using Cube’s built-in interactive procedure using the
same settings and network as the actual MAZ-MAZ skims.
Figure 10: Drive Shortest Path for MAZ 328837 to MAZ 329032
The image above image shows the auto shortest path from MAZ 328837 to MAZ 329032. These two zones
are close to each other and near the Bay Bridge toll plaza, which includes a lot of links which should not
be used. The path does not use any of these links, and is a sensible path.
19
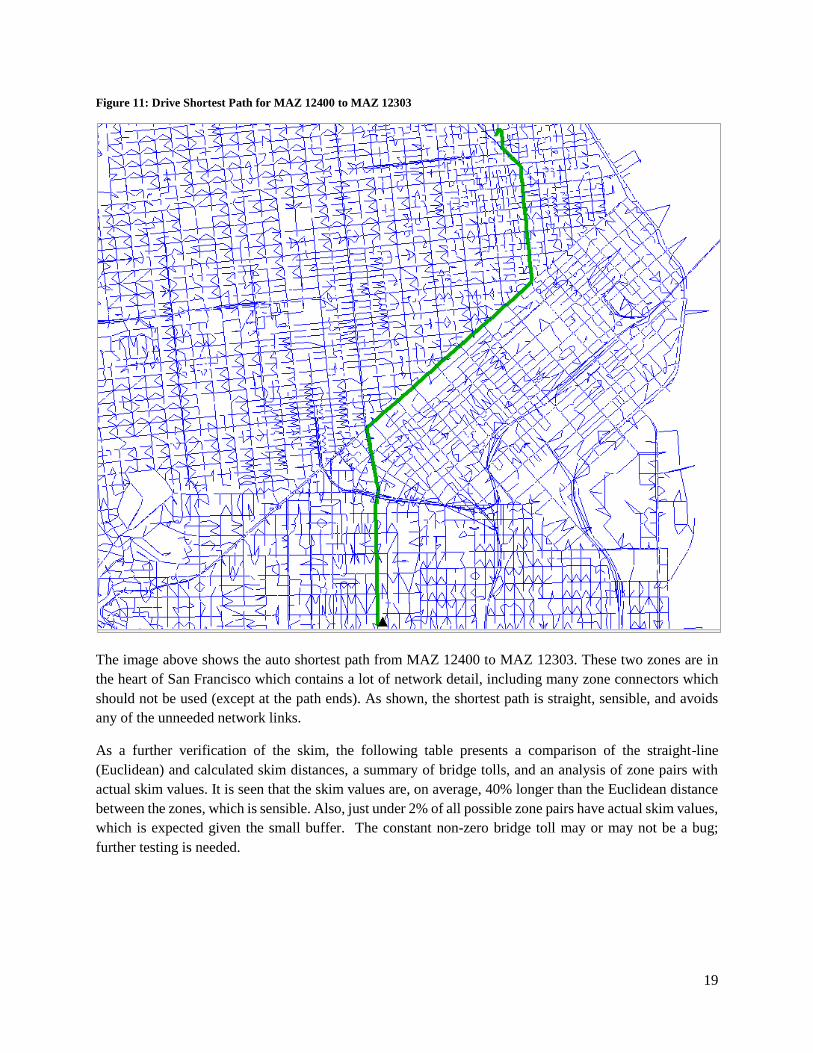
Figure 11: Drive Shortest Path for MAZ 12400 to MAZ 12303
The image above shows the auto shortest path from MAZ 12400 to MAZ 12303. These two zones are in
the heart of San Francisco which contains a lot of network detail, including many zone connectors which
should not be used (except at the path ends). As shown, the shortest path is straight, sensible, and avoids
any of the unneeded network links.
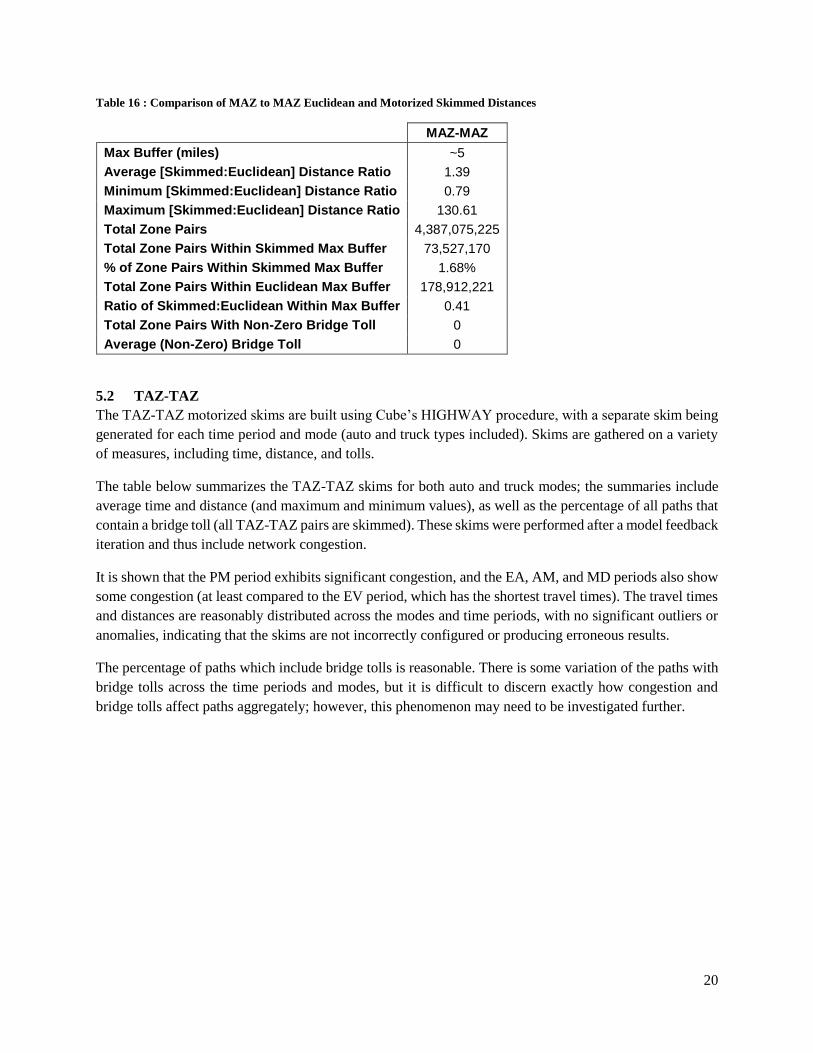
As a further verification of the skim, the following table presents a comparison of the straight-line
(Euclidean) and calculated skim distances, a summary of bridge tolls, and an analysis of zone pairs with
actual skim values. It is seen that the skim values are, on average, 40% longer than the Euclidean distance
between the zones, which is sensible. Also, just under 2% of all possible zone pairs have actual skim values,
which is expected given the small buffer. The constant non-zero bridge toll may or may not be a bug;
further testing is needed.
20
Table 16 : Comparison of MAZ to MAZ Euclidean and Motorized Skimmed Distances
MAZ-MAZ
Max Buffer (miles) ~5
Average [Skimmed:Euclidean] Distance Ratio 1.39
Minimum [Skimmed:Euclidean] Distance Ratio 0.79
Maximum [Skimmed:Euclidean] Distance Ratio 130.61
Total Zone Pairs 4,387,075,225
Total Zone Pairs Within Skimmed Max Buffer 73,527,170
% of Zone Pairs Within Skimmed Max Buffer 1.68%
Total Zone Pairs Within Euclidean Max Buffer 178,912,221
Ratio of Skimmed:Euclidean Within Max Buffer 0.41
Total Zone Pairs With Non-Zero Bridge Toll 0
Average (Non-Zero) Bridge Toll 0
5.2 TAZ-TAZ
The TAZ-TAZ motorized skims are built using Cube’s HIGHWAY procedure, with a separate skim being
generated for each time period and mode (auto and truck types included). Skims are gathered on a variety
of measures, including time, distance, and tolls.
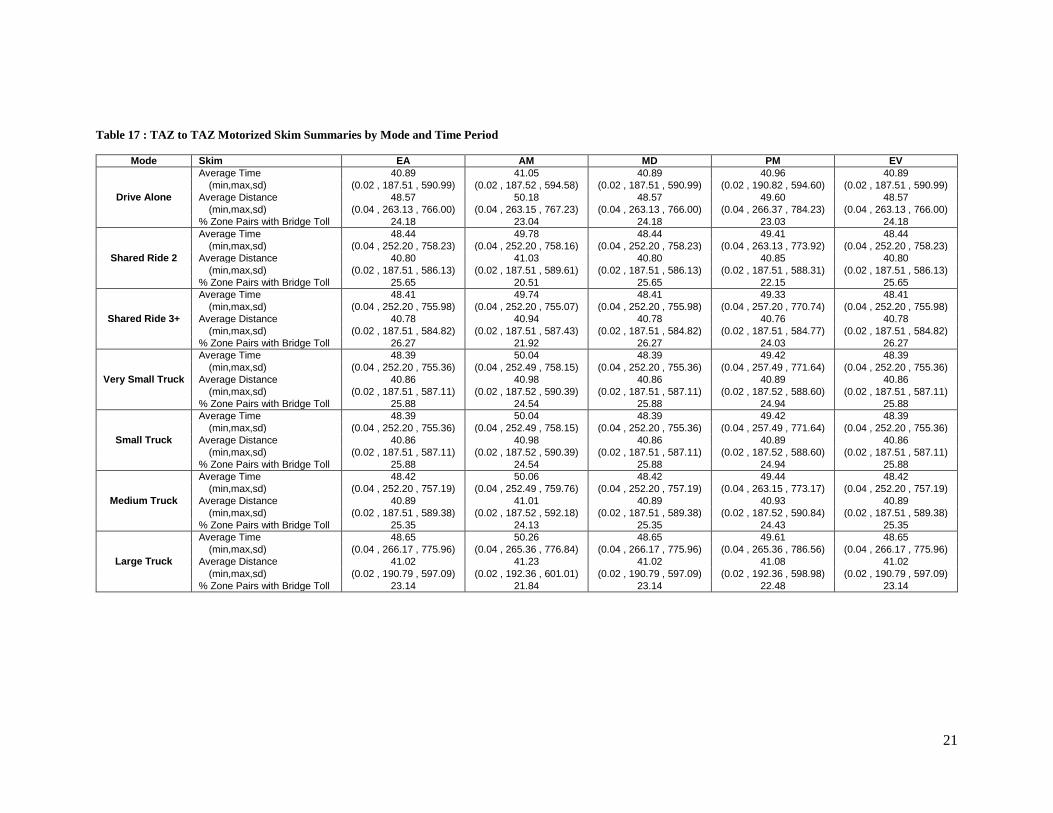
The table below summarizes the TAZ-TAZ skims for both auto and truck modes; the summaries include
average time and distance (and maximum and minimum values), as well as the percentage of all paths that
contain a bridge toll (all TAZ-TAZ pairs are skimmed). These skims were performed after a model feedback
iteration and thus include network congestion.
It is shown that the PM period exhibits significant congestion, and the EA, AM, and MD periods also show
some congestion (at least compared to the EV period, which has the shortest travel times). The travel times
and distances are reasonably distributed across the modes and time periods, with no significant outliers or
anomalies, indicating that the skims are not incorrectly configured or producing erroneous results.
The percentage of paths which include bridge tolls is reasonable. There is some variation of the paths with
bridge tolls across the time periods and modes, but it is difficult to discern exactly how congestion and
bridge tolls affect paths aggregately; however, this phenomenon may need to be investigated further.
21
Table 17 : TAZ to TAZ Motorized Skim Summaries by Mode and Time Period
Mode Skim EA AM MD PM EV
Drive Alone
Average Time 40.89 41.05 40.89 40.96 40.89
(min,max,sd) (0.02 , 187.51 , 590.99) (0.02 , 187.52 , 594.58) (0.02 , 187.51 , 590.99) (0.02 , 190.82 , 594.60) (0.02 , 187.51 , 590.99)
Average Distance 48.57 50.18 48.57 49.60 48.57
(min,max,sd) (0.04 , 263.13 , 766.00) (0.04 , 263.15 , 767.23) (0.04 , 263.13 , 766.00) (0.04 , 266.37 , 784.23) (0.04 , 263.13 , 766.00)
% Zone Pairs with Bridge Toll 24.18 23.04 24.18 23.03 24.18
Shared Ride 2
Average Time 48.44 49.78 48.44 49.41 48.44
(min,max,sd) (0.04 , 252.20 , 758.23) (0.04 , 252.20 , 758.16) (0.04 , 252.20 , 758.23) (0.04 , 263.13 , 773.92) (0.04 , 252.20 , 758.23)
Average Distance 40.80 41.03 40.80 40.85 40.80
(min,max,sd) (0.02 , 187.51 , 586.13) (0.02 , 187.51 , 589.61) (0.02 , 187.51 , 586.13) (0.02 , 187.51 , 588.31) (0.02 , 187.51 , 586.13)
% Zone Pairs with Bridge Toll 25.65 20.51 25.65 22.15 25.65
Shared Ride 3+
Average Time 48.41 49.74 48.41 49.33 48.41
(min,max,sd) (0.04 , 252.20 , 755.98) (0.04 , 252.20 , 755.07) (0.04 , 252.20 , 755.98) (0.04 , 257.20 , 770.74) (0.04 , 252.20 , 755.98)
Average Distance 40.78 40.94 40.78 40.76 40.78
(min,max,sd) (0.02 , 187.51 , 584.82) (0.02 , 187.51 , 587.43) (0.02 , 187.51 , 584.82) (0.02 , 187.51 , 584.77) (0.02 , 187.51 , 584.82)
% Zone Pairs with Bridge Toll 26.27 21.92 26.27 24.03 26.27
Very Small Truck
Average Time 48.39 50.04 48.39 49.42 48.39
(min,max,sd) (0.04 , 252.20 , 755.36) (0.04 , 252.49 , 758.15) (0.04 , 252.20 , 755.36) (0.04 , 257.49 , 771.64) (0.04 , 252.20 , 755.36)
Average Distance 40.86 40.98 40.86 40.89 40.86
(min,max,sd) (0.02 , 187.51 , 587.11) (0.02 , 187.52 , 590.39) (0.02 , 187.51 , 587.11) (0.02 , 187.52 , 588.60) (0.02 , 187.51 , 587.11)
% Zone Pairs with Bridge Toll 25.88 24.54 25.88 24.94 25.88
Small Truck
Average Time 48.39 50.04 48.39 49.42 48.39
(min,max,sd) (0.04 , 252.20 , 755.36) (0.04 , 252.49 , 758.15) (0.04 , 252.20 , 755.36) (0.04 , 257.49 , 771.64) (0.04 , 252.20 , 755.36)
Average Distance 40.86 40.98 40.86 40.89 40.86
(min,max,sd) (0.02 , 187.51 , 587.11) (0.02 , 187.52 , 590.39) (0.02 , 187.51 , 587.11) (0.02 , 187.52 , 588.60) (0.02 , 187.51 , 587.11)
% Zone Pairs with Bridge Toll 25.88 24.54 25.88 24.94 25.88
Medium Truck
Average Time 48.42 50.06 48.42 49.44 48.42
(min,max,sd) (0.04 , 252.20 , 757.19) (0.04 , 252.49 , 759.76) (0.04 , 252.20 , 757.19) (0.04 , 263.15 , 773.17) (0.04 , 252.20 , 757.19)
Average Distance 40.89 41.01 40.89 40.93 40.89
(min,max,sd) (0.02 , 187.51 , 589.38) (0.02 , 187.52 , 592.18) (0.02 , 187.51 , 589.38) (0.02 , 187.52 , 590.84) (0.02 , 187.51 , 589.38)
% Zone Pairs with Bridge Toll 25.35 24.13 25.35 24.43 25.35
Large Truck
Average Time 48.65 50.26 48.65 49.61 48.65
(min,max,sd) (0.04 , 266.17 , 775.96) (0.04 , 265.36 , 776.84) (0.04 , 266.17 , 775.96) (0.04 , 265.36 , 786.56) (0.04 , 266.17 , 775.96)
Average Distance 41.02 41.23 41.02 41.08 41.02
(min,max,sd) (0.02 , 190.79 , 597.09) (0.02 , 192.36 , 601.01) (0.02 , 190.79 , 597.09) (0.02 , 192.36 , 598.98) (0.02 , 190.79 , 597.09)
% Zone Pairs with Bridge Toll 23.14 21.84 23.14 22.48 23.14
22
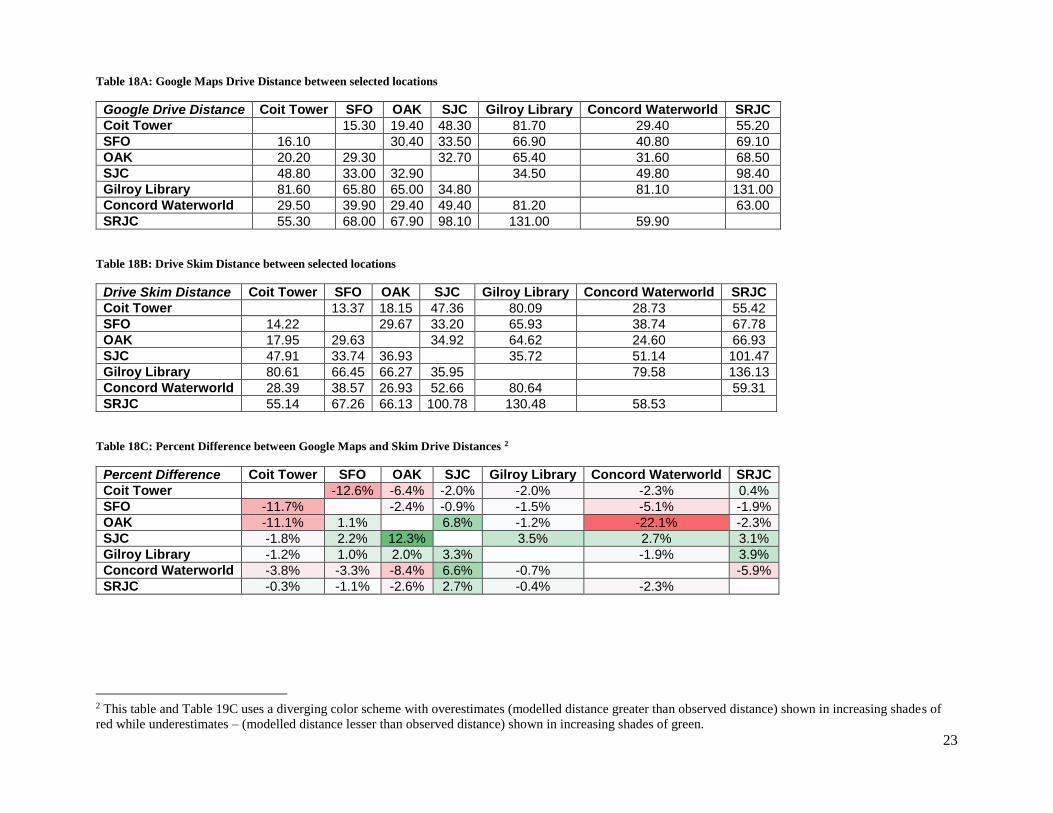
As a further check on the correctness of the highway skims, a selection of “landmark” TAZs was selected
and the skim results compared to those calculated by the Google Maps service. To avoid being skewed by
congestion effects, the EA time period skims were used for this analysis.
The landmark TAZs that were selected are those associated with Coit Tower; San Francisco International
Airport (SFO); Oakland International Airport (OAK); San Jose International Airport (SJC); the Gilroy
Public Library; the Concord Waterworld water park; and Santa Rosa Junior College campus in Santa Rosa
(SRJC).
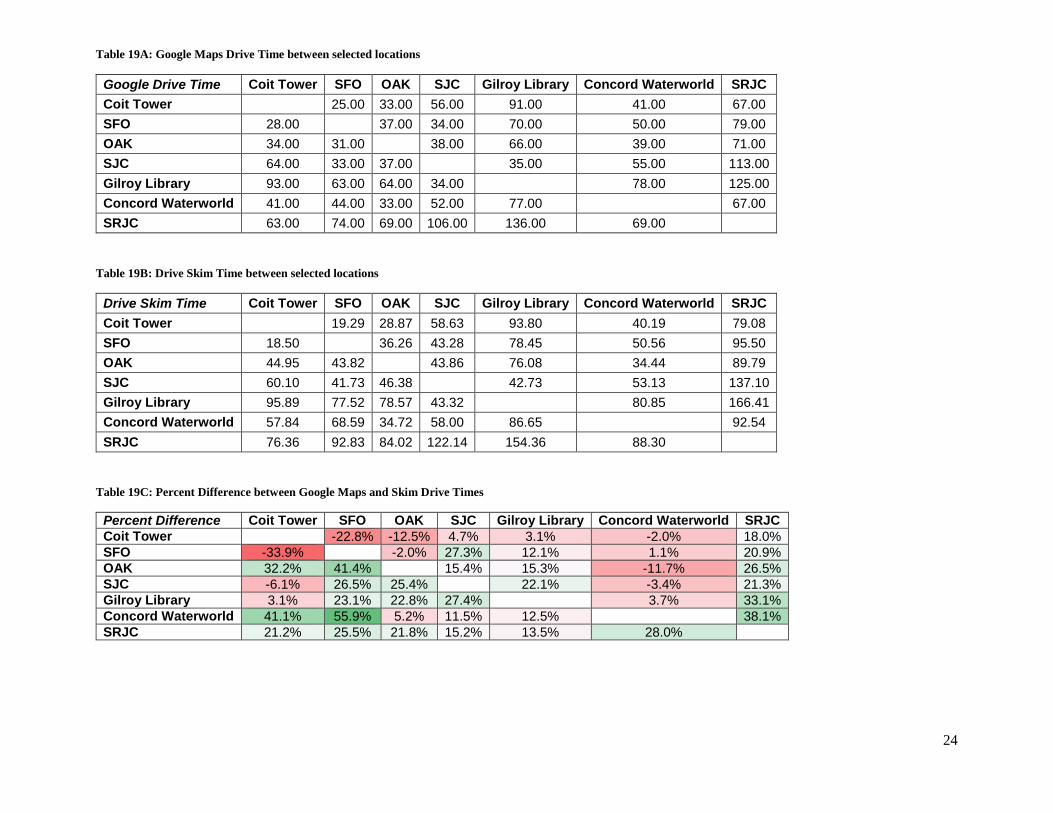
The results of these comparisons are presented in the tables below; the tables present OD results for the
Google Maps and skims, as well as the percentage difference between the two. Time and distance
comparisons are shown, in that order. The difference table cells are colored based on how much over/under
(green/red) the skims are with respect to Google.
Overall, the results are reasonable, in particular the distance results which are very close. This indicates that
the network geometry and generated paths are probably accurate. The times are also within reason, except
for a few outliers. Only one combination – the time from Concord Waterworld to SFO – is overestimated
by the model by over 40%. It is not immediately clear what the issue might be (due to the size of the network
and the complexity of the skimming procedures). This needs to be investigated in more detail.
.
23
Table 18A: Google Maps Drive Distance between selected locations
Google Drive Distance Coit Tower SFO OAK SJC Gilroy Library Concord Waterworld SRJC
Coit Tower 15.30 19.40 48.30 81.70 29.40 55.20
SFO 16.10 30.40 33.50 66.90 40.80 69.10
OAK 20.20 29.30 32.70 65.40 31.60 68.50
SJC 48.80 33.00 32.90 34.50 49.80 98.40
Gilroy Library 81.60 65.80 65.00 34.80 81.10 131.00
Concord Waterworld 29.50 39.90 29.40 49.40 81.20 63.00
SRJC 55.30 68.00 67.90 98.10 131.00 59.90
Table 18B: Drive Skim Distance between selected locations
Drive Skim Distance Coit Tower SFO OAK SJC Gilroy Library Concord Waterworld SRJC
Coit Tower 13.37 18.15 47.36 80.09 28.73 55.42
SFO 14.22 29.67 33.20 65.93 38.74 67.78
OAK 17.95 29.63 34.92 64.62 24.60 66.93
SJC 47.91 33.74 36.93 35.72 51.14 101.47
Gilroy Library 80.61 66.45 66.27 35.95 79.58 136.13
Concord Waterworld 28.39 38.57 26.93 52.66 80.64 59.31
SRJC 55.14 67.26 66.13 100.78 130.48 58.53
Table 18C: Percent Difference between Google Maps and Skim Drive Distances 2
Percent Difference Coit Tower SFO OAK SJC Gilroy Library Concord Waterworld SRJC
Coit Tower -12.6% -6.4% -2.0% -2.0% -2.3% 0.4%
SFO -11.7% -2.4% -0.9% -1.5% -5.1% -1.9%
OAK -11.1% 1.1% 6.8% -1.2% -22.1% -2.3%
SJC -1.8% 2.2% 12.3% 3.5% 2.7% 3.1%
Gilroy Library -1.2% 1.0% 2.0% 3.3% -1.9% 3.9%
Concord Waterworld -3.8% -3.3% -8.4% 6.6% -0.7% -5.9%
SRJC -0.3% -1.1% -2.6% 2.7% -0.4% -2.3%
2 This table and Table 19C uses a diverging color scheme with overestimates (modelled distance greater than observed distance) shown in increasing shades of
red while underestimates – (modelled distance lesser than observed distance) shown in increasing shades of green.
24
Table 19A: Google Maps Drive Time between selected locations
Google Drive Time Coit Tower SFO OAK SJC Gilroy Library Concord Waterworld SRJC
Coit Tower 25.00 33.00 56.00 91.00 41.00 67.00
SFO 28.00 37.00 34.00 70.00 50.00 79.00
OAK 34.00 31.00 38.00 66.00 39.00 71.00
SJC 64.00 33.00 37.00 35.00 55.00 113.00
Gilroy Library 93.00 63.00 64.00 34.00 78.00 125.00
Concord Waterworld 41.00 44.00 33.00 52.00 77.00 67.00
SRJC 63.00 74.00 69.00 106.00 136.00 69.00
Table 19B: Drive Skim Time between selected locations
Drive Skim Time Coit Tower SFO OAK SJC Gilroy Library Concord Waterworld SRJC
Coit Tower 19.29 28.87 58.63 93.80 40.19 79.08
SFO 18.50 36.26 43.28 78.45 50.56 95.50
OAK 44.95 43.82 43.86 76.08 34.44 89.79
SJC 60.10 41.73 46.38 42.73 53.13 137.10
Gilroy Library 95.89 77.52 78.57 43.32 80.85 166.41
Concord Waterworld 57.84 68.59 34.72 58.00 86.65 92.54
SRJC 76.36 92.83 84.02 122.14 154.36 88.30
Table 19C: Percent Difference between Google Maps and Skim Drive Times
Percent Difference Coit Tower SFO OAK SJC Gilroy Library Concord Waterworld SRJC
Coit Tower -22.8% -12.5% 4.7% 3.1% -2.0% 18.0%
SFO -33.9% -2.0% 27.3% 12.1% 1.1% 20.9%
OAK 32.2% 41.4% 15.4% 15.3% -11.7% 26.5%
SJC -6.1% 26.5% 25.4% 22.1% -3.4% 21.3%
Gilroy Library 3.1% 23.1% 22.8% 27.4% 3.7% 33.1%
Concord Waterworld 41.1% 55.9% 5.2% 11.5% 12.5% 38.1%
SRJC 21.2% 25.5% 21.8% 15.2% 13.5% 28.0%
25
5.3 TAZ-TAP
The TAZ-TAP skims are used for drive-to-transit calculations, and are built using a combination of TAZ-
TAZ drive skims and MAZ-TAP pedestrian skims (with the TAZ-MAZ mapping provided via the zonal
data file). The final skims are segmented by transit mode and time period, and include drive distance, time,
and toll, as well as walk distance.
The table below summarized the TAZ-TAP skims for the five different transit modes. Summaries are
recorded for drive distance and time, walk distance, and bridge tolls; average values, as well as maximum
and minimum are presented. All of the values are reasonable, and it is seen that the drive times/distances
are longer for the non-local bus modes than local bus mode, which is expected as they have less coverage
across the region (and to access them, one would need to travel further). The walk distances are all about a
quarter mile or less, which is sensible. Also, paths to premium rail service includes bridge tolls in some
cases. This makes sense as people would be willing to drive out further to access better transit services as
can be seen from the average drive times and distances to the different services and a longer drive time has
a higher probability of picking up a toll on the path.
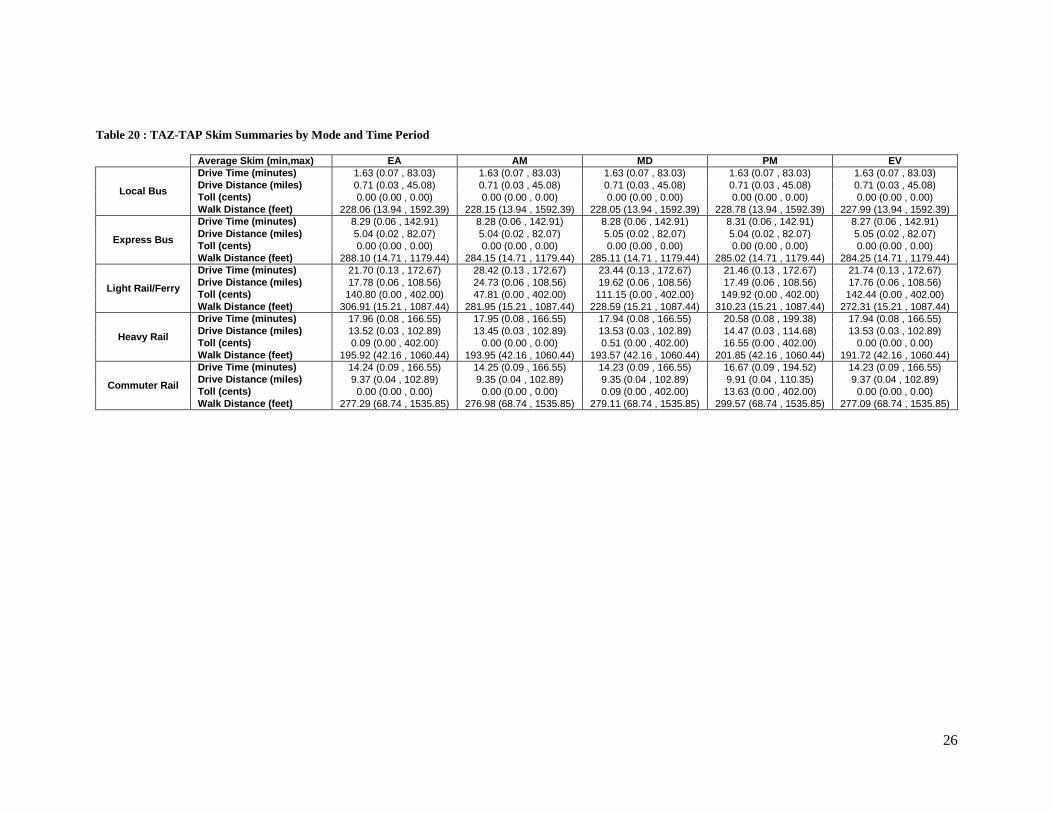
26
Table 20 : TAZ-TAP Skim Summaries by Mode and Time Period
Average Skim (min,max) EA AM MD PM EV
Local Bus
Drive Time (minutes) 1.63 (0.07 , 83.03) 1.63 (0.07 , 83.03) 1.63 (0.07 , 83.03) 1.63 (0.07 , 83.03) 1.63 (0.07 , 83.03)
Drive Distance (miles) 0.71 (0.03 , 45.08) 0.71 (0.03 , 45.08) 0.71 (0.03 , 45.08) 0.71 (0.03 , 45.08) 0.71 (0.03 , 45.08)
Toll (cents) 0.00 (0.00 , 0.00) 0.00 (0.00 , 0.00) 0.00 (0.00 , 0.00) 0.00 (0.00 , 0.00) 0.00 (0.00 , 0.00)
Walk Distance (feet) 228.06 (13.94 , 1592.39) 228.15 (13.94 , 1592.39) 228.05 (13.94 , 1592.39) 228.78 (13.94 , 1592.39) 227.99 (13.94 , 1592.39)
Express Bus
Drive Time (minutes) 8.29 (0.06 , 142.91) 8.28 (0.06 , 142.91) 8.28 (0.06 , 142.91) 8.31 (0.06 , 142.91) 8.27 (0.06 , 142.91)
Drive Distance (miles) 5.04 (0.02 , 82.07) 5.04 (0.02 , 82.07) 5.05 (0.02 , 82.07) 5.04 (0.02 , 82.07) 5.05 (0.02 , 82.07)
Toll (cents) 0.00 (0.00 , 0.00) 0.00 (0.00 , 0.00) 0.00 (0.00 , 0.00) 0.00 (0.00 , 0.00) 0.00 (0.00 , 0.00)
Walk Distance (feet) 288.10 (14.71 , 1179.44) 284.15 (14.71 , 1179.44) 285.11 (14.71 , 1179.44) 285.02 (14.71 , 1179.44) 284.25 (14.71 , 1179.44)
Light Rail/Ferry
Drive Time (minutes) 21.70 (0.13 , 172.67) 28.42 (0.13 , 172.67) 23.44 (0.13 , 172.67) 21.46 (0.13 , 172.67) 21.74 (0.13 , 172.67)
Drive Distance (miles) 17.78 (0.06 , 108.56) 24.73 (0.06 , 108.56) 19.62 (0.06 , 108.56) 17.49 (0.06 , 108.56) 17.76 (0.06 , 108.56)
Toll (cents) 140.80 (0.00 , 402.00) 47.81 (0.00 , 402.00) 111.15 (0.00 , 402.00) 149.92 (0.00 , 402.00) 142.44 (0.00 , 402.00)
Walk Distance (feet) 306.91 (15.21 , 1087.44) 281.95 (15.21 , 1087.44) 228.59 (15.21 , 1087.44) 310.23 (15.21 , 1087.44) 272.31 (15.21 , 1087.44)
Heavy Rail
Drive Time (minutes) 17.96 (0.08 , 166.55) 17.95 (0.08 , 166.55) 17.94 (0.08 , 166.55) 20.58 (0.08 , 199.38) 17.94 (0.08 , 166.55)
Drive Distance (miles) 13.52 (0.03 , 102.89) 13.45 (0.03 , 102.89) 13.53 (0.03 , 102.89) 14.47 (0.03 , 114.68) 13.53 (0.03 , 102.89)
Toll (cents) 0.09 (0.00 , 402.00) 0.00 (0.00 , 0.00) 0.51 (0.00 , 402.00) 16.55 (0.00 , 402.00) 0.00 (0.00 , 0.00)
Walk Distance (feet) 195.92 (42.16 , 1060.44) 193.95 (42.16 , 1060.44) 193.57 (42.16 , 1060.44) 201.85 (42.16 , 1060.44) 191.72 (42.16 , 1060.44)
Commuter Rail
Drive Time (minutes) 14.24 (0.09 , 166.55) 14.25 (0.09 , 166.55) 14.23 (0.09 , 166.55) 16.67 (0.09 , 194.52) 14.23 (0.09 , 166.55)
Drive Distance (miles) 9.37 (0.04 , 102.89) 9.35 (0.04 , 102.89) 9.35 (0.04 , 102.89) 9.91 (0.04 , 110.35) 9.37 (0.04 , 102.89)
Toll (cents) 0.00 (0.00 , 0.00) 0.00 (0.00 , 0.00) 0.09 (0.00 , 402.00) 13.63 (0.00 , 402.00) 0.00 (0.00 , 0.00)
Walk Distance (feet) 277.29 (68.74 , 1535.85) 276.98 (68.74 , 1535.85) 279.11 (68.74 , 1535.85) 299.57 (68.74 , 1535.85) 277.09 (68.74 , 1535.85)
27
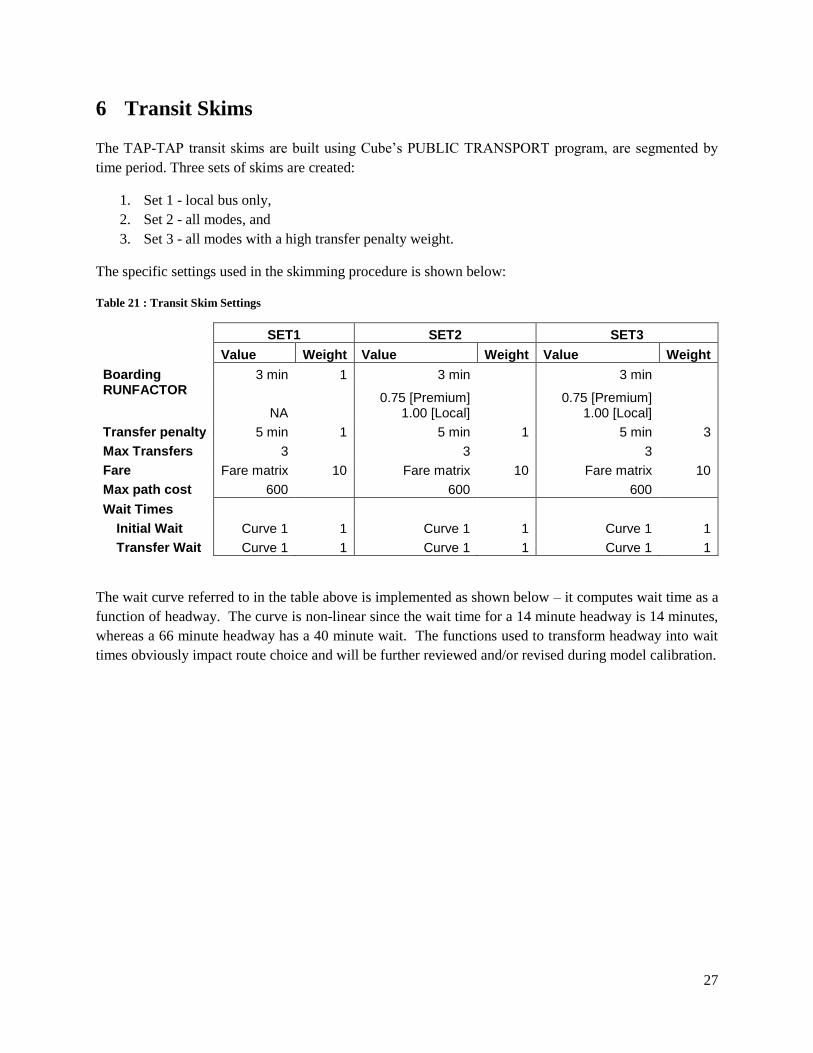
6 Transit Skims
The TAP-TAP transit skims are built using Cube’s PUBLIC TRANSPORT program, are segmented by
time period. Three sets of skims are created:
1. Set 1 - local bus only,
2. Set 2 - all modes, and
3. Set 3 - all modes with a high transfer penalty weight.
The specific settings used in the skimming procedure is shown below:
Table 21 : Transit Skim Settings
SET1 SET2 SET3
Value Weight Value Weight Value Weight
Boarding 3 min 1 3 min 3 min RUNFACTOR
NA 0.75 [Premium]
1.00 [Local] 0.75 [Premium]
1.00 [Local]
Transfer penalty 5 min 1 5 min 1 5 min 3
Max Transfers 3 3 3
Fare Fare matrix 10 Fare matrix 10 Fare matrix 10
Max path cost 600 600 600
Wait Times
Initial Wait Curve 1 1 Curve 1 1 Curve 1 1
Transfer Wait Curve 1 1 Curve 1 1 Curve 1 1
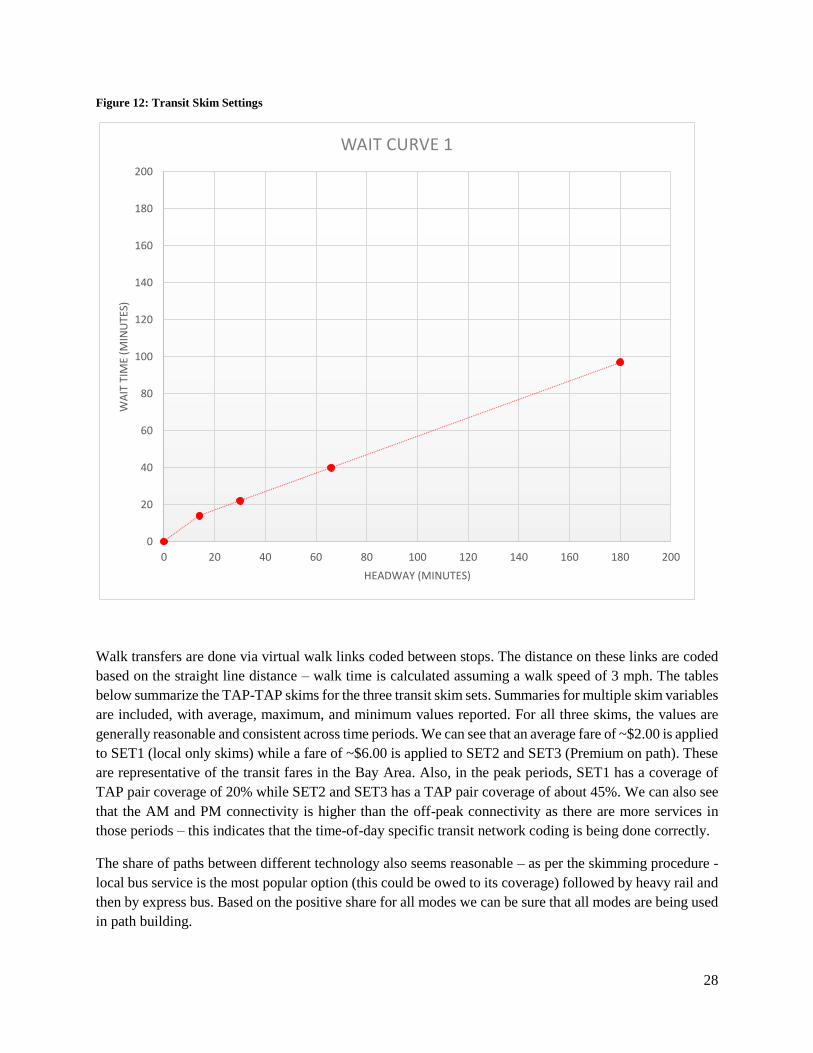
The wait curve referred to in the table above is implemented as shown below – it computes wait time as a
function of headway. The curve is non-linear since the wait time for a 14 minute headway is 14 minutes,
whereas a 66 minute headway has a 40 minute wait. The functions used to transform headway into wait
times obviously impact route choice and will be further reviewed and/or revised during model calibration.
28
Figure 12: Transit Skim Settings
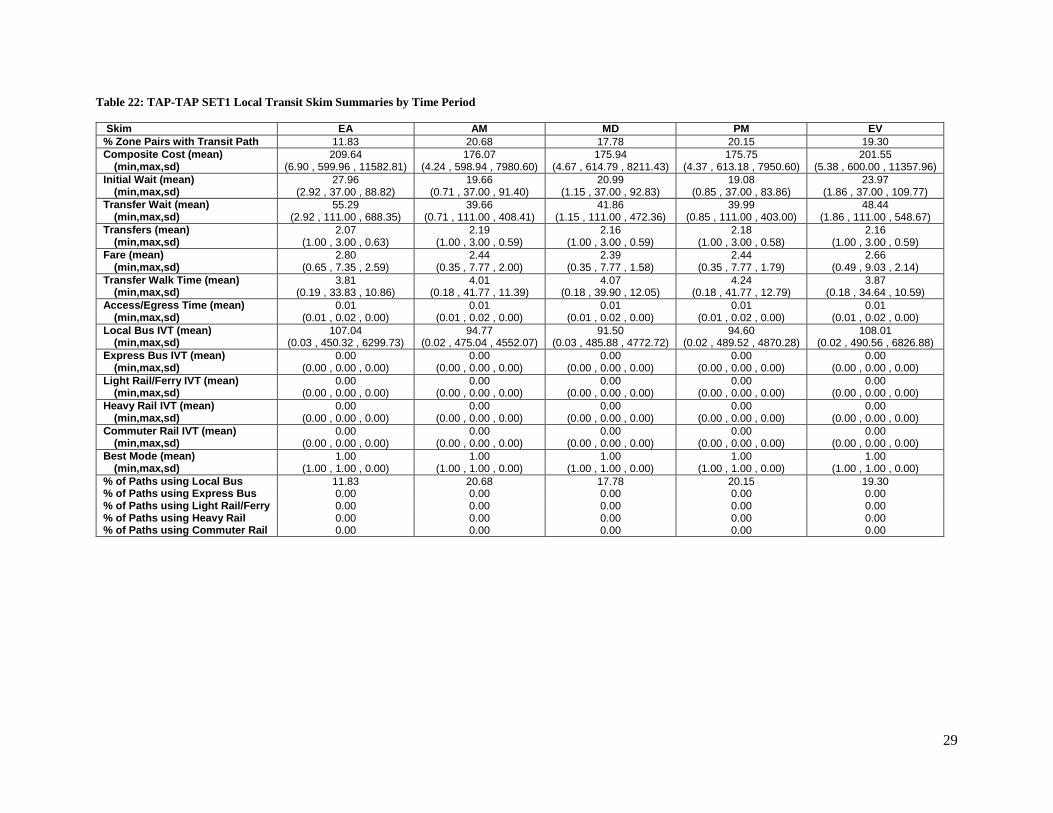
Walk transfers are done via virtual walk links coded between stops. The distance on these links are coded
based on the straight line distance – walk time is calculated assuming a walk speed of 3 mph. The tables
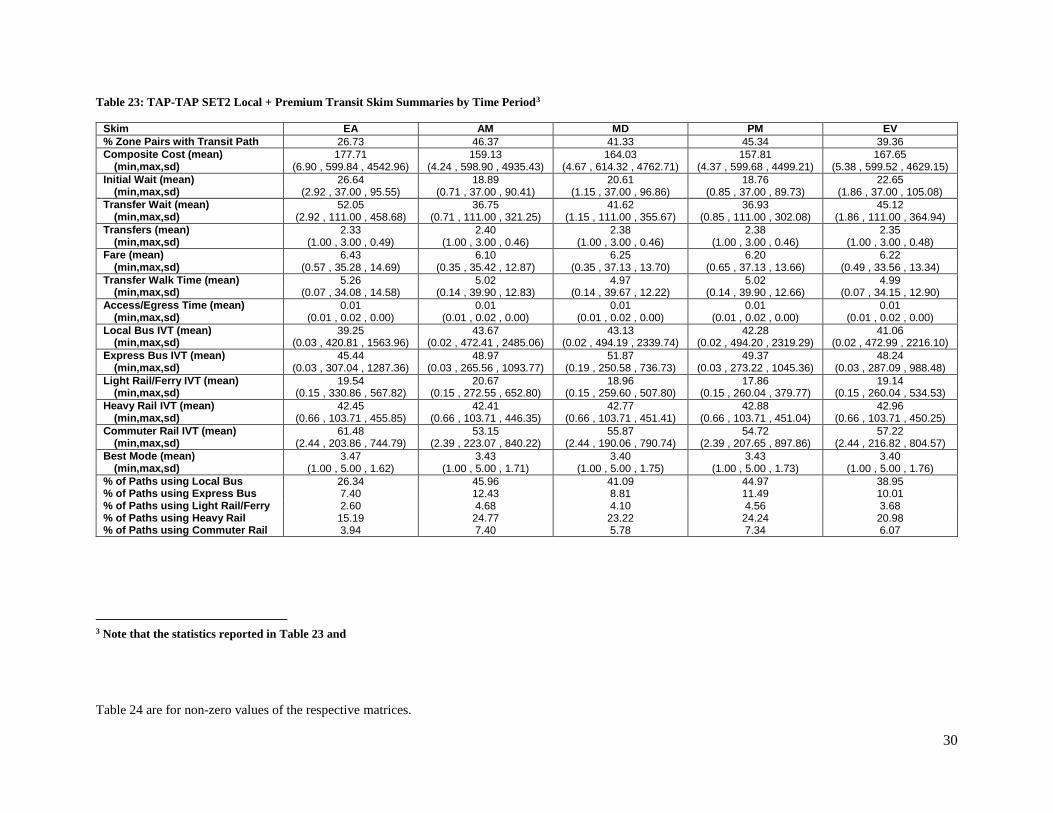
below summarize the TAP-TAP skims for the three transit skim sets. Summaries for multiple skim variables
are included, with average, maximum, and minimum values reported. For all three skims, the values are
generally reasonable and consistent across time periods. We can see that an average fare of ~$2.00 is applied
to SET1 (local only skims) while a fare of ~$6.00 is applied to SET2 and SET3 (Premium on path). These
are representative of the transit fares in the Bay Area. Also, in the peak periods, SET1 has a coverage of
TAP pair coverage of 20% while SET2 and SET3 has a TAP pair coverage of about 45%. We can also see
that the AM and PM connectivity is higher than the off-peak connectivity as there are more services in
those periods – this indicates that the time-of-day specific transit network coding is being done correctly.
The share of paths between different technology also seems reasonable – as per the skimming procedure -
local bus service is the most popular option (this could be owed to its coverage) followed by heavy rail and
then by express bus. Based on the positive share for all modes we can be sure that all modes are being used
in path building.
0
20
40
60
80
100
120
140
160
180
200
0 20 40 60 80 100 120 140 160 180 200
WA
IT T
IME
(MIN
UTE
S)
HEADWAY (MINUTES)
WAIT CURVE 1
29
Table 22: TAP-TAP SET1 Local Transit Skim Summaries by Time Period
Skim EA AM MD PM EV
% Zone Pairs with Transit Path 11.83 20.68 17.78 20.15 19.30
Composite Cost (mean) 209.64 176.07 175.94 175.75 201.55 (min,max,sd) (6.90 , 599.96 , 11582.81) (4.24 , 598.94 , 7980.60) (4.67 , 614.79 , 8211.43) (4.37 , 613.18 , 7950.60) (5.38 , 600.00 , 11357.96)
Initial Wait (mean) 27.96 19.66 20.99 19.08 23.97 (min,max,sd) (2.92 , 37.00 , 88.82) (0.71 , 37.00 , 91.40) (1.15 , 37.00 , 92.83) (0.85 , 37.00 , 83.86) (1.86 , 37.00 , 109.77)
Transfer Wait (mean) 55.29 39.66 41.86 39.99 48.44 (min,max,sd) (2.92 , 111.00 , 688.35) (0.71 , 111.00 , 408.41) (1.15 , 111.00 , 472.36) (0.85 , 111.00 , 403.00) (1.86 , 111.00 , 548.67)
Transfers (mean) 2.07 2.19 2.16 2.18 2.16 (min,max,sd) (1.00 , 3.00 , 0.63) (1.00 , 3.00 , 0.59) (1.00 , 3.00 , 0.59) (1.00 , 3.00 , 0.58) (1.00 , 3.00 , 0.59)
Fare (mean) 2.80 2.44 2.39 2.44 2.66 (min,max,sd) (0.65 , 7.35 , 2.59) (0.35 , 7.77 , 2.00) (0.35 , 7.77 , 1.58) (0.35 , 7.77 , 1.79) (0.49 , 9.03 , 2.14)
Transfer Walk Time (mean) 3.81 4.01 4.07 4.24 3.87 (min,max,sd) (0.19 , 33.83 , 10.86) (0.18 , 41.77 , 11.39) (0.18 , 39.90 , 12.05) (0.18 , 41.77 , 12.79) (0.18 , 34.64 , 10.59)
Access/Egress Time (mean) 0.01 0.01 0.01 0.01 0.01 (min,max,sd) (0.01 , 0.02 , 0.00) (0.01 , 0.02 , 0.00) (0.01 , 0.02 , 0.00) (0.01 , 0.02 , 0.00) (0.01 , 0.02 , 0.00)
Local Bus IVT (mean) 107.04 94.77 91.50 94.60 108.01 (min,max,sd) (0.03 , 450.32 , 6299.73) (0.02 , 475.04 , 4552.07) (0.03 , 485.88 , 4772.72) (0.02 , 489.52 , 4870.28) (0.02 , 490.56 , 6826.88)
Express Bus IVT (mean) 0.00 0.00 0.00 0.00 0.00 (min,max,sd) (0.00 , 0.00 , 0.00) (0.00 , 0.00 , 0.00) (0.00 , 0.00 , 0.00) (0.00 , 0.00 , 0.00) (0.00 , 0.00 , 0.00)
Light Rail/Ferry IVT (mean) 0.00 0.00 0.00 0.00 0.00 (min,max,sd) (0.00 , 0.00 , 0.00) (0.00 , 0.00 , 0.00) (0.00 , 0.00 , 0.00) (0.00 , 0.00 , 0.00) (0.00 , 0.00 , 0.00)
Heavy Rail IVT (mean) 0.00 0.00 0.00 0.00 0.00 (min,max,sd) (0.00 , 0.00 , 0.00) (0.00 , 0.00 , 0.00) (0.00 , 0.00 , 0.00) (0.00 , 0.00 , 0.00) (0.00 , 0.00 , 0.00)
Commuter Rail IVT (mean) 0.00 0.00 0.00 0.00 0.00 (min,max,sd) (0.00 , 0.00 , 0.00) (0.00 , 0.00 , 0.00) (0.00 , 0.00 , 0.00) (0.00 , 0.00 , 0.00) (0.00 , 0.00 , 0.00)
Best Mode (mean) 1.00 1.00 1.00 1.00 1.00 (min,max,sd) (1.00 , 1.00 , 0.00) (1.00 , 1.00 , 0.00) (1.00 , 1.00 , 0.00) (1.00 , 1.00 , 0.00) (1.00 , 1.00 , 0.00)
% of Paths using Local Bus 11.83 20.68 17.78 20.15 19.30 % of Paths using Express Bus 0.00 0.00 0.00 0.00 0.00 % of Paths using Light Rail/Ferry 0.00 0.00 0.00 0.00 0.00 % of Paths using Heavy Rail 0.00 0.00 0.00 0.00 0.00 % of Paths using Commuter Rail 0.00 0.00 0.00 0.00 0.00
30
Table 23: TAP-TAP SET2 Local + Premium Transit Skim Summaries by Time Period3
Skim EA AM MD PM EV
% Zone Pairs with Transit Path 26.73 46.37 41.33 45.34 39.36
Composite Cost (mean) 177.71 159.13 164.03 157.81 167.65 (min,max,sd) (6.90 , 599.84 , 4542.96) (4.24 , 598.90 , 4935.43) (4.67 , 614.32 , 4762.71) (4.37 , 599.68 , 4499.21) (5.38 , 599.52 , 4629.15)
Initial Wait (mean) 26.64 18.89 20.61 18.76 22.65 (min,max,sd) (2.92 , 37.00 , 95.55) (0.71 , 37.00 , 90.41) (1.15 , 37.00 , 96.86) (0.85 , 37.00 , 89.73) (1.86 , 37.00 , 105.08)
Transfer Wait (mean) 52.05 36.75 41.62 36.93 45.12 (min,max,sd) (2.92 , 111.00 , 458.68) (0.71 , 111.00 , 321.25) (1.15 , 111.00 , 355.67) (0.85 , 111.00 , 302.08) (1.86 , 111.00 , 364.94)
Transfers (mean) 2.33 2.40 2.38 2.38 2.35 (min,max,sd) (1.00 , 3.00 , 0.49) (1.00 , 3.00 , 0.46) (1.00 , 3.00 , 0.46) (1.00 , 3.00 , 0.46) (1.00 , 3.00 , 0.48)
Fare (mean) 6.43 6.10 6.25 6.20 6.22 (min,max,sd) (0.57 , 35.28 , 14.69) (0.35 , 35.42 , 12.87) (0.35 , 37.13 , 13.70) (0.65 , 37.13 , 13.66) (0.49 , 33.56 , 13.34)
Transfer Walk Time (mean) 5.26 5.02 4.97 5.02 4.99 (min,max,sd) (0.07 , 34.08 , 14.58) (0.14 , 39.90 , 12.83) (0.14 , 39.67 , 12.22) (0.14 , 39.90 , 12.66) (0.07 , 34.15 , 12.90)
Access/Egress Time (mean) 0.01 0.01 0.01 0.01 0.01 (min,max,sd) (0.01 , 0.02 , 0.00) (0.01 , 0.02 , 0.00) (0.01 , 0.02 , 0.00) (0.01 , 0.02 , 0.00) (0.01 , 0.02 , 0.00)
Local Bus IVT (mean) 39.25 43.67 43.13 42.28 41.06 (min,max,sd) (0.03 , 420.81 , 1563.96) (0.02 , 472.41 , 2485.06) (0.02 , 494.19 , 2339.74) (0.02 , 494.20 , 2319.29) (0.02 , 472.99 , 2216.10)
Express Bus IVT (mean) 45.44 48.97 51.87 49.37 48.24 (min,max,sd) (0.03 , 307.04 , 1287.36) (0.03 , 265.56 , 1093.77) (0.19 , 250.58 , 736.73) (0.03 , 273.22 , 1045.36) (0.03 , 287.09 , 988.48)
Light Rail/Ferry IVT (mean) 19.54 20.67 18.96 17.86 19.14 (min,max,sd) (0.15 , 330.86 , 567.82) (0.15 , 272.55 , 652.80) (0.15 , 259.60 , 507.80) (0.15 , 260.04 , 379.77) (0.15 , 260.04 , 534.53)
Heavy Rail IVT (mean) 42.45 42.41 42.77 42.88 42.96 (min,max,sd) (0.66 , 103.71 , 455.85) (0.66 , 103.71 , 446.35) (0.66 , 103.71 , 451.41) (0.66 , 103.71 , 451.04) (0.66 , 103.71 , 450.25)
Commuter Rail IVT (mean) 61.48 53.15 55.87 54.72 57.22 (min,max,sd) (2.44 , 203.86 , 744.79) (2.39 , 223.07 , 840.22) (2.44 , 190.06 , 790.74) (2.39 , 207.65 , 897.86) (2.44 , 216.82 , 804.57)
Best Mode (mean) 3.47 3.43 3.40 3.43 3.40 (min,max,sd) (1.00 , 5.00 , 1.62) (1.00 , 5.00 , 1.71) (1.00 , 5.00 , 1.75) (1.00 , 5.00 , 1.73) (1.00 , 5.00 , 1.76)
% of Paths using Local Bus 26.34 45.96 41.09 44.97 38.95 % of Paths using Express Bus 7.40 12.43 8.81 11.49 10.01 % of Paths using Light Rail/Ferry 2.60 4.68 4.10 4.56 3.68 % of Paths using Heavy Rail 15.19 24.77 23.22 24.24 20.98 % of Paths using Commuter Rail 3.94 7.40 5.78 7.34 6.07
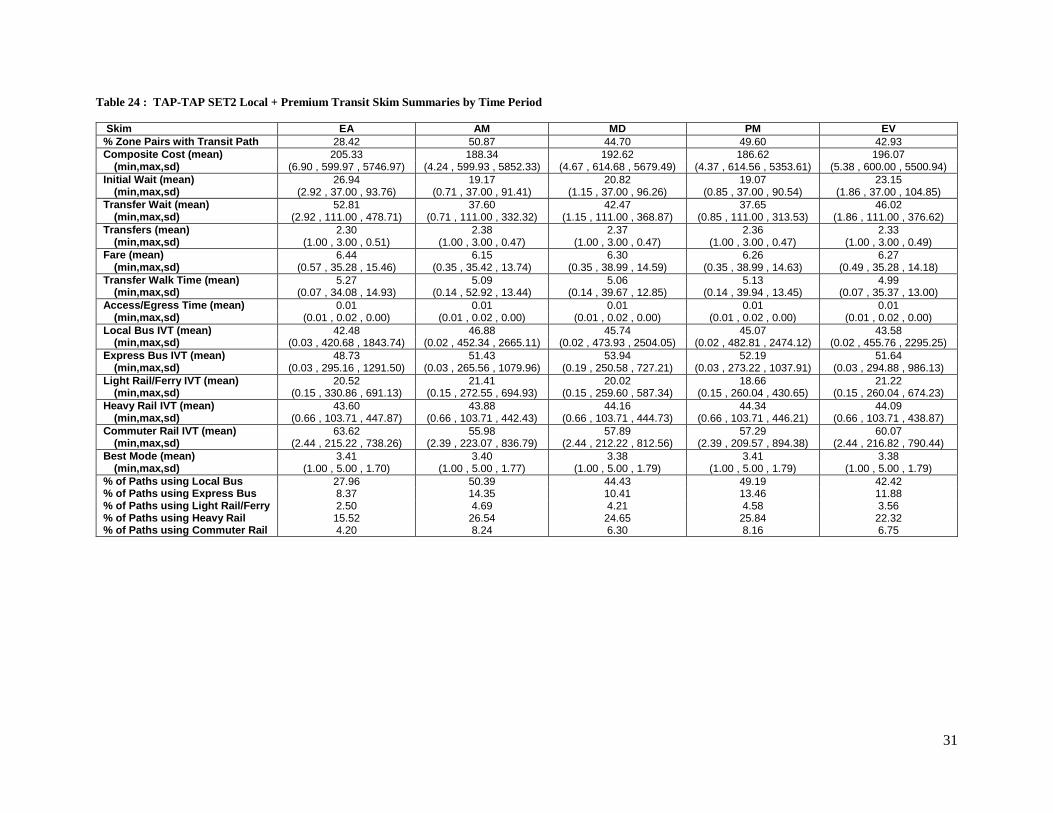
3 Note that the statistics reported in Table 23 and
Table 24 are for non-zero values of the respective matrices.
31
Table 24 : TAP-TAP SET2 Local + Premium Transit Skim Summaries by Time Period
Skim EA AM MD PM EV
% Zone Pairs with Transit Path 28.42 50.87 44.70 49.60 42.93
Composite Cost (mean) 205.33 188.34 192.62 186.62 196.07 (min,max,sd) (6.90 , 599.97 , 5746.97) (4.24 , 599.93 , 5852.33) (4.67 , 614.68 , 5679.49) (4.37 , 614.56 , 5353.61) (5.38 , 600.00 , 5500.94)
Initial Wait (mean) 26.94 19.17 20.82 19.07 23.15 (min,max,sd) (2.92 , 37.00 , 93.76) (0.71 , 37.00 , 91.41) (1.15 , 37.00 , 96.26) (0.85 , 37.00 , 90.54) (1.86 , 37.00 , 104.85)
Transfer Wait (mean) 52.81 37.60 42.47 37.65 46.02 (min,max,sd) (2.92 , 111.00 , 478.71) (0.71 , 111.00 , 332.32) (1.15 , 111.00 , 368.87) (0.85 , 111.00 , 313.53) (1.86 , 111.00 , 376.62)
Transfers (mean) 2.30 2.38 2.37 2.36 2.33 (min,max,sd) (1.00 , 3.00 , 0.51) (1.00 , 3.00 , 0.47) (1.00 , 3.00 , 0.47) (1.00 , 3.00 , 0.47) (1.00 , 3.00 , 0.49)
Fare (mean) 6.44 6.15 6.30 6.26 6.27 (min,max,sd) (0.57 , 35.28 , 15.46) (0.35 , 35.42 , 13.74) (0.35 , 38.99 , 14.59) (0.35 , 38.99 , 14.63) (0.49 , 35.28 , 14.18)
Transfer Walk Time (mean) 5.27 5.09 5.06 5.13 4.99 (min,max,sd) (0.07 , 34.08 , 14.93) (0.14 , 52.92 , 13.44) (0.14 , 39.67 , 12.85) (0.14 , 39.94 , 13.45) (0.07 , 35.37 , 13.00)
Access/Egress Time (mean) 0.01 0.01 0.01 0.01 0.01 (min,max,sd) (0.01 , 0.02 , 0.00) (0.01 , 0.02 , 0.00) (0.01 , 0.02 , 0.00) (0.01 , 0.02 , 0.00) (0.01 , 0.02 , 0.00)
Local Bus IVT (mean) 42.48 46.88 45.74 45.07 43.58 (min,max,sd) (0.03 , 420.68 , 1843.74) (0.02 , 452.34 , 2665.11) (0.02 , 473.93 , 2504.05) (0.02 , 482.81 , 2474.12) (0.02 , 455.76 , 2295.25)
Express Bus IVT (mean) 48.73 51.43 53.94 52.19 51.64 (min,max,sd) (0.03 , 295.16 , 1291.50) (0.03 , 265.56 , 1079.96) (0.19 , 250.58 , 727.21) (0.03 , 273.22 , 1037.91) (0.03 , 294.88 , 986.13)
Light Rail/Ferry IVT (mean) 20.52 21.41 20.02 18.66 21.22 (min,max,sd) (0.15 , 330.86 , 691.13) (0.15 , 272.55 , 694.93) (0.15 , 259.60 , 587.34) (0.15 , 260.04 , 430.65) (0.15 , 260.04 , 674.23)
Heavy Rail IVT (mean) 43.60 43.88 44.16 44.34 44.09 (min,max,sd) (0.66 , 103.71 , 447.87) (0.66 , 103.71 , 442.43) (0.66 , 103.71 , 444.73) (0.66 , 103.71 , 446.21) (0.66 , 103.71 , 438.87)
Commuter Rail IVT (mean) 63.62 55.98 57.89 57.29 60.07 (min,max,sd) (2.44 , 215.22 , 738.26) (2.39 , 223.07 , 836.79) (2.44 , 212.22 , 812.56) (2.39 , 209.57 , 894.38) (2.44 , 216.82 , 790.44)
Best Mode (mean) 3.41 3.40 3.38 3.41 3.38 (min,max,sd) (1.00 , 5.00 , 1.70) (1.00 , 5.00 , 1.77) (1.00 , 5.00 , 1.79) (1.00 , 5.00 , 1.79) (1.00 , 5.00 , 1.79)
% of Paths using Local Bus 27.96 50.39 44.43 49.19 42.42 % of Paths using Express Bus 8.37 14.35 10.41 13.46 11.88 % of Paths using Light Rail/Ferry 2.50 4.69 4.21 4.58 3.56 % of Paths using Heavy Rail 15.52 26.54 24.65 25.84 22.32 % of Paths using Commuter Rail 4.20 8.24 6.30 8.16 6.75
32
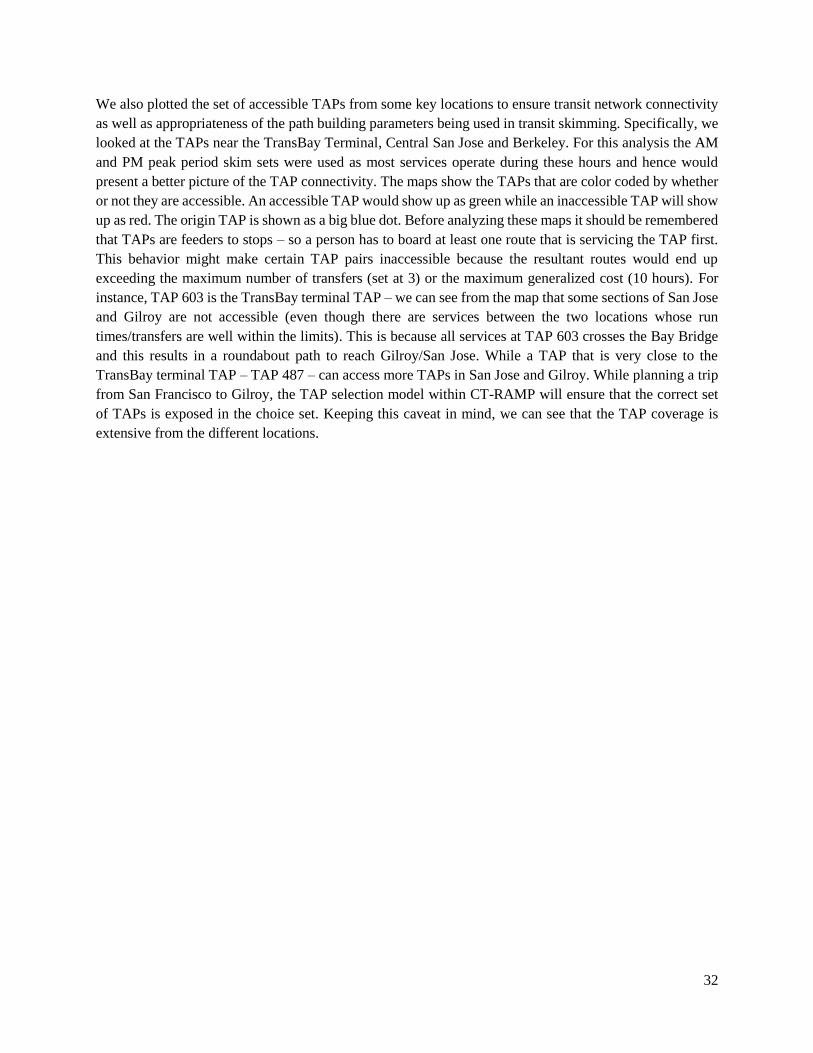
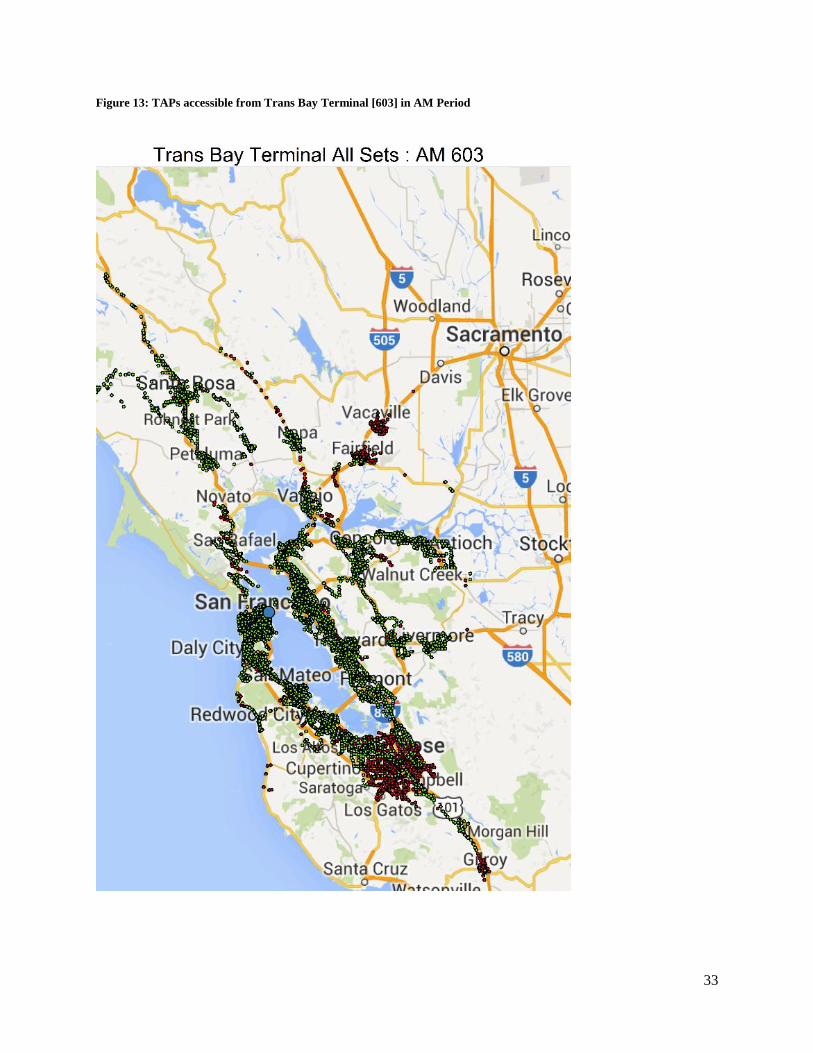
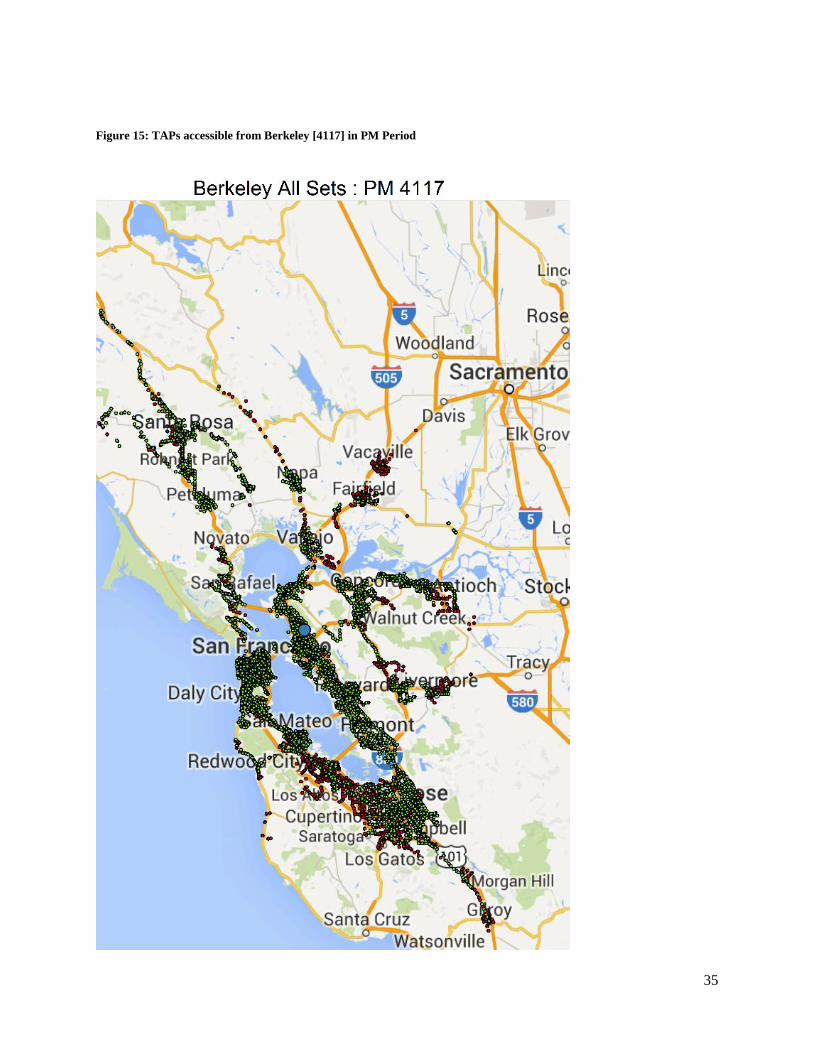
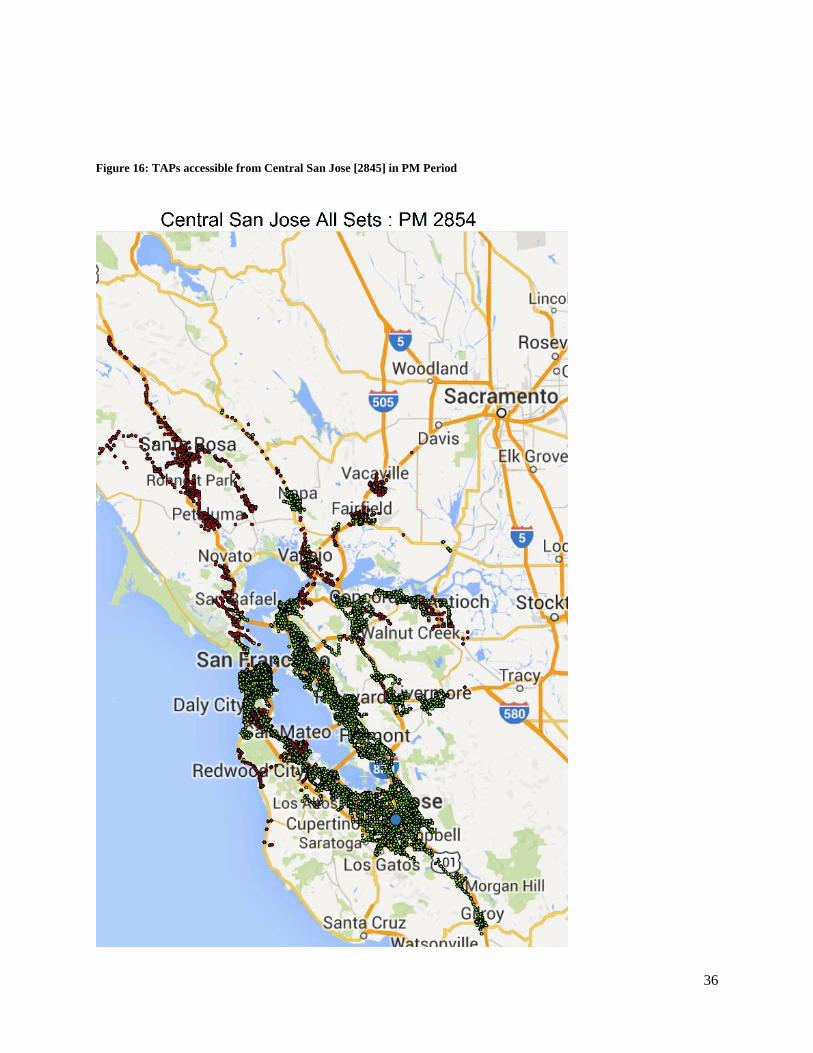
We also plotted the set of accessible TAPs from some key locations to ensure transit network connectivity
as well as appropriateness of the path building parameters being used in transit skimming. Specifically, we
looked at the TAPs near the TransBay Terminal, Central San Jose and Berkeley. For this analysis the AM
and PM peak period skim sets were used as most services operate during these hours and hence would
present a better picture of the TAP connectivity. The maps show the TAPs that are color coded by whether
or not they are accessible. An accessible TAP would show up as green while an inaccessible TAP will show
up as red. The origin TAP is shown as a big blue dot. Before analyzing these maps it should be remembered
that TAPs are feeders to stops – so a person has to board at least one route that is servicing the TAP first.
This behavior might make certain TAP pairs inaccessible because the resultant routes would end up
exceeding the maximum number of transfers (set at 3) or the maximum generalized cost (10 hours). For
instance, TAP 603 is the TransBay terminal TAP – we can see from the map that some sections of San Jose
and Gilroy are not accessible (even though there are services between the two locations whose run
times/transfers are well within the limits). This is because all services at TAP 603 crosses the Bay Bridge
and this results in a roundabout path to reach Gilroy/San Jose. While a TAP that is very close to the
TransBay terminal TAP – TAP 487 – can access more TAPs in San Jose and Gilroy. While planning a trip
from San Francisco to Gilroy, the TAP selection model within CT-RAMP will ensure that the correct set
of TAPs is exposed in the choice set. Keeping this caveat in mind, we can see that the TAP coverage is
extensive from the different locations.
33
Figure 13: TAPs accessible from Trans Bay Terminal [603] in AM Period
34
Figure 14: TAPs accessible from a Local TAP close to Trans Bay Terminal [487] in AM Period
35
Figure 15: TAPs accessible from Berkeley [4117] in PM Period
36
Figure 16: TAPs accessible from Central San Jose [2845] in PM Period
37
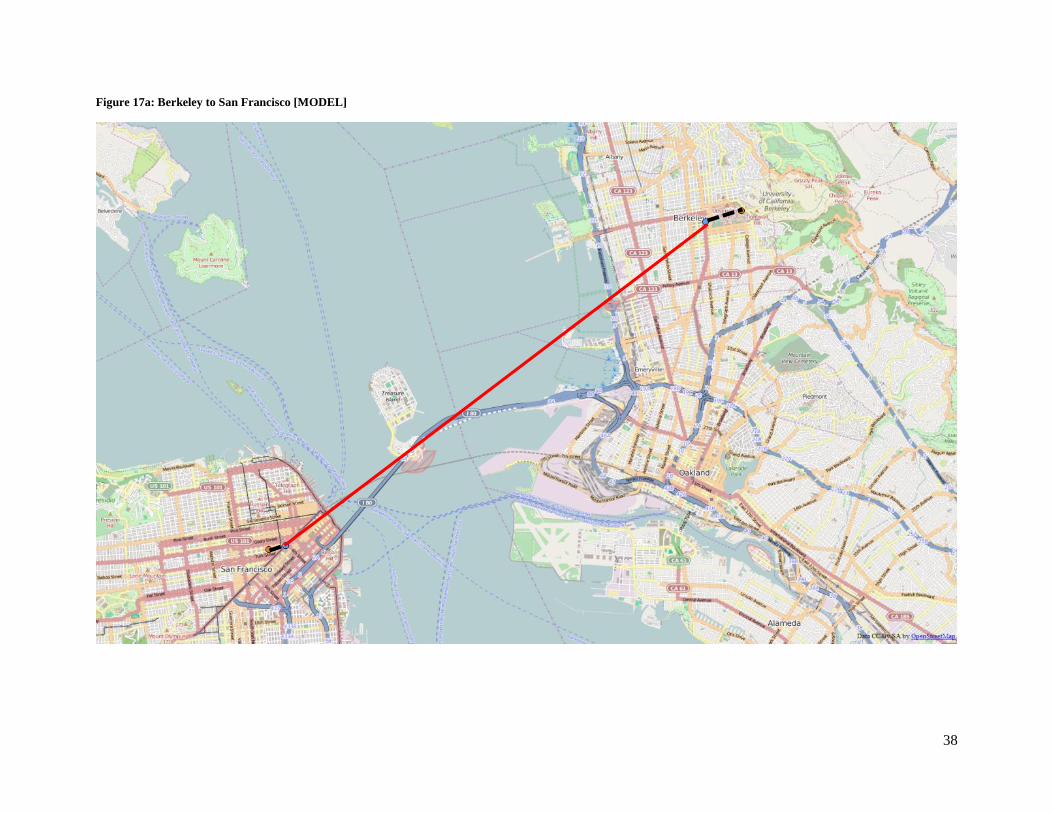
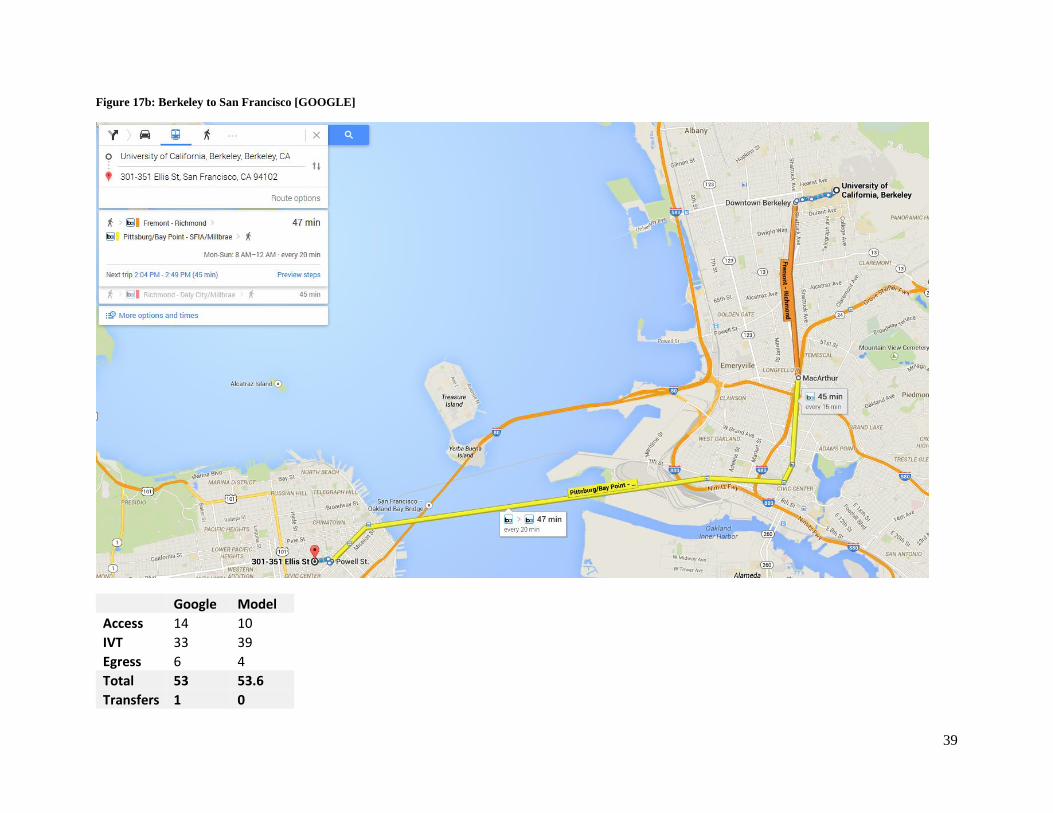
As a further verification of the transit skims, transit trips that are generated from CT-RAMP were selected
and mapped. These were compared with the Google Transit Trip planner to see if the paths generated were
reasonable. In following pages the map of the trip from the model is presented first followed by that
generated by Google. The model just outputs origin and destination MAZ and boarding and alighting TAPs
– the path has been approximated as a straight lines. We also compare the walk and travel times generated
by the skims and Google.
38
Figure 17a: Berkeley to San Francisco [MODEL]
39
Figure 17b: Berkeley to San Francisco [GOOGLE]
Google Model
Access 14 10
IVT 33 39
Egress 6 4
Total 53 53.6
Transfers 1 0
40
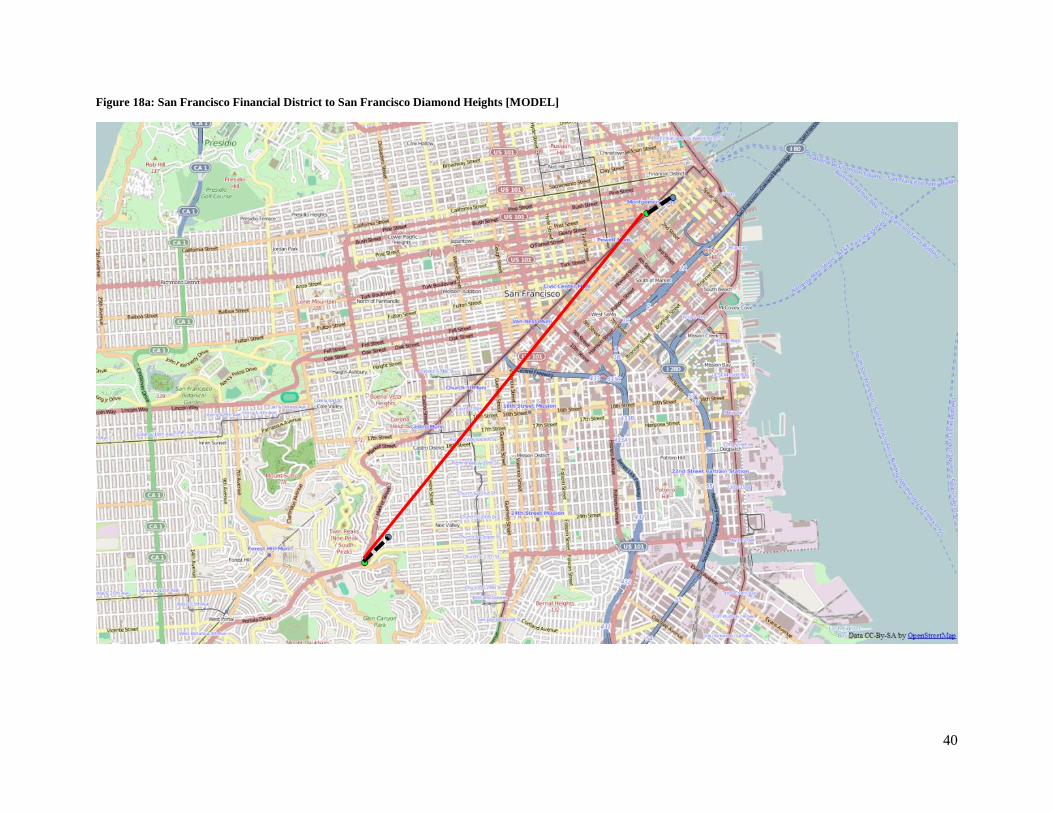
Figure 18a: San Francisco Financial District to San Francisco Diamond Heights [MODEL]
41
Figure 18b: San Francisco Financial District to San Francisco Diamond Heights [GOOGLE]
Google Model
Access 6 4
IVT 18 32
Egress 3 4
Total 27 39
Transfers 1 1
42
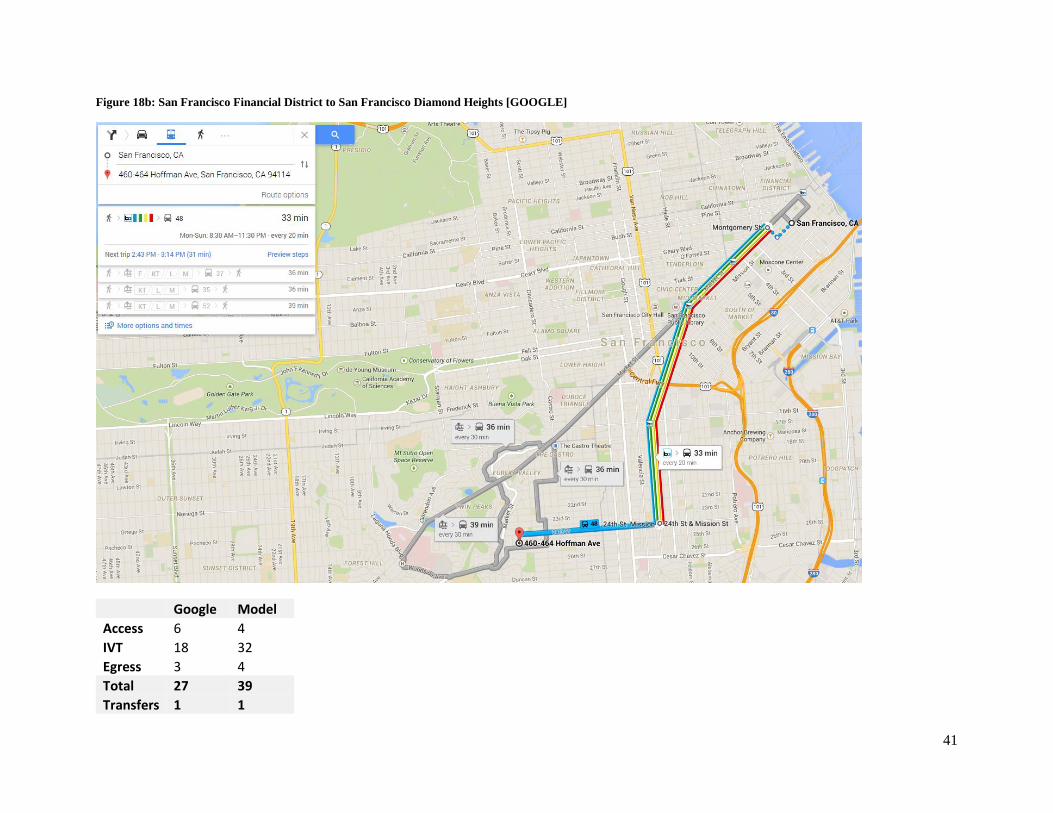
Figure 19a: San Francisco to Richmond [MODEL]
43
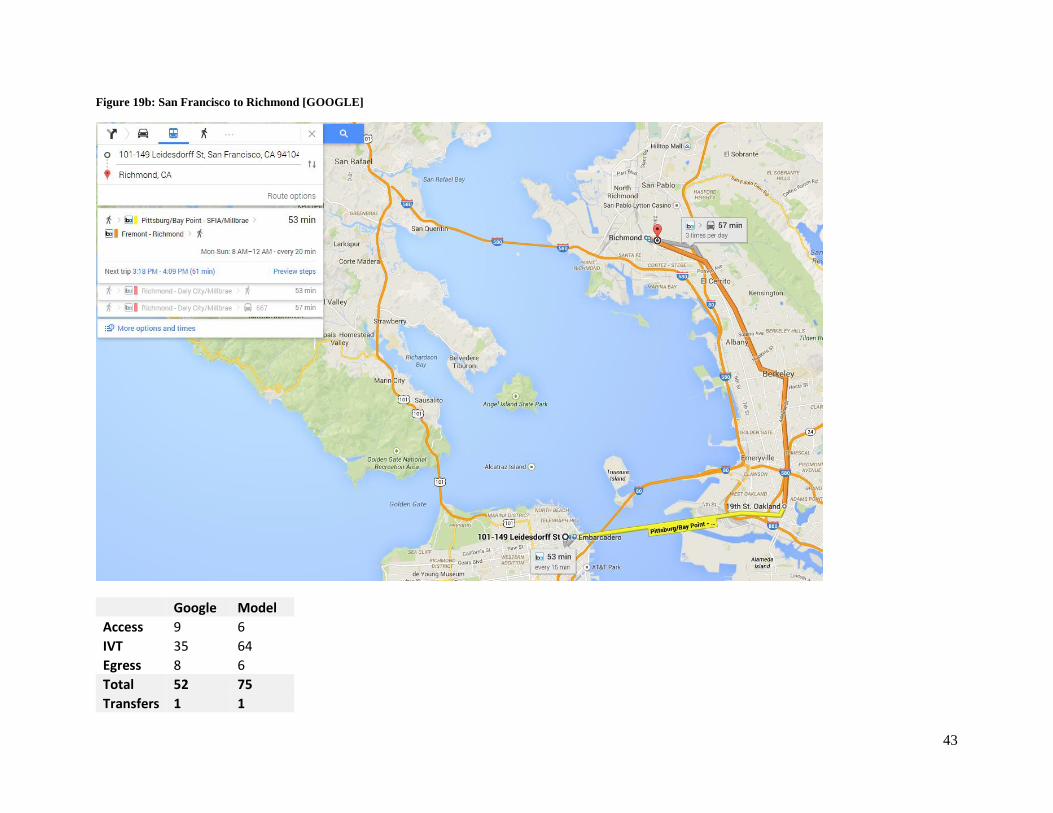
Figure 19b: San Francisco to Richmond [GOOGLE]
Google Model
Access 9 6
IVT 35 64
Egress 8 6
Total 52 75
Transfers 1 1
44
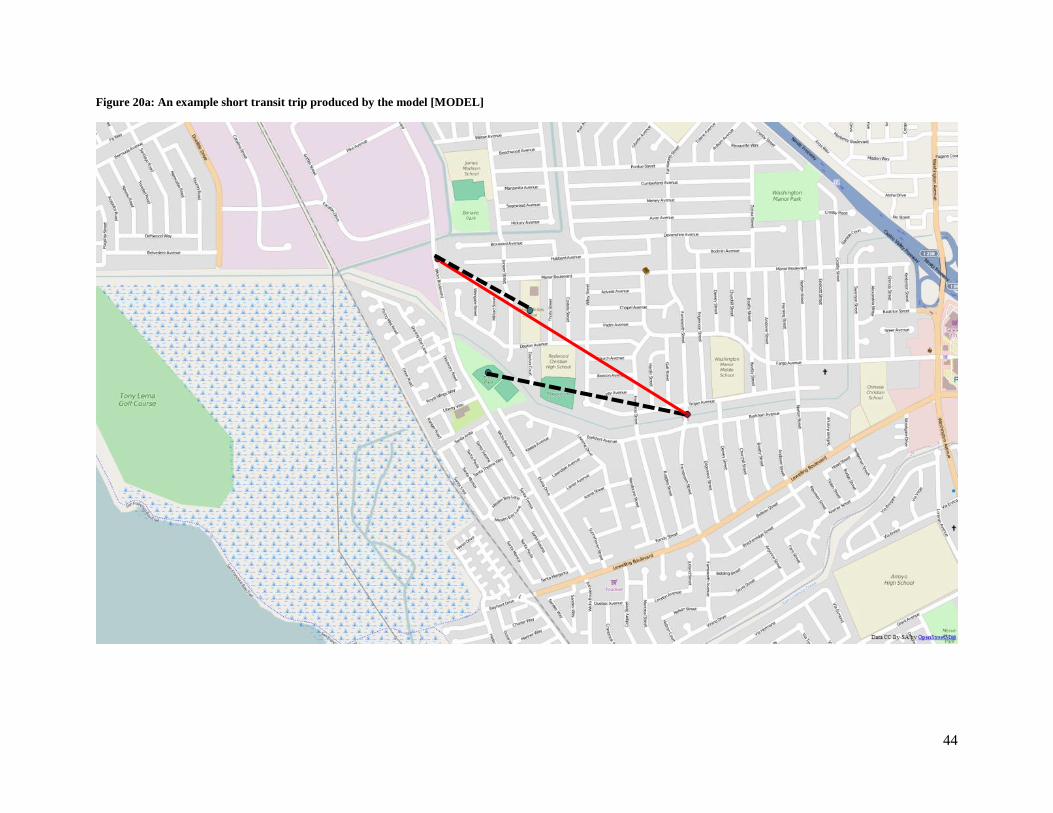
Figure 20a: An example short transit trip produced by the model [MODEL]
45
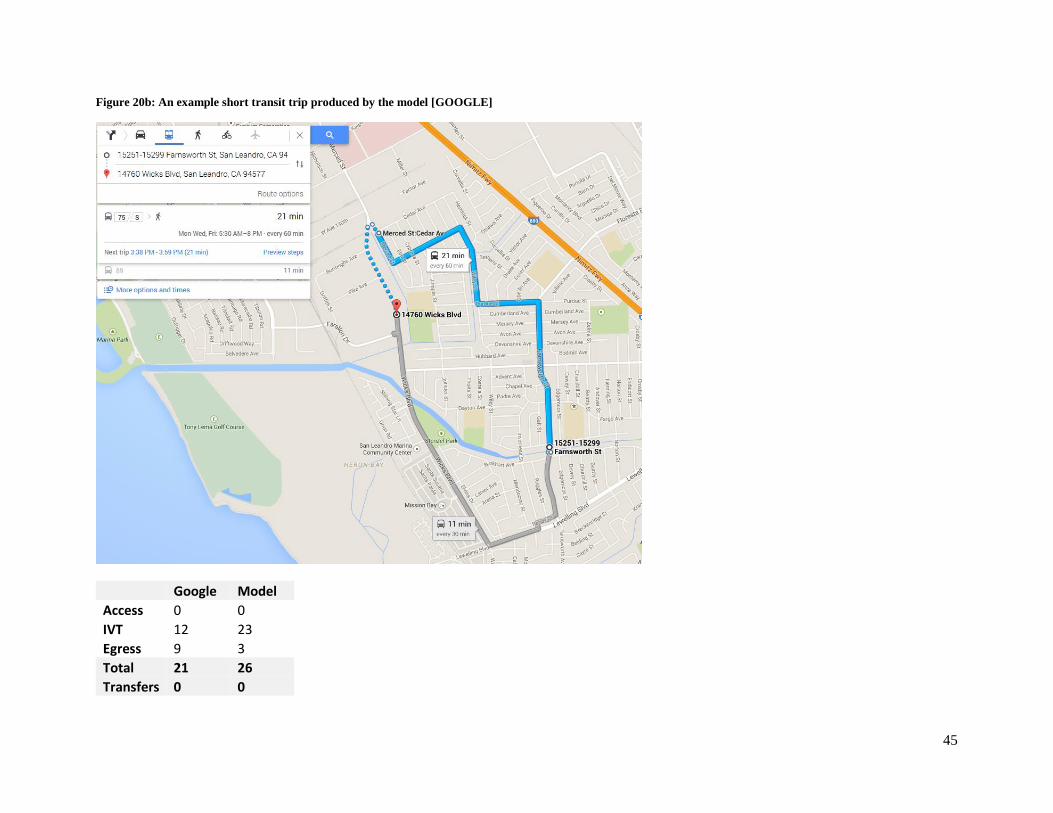
Figure 20b: An example short transit trip produced by the model [GOOGLE]
Google Model
Access 0 0
IVT 12 23
Egress 9 3
Total 21 26
Transfers 0 0
46
From the maps above we can see that the routes being predicted by the model are similar to what is being
generated on Google. In the first case we see that the times match very closely (Berkeley to San Francisco
example). For the second and third example that we have shown the model data is a bit higher. The final
example shows a short trip that is 0.02 miles apart and it is using transit – this does not seem like a logical
choice as walk is much better in this case, but it is likely that mode choice parameters are off resulting in
transit getting a higher utility. In any case the model and Google predicts similar routes – this suggests that
the transit component process is working correctly. Of course different wait curves will result in different
routes as well, and this is an area of improvement for the next phase of work. It should also be noted that
the trips shown here are synthetic in nature, and that is would be better to assign the on-board survey data
with the Travel Model Two software to illustrate goodness-of-fit.
47
7 CT-RAMP
CT-RAMP models the travel behavior of the individuals (households and person) living in the model
region. This includes determining the number of vehicles per household; the household daily activity
patterns; the workplace and school location; the tour frequency, destination, and time-of-day choice; and
mode choice. Basic tour, trip, and mode-choice results are presented to illustrate that the model is producing
reasonable results.
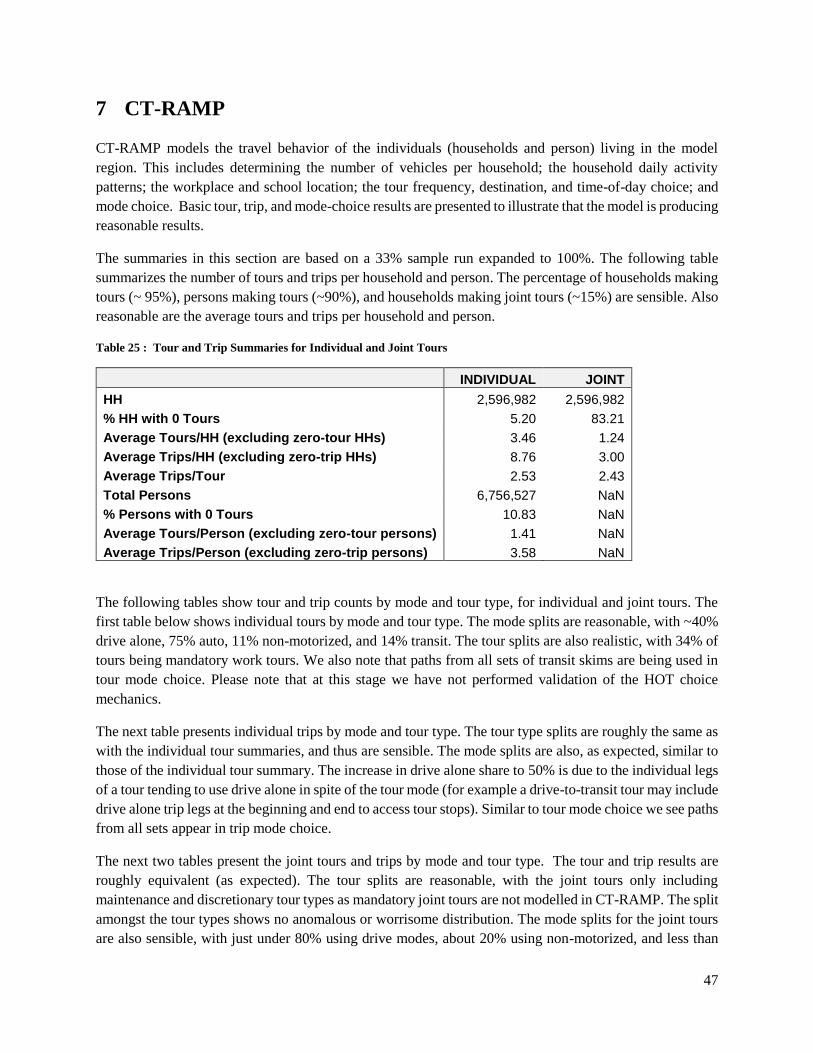
The summaries in this section are based on a 33% sample run expanded to 100%. The following table
summarizes the number of tours and trips per household and person. The percentage of households making
tours (~ 95%), persons making tours (~90%), and households making joint tours (~15%) are sensible. Also
reasonable are the average tours and trips per household and person.
Table 25 : Tour and Trip Summaries for Individual and Joint Tours
INDIVIDUAL JOINT
HH 2,596,982 2,596,982
% HH with 0 Tours 5.20 83.21
Average Tours/HH (excluding zero-tour HHs) 3.46 1.24
Average Trips/HH (excluding zero-trip HHs) 8.76 3.00
Average Trips/Tour 2.53 2.43
Total Persons 6,756,527 NaN
% Persons with 0 Tours 10.83 NaN
Average Tours/Person (excluding zero-tour persons) 1.41 NaN
Average Trips/Person (excluding zero-trip persons) 3.58 NaN
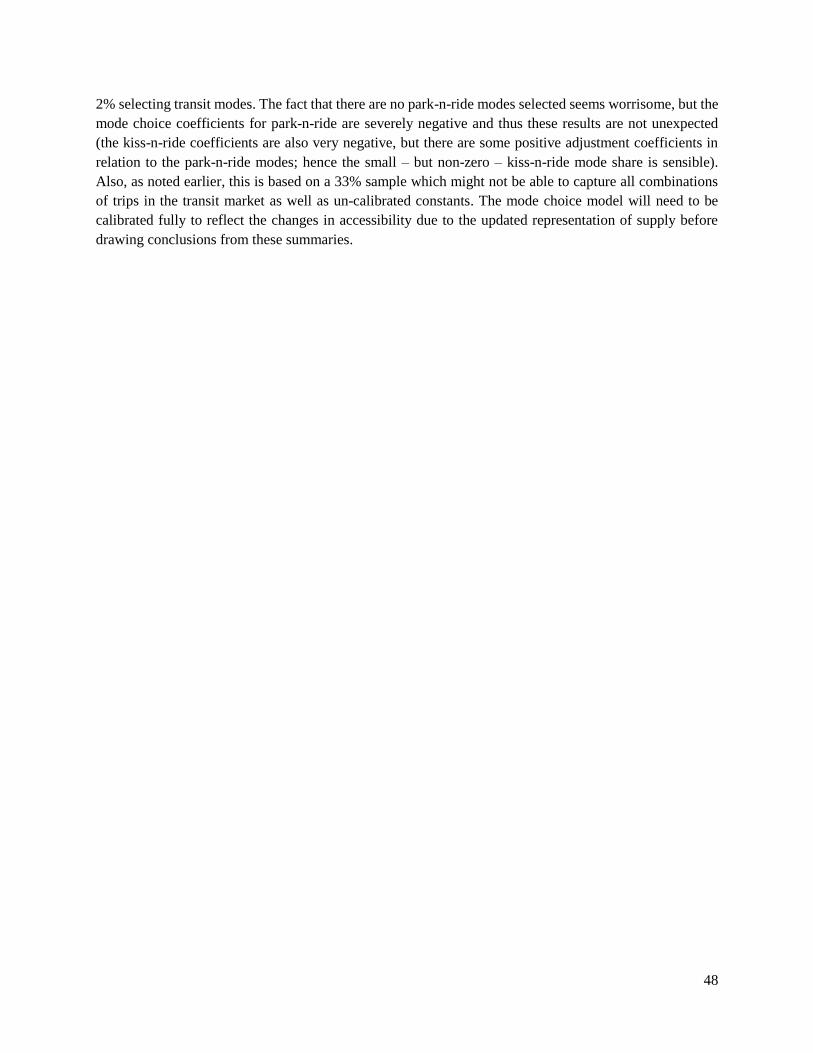
The following tables show tour and trip counts by mode and tour type, for individual and joint tours. The
first table below shows individual tours by mode and tour type. The mode splits are reasonable, with ~40%
drive alone, 75% auto, 11% non-motorized, and 14% transit. The tour splits are also realistic, with 34% of
tours being mandatory work tours. We also note that paths from all sets of transit skims are being used in
tour mode choice. Please note that at this stage we have not performed validation of the HOT choice
mechanics.
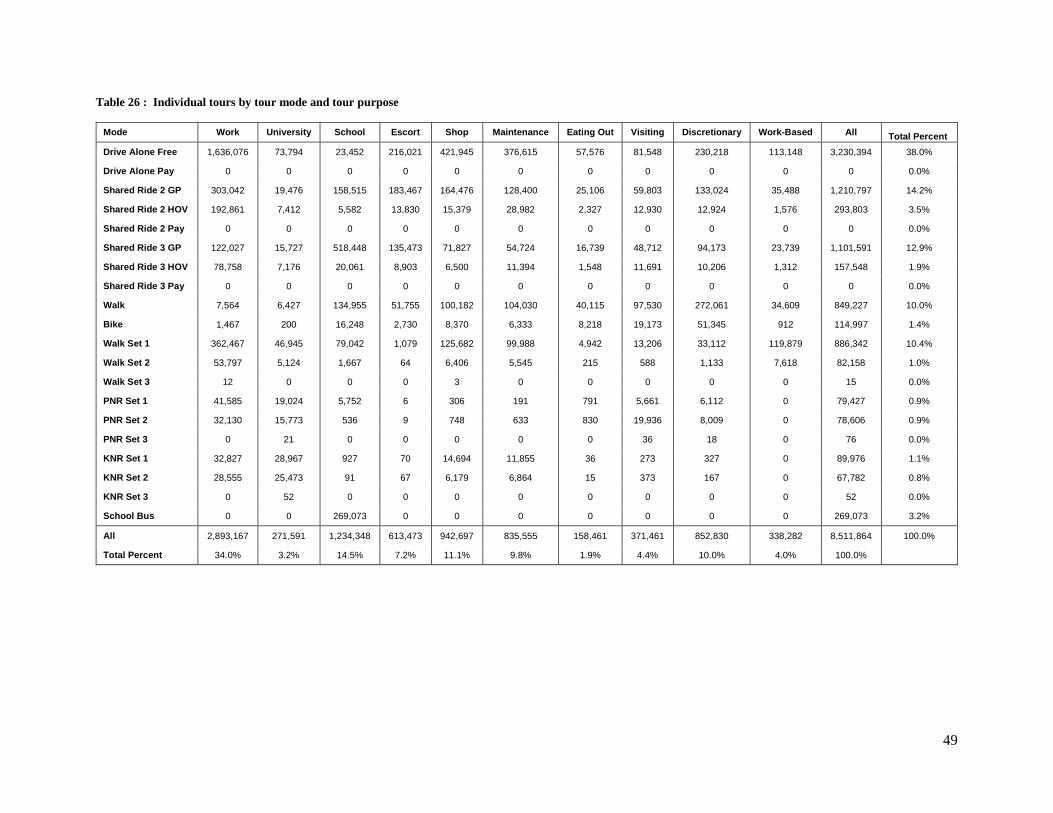
The next table presents individual trips by mode and tour type. The tour type splits are roughly the same as
with the individual tour summaries, and thus are sensible. The mode splits are also, as expected, similar to
those of the individual tour summary. The increase in drive alone share to 50% is due to the individual legs
of a tour tending to use drive alone in spite of the tour mode (for example a drive-to-transit tour may include
drive alone trip legs at the beginning and end to access tour stops). Similar to tour mode choice we see paths
from all sets appear in trip mode choice.
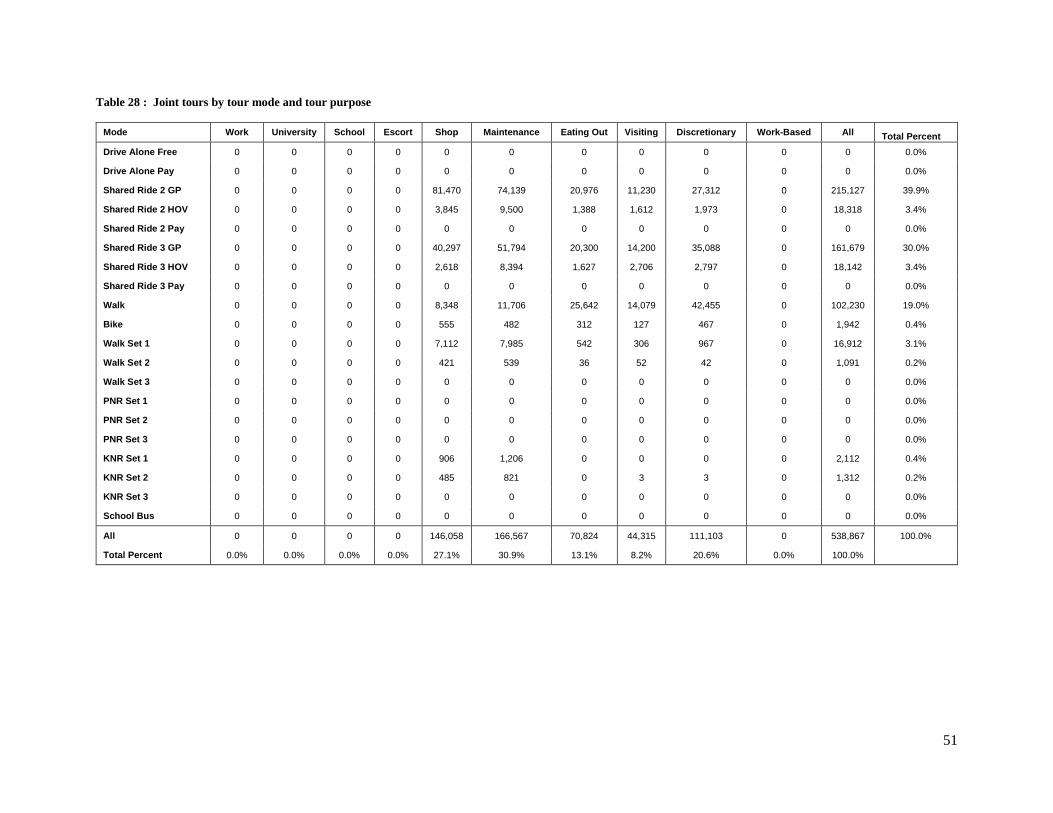
The next two tables present the joint tours and trips by mode and tour type. The tour and trip results are
roughly equivalent (as expected). The tour splits are reasonable, with the joint tours only including
maintenance and discretionary tour types as mandatory joint tours are not modelled in CT-RAMP. The split
amongst the tour types shows no anomalous or worrisome distribution. The mode splits for the joint tours
are also sensible, with just under 80% using drive modes, about 20% using non-motorized, and less than
48
2% selecting transit modes. The fact that there are no park-n-ride modes selected seems worrisome, but the
mode choice coefficients for park-n-ride are severely negative and thus these results are not unexpected
(the kiss-n-ride coefficients are also very negative, but there are some positive adjustment coefficients in
relation to the park-n-ride modes; hence the small – but non-zero – kiss-n-ride mode share is sensible).
Also, as noted earlier, this is based on a 33% sample which might not be able to capture all combinations
of trips in the transit market as well as un-calibrated constants. The mode choice model will need to be
calibrated fully to reflect the changes in accessibility due to the updated representation of supply before
drawing conclusions from these summaries.
49
Table 26 : Individual tours by tour mode and tour purpose
Mode Work University School Escort Shop Maintenance Eating Out Visiting Discretionary Work-Based All Total Percent
Drive Alone Free 1,636,076 73,794 23,452 216,021 421,945 376,615 57,576 81,548 230,218 113,148 3,230,394 38.0%
Drive Alone Pay 0 0 0 0 0 0 0 0 0 0 0 0.0%
Shared Ride 2 GP 303,042 19,476 158,515 183,467 164,476 128,400 25,106 59,803 133,024 35,488 1,210,797 14.2%
Shared Ride 2 HOV 192,861 7,412 5,582 13,830 15,379 28,982 2,327 12,930 12,924 1,576 293,803 3.5%
Shared Ride 2 Pay 0 0 0 0 0 0 0 0 0 0 0 0.0%
Shared Ride 3 GP 122,027 15,727 518,448 135,473 71,827 54,724 16,739 48,712 94,173 23,739 1,101,591 12.9%
Shared Ride 3 HOV 78,758 7,176 20,061 8,903 6,500 11,394 1,548 11,691 10,206 1,312 157,548 1.9%
Shared Ride 3 Pay 0 0 0 0 0 0 0 0 0 0 0 0.0%
Walk 7,564 6,427 134,955 51,755 100,182 104,030 40,115 97,530 272,061 34,609 849,227 10.0%
Bike 1,467 200 16,248 2,730 8,370 6,333 8,218 19,173 51,345 912 114,997 1.4%
Walk Set 1 362,467 46,945 79,042 1,079 125,682 99,988 4,942 13,206 33,112 119,879 886,342 10.4%
Walk Set 2 53,797 5,124 1,667 64 6,406 5,545 215 588 1,133 7,618 82,158 1.0%
Walk Set 3 12 0 0 0 3 0 0 0 0 0 15 0.0%
PNR Set 1 41,585 19,024 5,752 6 306 191 791 5,661 6,112 0 79,427 0.9%
PNR Set 2 32,130 15,773 536 9 748 633 830 19,936 8,009 0 78,606 0.9%
PNR Set 3 0 21 0 0 0 0 0 36 18 0 76 0.0%
KNR Set 1 32,827 28,967 927 70 14,694 11,855 36 273 327 0 89,976 1.1%
KNR Set 2 28,555 25,473 91 67 6,179 6,864 15 373 167 0 67,782 0.8%
KNR Set 3 0 52 0 0 0 0 0 0 0 0 52 0.0%
School Bus 0 0 269,073 0 0 0 0 0 0 0 269,073 3.2%
All 2,893,167 271,591 1,234,348 613,473 942,697 835,555 158,461 371,461 852,830 338,282 8,511,864 100.0%
Total Percent 34.0% 3.2% 14.5% 7.2% 11.1% 9.8% 1.9% 4.4% 10.0% 4.0% 100.0%
50
Table 27 : Individual trips by trip mode and tour purpose
Mode Work University School Escort Shop Maintenance Eating Out Visiting Discretionary Work-Based All Total Percent
Drive Alone Free 5,660,464 213,009 59,873 875,261 1,614,058 1,177,661 170,333 249,845 576,191 271,555 10,868,249 50.4%
Drive Alone Pay 0 0 0 0 0 0 0 0 0 0 0 0.0%
Shared Ride 2 GP 728,470 68,264 513,858 287,445 264,342 207,142 57,412 162,655 304,794 75,982 2,670,364 12.4%
Shared Ride 2 HOV 110,109 6,858 22,655 7,139 8,300 13,127 1,539 9,603 9,964 2,488 191,782 0.9%
Shared Ride 2 Pay 0 0 0 0 0 0 0 0 0 0 0 0.0%
Shared Ride 3 GP 169,967 36,600 1,055,361 176,861 84,445 67,842 26,227 93,579 168,530 42,752 1,922,164 8.9%
Shared Ride 3 HOV 27,873 4,136 49,282 4,276 2,664 4,061 785 6,133 6,142 1,342 106,694 0.5%
Shared Ride 3 Pay 0 0 0 0 0 0 0 0 0 0 0 0.0%
Walk 42,609 27,658 459,488 110,658 258,433 232,724 110,679 218,070 594,976 80,452 2,135,745 9.9%
Bike 3,267 461 33,603 5,755 21,161 14,061 22,342 40,094 110,585 2,082 253,409 1.2%
Walk Set 1 867,521 116,876 163,848 2,252 294,261 216,103 11,285 26,215 64,348 256,130 2,018,839 9.4%
Walk Set 2 166,685 17,885 8,600 203 25,491 20,867 997 2,355 4,839 26,403 274,324 1.3%
Walk Set 3 297 27 6 0 33 15 0 3 0 27 409 0.0%
PNR Set 1 50,097 25,745 8,939 9 309 203 773 5,882 8,576 0 100,533 0.5%
PNR Set 2 88,285 35,852 2,176 15 1,273 1,191 1,145 31,785 15,336 0 177,058 0.8%
PNR Set 3 930 785 3 0 33 67 27 1,597 661 0 4,103 0.0%
KNR Set 1 40,661 38,652 1,597 88 20,261 16,306 30 312 470 0 118,376 0.5%
KNR Set 2 79,245 57,764 376 167 17,606 19,421 36 909 452 0 175,976 0.8%
KNR Set 3 800 1,267 0 3 76 106 0 15 6 0 2,273 0.0%
School Bus 0 0 538,145 0 0 0 0 0 0 0 538,145 2.5%
All 8,037,279 651,836 2,917,809 1,470,130 2,612,745 1,990,897 403,612 849,052 1,865,870 759,212 21,558,442 100.0%
Total Percent 37.3% 3.0% 13.5% 6.8% 12.1% 9.2% 1.9% 3.9% 8.7% 3.5% 100.0%
51
Table 28 : Joint tours by tour mode and tour purpose
Mode Work University School Escort Shop Maintenance Eating Out Visiting Discretionary Work-Based All Total Percent
Drive Alone Free 0 0 0 0 0 0 0 0 0 0 0 0.0%
Drive Alone Pay 0 0 0 0 0 0 0 0 0 0 0 0.0%
Shared Ride 2 GP 0 0 0 0 81,470 74,139 20,976 11,230 27,312 0 215,127 39.9%
Shared Ride 2 HOV 0 0 0 0 3,845 9,500 1,388 1,612 1,973 0 18,318 3.4%
Shared Ride 2 Pay 0 0 0 0 0 0 0 0 0 0 0 0.0%
Shared Ride 3 GP 0 0 0 0 40,297 51,794 20,300 14,200 35,088 0 161,679 30.0%
Shared Ride 3 HOV 0 0 0 0 2,618 8,394 1,627 2,706 2,797 0 18,142 3.4%
Shared Ride 3 Pay 0 0 0 0 0 0 0 0 0 0 0 0.0%
Walk 0 0 0 0 8,348 11,706 25,642 14,079 42,455 0 102,230 19.0%
Bike 0 0 0 0 555 482 312 127 467 0 1,942 0.4%
Walk Set 1 0 0 0 0 7,112 7,985 542 306 967 0 16,912 3.1%
Walk Set 2 0 0 0 0 421 539 36 52 42 0 1,091 0.2%
Walk Set 3 0 0 0 0 0 0 0 0 0 0 0 0.0%
PNR Set 1 0 0 0 0 0 0 0 0 0 0 0 0.0%
PNR Set 2 0 0 0 0 0 0 0 0 0 0 0 0.0%
PNR Set 3 0 0 0 0 0 0 0 0 0 0 0 0.0%
KNR Set 1 0 0 0 0 906 1,206 0 0 0 0 2,112 0.4%
KNR Set 2 0 0 0 0 485 821 0 3 3 0 1,312 0.2%
KNR Set 3 0 0 0 0 0 0 0 0 0 0 0 0.0%
School Bus 0 0 0 0 0 0 0 0 0 0 0 0.0%
All 0 0 0 0 146,058 166,567 70,824 44,315 111,103 0 538,867 100.0%
Total Percent 0.0% 0.0% 0.0% 0.0% 27.1% 30.9% 13.1% 8.2% 20.6% 0.0% 100.0%

52
Table 29 : Joint trips by trip mode and tour purpose
Mode Work University School Escort Shop Maintenance Eating Out Visiting Discretionary Work-Based All Total Percent
Drive Alone Free 0 0 0 0 0 0 0 0 0 0 0 0.0%
Drive Alone Pay 0 0 0 0 0 0 0 0 0 0 0 0.0%
Shared Ride 2 GP 0 0 0 0 264,797 217,136 57,958 39,912 67,182 0 646,985 49.4%
Shared Ride 2 HOV 0 0 0 0 5,652 9,133 1,491 1,894 2,073 0 20,242 1.5%
Shared Ride 2 Pay 0 0 0 0 0 0 0 0 0 0 0 0.0%
Shared Ride 3 GP 0 0 0 0 98,642 112,288 38,888 28,861 69,500 0 348,179 26.6%
Shared Ride 3 HOV 0 0 0 0 2,945 6,173 1,242 1,800 2,345 0 14,506 1.1%
Shared Ride 3 Pay 0 0 0 0 0 0 0 0 0 0 0 0.0%
Walk 0 0 0 0 21,227 25,745 60,852 30,467 88,679 0 226,970 17.3%
Bike 0 0 0 0 1,379 1,094 745 273 948 0 4,439 0.3%
Walk Set 1 0 0 0 0 16,545 16,927 1,255 685 1,861 0 37,273 2.8%
Walk Set 2 0 0 0 0 1,730 1,970 133 109 182 0 4,124 0.3%
Walk Set 3 0 0 0 0 0 6 0 0 0 0 6 0.0%
PNR Set 1 0 0 0 0 0 0 0 0 0 0 0 0.0%
PNR Set 2 0 0 0 0 0 0 0 0 0 0 0 0.0%
PNR Set 3 0 0 0 0 0 0 0 0 0 0 0 0.0%
KNR Set 1 0 0 0 0 1,052 1,548 0 0 3 0 2,603 0.2%
KNR Set 2 0 0 0 0 1,148 2,191 0 6 0 0 3,345 0.3%
KNR Set 3 0 0 0 0 0 12 0 0 3 0 15 0.0%
School Bus 0 0 0 0 0 0 0 0 0 0 0 0.0%
All 0 0 0 0 415,118 394,224 162,564 104,006 232,776 0 1,308,688 100.0%
Total Percent 0.0% 0.0% 0.0% 0.0% 31.7% 30.1% 12.4% 7.9% 17.8% 0.0% 100.0%
53
8 Internal-External Trips
8.1 IX Trip Forecast, IX Trip Time-of-Day, IX Toll Choice
The internal-external (IX) trip model uses a 2005 base-year trip table and grows the trips based on growth
rates specific to each external zone. The time-of-day split is calculated based on fixed factors and the toll-
choice split uses a simple logit model using travel time and cost. A map showing the external stations is
presented below.
Figure 21: External Station Locations
The tables below present a summary of the crossing (in and out) by station’s county. It is seen that the two
counties which are completely “internal” to the region – San Francisco and Marin – have no external trip
ends. Also, external-external (XX) trips were recorded for Solano county and are presented in the final
table. Overall the results appear reasonable.
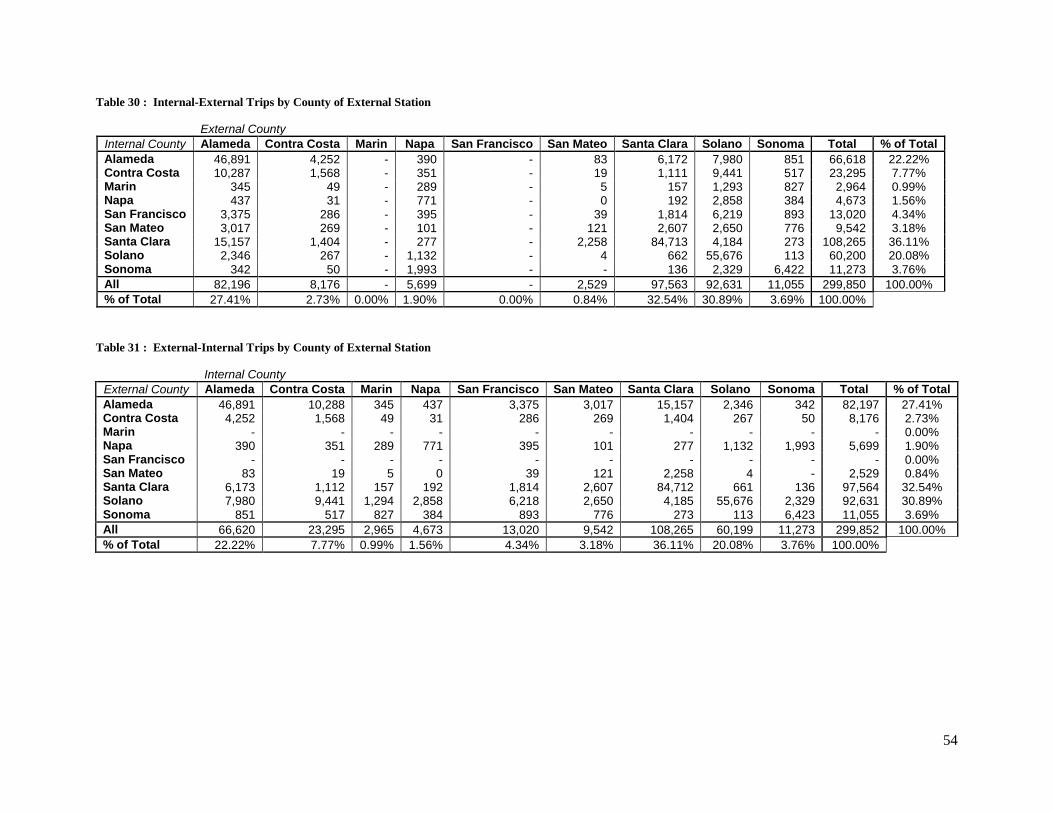
54
Table 30 : Internal-External Trips by County of External Station
External County
Internal County Alameda Contra Costa Marin Napa San Francisco San Mateo Santa Clara Solano Sonoma Total % of Total
Alameda 46,891 4,252 - 390 - 83 6,172 7,980 851 66,618 22.22% Contra Costa 10,287 1,568 - 351 - 19 1,111 9,441 517 23,295 7.77% Marin 345 49 - 289 - 5 157 1,293 827 2,964 0.99% Napa 437 31 - 771 - 0 192 2,858 384 4,673 1.56% San Francisco 3,375 286 - 395 - 39 1,814 6,219 893 13,020 4.34% San Mateo 3,017 269 - 101 - 121 2,607 2,650 776 9,542 3.18% Santa Clara 15,157 1,404 - 277 - 2,258 84,713 4,184 273 108,265 36.11% Solano 2,346 267 - 1,132 - 4 662 55,676 113 60,200 20.08% Sonoma 342 50 - 1,993 - - 136 2,329 6,422 11,273 3.76%
All 82,196 8,176 - 5,699 - 2,529 97,563 92,631 11,055 299,850 100.00%
% of Total 27.41% 2.73% 0.00% 1.90% 0.00% 0.84% 32.54% 30.89% 3.69% 100.00%
Table 31 : External-Internal Trips by County of External Station
Internal County
External County Alameda Contra Costa Marin Napa San Francisco San Mateo Santa Clara Solano Sonoma Total % of Total
Alameda 46,891 10,288 345 437 3,375 3,017 15,157 2,346 342 82,197 27.41% Contra Costa 4,252 1,568 49 31 286 269 1,404 267 50 8,176 2.73% Marin - - - - - - - - - - 0.00% Napa 390 351 289 771 395 101 277 1,132 1,993 5,699 1.90% San Francisco - - - - - - - - - - 0.00% San Mateo 83 19 5 0 39 121 2,258 4 - 2,529 0.84% Santa Clara 6,173 1,112 157 192 1,814 2,607 84,712 661 136 97,564 32.54% Solano 7,980 9,441 1,294 2,858 6,218 2,650 4,185 55,676 2,329 92,631 30.89% Sonoma 851 517 827 384 893 776 273 113 6,423 11,055 3.69%
All 66,620 23,295 2,965 4,673 13,020 9,542 108,265 60,199 11,273 299,852 100.00%
% of Total 22.22% 7.77% 0.99% 1.56% 4.34% 3.18% 36.11% 20.08% 3.76% 100.00%
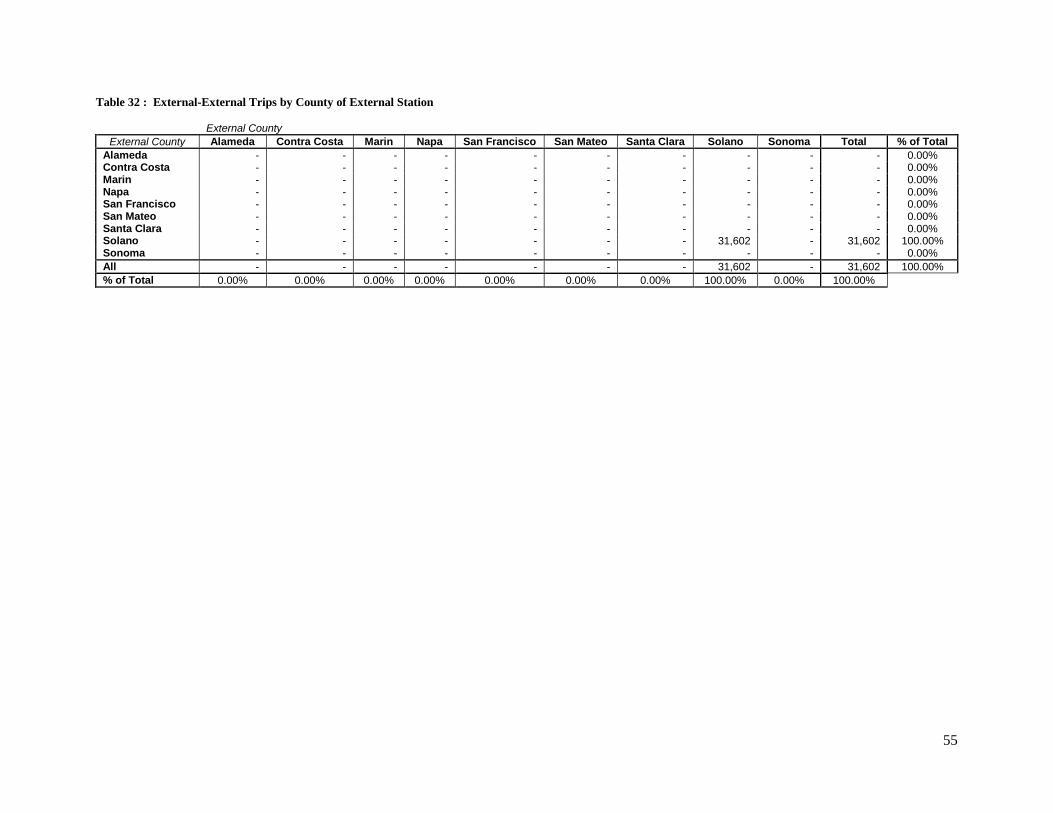
55
Table 32 : External-External Trips by County of External Station
External County
External County Alameda Contra Costa Marin Napa San Francisco San Mateo Santa Clara Solano Sonoma Total % of Total
Alameda - - - - - - - - - - 0.00% Contra Costa - - - - - - - - - - 0.00% Marin - - - - - - - - - - 0.00% Napa - - - - - - - - - - 0.00% San Francisco - - - - - - - - - - 0.00% San Mateo - - - - - - - - - - 0.00% Santa Clara - - - - - - - - - - 0.00% Solano - - - - - - - 31,602 - 31,602 100.00% Sonoma - - - - - - - - - - 0.00%
All - - - - - - - 31,602 - 31,602 100.00%
% of Total 0.00% 0.00% 0.00% 0.00% 0.00% 0.00% 0.00% 100.00% 0.00% 100.00%
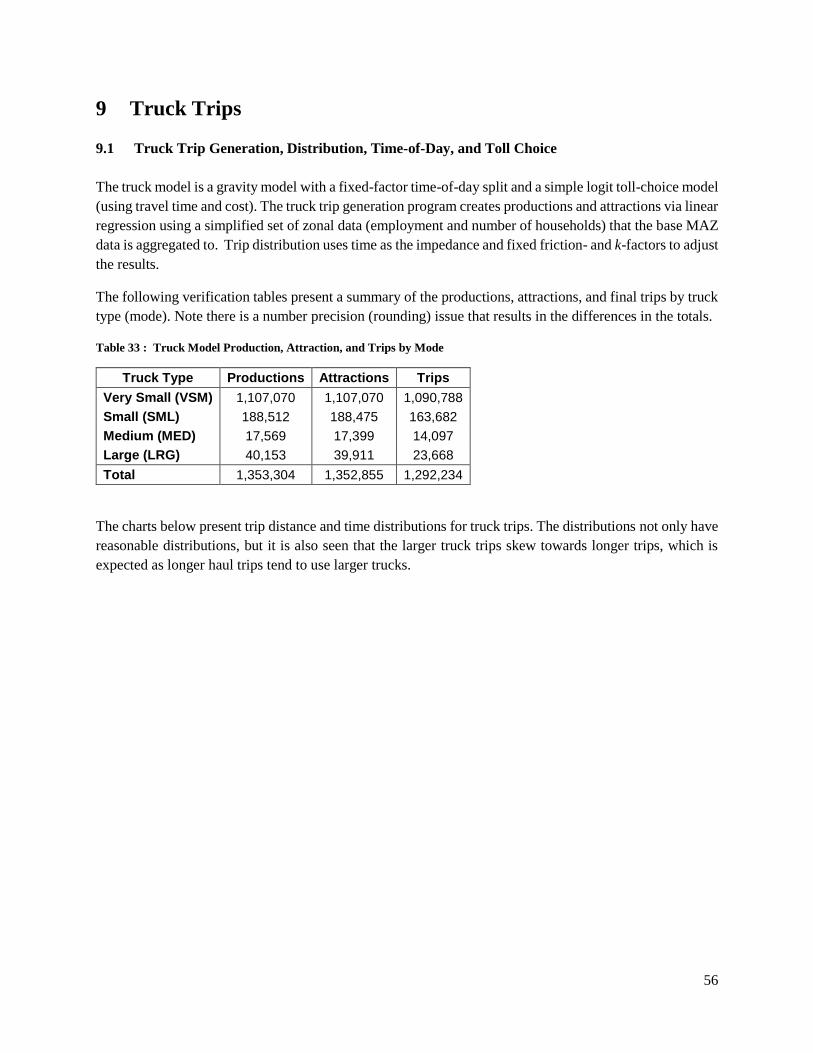
56
9 Truck Trips
9.1 Truck Trip Generation, Distribution, Time-of-Day, and Toll Choice
The truck model is a gravity model with a fixed-factor time-of-day split and a simple logit toll-choice model
(using travel time and cost). The truck trip generation program creates productions and attractions via linear
regression using a simplified set of zonal data (employment and number of households) that the base MAZ
data is aggregated to. Trip distribution uses time as the impedance and fixed friction- and k-factors to adjust
the results.
The following verification tables present a summary of the productions, attractions, and final trips by truck
type (mode). Note there is a number precision (rounding) issue that results in the differences in the totals.
Table 33 : Truck Model Production, Attraction, and Trips by Mode
Truck Type Productions Attractions Trips
Very Small (VSM) 1,107,070 1,107,070 1,090,788
Small (SML) 188,512 188,475 163,682
Medium (MED) 17,569 17,399 14,097
Large (LRG) 40,153 39,911 23,668
Total 1,353,304 1,352,855 1,292,234
The charts below present trip distance and time distributions for truck trips. The distributions not only have
reasonable distributions, but it is also seen that the larger truck trips skew towards longer trips, which is
expected as longer haul trips tend to use larger trucks.
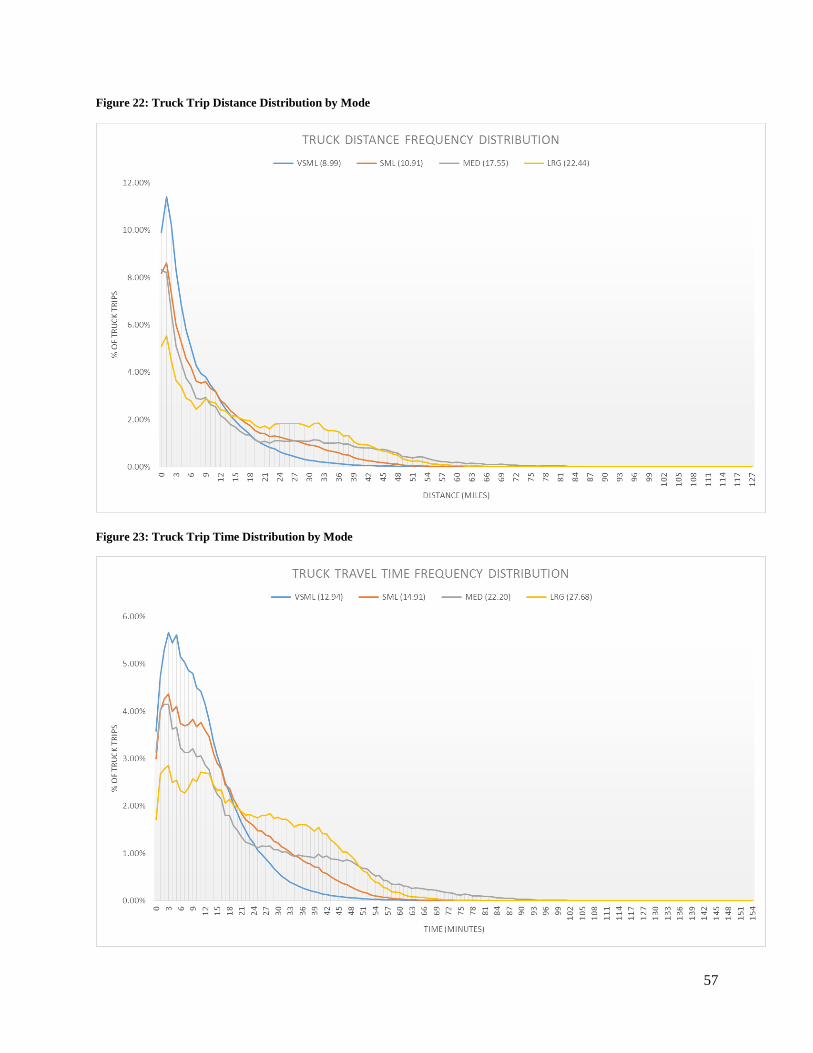
57
Figure 22: Truck Trip Distance Distribution by Mode
Figure 23: Truck Trip Time Distribution by Mode
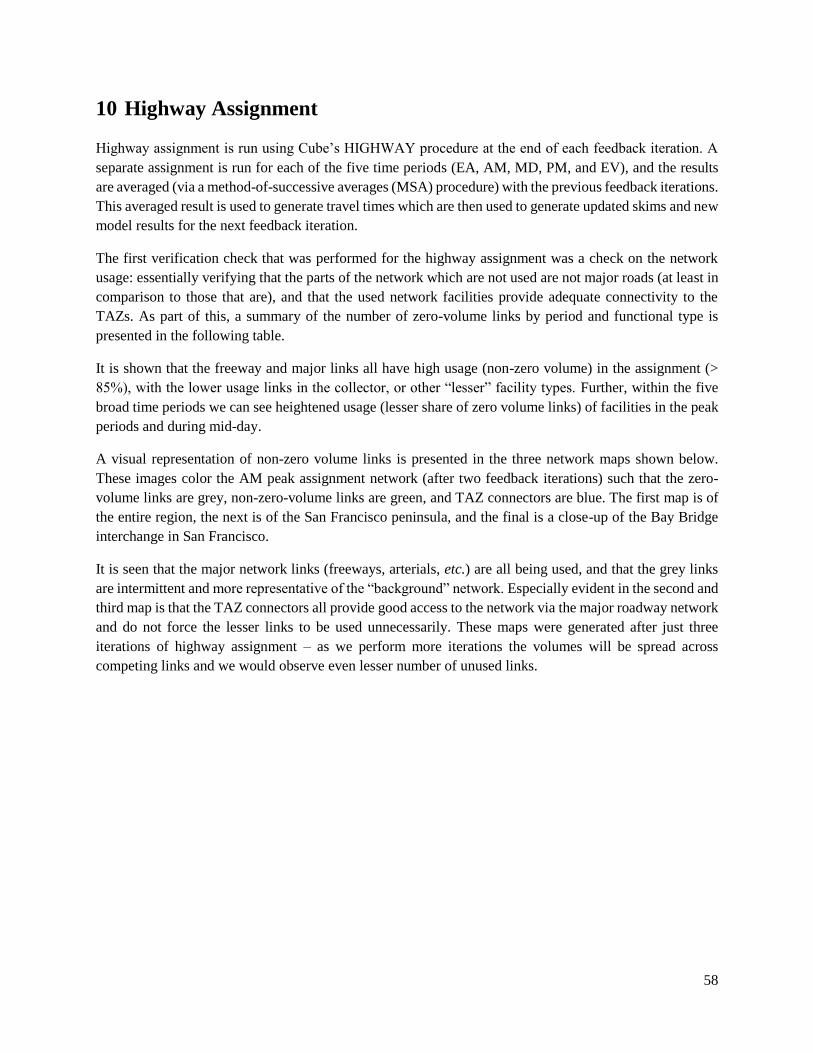
58
10 Highway Assignment
Highway assignment is run using Cube’s HIGHWAY procedure at the end of each feedback iteration. A
separate assignment is run for each of the five time periods (EA, AM, MD, PM, and EV), and the results
are averaged (via a method-of-successive averages (MSA) procedure) with the previous feedback iterations.
This averaged result is used to generate travel times which are then used to generate updated skims and new
model results for the next feedback iteration.
The first verification check that was performed for the highway assignment was a check on the network
usage: essentially verifying that the parts of the network which are not used are not major roads (at least in
comparison to those that are), and that the used network facilities provide adequate connectivity to the
TAZs. As part of this, a summary of the number of zero-volume links by period and functional type is
presented in the following table.
It is shown that the freeway and major links all have high usage (non-zero volume) in the assignment (>
85%), with the lower usage links in the collector, or other “lesser” facility types. Further, within the five
broad time periods we can see heightened usage (lesser share of zero volume links) of facilities in the peak
periods and during mid-day.
A visual representation of non-zero volume links is presented in the three network maps shown below.
These images color the AM peak assignment network (after two feedback iterations) such that the zero-
volume links are grey, non-zero-volume links are green, and TAZ connectors are blue. The first map is of
the entire region, the next is of the San Francisco peninsula, and the final is a close-up of the Bay Bridge
interchange in San Francisco.
It is seen that the major network links (freeways, arterials, etc.) are all being used, and that the grey links
are intermittent and more representative of the “background” network. Especially evident in the second and
third map is that the TAZ connectors all provide good access to the network via the major roadway network
and do not force the lesser links to be used unnecessarily. These maps were generated after just three
iterations of highway assignment – as we perform more iterations the volumes will be spread across
competing links and we would observe even lesser number of unused links.
59
Table 34 : Zero-Volume Link Count Summary by Facility Type
Facility Type Zero-Volume Link Count (% of Total)
EA AM MD PM EV Total
Freeway Connector 65 (8.31%) 43 (6.64%) 52 (8.54%) 52 (7.89%) 103 (15.06%) 315 (9.31%)
Freeway 1,444 (7.68%) 516 (2.89%) 442 (2.69%) 953 (6.10%) 3,295 (16.39%) 6,650 (7.49%)
Expressway 1,320 (5.21%) 679 (3.02%) 510 (2.24%) 611 (2.69%) 2,423 (8.40%) 5,543 (4.54%)
Collector 576,020 (81.07%) 453,640 (63.28%) 383,411 (60.81%) 389,237 (63.32%) 481,717 (75.40%) 2,284,025 (68.97%)
Freeway Ramp 726 (10.45%) 440 (6.69%) 368 (6.19%) 371 (6.49%) 465 (9.90%) 2,370 (7.93%)
Major Arterial 26,516 (13.39%) 8,915 (4.68%) 7,902 (4.68%) 8,387 (5.08%) 20,104 (10.97%) 71,824 (7.93%)
Special Facility - - - - 37 (100.00%) 37 (100.00%)
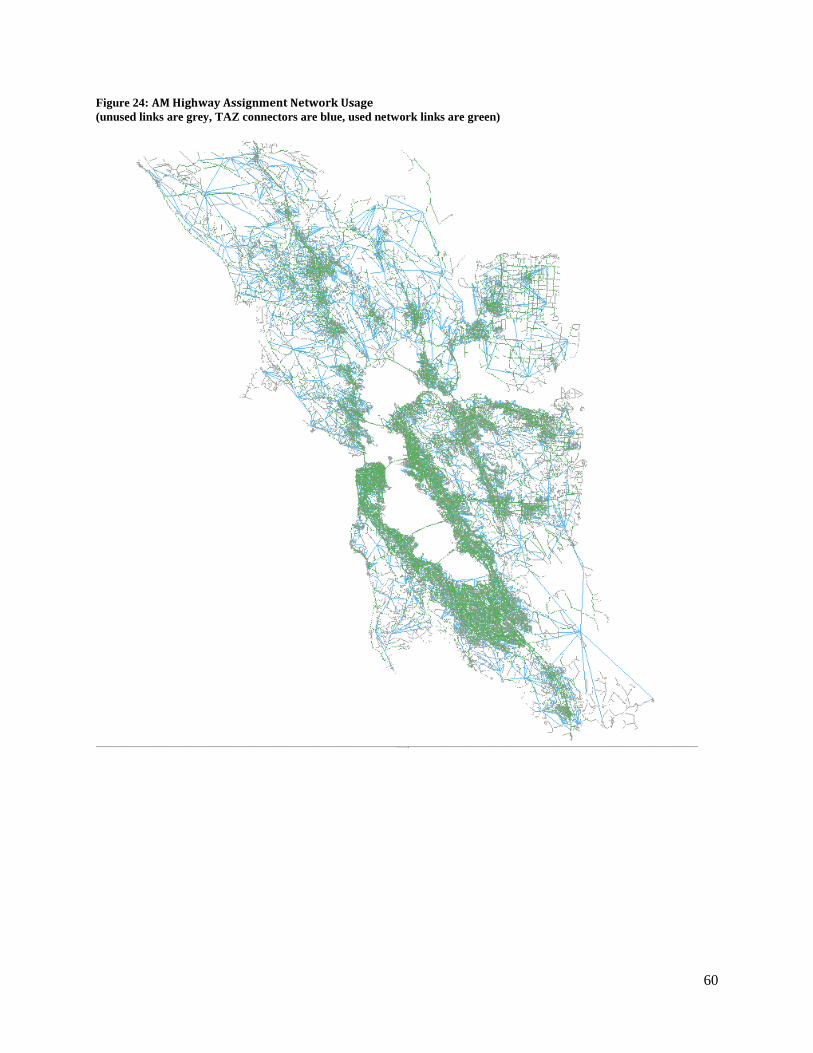
60
Figure 24: AM Highway Assignment Network Usage (unused links are grey, TAZ connectors are blue, used network links are green)
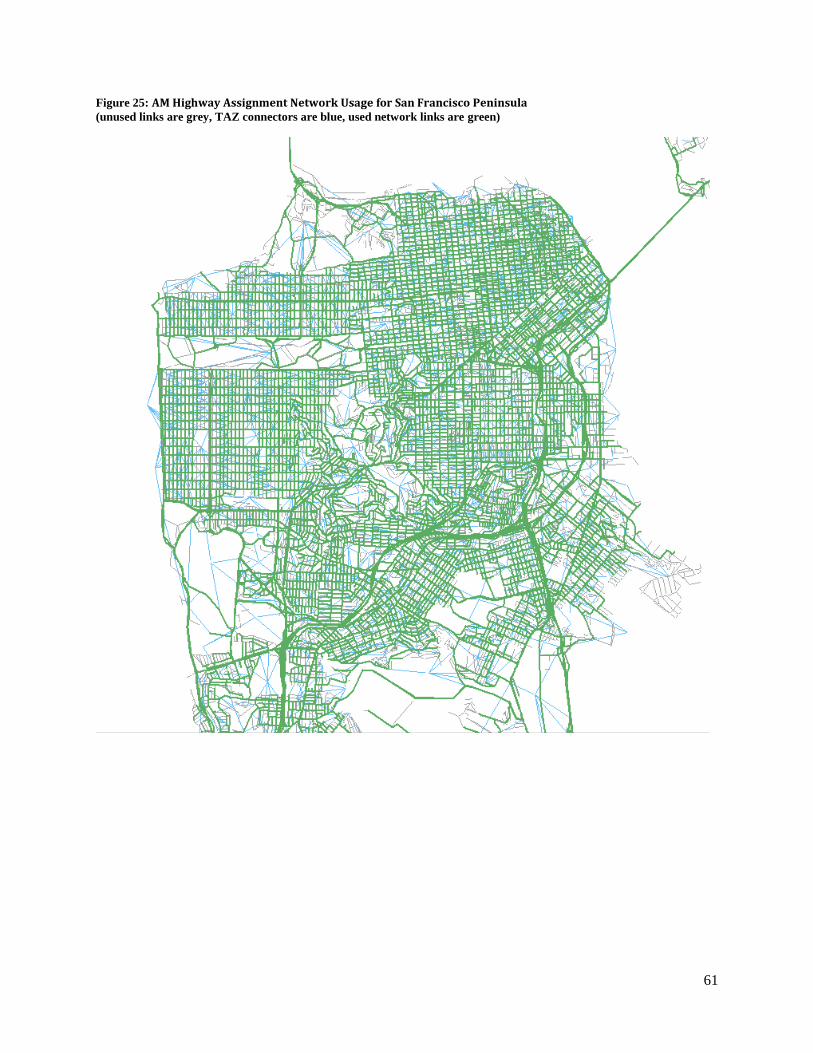
61
Figure 25: AM Highway Assignment Network Usage for San Francisco Peninsula (unused links are grey, TAZ connectors are blue, used network links are green)
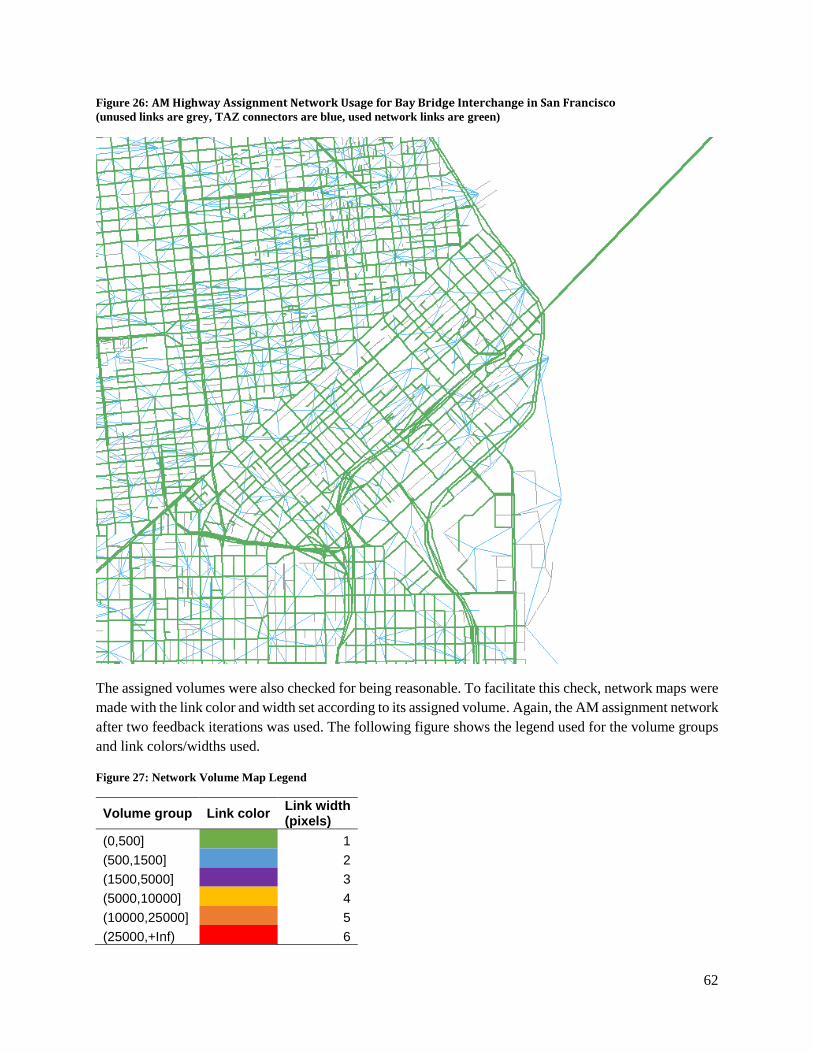
62
Figure 26: AM Highway Assignment Network Usage for Bay Bridge Interchange in San Francisco (unused links are grey, TAZ connectors are blue, used network links are green)
The assigned volumes were also checked for being reasonable. To facilitate this check, network maps were
made with the link color and width set according to its assigned volume. Again, the AM assignment network
after two feedback iterations was used. The following figure shows the legend used for the volume groups
and link colors/widths used.
Figure 27: Network Volume Map Legend
Volume group Link color Link width (pixels)
(0,500] 1
(500,1500] 2
(1500,5000] 3
(5000,10000] 4
(10000,25000] 5
(25000,+Inf) 6
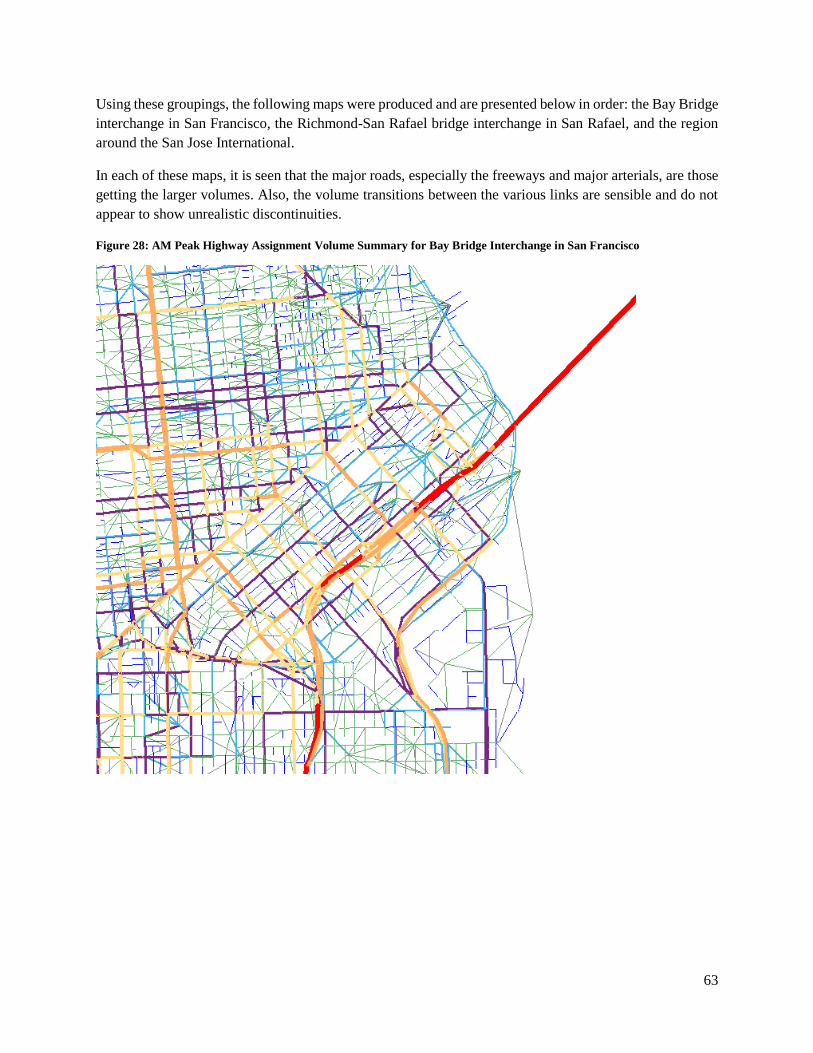
63
Using these groupings, the following maps were produced and are presented below in order: the Bay Bridge
interchange in San Francisco, the Richmond-San Rafael bridge interchange in San Rafael, and the region
around the San Jose International.
In each of these maps, it is seen that the major roads, especially the freeways and major arterials, are those
getting the larger volumes. Also, the volume transitions between the various links are sensible and do not
appear to show unrealistic discontinuities.
Figure 28: AM Peak Highway Assignment Volume Summary for Bay Bridge Interchange in San Francisco
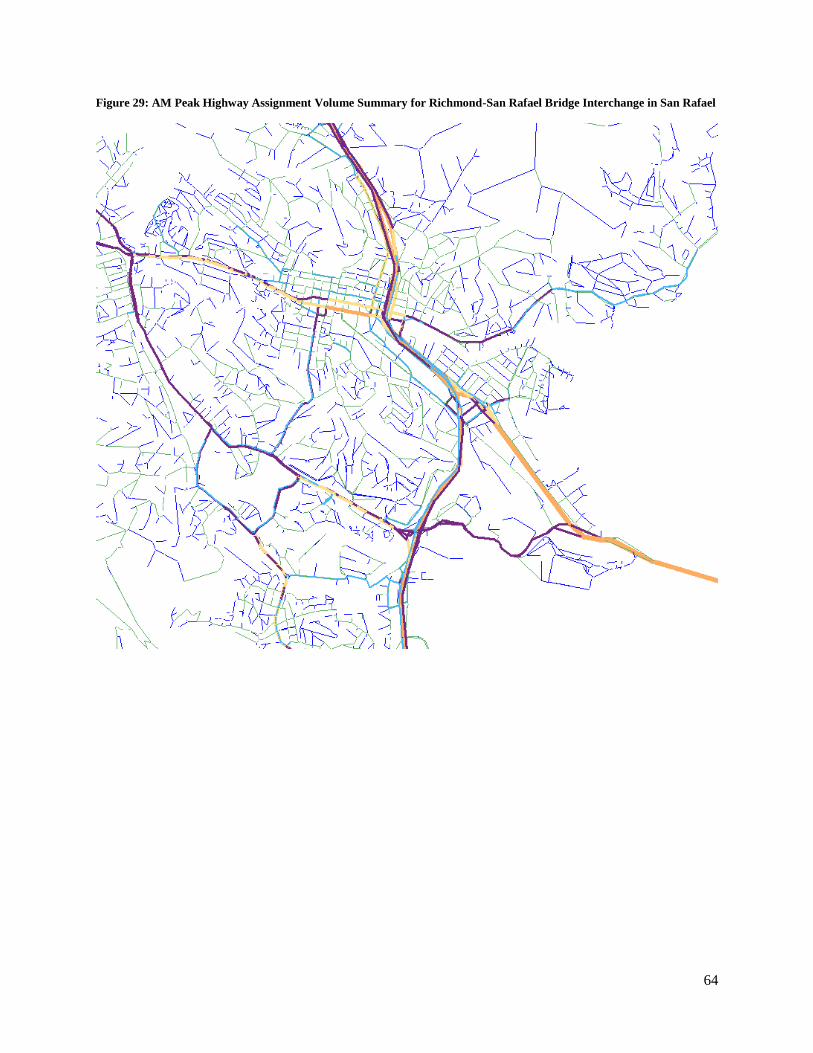
64
Figure 29: AM Peak Highway Assignment Volume Summary for Richmond-San Rafael Bridge Interchange in San Rafael
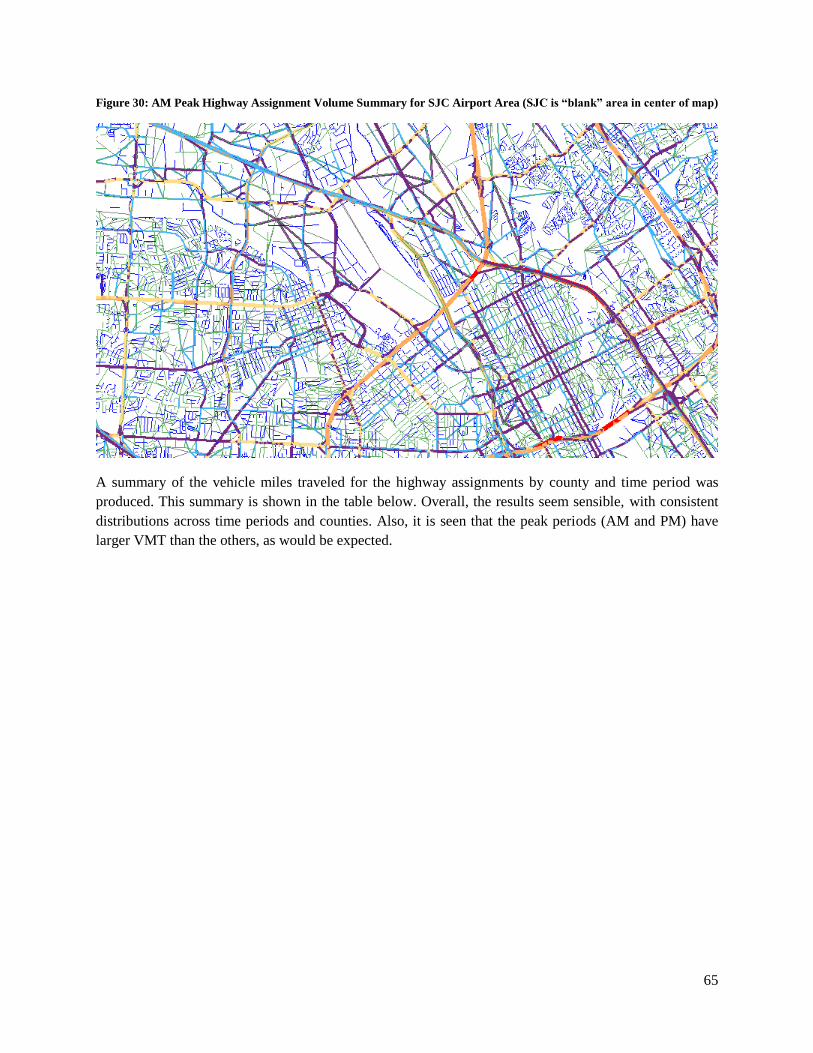
65
Figure 30: AM Peak Highway Assignment Volume Summary for SJC Airport Area (SJC is “blank” area in center of map)
A summary of the vehicle miles traveled for the highway assignments by county and time period was
produced. This summary is shown in the table below. Overall, the results seem sensible, with consistent
distributions across time periods and counties. Also, it is seen that the peak periods (AM and PM) have
larger VMT than the others, as would be expected.
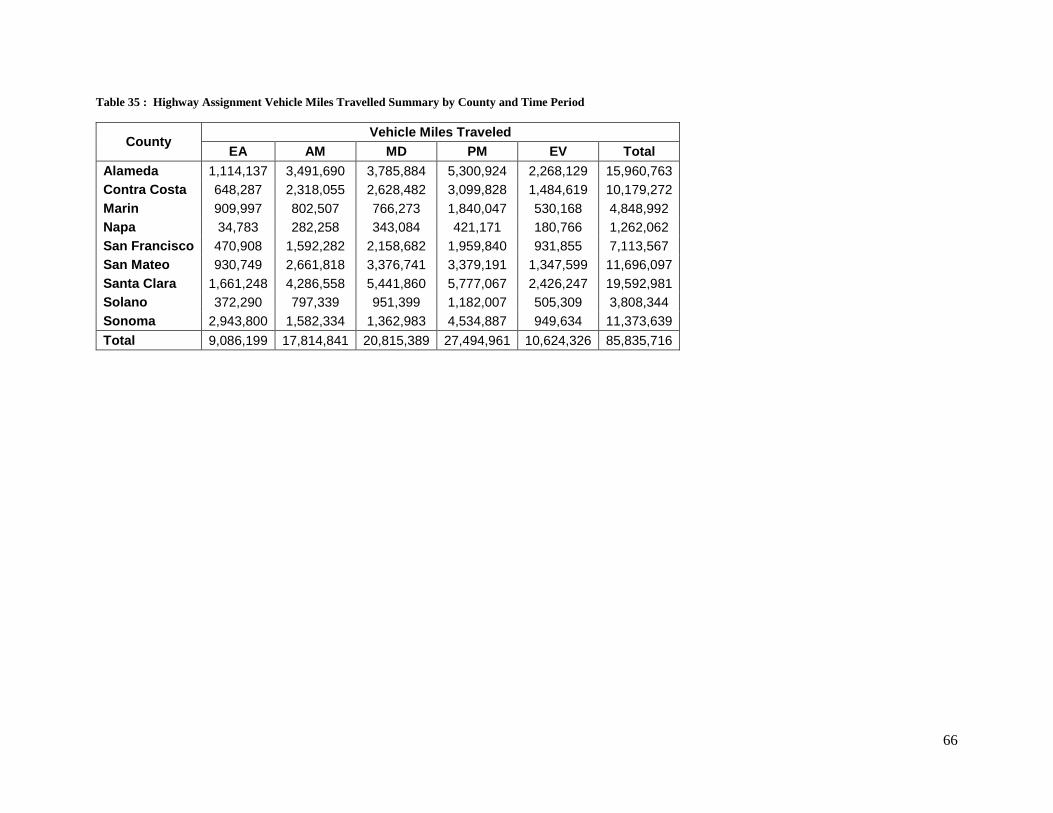
66
Table 35 : Highway Assignment Vehicle Miles Travelled Summary by County and Time Period
County Vehicle Miles Traveled
EA AM MD PM EV Total
Alameda 1,114,137 3,491,690 3,785,884 5,300,924 2,268,129 15,960,763
Contra Costa 648,287 2,318,055 2,628,482 3,099,828 1,484,619 10,179,272
Marin 909,997 802,507 766,273 1,840,047 530,168 4,848,992
Napa 34,783 282,258 343,084 421,171 180,766 1,262,062
San Francisco 470,908 1,592,282 2,158,682 1,959,840 931,855 7,113,567
San Mateo 930,749 2,661,818 3,376,741 3,379,191 1,347,599 11,696,097
Santa Clara 1,661,248 4,286,558 5,441,860 5,777,067 2,426,247 19,592,981
Solano 372,290 797,339 951,399 1,182,007 505,309 3,808,344
Sonoma 2,943,800 1,582,334 1,362,983 4,534,887 949,634 11,373,639
Total 9,086,199 17,814,841 20,815,389 27,494,961 10,624,326 85,835,716
67
11 Transit Assignment
Transit assignment is run using Cube’s PUBLIC TRANSPORT program. For each of the five time periods,
three transit assignments are performed: SET1 (Local only), SET2 (Local + Premium) and SET3 (Local +
Premium with high transfer penalty).
The following table gives a summary of the transit assignment results, summing the number of passengers,
the passenger miles, and the passenger hours for each assignment. The results are somewhat lumpy since
they represent trips for only 33 percent of the households. Overall, the results look reasonable, with the
split across time periods concentrated in the peak and, to a lesser extent, midday periods, when the demand
for transit is higher and more transit lines are running. Also, the passenger split across SET1, SET2 and
SET3 assignments shows more passengers in the SET1 assignment (which is dictated to some degree by
the mode choice model) but a greater aggregate passenger distance in SET2 assignment. This indicates
riders of premium transit use it for longer trips, which is also to be expected. Lastly, the aggregate premium
passenger hours per trip (from SET2 and SET3) are higher than local (SET1), which also makes sense since
it is expected that premium trips are longer than local trips.
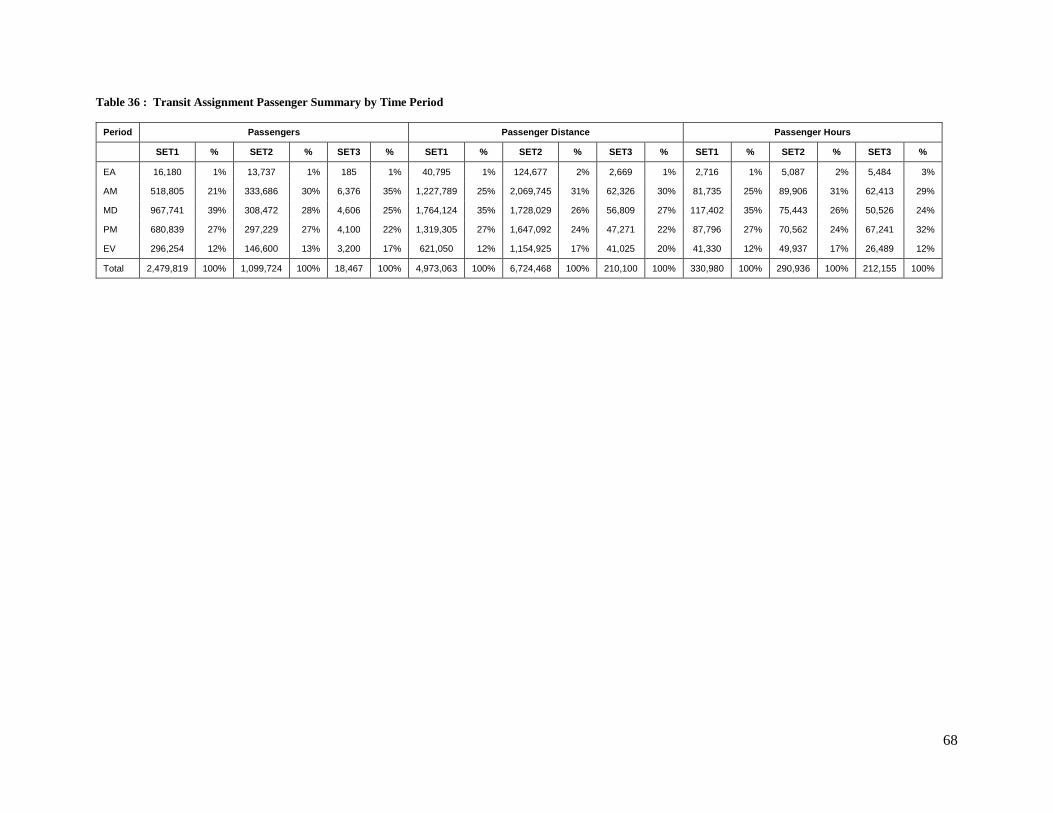
68
Table 36 : Transit Assignment Passenger Summary by Time Period
Period Passengers Passenger Distance Passenger Hours
SET1 % SET2 % SET3 % SET1 % SET2 % SET3 % SET1 % SET2 % SET3 %
EA 16,180 1% 13,737 1% 185 1% 40,795 1% 124,677 2% 2,669 1% 2,716 1% 5,087 2% 5,484 3%
AM 518,805 21% 333,686 30% 6,376 35% 1,227,789 25% 2,069,745 31% 62,326 30% 81,735 25% 89,906 31% 62,413 29%
MD 967,741 39% 308,472 28% 4,606 25% 1,764,124 35% 1,728,029 26% 56,809 27% 117,402 35% 75,443 26% 50,526 24%
PM 680,839 27% 297,229 27% 4,100 22% 1,319,305 27% 1,647,092 24% 47,271 22% 87,796 27% 70,562 24% 67,241 32%
EV 296,254 12% 146,600 13% 3,200 17% 621,050 12% 1,154,925 17% 41,025 20% 41,330 12% 49,937 17% 26,489 12%
Total 2,479,819 100% 1,099,724 100% 18,467 100% 4,973,063 100% 6,724,468 100% 210,100 100% 330,980 100% 290,936 100% 212,155 100%
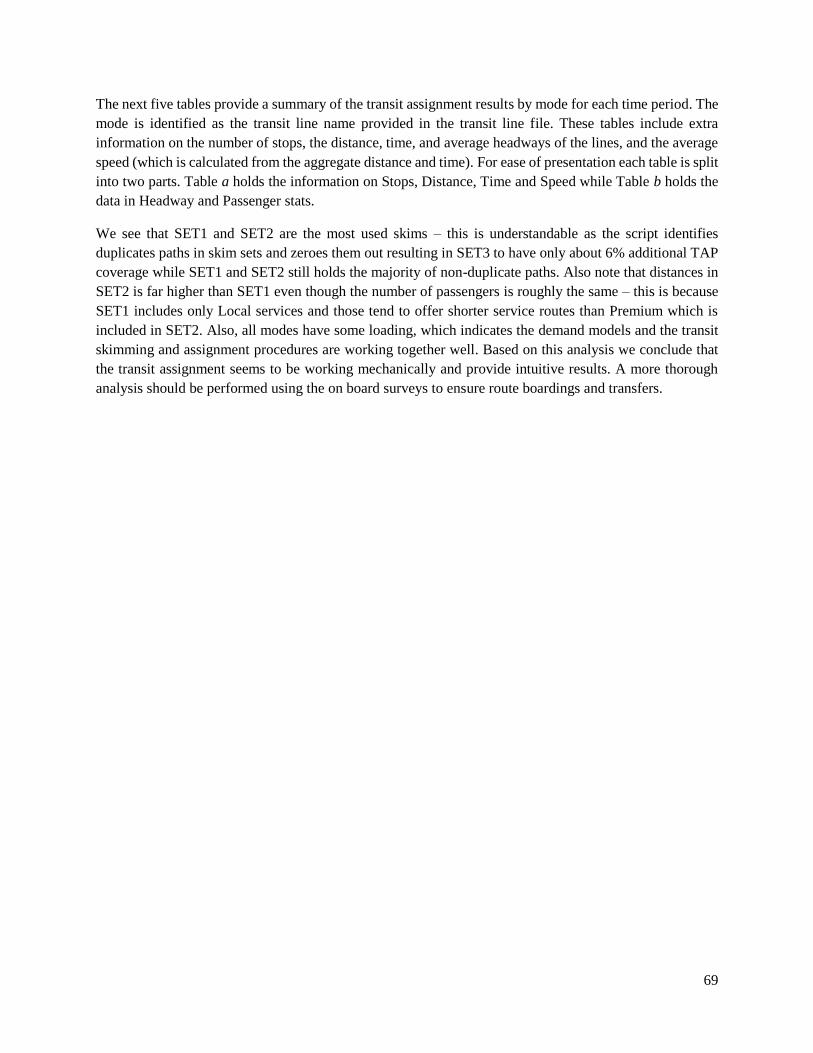
69
The next five tables provide a summary of the transit assignment results by mode for each time period. The
mode is identified as the transit line name provided in the transit line file. These tables include extra
information on the number of stops, the distance, time, and average headways of the lines, and the average
speed (which is calculated from the aggregate distance and time). For ease of presentation each table is split
into two parts. Table a holds the information on Stops, Distance, Time and Speed while Table b holds the
data in Headway and Passenger stats.
We see that SET1 and SET2 are the most used skims – this is understandable as the script identifies
duplicates paths in skim sets and zeroes them out resulting in SET3 to have only about 6% additional TAP
coverage while SET1 and SET2 still holds the majority of non-duplicate paths. Also note that distances in
SET2 is far higher than SET1 even though the number of passengers is roughly the same – this is because
SET1 includes only Local services and those tend to offer shorter service routes than Premium which is
included in SET2. Also, all modes have some loading, which indicates the demand models and the transit
skimming and assignment procedures are working together well. Based on this analysis we conclude that
the transit assignment seems to be working mechanically and provide intuitive results. A more thorough
analysis should be performed using the on board surveys to ensure route boardings and transfers.
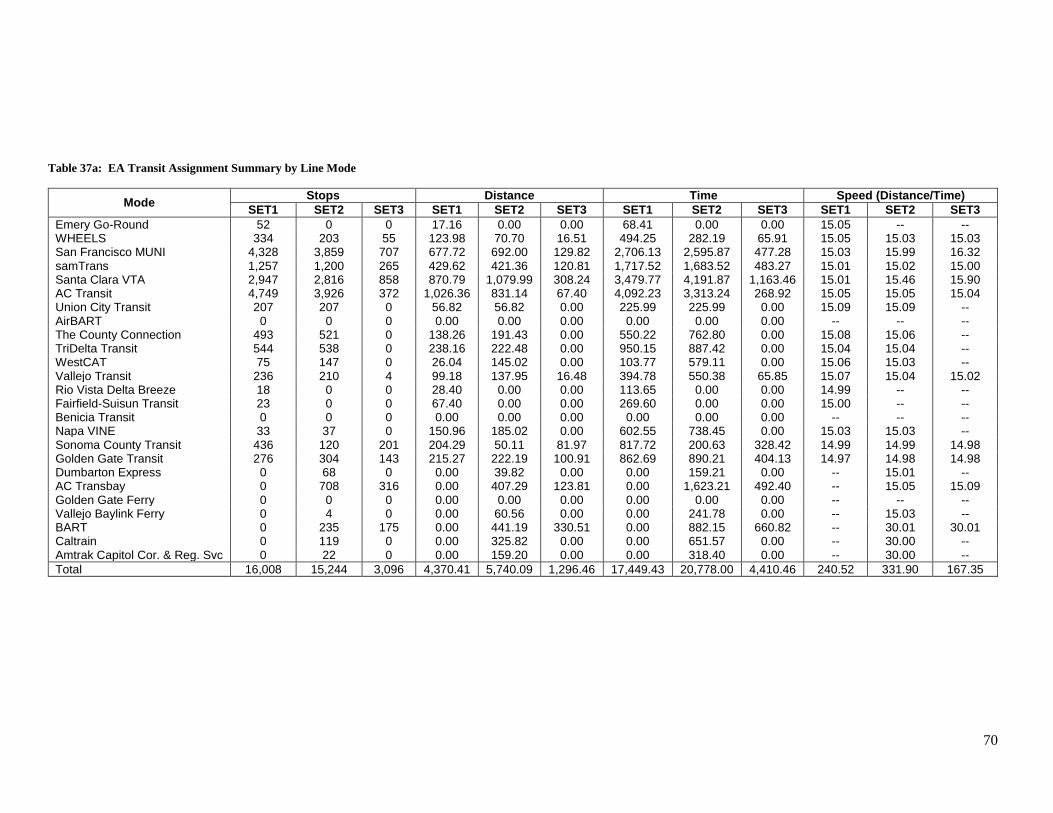
70
Table 37a: EA Transit Assignment Summary by Line Mode
Mode Stops Distance Time Speed (Distance/Time)
SET1 SET2 SET3 SET1 SET2 SET3 SET1 SET2 SET3 SET1 SET2 SET3
Emery Go-Round 52 0 0 17.16 0.00 0.00 68.41 0.00 0.00 15.05 -- -- WHEELS 334 203 55 123.98 70.70 16.51 494.25 282.19 65.91 15.05 15.03 15.03 San Francisco MUNI 4,328 3,859 707 677.72 692.00 129.82 2,706.13 2,595.87 477.28 15.03 15.99 16.32 samTrans 1,257 1,200 265 429.62 421.36 120.81 1,717.52 1,683.52 483.27 15.01 15.02 15.00 Santa Clara VTA 2,947 2,816 858 870.79 1,079.99 308.24 3,479.77 4,191.87 1,163.46 15.01 15.46 15.90 AC Transit 4,749 3,926 372 1,026.36 831.14 67.40 4,092.23 3,313.24 268.92 15.05 15.05 15.04 Union City Transit 207 207 0 56.82 56.82 0.00 225.99 225.99 0.00 15.09 15.09 -- AirBART 0 0 0 0.00 0.00 0.00 0.00 0.00 0.00 -- -- -- The County Connection 493 521 0 138.26 191.43 0.00 550.22 762.80 0.00 15.08 15.06 -- TriDelta Transit 544 538 0 238.16 222.48 0.00 950.15 887.42 0.00 15.04 15.04 -- WestCAT 75 147 0 26.04 145.02 0.00 103.77 579.11 0.00 15.06 15.03 -- Vallejo Transit 236 210 4 99.18 137.95 16.48 394.78 550.38 65.85 15.07 15.04 15.02 Rio Vista Delta Breeze 18 0 0 28.40 0.00 0.00 113.65 0.00 0.00 14.99 -- -- Fairfield-Suisun Transit 23 0 0 67.40 0.00 0.00 269.60 0.00 0.00 15.00 -- -- Benicia Transit 0 0 0 0.00 0.00 0.00 0.00 0.00 0.00 -- -- -- Napa VINE 33 37 0 150.96 185.02 0.00 602.55 738.45 0.00 15.03 15.03 -- Sonoma County Transit 436 120 201 204.29 50.11 81.97 817.72 200.63 328.42 14.99 14.99 14.98 Golden Gate Transit 276 304 143 215.27 222.19 100.91 862.69 890.21 404.13 14.97 14.98 14.98 Dumbarton Express 0 68 0 0.00 39.82 0.00 0.00 159.21 0.00 -- 15.01 -- AC Transbay 0 708 316 0.00 407.29 123.81 0.00 1,623.21 492.40 -- 15.05 15.09 Golden Gate Ferry 0 0 0 0.00 0.00 0.00 0.00 0.00 0.00 -- -- -- Vallejo Baylink Ferry 0 4 0 0.00 60.56 0.00 0.00 241.78 0.00 -- 15.03 -- BART 0 235 175 0.00 441.19 330.51 0.00 882.15 660.82 -- 30.01 30.01 Caltrain 0 119 0 0.00 325.82 0.00 0.00 651.57 0.00 -- 30.00 -- Amtrak Capitol Cor. & Reg. Svc 0 22 0 0.00 159.20 0.00 0.00 318.40 0.00 -- 30.00 --
Total 16,008 15,244 3,096 4,370.41 5,740.09 1,296.46 17,449.43 20,778.00 4,410.46 240.52 331.90 167.35
71
Table 37b: EA Transit Assignment Summary by Line Mode
Mode Headway (Average) Passengers Passenger Distance Passenger Hours
SET1 SET2 SET3 SET1 SET2 SET3 SET1 SET2 SET3 SET1 SET2 SET3
Emery Go-Round 60.00 0.00 0.00 36.36 0.00 0.00 38.60 0.00 0.00 2.58 0.00 0.00 WHEELS 56.67 33.33 6.67 78.80 36.37 3.03 109.74 281.95 7.79 7.30 18.76 0.52 San Francisco MUNI 26.64 23.23 3.07 7,423.90 3,793.89 27.27 14,099.79 7,694.38 124.93 938.91 428.83 7.73 samTrans 53.33 46.67 7.78 1,000.31 248.56 9.09 3,772.29 1,517.03 143.63 251.58 100.95 9.58 Santa Clara VTA 38.38 41.22 11.22 1,937.09 663.96 30.30 5,289.34 3,947.44 373.93 351.79 237.41 24.41 AC Transit 51.17 41.17 2.33 3,988.65 1,012.43 12.13 8,251.64 2,649.77 63.27 547.72 175.88 4.20 Union City Transit 30.00 30.00 0.00 124.34 15.15 0.00 270.47 95.46 0.00 18.02 6.33 0.00 AirBART 0.00 0.00 0.00 0.00 0.00 0.00 0.00 0.00 0.00 0.00 0.00 0.00 The County Connection 40.59 49.41 0.00 248.46 266.61 0.00 546.18 1,188.19 0.00 36.23 79.05 0.00 TriDelta Transit 40.71 36.43 0.00 230.38 203.04 0.00 676.58 1,768.22 0.00 45.01 117.70 0.00 WestCAT 9.47 27.37 0.00 12.12 200.04 0.00 10.76 1,692.13 0.00 0.71 112.50 0.00 Vallejo Transit 30.00 35.45 2.73 136.36 54.54 3.03 283.29 300.81 49.93 18.79 19.98 3.33 Rio Vista Delta Breeze 60.00 0.00 0.00 9.09 0.00 0.00 20.69 0.00 0.00 1.38 0.00 0.00 Fairfield-Suisun Transit 40.00 0.00 0.00 9.09 0.00 0.00 101.14 0.00 0.00 6.74 0.00 0.00 Benicia Transit 0.00 0.00 0.00 0.00 0.00 0.00 0.00 0.00 0.00 0.00 0.00 0.00 Napa VINE 48.00 60.00 0.00 18.20 124.28 0.00 269.20 2,811.13 0.00 17.90 187.08 0.00 Sonoma County Transit 45.00 15.00 22.50 381.87 6.06 12.12 2,747.32 84.74 165.56 183.46 5.67 11.07 Golden Gate Transit 40.00 55.00 27.50 545.37 81.86 18.19 4,307.60 828.09 365.07 288.01 55.21 24.36 Dumbarton Express 0.00 60.00 0.00 0.00 33.35 0.00 0.00 262.23 0.00 0.00 17.47 0.00 AC Transbay 0.00 52.50 15.00 0.00 678.76 18.18 0.00 6,158.60 226.61 0.00 409.35 15.07 Golden Gate Ferry 0.00 0.00 0.00 0.00 0.00 0.00 0.00 0.00 0.00 0.00 0.00 0.00 Vallejo Baylink Ferry 0.00 15.00 0.00 0.00 3.03 0.00 0.00 91.75 0.00 0.00 6.10 0.00 BART 0.00 29.09 22.73 0.00 5,551.15 51.52 0.00 76,113.80 1,147.84 0.00 2,536.19 38.25 Caltrain 0.00 60.00 0.00 0.00 572.86 0.00 0.00 10,321.90 0.00 0.00 344.04 0.00 Amtrak Capitol Cor. & Reg. Svc 0.00 60.00 0.00 0.00 190.89 0.00 0.00 6,868.98 0.00 0.00 228.95 0.00
Total 669.96 770.86 121.51 16,180.39 13,736.83 184.86 40,794.63 124,676.60 2,668.56 2,716.13 5,087.45 138.52
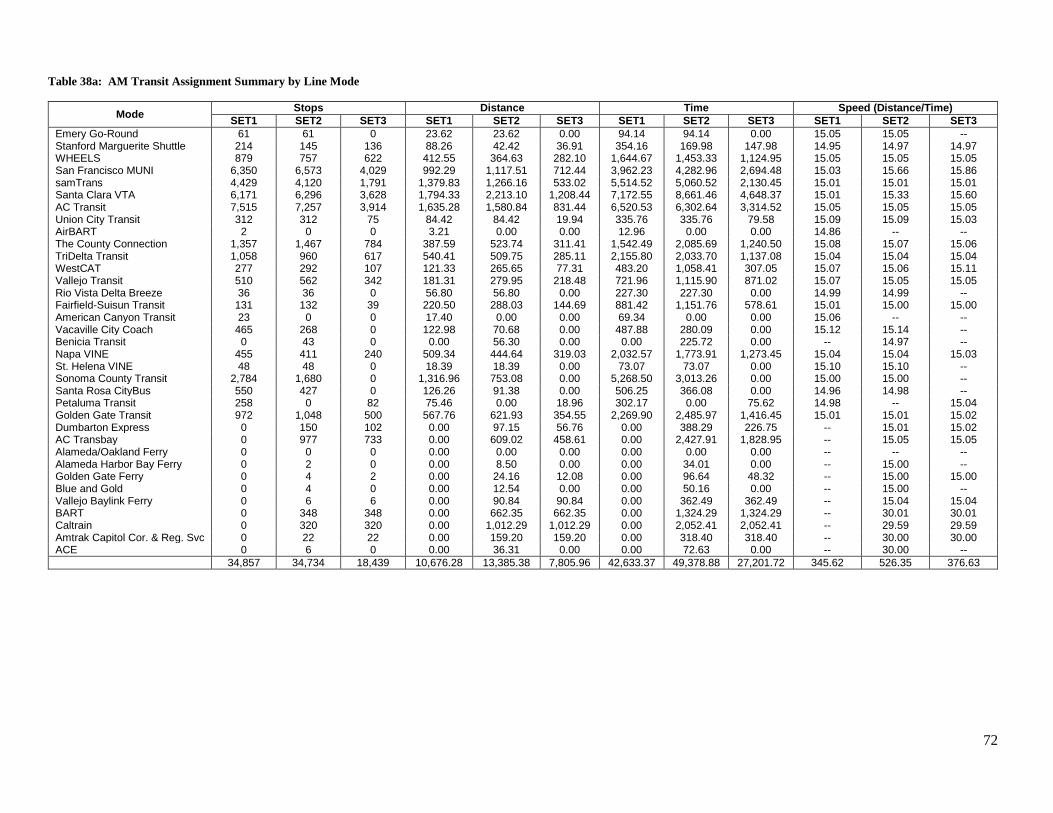
72
Table 38a: AM Transit Assignment Summary by Line Mode
Mode Stops Distance Time Speed (Distance/Time)
SET1 SET2 SET3 SET1 SET2 SET3 SET1 SET2 SET3 SET1 SET2 SET3
Emery Go-Round 61 61 0 23.62 23.62 0.00 94.14 94.14 0.00 15.05 15.05 -- Stanford Marguerite Shuttle 214 145 136 88.26 42.42 36.91 354.16 169.98 147.98 14.95 14.97 14.97 WHEELS 879 757 622 412.55 364.63 282.10 1,644.67 1,453.33 1,124.95 15.05 15.05 15.05 San Francisco MUNI 6,350 6,573 4,029 992.29 1,117.51 712.44 3,962.23 4,282.96 2,694.48 15.03 15.66 15.86 samTrans 4,429 4,120 1,791 1,379.83 1,266.16 533.02 5,514.52 5,060.52 2,130.45 15.01 15.01 15.01 Santa Clara VTA 6,171 6,296 3,628 1,794.33 2,213.10 1,208.44 7,172.55 8,661.46 4,648.37 15.01 15.33 15.60 AC Transit 7,515 7,257 3,914 1,635.28 1,580.84 831.44 6,520.53 6,302.64 3,314.52 15.05 15.05 15.05 Union City Transit 312 312 75 84.42 84.42 19.94 335.76 335.76 79.58 15.09 15.09 15.03 AirBART 2 0 0 3.21 0.00 0.00 12.96 0.00 0.00 14.86 -- -- The County Connection 1,357 1,467 784 387.59 523.74 311.41 1,542.49 2,085.69 1,240.50 15.08 15.07 15.06 TriDelta Transit 1,058 960 617 540.41 509.75 285.11 2,155.80 2,033.70 1,137.08 15.04 15.04 15.04 WestCAT 277 292 107 121.33 265.65 77.31 483.20 1,058.41 307.05 15.07 15.06 15.11 Vallejo Transit 510 562 342 181.31 279.95 218.48 721.96 1,115.90 871.02 15.07 15.05 15.05 Rio Vista Delta Breeze 36 36 0 56.80 56.80 0.00 227.30 227.30 0.00 14.99 14.99 -- Fairfield-Suisun Transit 131 132 39 220.50 288.03 144.69 881.42 1,151.76 578.61 15.01 15.00 15.00 American Canyon Transit 23 0 0 17.40 0.00 0.00 69.34 0.00 0.00 15.06 -- -- Vacaville City Coach 465 268 0 122.98 70.68 0.00 487.88 280.09 0.00 15.12 15.14 -- Benicia Transit 0 43 0 0.00 56.30 0.00 0.00 225.72 0.00 -- 14.97 -- Napa VINE 455 411 240 509.34 444.64 319.03 2,032.57 1,773.91 1,273.45 15.04 15.04 15.03 St. Helena VINE 48 48 0 18.39 18.39 0.00 73.07 73.07 0.00 15.10 15.10 -- Sonoma County Transit 2,784 1,680 0 1,316.96 753.08 0.00 5,268.50 3,013.26 0.00 15.00 15.00 -- Santa Rosa CityBus 550 427 0 126.26 91.38 0.00 506.25 366.08 0.00 14.96 14.98 -- Petaluma Transit 258 0 82 75.46 0.00 18.96 302.17 0.00 75.62 14.98 -- 15.04 Golden Gate Transit 972 1,048 500 567.76 621.93 354.55 2,269.90 2,485.97 1,416.45 15.01 15.01 15.02 Dumbarton Express 0 150 102 0.00 97.15 56.76 0.00 388.29 226.75 -- 15.01 15.02 AC Transbay 0 977 733 0.00 609.02 458.61 0.00 2,427.91 1,828.95 -- 15.05 15.05 Alameda/Oakland Ferry 0 0 0 0.00 0.00 0.00 0.00 0.00 0.00 -- -- -- Alameda Harbor Bay Ferry 0 2 0 0.00 8.50 0.00 0.00 34.01 0.00 -- 15.00 -- Golden Gate Ferry 0 4 2 0.00 24.16 12.08 0.00 96.64 48.32 -- 15.00 15.00 Blue and Gold 0 4 0 0.00 12.54 0.00 0.00 50.16 0.00 -- 15.00 -- Vallejo Baylink Ferry 0 6 6 0.00 90.84 90.84 0.00 362.49 362.49 -- 15.04 15.04 BART 0 348 348 0.00 662.35 662.35 0.00 1,324.29 1,324.29 -- 30.01 30.01 Caltrain 0 320 320 0.00 1,012.29 1,012.29 0.00 2,052.41 2,052.41 -- 29.59 29.59 Amtrak Capitol Cor. & Reg. Svc 0 22 22 0.00 159.20 159.20 0.00 318.40 318.40 -- 30.00 30.00 ACE 0 6 0 0.00 36.31 0.00 0.00 72.63 0.00 -- 30.00 --
34,857 34,734 18,439 10,676.28 13,385.38 7,805.96 42,633.37 49,378.88 27,201.72 345.62 526.35 376.63
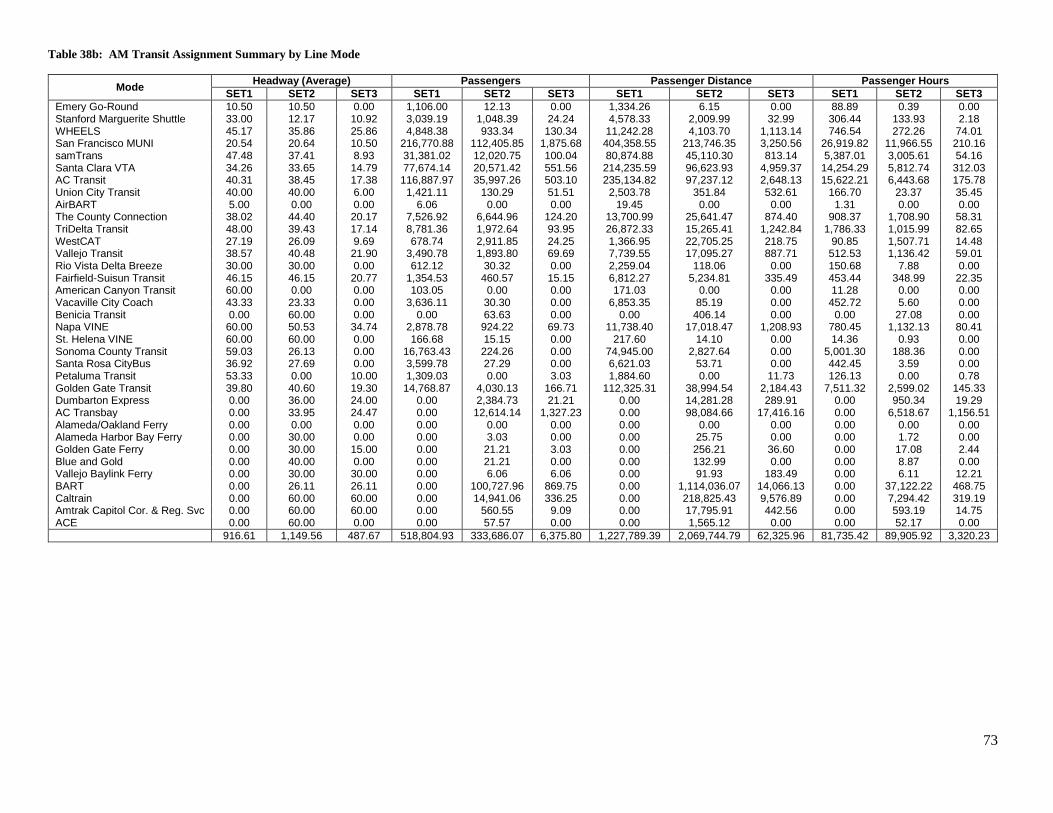
73
Table 38b: AM Transit Assignment Summary by Line Mode
Mode Headway (Average) Passengers Passenger Distance Passenger Hours
SET1 SET2 SET3 SET1 SET2 SET3 SET1 SET2 SET3 SET1 SET2 SET3
Emery Go-Round 10.50 10.50 0.00 1,106.00 12.13 0.00 1,334.26 6.15 0.00 88.89 0.39 0.00 Stanford Marguerite Shuttle 33.00 12.17 10.92 3,039.19 1,048.39 24.24 4,578.33 2,009.99 32.99 306.44 133.93 2.18 WHEELS 45.17 35.86 25.86 4,848.38 933.34 130.34 11,242.28 4,103.70 1,113.14 746.54 272.26 74.01 San Francisco MUNI 20.54 20.64 10.50 216,770.88 112,405.85 1,875.68 404,358.55 213,746.35 3,250.56 26,919.82 11,966.55 210.16 samTrans 47.48 37.41 8.93 31,381.02 12,020.75 100.04 80,874.88 45,110.30 813.14 5,387.01 3,005.61 54.16 Santa Clara VTA 34.26 33.65 14.79 77,674.14 20,571.42 551.56 214,235.59 96,623.93 4,959.37 14,254.29 5,812.74 312.03 AC Transit 40.31 38.45 17.38 116,887.97 35,997.26 503.10 235,134.82 97,237.12 2,648.13 15,622.21 6,443.68 175.78 Union City Transit 40.00 40.00 6.00 1,421.11 130.29 51.51 2,503.78 351.84 532.61 166.70 23.37 35.45 AirBART 5.00 0.00 0.00 6.06 0.00 0.00 19.45 0.00 0.00 1.31 0.00 0.00 The County Connection 38.02 44.40 20.17 7,526.92 6,644.96 124.20 13,700.99 25,641.47 874.40 908.37 1,708.90 58.31 TriDelta Transit 48.00 39.43 17.14 8,781.36 1,972.64 93.95 26,872.33 15,265.41 1,242.84 1,786.33 1,015.99 82.65 WestCAT 27.19 26.09 9.69 678.74 2,911.85 24.25 1,366.95 22,705.25 218.75 90.85 1,507.71 14.48 Vallejo Transit 38.57 40.48 21.90 3,490.78 1,893.80 69.69 7,739.55 17,095.27 887.71 512.53 1,136.42 59.01 Rio Vista Delta Breeze 30.00 30.00 0.00 612.12 30.32 0.00 2,259.04 118.06 0.00 150.68 7.88 0.00 Fairfield-Suisun Transit 46.15 46.15 20.77 1,354.53 460.57 15.15 6,812.27 5,234.81 335.49 453.44 348.99 22.35 American Canyon Transit 60.00 0.00 0.00 103.05 0.00 0.00 171.03 0.00 0.00 11.28 0.00 0.00 Vacaville City Coach 43.33 23.33 0.00 3,636.11 30.30 0.00 6,853.35 85.19 0.00 452.72 5.60 0.00 Benicia Transit 0.00 60.00 0.00 0.00 63.63 0.00 0.00 406.14 0.00 0.00 27.08 0.00 Napa VINE 60.00 50.53 34.74 2,878.78 924.22 69.73 11,738.40 17,018.47 1,208.93 780.45 1,132.13 80.41 St. Helena VINE 60.00 60.00 0.00 166.68 15.15 0.00 217.60 14.10 0.00 14.36 0.93 0.00 Sonoma County Transit 59.03 26.13 0.00 16,763.43 224.26 0.00 74,945.00 2,827.64 0.00 5,001.30 188.36 0.00 Santa Rosa CityBus 36.92 27.69 0.00 3,599.78 27.29 0.00 6,621.03 53.71 0.00 442.45 3.59 0.00 Petaluma Transit 53.33 0.00 10.00 1,309.03 0.00 3.03 1,884.60 0.00 11.73 126.13 0.00 0.78 Golden Gate Transit 39.80 40.60 19.30 14,768.87 4,030.13 166.71 112,325.31 38,994.54 2,184.43 7,511.32 2,599.02 145.33 Dumbarton Express 0.00 36.00 24.00 0.00 2,384.73 21.21 0.00 14,281.28 289.91 0.00 950.34 19.29 AC Transbay 0.00 33.95 24.47 0.00 12,614.14 1,327.23 0.00 98,084.66 17,416.16 0.00 6,518.67 1,156.51 Alameda/Oakland Ferry 0.00 0.00 0.00 0.00 0.00 0.00 0.00 0.00 0.00 0.00 0.00 0.00 Alameda Harbor Bay Ferry 0.00 30.00 0.00 0.00 3.03 0.00 0.00 25.75 0.00 0.00 1.72 0.00 Golden Gate Ferry 0.00 30.00 15.00 0.00 21.21 3.03 0.00 256.21 36.60 0.00 17.08 2.44 Blue and Gold 0.00 40.00 0.00 0.00 21.21 0.00 0.00 132.99 0.00 0.00 8.87 0.00 Vallejo Baylink Ferry 0.00 30.00 30.00 0.00 6.06 6.06 0.00 91.93 183.49 0.00 6.11 12.21 BART 0.00 26.11 26.11 0.00 100,727.96 869.75 0.00 1,114,036.07 14,066.13 0.00 37,122.22 468.75 Caltrain 0.00 60.00 60.00 0.00 14,941.06 336.25 0.00 218,825.43 9,576.89 0.00 7,294.42 319.19 Amtrak Capitol Cor. & Reg. Svc 0.00 60.00 60.00 0.00 560.55 9.09 0.00 17,795.91 442.56 0.00 593.19 14.75 ACE 0.00 60.00 0.00 0.00 57.57 0.00 0.00 1,565.12 0.00 0.00 52.17 0.00
916.61 1,149.56 487.67 518,804.93 333,686.07 6,375.80 1,227,789.39 2,069,744.79 62,325.96 81,735.42 89,905.92 3,320.23
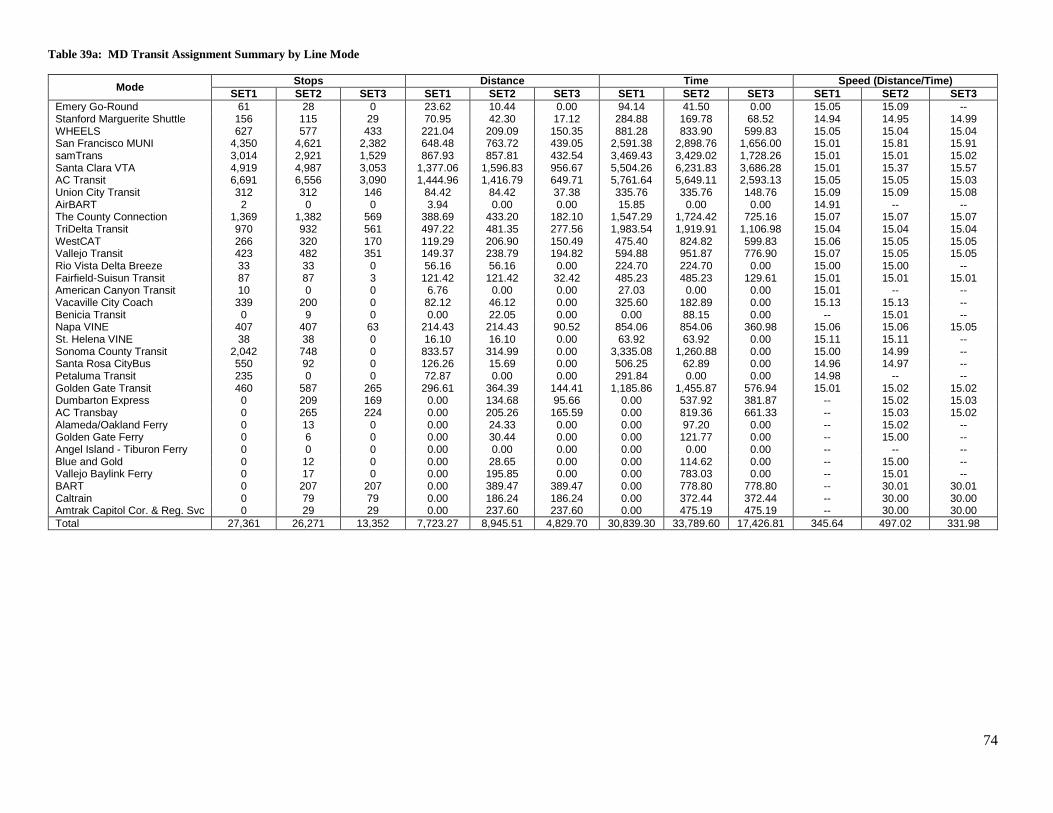
74
Table 39a: MD Transit Assignment Summary by Line Mode
Mode Stops Distance Time Speed (Distance/Time)
SET1 SET2 SET3 SET1 SET2 SET3 SET1 SET2 SET3 SET1 SET2 SET3
Emery Go-Round 61 28 0 23.62 10.44 0.00 94.14 41.50 0.00 15.05 15.09 -- Stanford Marguerite Shuttle 156 115 29 70.95 42.30 17.12 284.88 169.78 68.52 14.94 14.95 14.99 WHEELS 627 577 433 221.04 209.09 150.35 881.28 833.90 599.83 15.05 15.04 15.04 San Francisco MUNI 4,350 4,621 2,382 648.48 763.72 439.05 2,591.38 2,898.76 1,656.00 15.01 15.81 15.91 samTrans 3,014 2,921 1,529 867.93 857.81 432.54 3,469.43 3,429.02 1,728.26 15.01 15.01 15.02 Santa Clara VTA 4,919 4,987 3,053 1,377.06 1,596.83 956.67 5,504.26 6,231.83 3,686.28 15.01 15.37 15.57 AC Transit 6,691 6,556 3,090 1,444.96 1,416.79 649.71 5,761.64 5,649.11 2,593.13 15.05 15.05 15.03 Union City Transit 312 312 146 84.42 84.42 37.38 335.76 335.76 148.76 15.09 15.09 15.08 AirBART 2 0 0 3.94 0.00 0.00 15.85 0.00 0.00 14.91 -- -- The County Connection 1,369 1,382 569 388.69 433.20 182.10 1,547.29 1,724.42 725.16 15.07 15.07 15.07 TriDelta Transit 970 932 561 497.22 481.35 277.56 1,983.54 1,919.91 1,106.98 15.04 15.04 15.04 WestCAT 266 320 170 119.29 206.90 150.49 475.40 824.82 599.83 15.06 15.05 15.05 Vallejo Transit 423 482 351 149.37 238.79 194.82 594.88 951.87 776.90 15.07 15.05 15.05 Rio Vista Delta Breeze 33 33 0 56.16 56.16 0.00 224.70 224.70 0.00 15.00 15.00 -- Fairfield-Suisun Transit 87 87 3 121.42 121.42 32.42 485.23 485.23 129.61 15.01 15.01 15.01 American Canyon Transit 10 0 0 6.76 0.00 0.00 27.03 0.00 0.00 15.01 -- -- Vacaville City Coach 339 200 0 82.12 46.12 0.00 325.60 182.89 0.00 15.13 15.13 -- Benicia Transit 0 9 0 0.00 22.05 0.00 0.00 88.15 0.00 -- 15.01 -- Napa VINE 407 407 63 214.43 214.43 90.52 854.06 854.06 360.98 15.06 15.06 15.05 St. Helena VINE 38 38 0 16.10 16.10 0.00 63.92 63.92 0.00 15.11 15.11 -- Sonoma County Transit 2,042 748 0 833.57 314.99 0.00 3,335.08 1,260.88 0.00 15.00 14.99 -- Santa Rosa CityBus 550 92 0 126.26 15.69 0.00 506.25 62.89 0.00 14.96 14.97 -- Petaluma Transit 235 0 0 72.87 0.00 0.00 291.84 0.00 0.00 14.98 -- -- Golden Gate Transit 460 587 265 296.61 364.39 144.41 1,185.86 1,455.87 576.94 15.01 15.02 15.02 Dumbarton Express 0 209 169 0.00 134.68 95.66 0.00 537.92 381.87 -- 15.02 15.03 AC Transbay 0 265 224 0.00 205.26 165.59 0.00 819.36 661.33 -- 15.03 15.02 Alameda/Oakland Ferry 0 13 0 0.00 24.33 0.00 0.00 97.20 0.00 -- 15.02 -- Golden Gate Ferry 0 6 0 0.00 30.44 0.00 0.00 121.77 0.00 -- 15.00 -- Angel Island - Tiburon Ferry 0 0 0 0.00 0.00 0.00 0.00 0.00 0.00 -- -- -- Blue and Gold 0 12 0 0.00 28.65 0.00 0.00 114.62 0.00 -- 15.00 -- Vallejo Baylink Ferry 0 17 0 0.00 195.85 0.00 0.00 783.03 0.00 -- 15.01 -- BART 0 207 207 0.00 389.47 389.47 0.00 778.80 778.80 -- 30.01 30.01 Caltrain 0 79 79 0.00 186.24 186.24 0.00 372.44 372.44 -- 30.00 30.00 Amtrak Capitol Cor. & Reg. Svc 0 29 29 0.00 237.60 237.60 0.00 475.19 475.19 -- 30.00 30.00
Total 27,361 26,271 13,352 7,723.27 8,945.51 4,829.70 30,839.30 33,789.60 17,426.81 345.64 497.02 331.98
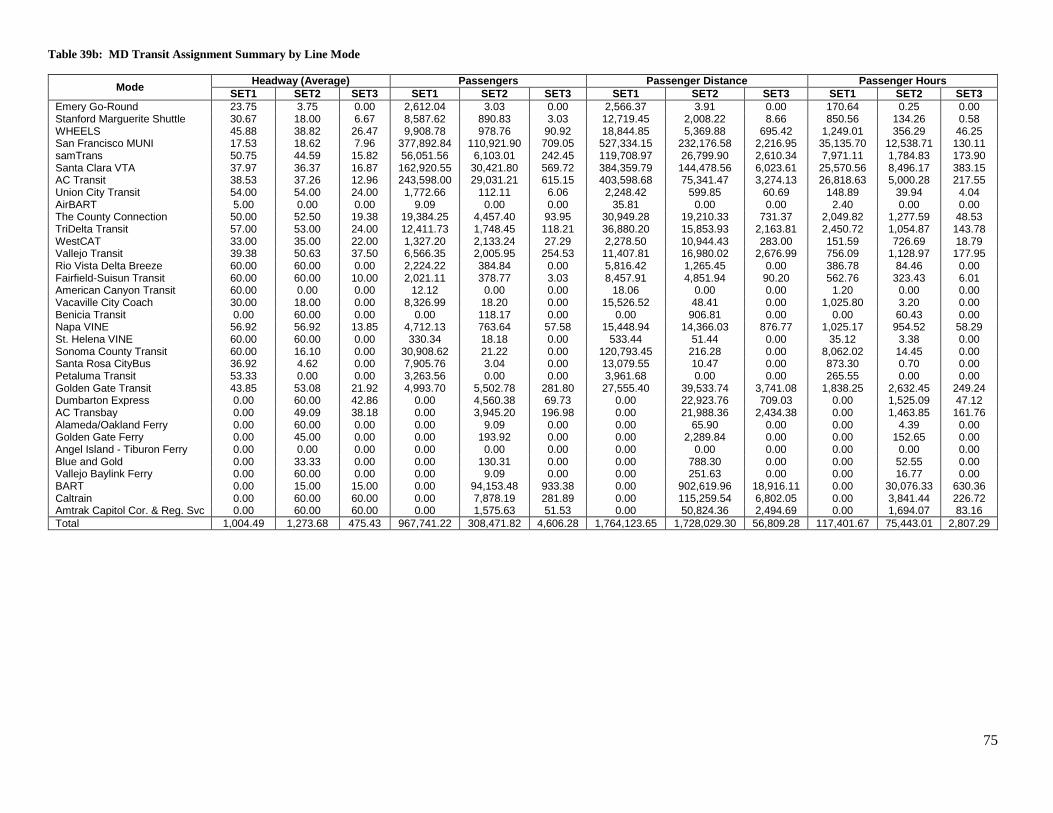
75
Table 39b: MD Transit Assignment Summary by Line Mode
Mode Headway (Average) Passengers Passenger Distance Passenger Hours
SET1 SET2 SET3 SET1 SET2 SET3 SET1 SET2 SET3 SET1 SET2 SET3
Emery Go-Round 23.75 3.75 0.00 2,612.04 3.03 0.00 2,566.37 3.91 0.00 170.64 0.25 0.00 Stanford Marguerite Shuttle 30.67 18.00 6.67 8,587.62 890.83 3.03 12,719.45 2,008.22 8.66 850.56 134.26 0.58 WHEELS 45.88 38.82 26.47 9,908.78 978.76 90.92 18,844.85 5,369.88 695.42 1,249.01 356.29 46.25 San Francisco MUNI 17.53 18.62 7.96 377,892.84 110,921.90 709.05 527,334.15 232,176.58 2,216.95 35,135.70 12,538.71 130.11 samTrans 50.75 44.59 15.82 56,051.56 6,103.01 242.45 119,708.97 26,799.90 2,610.34 7,971.11 1,784.83 173.90 Santa Clara VTA 37.97 36.37 16.87 162,920.55 30,421.80 569.72 384,359.79 144,478.56 6,023.61 25,570.56 8,496.17 383.15 AC Transit 38.53 37.26 12.96 243,598.00 29,031.21 615.15 403,598.68 75,341.47 3,274.13 26,818.63 5,000.28 217.55 Union City Transit 54.00 54.00 24.00 1,772.66 112.11 6.06 2,248.42 599.85 60.69 148.89 39.94 4.04 AirBART 5.00 0.00 0.00 9.09 0.00 0.00 35.81 0.00 0.00 2.40 0.00 0.00 The County Connection 50.00 52.50 19.38 19,384.25 4,457.40 93.95 30,949.28 19,210.33 731.37 2,049.82 1,277.59 48.53 TriDelta Transit 57.00 53.00 24.00 12,411.73 1,748.45 118.21 36,880.20 15,853.93 2,163.81 2,450.72 1,054.87 143.78 WestCAT 33.00 35.00 22.00 1,327.20 2,133.24 27.29 2,278.50 10,944.43 283.00 151.59 726.69 18.79 Vallejo Transit 39.38 50.63 37.50 6,566.35 2,005.95 254.53 11,407.81 16,980.02 2,676.99 756.09 1,128.97 177.95 Rio Vista Delta Breeze 60.00 60.00 0.00 2,224.22 384.84 0.00 5,816.42 1,265.45 0.00 386.78 84.46 0.00 Fairfield-Suisun Transit 60.00 60.00 10.00 2,021.11 378.77 3.03 8,457.91 4,851.94 90.20 562.76 323.43 6.01 American Canyon Transit 60.00 0.00 0.00 12.12 0.00 0.00 18.06 0.00 0.00 1.20 0.00 0.00 Vacaville City Coach 30.00 18.00 0.00 8,326.99 18.20 0.00 15,526.52 48.41 0.00 1,025.80 3.20 0.00 Benicia Transit 0.00 60.00 0.00 0.00 118.17 0.00 0.00 906.81 0.00 0.00 60.43 0.00 Napa VINE 56.92 56.92 13.85 4,712.13 763.64 57.58 15,448.94 14,366.03 876.77 1,025.17 954.52 58.29 St. Helena VINE 60.00 60.00 0.00 330.34 18.18 0.00 533.44 51.44 0.00 35.12 3.38 0.00 Sonoma County Transit 60.00 16.10 0.00 30,908.62 21.22 0.00 120,793.45 216.28 0.00 8,062.02 14.45 0.00 Santa Rosa CityBus 36.92 4.62 0.00 7,905.76 3.04 0.00 13,079.55 10.47 0.00 873.30 0.70 0.00 Petaluma Transit 53.33 0.00 0.00 3,263.56 0.00 0.00 3,961.68 0.00 0.00 265.55 0.00 0.00 Golden Gate Transit 43.85 53.08 21.92 4,993.70 5,502.78 281.80 27,555.40 39,533.74 3,741.08 1,838.25 2,632.45 249.24 Dumbarton Express 0.00 60.00 42.86 0.00 4,560.38 69.73 0.00 22,923.76 709.03 0.00 1,525.09 47.12 AC Transbay 0.00 49.09 38.18 0.00 3,945.20 196.98 0.00 21,988.36 2,434.38 0.00 1,463.85 161.76 Alameda/Oakland Ferry 0.00 60.00 0.00 0.00 9.09 0.00 0.00 65.90 0.00 0.00 4.39 0.00 Golden Gate Ferry 0.00 45.00 0.00 0.00 193.92 0.00 0.00 2,289.84 0.00 0.00 152.65 0.00 Angel Island - Tiburon Ferry 0.00 0.00 0.00 0.00 0.00 0.00 0.00 0.00 0.00 0.00 0.00 0.00 Blue and Gold 0.00 33.33 0.00 0.00 130.31 0.00 0.00 788.30 0.00 0.00 52.55 0.00 Vallejo Baylink Ferry 0.00 60.00 0.00 0.00 9.09 0.00 0.00 251.63 0.00 0.00 16.77 0.00 BART 0.00 15.00 15.00 0.00 94,153.48 933.38 0.00 902,619.96 18,916.11 0.00 30,076.33 630.36 Caltrain 0.00 60.00 60.00 0.00 7,878.19 281.89 0.00 115,259.54 6,802.05 0.00 3,841.44 226.72 Amtrak Capitol Cor. & Reg. Svc 0.00 60.00 60.00 0.00 1,575.63 51.53 0.00 50,824.36 2,494.69 0.00 1,694.07 83.16
Total 1,004.49 1,273.68 475.43 967,741.22 308,471.82 4,606.28 1,764,123.65 1,728,029.30 56,809.28 117,401.67 75,443.01 2,807.29
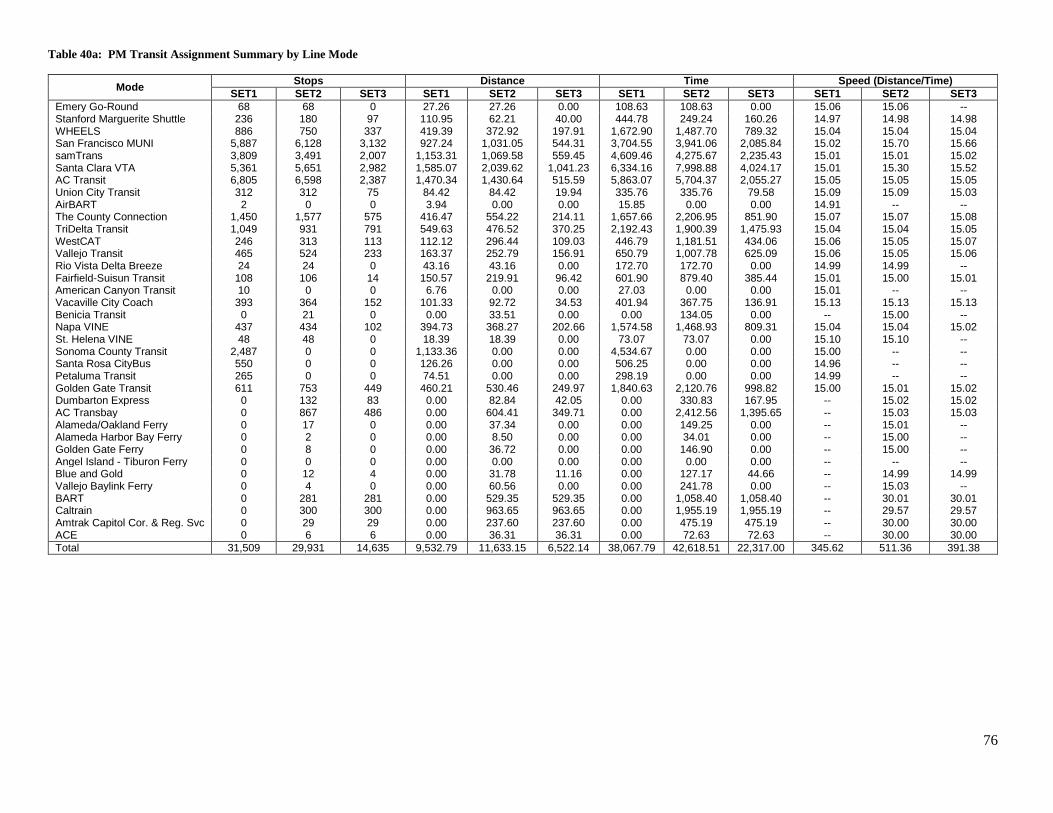
76
Table 40a: PM Transit Assignment Summary by Line Mode
Mode Stops Distance Time Speed (Distance/Time)
SET1 SET2 SET3 SET1 SET2 SET3 SET1 SET2 SET3 SET1 SET2 SET3
Emery Go-Round 68 68 0 27.26 27.26 0.00 108.63 108.63 0.00 15.06 15.06 -- Stanford Marguerite Shuttle 236 180 97 110.95 62.21 40.00 444.78 249.24 160.26 14.97 14.98 14.98 WHEELS 886 750 337 419.39 372.92 197.91 1,672.90 1,487.70 789.32 15.04 15.04 15.04 San Francisco MUNI 5,887 6,128 3,132 927.24 1,031.05 544.31 3,704.55 3,941.06 2,085.84 15.02 15.70 15.66 samTrans 3,809 3,491 2,007 1,153.31 1,069.58 559.45 4,609.46 4,275.67 2,235.43 15.01 15.01 15.02 Santa Clara VTA 5,361 5,651 2,982 1,585.07 2,039.62 1,041.23 6,334.16 7,998.88 4,024.17 15.01 15.30 15.52 AC Transit 6,805 6,598 2,387 1,470.34 1,430.64 515.59 5,863.07 5,704.37 2,055.27 15.05 15.05 15.05 Union City Transit 312 312 75 84.42 84.42 19.94 335.76 335.76 79.58 15.09 15.09 15.03 AirBART 2 0 0 3.94 0.00 0.00 15.85 0.00 0.00 14.91 -- -- The County Connection 1,450 1,577 575 416.47 554.22 214.11 1,657.66 2,206.95 851.90 15.07 15.07 15.08 TriDelta Transit 1,049 931 791 549.63 476.52 370.25 2,192.43 1,900.39 1,475.93 15.04 15.04 15.05 WestCAT 246 313 113 112.12 296.44 109.03 446.79 1,181.51 434.06 15.06 15.05 15.07 Vallejo Transit 465 524 233 163.37 252.79 156.91 650.79 1,007.78 625.09 15.06 15.05 15.06 Rio Vista Delta Breeze 24 24 0 43.16 43.16 0.00 172.70 172.70 0.00 14.99 14.99 -- Fairfield-Suisun Transit 108 106 14 150.57 219.91 96.42 601.90 879.40 385.44 15.01 15.00 15.01 American Canyon Transit 10 0 0 6.76 0.00 0.00 27.03 0.00 0.00 15.01 -- -- Vacaville City Coach 393 364 152 101.33 92.72 34.53 401.94 367.75 136.91 15.13 15.13 15.13 Benicia Transit 0 21 0 0.00 33.51 0.00 0.00 134.05 0.00 -- 15.00 -- Napa VINE 437 434 102 394.73 368.27 202.66 1,574.58 1,468.93 809.31 15.04 15.04 15.02 St. Helena VINE 48 48 0 18.39 18.39 0.00 73.07 73.07 0.00 15.10 15.10 -- Sonoma County Transit 2,487 0 0 1,133.36 0.00 0.00 4,534.67 0.00 0.00 15.00 -- -- Santa Rosa CityBus 550 0 0 126.26 0.00 0.00 506.25 0.00 0.00 14.96 -- -- Petaluma Transit 265 0 0 74.51 0.00 0.00 298.19 0.00 0.00 14.99 -- -- Golden Gate Transit 611 753 449 460.21 530.46 249.97 1,840.63 2,120.76 998.82 15.00 15.01 15.02 Dumbarton Express 0 132 83 0.00 82.84 42.05 0.00 330.83 167.95 -- 15.02 15.02 AC Transbay 0 867 486 0.00 604.41 349.71 0.00 2,412.56 1,395.65 -- 15.03 15.03 Alameda/Oakland Ferry 0 17 0 0.00 37.34 0.00 0.00 149.25 0.00 -- 15.01 -- Alameda Harbor Bay Ferry 0 2 0 0.00 8.50 0.00 0.00 34.01 0.00 -- 15.00 -- Golden Gate Ferry 0 8 0 0.00 36.72 0.00 0.00 146.90 0.00 -- 15.00 -- Angel Island - Tiburon Ferry 0 0 0 0.00 0.00 0.00 0.00 0.00 0.00 -- -- -- Blue and Gold 0 12 4 0.00 31.78 11.16 0.00 127.17 44.66 -- 14.99 14.99 Vallejo Baylink Ferry 0 4 0 0.00 60.56 0.00 0.00 241.78 0.00 -- 15.03 -- BART 0 281 281 0.00 529.35 529.35 0.00 1,058.40 1,058.40 -- 30.01 30.01 Caltrain 0 300 300 0.00 963.65 963.65 0.00 1,955.19 1,955.19 -- 29.57 29.57 Amtrak Capitol Cor. & Reg. Svc 0 29 29 0.00 237.60 237.60 0.00 475.19 475.19 -- 30.00 30.00 ACE 0 6 6 0.00 36.31 36.31 0.00 72.63 72.63 -- 30.00 30.00
Total 31,509 29,931 14,635 9,532.79 11,633.15 6,522.14 38,067.79 42,618.51 22,317.00 345.62 511.36 391.38
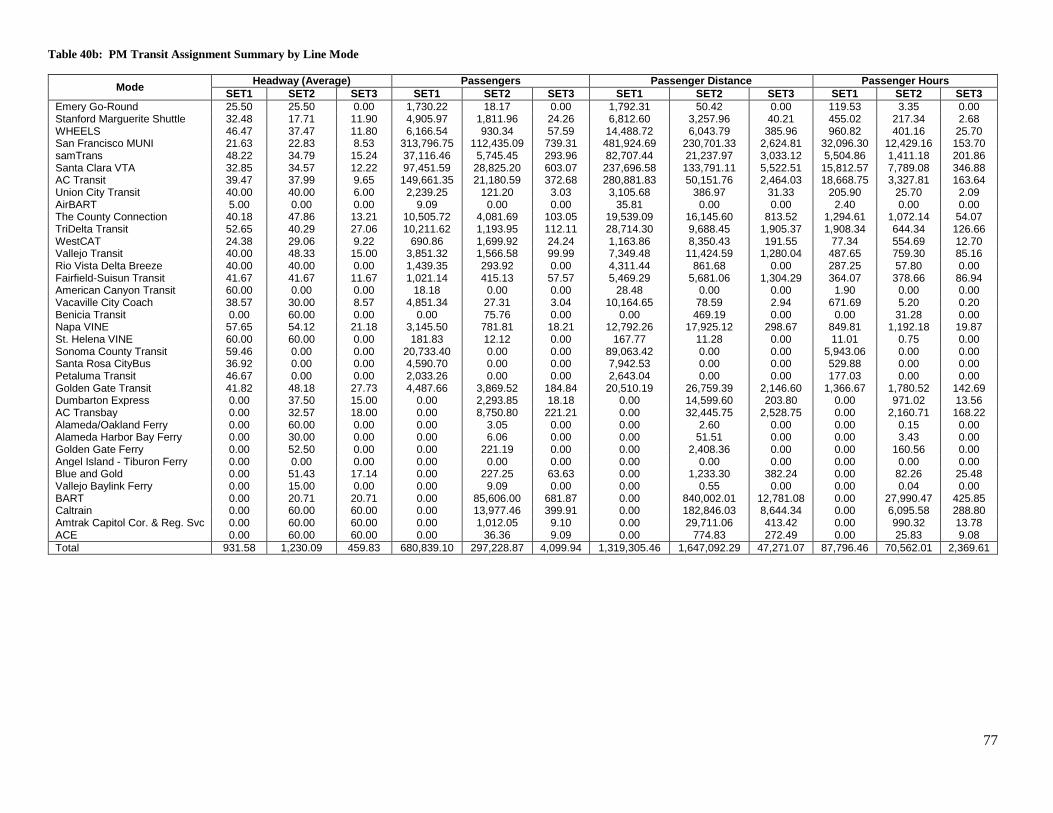
77
Table 40b: PM Transit Assignment Summary by Line Mode
Mode Headway (Average) Passengers Passenger Distance Passenger Hours
SET1 SET2 SET3 SET1 SET2 SET3 SET1 SET2 SET3 SET1 SET2 SET3
Emery Go-Round 25.50 25.50 0.00 1,730.22 18.17 0.00 1,792.31 50.42 0.00 119.53 3.35 0.00 Stanford Marguerite Shuttle 32.48 17.71 11.90 4,905.97 1,811.96 24.26 6,812.60 3,257.96 40.21 455.02 217.34 2.68 WHEELS 46.47 37.47 11.80 6,166.54 930.34 57.59 14,488.72 6,043.79 385.96 960.82 401.16 25.70 San Francisco MUNI 21.63 22.83 8.53 313,796.75 112,435.09 739.31 481,924.69 230,701.33 2,624.81 32,096.30 12,429.16 153.70 samTrans 48.22 34.79 15.24 37,116.46 5,745.45 293.96 82,707.44 21,237.97 3,033.12 5,504.86 1,411.18 201.86 Santa Clara VTA 32.85 34.57 12.22 97,451.59 28,825.20 603.07 237,696.58 133,791.11 5,522.51 15,812.57 7,789.08 346.88 AC Transit 39.47 37.99 9.65 149,661.35 21,180.59 372.68 280,881.83 50,151.76 2,464.03 18,668.75 3,327.81 163.64 Union City Transit 40.00 40.00 6.00 2,239.25 121.20 3.03 3,105.68 386.97 31.33 205.90 25.70 2.09 AirBART 5.00 0.00 0.00 9.09 0.00 0.00 35.81 0.00 0.00 2.40 0.00 0.00 The County Connection 40.18 47.86 13.21 10,505.72 4,081.69 103.05 19,539.09 16,145.60 813.52 1,294.61 1,072.14 54.07 TriDelta Transit 52.65 40.29 27.06 10,211.62 1,193.95 112.11 28,714.30 9,688.45 1,905.37 1,908.34 644.34 126.66 WestCAT 24.38 29.06 9.22 690.86 1,699.92 24.24 1,163.86 8,350.43 191.55 77.34 554.69 12.70 Vallejo Transit 40.00 48.33 15.00 3,851.32 1,566.58 99.99 7,349.48 11,424.59 1,280.04 487.65 759.30 85.16 Rio Vista Delta Breeze 40.00 40.00 0.00 1,439.35 293.92 0.00 4,311.44 861.68 0.00 287.25 57.80 0.00 Fairfield-Suisun Transit 41.67 41.67 11.67 1,021.14 415.13 57.57 5,469.29 5,681.06 1,304.29 364.07 378.66 86.94 American Canyon Transit 60.00 0.00 0.00 18.18 0.00 0.00 28.48 0.00 0.00 1.90 0.00 0.00 Vacaville City Coach 38.57 30.00 8.57 4,851.34 27.31 3.04 10,164.65 78.59 2.94 671.69 5.20 0.20 Benicia Transit 0.00 60.00 0.00 0.00 75.76 0.00 0.00 469.19 0.00 0.00 31.28 0.00 Napa VINE 57.65 54.12 21.18 3,145.50 781.81 18.21 12,792.26 17,925.12 298.67 849.81 1,192.18 19.87 St. Helena VINE 60.00 60.00 0.00 181.83 12.12 0.00 167.77 11.28 0.00 11.01 0.75 0.00 Sonoma County Transit 59.46 0.00 0.00 20,733.40 0.00 0.00 89,063.42 0.00 0.00 5,943.06 0.00 0.00 Santa Rosa CityBus 36.92 0.00 0.00 4,590.70 0.00 0.00 7,942.53 0.00 0.00 529.88 0.00 0.00 Petaluma Transit 46.67 0.00 0.00 2,033.26 0.00 0.00 2,643.04 0.00 0.00 177.03 0.00 0.00 Golden Gate Transit 41.82 48.18 27.73 4,487.66 3,869.52 184.84 20,510.19 26,759.39 2,146.60 1,366.67 1,780.52 142.69 Dumbarton Express 0.00 37.50 15.00 0.00 2,293.85 18.18 0.00 14,599.60 203.80 0.00 971.02 13.56 AC Transbay 0.00 32.57 18.00 0.00 8,750.80 221.21 0.00 32,445.75 2,528.75 0.00 2,160.71 168.22 Alameda/Oakland Ferry 0.00 60.00 0.00 0.00 3.05 0.00 0.00 2.60 0.00 0.00 0.15 0.00 Alameda Harbor Bay Ferry 0.00 30.00 0.00 0.00 6.06 0.00 0.00 51.51 0.00 0.00 3.43 0.00 Golden Gate Ferry 0.00 52.50 0.00 0.00 221.19 0.00 0.00 2,408.36 0.00 0.00 160.56 0.00 Angel Island - Tiburon Ferry 0.00 0.00 0.00 0.00 0.00 0.00 0.00 0.00 0.00 0.00 0.00 0.00 Blue and Gold 0.00 51.43 17.14 0.00 227.25 63.63 0.00 1,233.30 382.24 0.00 82.26 25.48 Vallejo Baylink Ferry 0.00 15.00 0.00 0.00 9.09 0.00 0.00 0.55 0.00 0.00 0.04 0.00 BART 0.00 20.71 20.71 0.00 85,606.00 681.87 0.00 840,002.01 12,781.08 0.00 27,990.47 425.85 Caltrain 0.00 60.00 60.00 0.00 13,977.46 399.91 0.00 182,846.03 8,644.34 0.00 6,095.58 288.80 Amtrak Capitol Cor. & Reg. Svc 0.00 60.00 60.00 0.00 1,012.05 9.10 0.00 29,711.06 413.42 0.00 990.32 13.78 ACE 0.00 60.00 60.00 0.00 36.36 9.09 0.00 774.83 272.49 0.00 25.83 9.08
Total 931.58 1,230.09 459.83 680,839.10 297,228.87 4,099.94 1,319,305.46 1,647,092.29 47,271.07 87,796.46 70,562.01 2,369.61
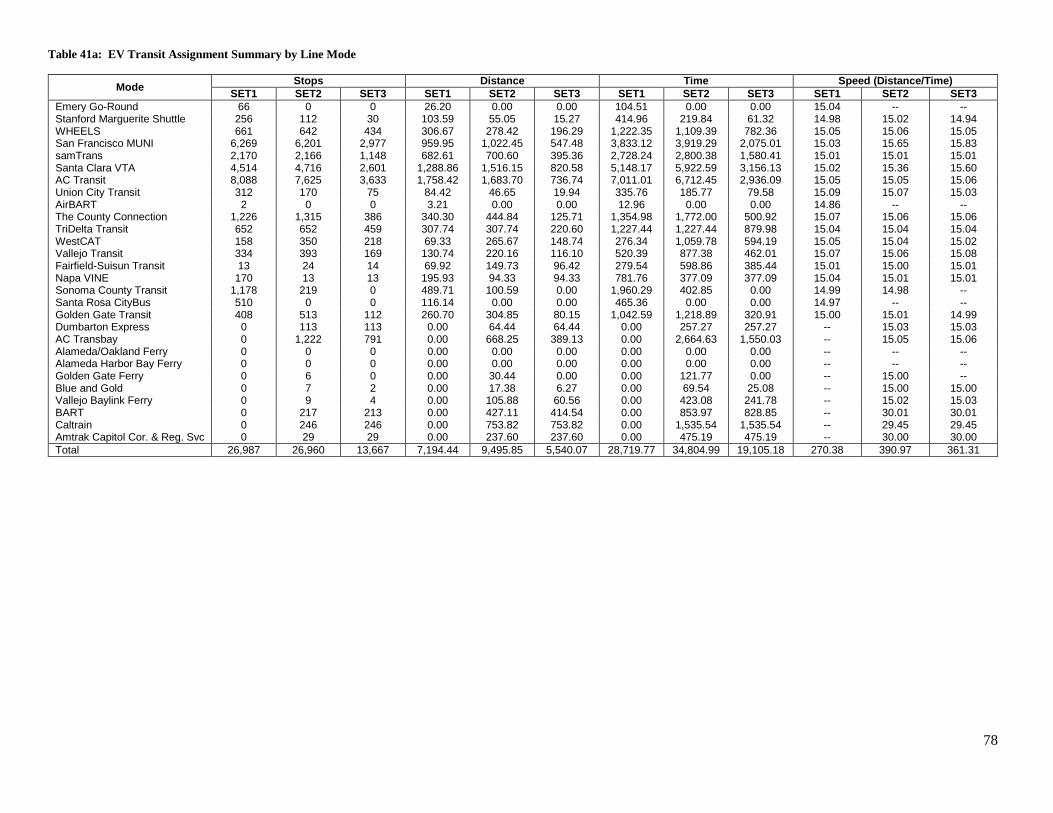
78
Table 41a: EV Transit Assignment Summary by Line Mode
Mode Stops Distance Time Speed (Distance/Time)
SET1 SET2 SET3 SET1 SET2 SET3 SET1 SET2 SET3 SET1 SET2 SET3
Emery Go-Round 66 0 0 26.20 0.00 0.00 104.51 0.00 0.00 15.04 -- -- Stanford Marguerite Shuttle 256 112 30 103.59 55.05 15.27 414.96 219.84 61.32 14.98 15.02 14.94 WHEELS 661 642 434 306.67 278.42 196.29 1,222.35 1,109.39 782.36 15.05 15.06 15.05 San Francisco MUNI 6,269 6,201 2,977 959.95 1,022.45 547.48 3,833.12 3,919.29 2,075.01 15.03 15.65 15.83 samTrans 2,170 2,166 1,148 682.61 700.60 395.36 2,728.24 2,800.38 1,580.41 15.01 15.01 15.01 Santa Clara VTA 4,514 4,716 2,601 1,288.86 1,516.15 820.58 5,148.17 5,922.59 3,156.13 15.02 15.36 15.60 AC Transit 8,088 7,625 3,633 1,758.42 1,683.70 736.74 7,011.01 6,712.45 2,936.09 15.05 15.05 15.06 Union City Transit 312 170 75 84.42 46.65 19.94 335.76 185.77 79.58 15.09 15.07 15.03 AirBART 2 0 0 3.21 0.00 0.00 12.96 0.00 0.00 14.86 -- -- The County Connection 1,226 1,315 386 340.30 444.84 125.71 1,354.98 1,772.00 500.92 15.07 15.06 15.06 TriDelta Transit 652 652 459 307.74 307.74 220.60 1,227.44 1,227.44 879.98 15.04 15.04 15.04 WestCAT 158 350 218 69.33 265.67 148.74 276.34 1,059.78 594.19 15.05 15.04 15.02 Vallejo Transit 334 393 169 130.74 220.16 116.10 520.39 877.38 462.01 15.07 15.06 15.08 Fairfield-Suisun Transit 13 24 14 69.92 149.73 96.42 279.54 598.86 385.44 15.01 15.00 15.01 Napa VINE 170 13 13 195.93 94.33 94.33 781.76 377.09 377.09 15.04 15.01 15.01 Sonoma County Transit 1,178 219 0 489.71 100.59 0.00 1,960.29 402.85 0.00 14.99 14.98 -- Santa Rosa CityBus 510 0 0 116.14 0.00 0.00 465.36 0.00 0.00 14.97 -- -- Golden Gate Transit 408 513 112 260.70 304.85 80.15 1,042.59 1,218.89 320.91 15.00 15.01 14.99 Dumbarton Express 0 113 113 0.00 64.44 64.44 0.00 257.27 257.27 -- 15.03 15.03 AC Transbay 0 1,222 791 0.00 668.25 389.13 0.00 2,664.63 1,550.03 -- 15.05 15.06 Alameda/Oakland Ferry 0 0 0 0.00 0.00 0.00 0.00 0.00 0.00 -- -- -- Alameda Harbor Bay Ferry 0 0 0 0.00 0.00 0.00 0.00 0.00 0.00 -- -- -- Golden Gate Ferry 0 6 0 0.00 30.44 0.00 0.00 121.77 0.00 -- 15.00 -- Blue and Gold 0 7 2 0.00 17.38 6.27 0.00 69.54 25.08 -- 15.00 15.00 Vallejo Baylink Ferry 0 9 4 0.00 105.88 60.56 0.00 423.08 241.78 -- 15.02 15.03 BART 0 217 213 0.00 427.11 414.54 0.00 853.97 828.85 -- 30.01 30.01 Caltrain 0 246 246 0.00 753.82 753.82 0.00 1,535.54 1,535.54 -- 29.45 29.45 Amtrak Capitol Cor. & Reg. Svc 0 29 29 0.00 237.60 237.60 0.00 475.19 475.19 -- 30.00 30.00
Total 26,987 26,960 13,667 7,194.44 9,495.85 5,540.07 28,719.77 34,804.99 19,105.18 270.38 390.97 361.31
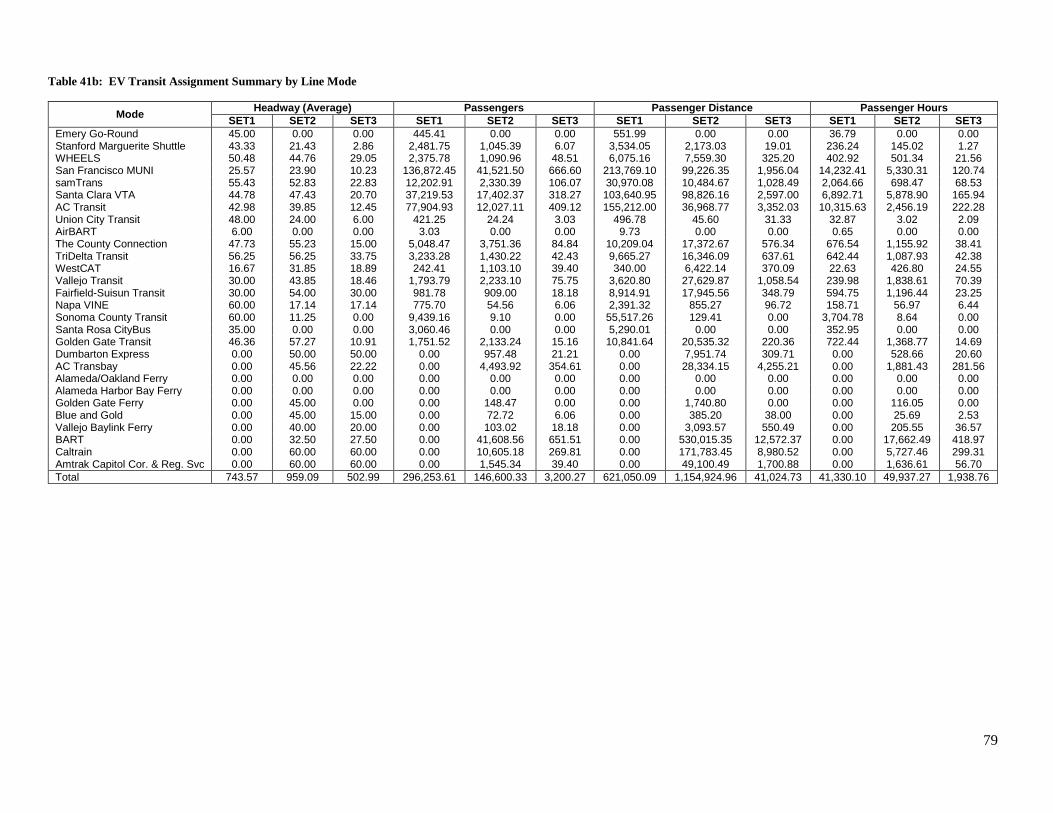
79
Table 41b: EV Transit Assignment Summary by Line Mode
Mode Headway (Average) Passengers Passenger Distance Passenger Hours
SET1 SET2 SET3 SET1 SET2 SET3 SET1 SET2 SET3 SET1 SET2 SET3
Emery Go-Round 45.00 0.00 0.00 445.41 0.00 0.00 551.99 0.00 0.00 36.79 0.00 0.00 Stanford Marguerite Shuttle 43.33 21.43 2.86 2,481.75 1,045.39 6.07 3,534.05 2,173.03 19.01 236.24 145.02 1.27 WHEELS 50.48 44.76 29.05 2,375.78 1,090.96 48.51 6,075.16 7,559.30 325.20 402.92 501.34 21.56 San Francisco MUNI 25.57 23.90 10.23 136,872.45 41,521.50 666.60 213,769.10 99,226.35 1,956.04 14,232.41 5,330.31 120.74 samTrans 55.43 52.83 22.83 12,202.91 2,330.39 106.07 30,970.08 10,484.67 1,028.49 2,064.66 698.47 68.53 Santa Clara VTA 44.78 47.43 20.70 37,219.53 17,402.37 318.27 103,640.95 98,826.16 2,597.00 6,892.71 5,878.90 165.94 AC Transit 42.98 39.85 12.45 77,904.93 12,027.11 409.12 155,212.00 36,968.77 3,352.03 10,315.63 2,456.19 222.28 Union City Transit 48.00 24.00 6.00 421.25 24.24 3.03 496.78 45.60 31.33 32.87 3.02 2.09 AirBART 6.00 0.00 0.00 3.03 0.00 0.00 9.73 0.00 0.00 0.65 0.00 0.00 The County Connection 47.73 55.23 15.00 5,048.47 3,751.36 84.84 10,209.04 17,372.67 576.34 676.54 1,155.92 38.41 TriDelta Transit 56.25 56.25 33.75 3,233.28 1,430.22 42.43 9,665.27 16,346.09 637.61 642.44 1,087.93 42.38 WestCAT 16.67 31.85 18.89 242.41 1,103.10 39.40 340.00 6,422.14 370.09 22.63 426.80 24.55 Vallejo Transit 30.00 43.85 18.46 1,793.79 2,233.10 75.75 3,620.80 27,629.87 1,058.54 239.98 1,838.61 70.39 Fairfield-Suisun Transit 30.00 54.00 30.00 981.78 909.00 18.18 8,914.91 17,945.56 348.79 594.75 1,196.44 23.25 Napa VINE 60.00 17.14 17.14 775.70 54.56 6.06 2,391.32 855.27 96.72 158.71 56.97 6.44 Sonoma County Transit 60.00 11.25 0.00 9,439.16 9.10 0.00 55,517.26 129.41 0.00 3,704.78 8.64 0.00 Santa Rosa CityBus 35.00 0.00 0.00 3,060.46 0.00 0.00 5,290.01 0.00 0.00 352.95 0.00 0.00 Golden Gate Transit 46.36 57.27 10.91 1,751.52 2,133.24 15.16 10,841.64 20,535.32 220.36 722.44 1,368.77 14.69 Dumbarton Express 0.00 50.00 50.00 0.00 957.48 21.21 0.00 7,951.74 309.71 0.00 528.66 20.60 AC Transbay 0.00 45.56 22.22 0.00 4,493.92 354.61 0.00 28,334.15 4,255.21 0.00 1,881.43 281.56 Alameda/Oakland Ferry 0.00 0.00 0.00 0.00 0.00 0.00 0.00 0.00 0.00 0.00 0.00 0.00 Alameda Harbor Bay Ferry 0.00 0.00 0.00 0.00 0.00 0.00 0.00 0.00 0.00 0.00 0.00 0.00 Golden Gate Ferry 0.00 45.00 0.00 0.00 148.47 0.00 0.00 1,740.80 0.00 0.00 116.05 0.00 Blue and Gold 0.00 45.00 15.00 0.00 72.72 6.06 0.00 385.20 38.00 0.00 25.69 2.53 Vallejo Baylink Ferry 0.00 40.00 20.00 0.00 103.02 18.18 0.00 3,093.57 550.49 0.00 205.55 36.57 BART 0.00 32.50 27.50 0.00 41,608.56 651.51 0.00 530,015.35 12,572.37 0.00 17,662.49 418.97 Caltrain 0.00 60.00 60.00 0.00 10,605.18 269.81 0.00 171,783.45 8,980.52 0.00 5,727.46 299.31 Amtrak Capitol Cor. & Reg. Svc 0.00 60.00 60.00 0.00 1,545.34 39.40 0.00 49,100.49 1,700.88 0.00 1,636.61 56.70
Total 743.57 959.09 502.99 296,253.61 146,600.33 3,200.27 621,050.09 1,154,924.96 41,024.73 41,330.10 49,937.27 1,938.76
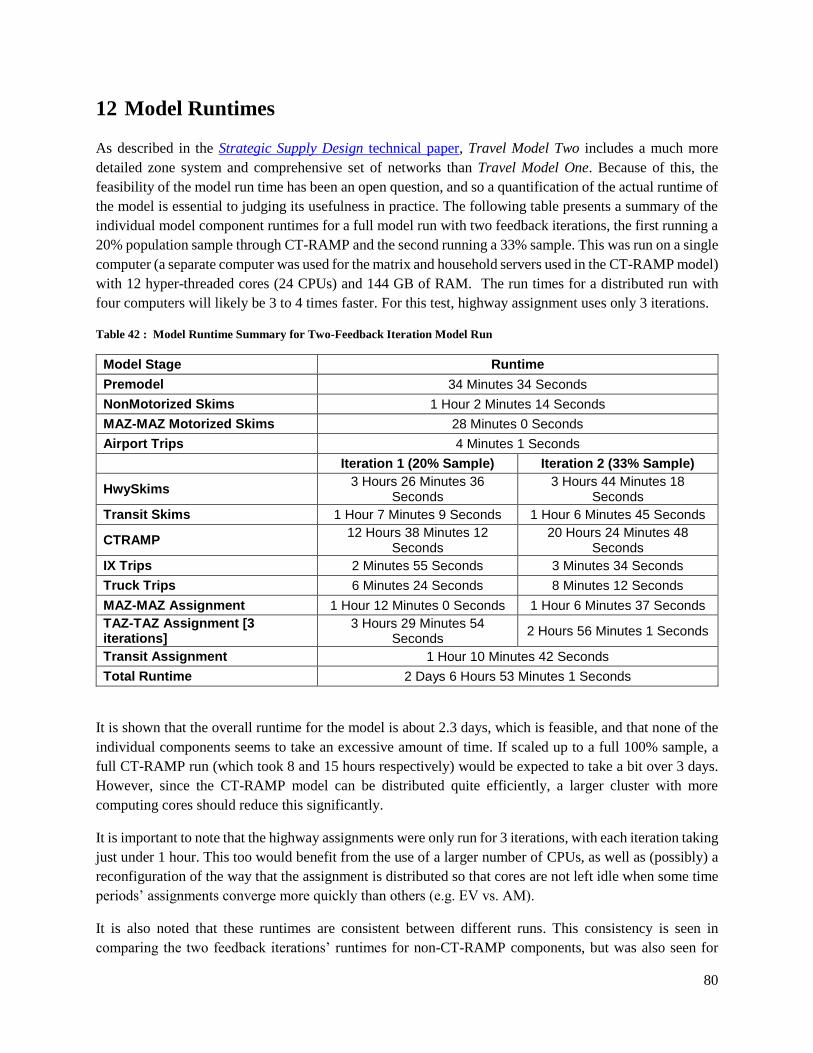
80
12 Model Runtimes
As described in the Strategic Supply Design technical paper, Travel Model Two includes a much more
detailed zone system and comprehensive set of networks than Travel Model One. Because of this, the
feasibility of the model run time has been an open question, and so a quantification of the actual runtime of
the model is essential to judging its usefulness in practice. The following table presents a summary of the
individual model component runtimes for a full model run with two feedback iterations, the first running a
20% population sample through CT-RAMP and the second running a 33% sample. This was run on a single
computer (a separate computer was used for the matrix and household servers used in the CT-RAMP model)
with 12 hyper-threaded cores (24 CPUs) and 144 GB of RAM. The run times for a distributed run with
four computers will likely be 3 to 4 times faster. For this test, highway assignment uses only 3 iterations.
Table 42 : Model Runtime Summary for Two-Feedback Iteration Model Run
Model Stage Runtime
Premodel 34 Minutes 34 Seconds
NonMotorized Skims 1 Hour 2 Minutes 14 Seconds
MAZ-MAZ Motorized Skims 28 Minutes 0 Seconds
Airport Trips 4 Minutes 1 Seconds
Iteration 1 (20% Sample) Iteration 2 (33% Sample)
HwySkims 3 Hours 26 Minutes 36
Seconds 3 Hours 44 Minutes 18
Seconds
Transit Skims 1 Hour 7 Minutes 9 Seconds 1 Hour 6 Minutes 45 Seconds
CTRAMP 12 Hours 38 Minutes 12
Seconds 20 Hours 24 Minutes 48
Seconds
IX Trips 2 Minutes 55 Seconds 3 Minutes 34 Seconds
Truck Trips 6 Minutes 24 Seconds 8 Minutes 12 Seconds
MAZ-MAZ Assignment 1 Hour 12 Minutes 0 Seconds 1 Hour 6 Minutes 37 Seconds
TAZ-TAZ Assignment [3 iterations]
3 Hours 29 Minutes 54 Seconds
2 Hours 56 Minutes 1 Seconds
Transit Assignment 1 Hour 10 Minutes 42 Seconds
Total Runtime 2 Days 6 Hours 53 Minutes 1 Seconds
It is shown that the overall runtime for the model is about 2.3 days, which is feasible, and that none of the
individual components seems to take an excessive amount of time. If scaled up to a full 100% sample, a
full CT-RAMP run (which took 8 and 15 hours respectively) would be expected to take a bit over 3 days.
However, since the CT-RAMP model can be distributed quite efficiently, a larger cluster with more
computing cores should reduce this significantly.
It is important to note that the highway assignments were only run for 3 iterations, with each iteration taking
just under 1 hour. This too would benefit from the use of a larger number of CPUs, as well as (possibly) a
reconfiguration of the way that the assignment is distributed so that cores are not left idle when some time
periods’ assignments converge more quickly than others (e.g. EV vs. AM).
It is also noted that these runtimes are consistent between different runs. This consistency is seen in
comparing the two feedback iterations’ runtimes for non-CT-RAMP components, but was also seen for
81
other components such as non-motorized skims when multiple runs were made during the debugging stages
of this verification process.
82
13 Conclusions
Travel Model Two is a substantial upgrade to Travel Model One. On the supply side, it has a significantly
more detailed highway, non-motorized and transit network and an enhanced zone system. The study region
is now represented using about 4,700 TAZs and 39,000 MAZs – such a fine representation of space ensures
that accessibilities are calculated more accurately than before. The network is built using an “all streets”
network that has information up to the level of local streets and even pedestrian and bike trails. On the
demand side, a significant amount of ABM improvements has been incorporated into this model – some of
which have been tested in other regions and other features that are new and innovative. These changes have
resulted in the complete revamping of the MTC travel model.
In this technical memorandum we have looked at individual model components of the new model and
ensured that it is working as expected and producing intuitive results. Although here we have shown that
the model is performing as designed, the various model components would need to be calibrated and
validated to ensure that Travel Model Two replicates the base year conditions in the Bay Area.