Embed Size (px)
Citation preview
www.primeindexes.com
WHITEPAPER
Travel TechIndustry Overview
www.primeindexes.comPRIME INDEXES | www.primeindexes.com | Travel Tech Industry | 2
ContentsAbstract . . . . . . . . . . . . . . . . . . . . . . . . . . . . . . . . . . . . . . . . . . . . . . . . . . . . . . . . . 3
Introduction . . . . . . . . . . . . . . . . . . . . . . . . . . . . . . . . . . . . . . . . . . . . . . . . . . . . . . 3
Industry Overview . . . . . . . . . . . . . . . . . . . . . . . . . . . . . . . . . . . . . . . . . . . . . . . . . 4
Online Travel Booking Market . . . . . . . . . . . . . . . . . . . . . . . . . . . . . . . . . . . . . . . . 5
Overview . . . . . . . . . . . . . . . . . . . . . . . . . . . . . . . . . . . . . . . . . . . . . . . 5
Packaged holidays . . . . . . . . . . . . . . . . . . . . . . . . . . . . . . . . . . . . . . . . . . . 6
Hotels . . . . . . . . . . . . . . . . . . . . . . . . . . . . . . . . . . . . . . . . . . . . . . . . . 6
Vacation Rentals . . . . . . . . . . . . . . . . . . . . . . . . . . . . . . . . . . . . . . . . . . . . 7
Experiences and tours . . . . . . . . . . . . . . . . . . . . . . . . . . . . . . . . . . . . . . . 8
Cruises . . . . . . . . . . . . . . . . . . . . . . . . . . . . . . . . . . . . . . . . . . . . . . . . 8
Travel Technology Beneficiaries . . . . . . . . . . . . . . . . . . . . . . . . . . . . . . . 8
Online Mobility Services . . . . . . . . . . . . . . . . . . . . . . . . . . . . . . . . . . . . . . . . . . . . . 9
Overview . . . . . . . . . . . . . . . . . . . . . . . . . . . . . . . . . . . . . . . . . . . . . . . 9
Flights . . . . . . . . . . . . . . . . . . . . . . . . . . . . . . . . . . . . . . . . . . . . . . . . . 9
Ride sharing and mobility tech . . . . . . . . . . . . . . . . . . . . . . . . . . . . . . . . 10
The future of mobility . . . . . . . . . . . . . . . . . . . . . . . . . . . . . . . . . . . . . . 11
Catalyst for Growth: Emergence of Developing Asia – China Case Study . . . . . 12
Catalyst for Growth: Tech-Supported Growth in Travel Spending . . . . . . . . . . . 13
Catalyst for Growth: Demographics . . . . . . . . . . . . . . . . . . . . . . . . . . . . . . . . . . . . . . 14
Catalyst for Growth: Mobile Payments . . . . . . . . . . . . . . . . . . . . . . . . . . . . . . . . 15
Catalyst for Growth: Specialized Travel – Gaming Tourism . . . . . . . . . . . . . . . . . . 15
Risks for Growth: US-China Trade War . . . . . . . . . . . . . . . . . . . . . . . . . . . . . . . . 16
Risks for Growth: Sustainable Tourism . . . . . . . . . . . . . . . . . . . . . . . . . . . . . . . . . . . 17
Risks for growth: Cyber Security . . . . . . . . . . . . . . . . . . . . . . . . . . . . . . . . . . . . . 17
Conclusion . . . . . . . . . . . . . . . . . . . . . . . . . . . . . . . . . . . . . . . . . . . . . . . . . . . . . . . . . 18
References . . . . . . . . . . . . . . . . . . . . . . . . . . . . . . . . . . . . . . . . . . . . . . . . . . . . . . . . . 19
www.primeindexes.comPRIME INDEXES | www.primeindexes.com | Travel Tech Industry | 3
IntroductionThe travel industry encompasses the practice of attracting, transporting, ac-commodating and entertaining both tourists and locals alike. Tourism spans the spectrum of activities and interests, including adventurers, vacationers, athletes, businesspeople, students, health-motivated travelers and many other more spe-cialized categories of traveler. Travel spending is largely supported by a mix of leisure and business spending which can take place either locally or abroad.
The larger travel and leisure industry consist of companies that provide travel & entertainment related services including, airlines, cruise ships, hotel chains, restaurant chains and general entertainment providers like theme parks, concert organizers and show operators. Travel technology is a subset of the travel and leisure industry. We define travel technology here as firms that provide digital booking services, online trip reviews, trip advice, ride sharing as well as other tech-enabled services that allow both residents & travelers to minimize frictions related to information asymmetry, price transparency and intermediation in the travel booking process.
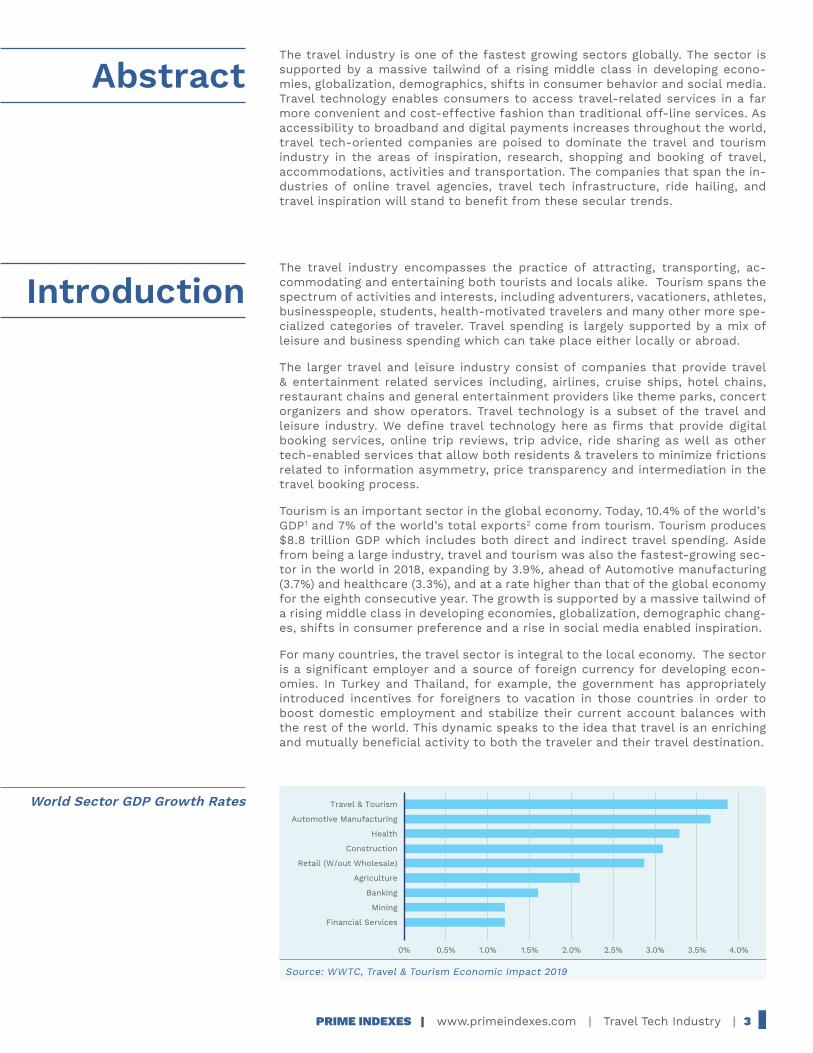
Tourism is an important sector in the global economy. Today, 10.4% of the world’s GDP1 and 7% of the world’s total exports2 come from tourism. Tourism produces $8.8 trillion GDP which includes both direct and indirect travel spending. Aside from being a large industry, travel and tourism was also the fastest-growing sec-tor in the world in 2018, expanding by 3.9%, ahead of Automotive manufacturing (3.7%) and healthcare (3.3%), and at a rate higher than that of the global economy for the eighth consecutive year. The growth is supported by a massive tailwind of a rising middle class in developing economies, globalization, demographic chang-es, shifts in consumer preference and a rise in social media enabled inspiration.
For many countries, the travel sector is integral to the local economy. The sector is a significant employer and a source of foreign currency for developing econ-omies. In Turkey and Thailand, for example, the government has appropriately introduced incentives for foreigners to vacation in those countries in order to boost domestic employment and stabilize their current account balances with the rest of the world. This dynamic speaks to the idea that travel is an enriching and mutually beneficial activity to both the traveler and their travel destination.
Source: WWTC, Travel & Tourism Economic Impact 2019
World Sector GDP Growth RatesAutomotive Manufacturing
Health
Construction
Travel & Tourism
Retail (W/out Wholesale)
Banking
Mining
Financial Services
Agriculture
0% 0.5% 1.0% 1.5% 2.0% 2.5% 3.0% 4.0%3.5%
AbstractThe travel industry is one of the fastest growing sectors globally. The sector is supported by a massive tailwind of a rising middle class in developing econo-mies, globalization, demographics, shifts in consumer behavior and social media. Travel technology enables consumers to access travel-related services in a far more convenient and cost-effective fashion than traditional off-line services. As accessibility to broadband and digital payments increases throughout the world, travel tech-oriented companies are poised to dominate the travel and tourism industry in the areas of inspiration, research, shopping and booking of travel, accommodations, activities and transportation. The companies that span the in-dustries of online travel agencies, travel tech infrastructure, ride hailing, and travel inspiration will stand to benefit from these secular trends.
www.primeindexes.comPRIME INDEXES | www.primeindexes.com | Travel Tech Industry | 4
Source: Statista 2019
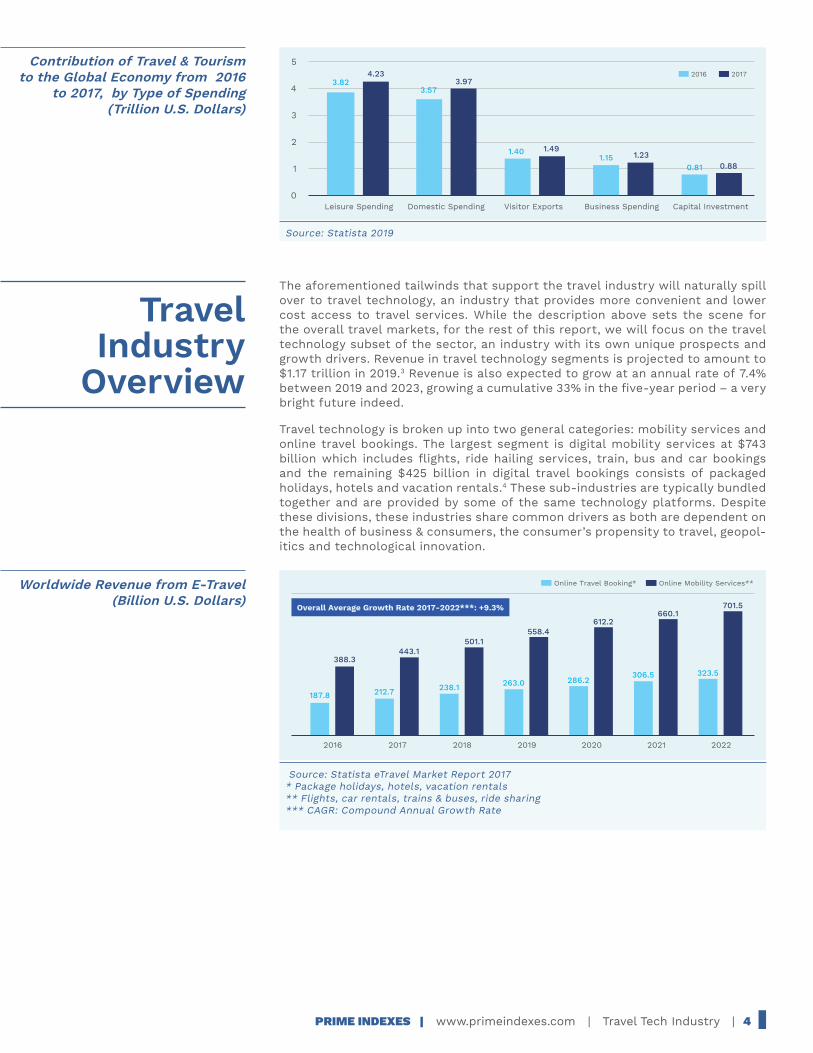
The aforementioned tailwinds that support the travel industry will naturally spill over to travel technology, an industry that provides more convenient and lower cost access to travel services. While the description above sets the scene for the overall travel markets, for the rest of this report, we will focus on the travel technology subset of the sector, an industry with its own unique prospects and growth drivers. Revenue in travel technology segments is projected to amount to $1.17 trillion in 2019.3 Revenue is also expected to grow at an annual rate of 7.4% between 2019 and 2023, growing a cumulative 33% in the five-year period – a very bright future indeed.
Travel technology is broken up into two general categories: mobility services and online travel bookings. The largest segment is digital mobility services at $743 billion which includes flights, ride hailing services, train, bus and car bookings and the remaining $425 billion in digital travel bookings consists of packaged holidays, hotels and vacation rentals.4 These sub-industries are typically bundled together and are provided by some of the same technology platforms. Despite these divisions, these industries share common drivers as both are dependent on the health of business & consumers, the consumer’s propensity to travel, geopol-itics and technological innovation.
Source: Statista eTravel Market Report 2017* Package holidays, hotels, vacation rentals** Flights, car rentals, trains & buses, ride sharing*** CAGR: Compound Annual Growth Rate
Travel Industry
Overview
Worldwide Revenue from E-Travel (Billion U.S. Dollars)
2016 2017 2018 2019 202220212020
187.8
388.3
238.1
501.1
263.0
558.4
286.2
612.2
306.5
660.1
323.5
701.5
212.7
443.1
Online Travel Booking* Online Mobility Services**
Overall Average Growth Rate 2017-2022***: +9.3%
Contribution of Travel & Tourism to the Global Economy from 2016
to 2017, by Type of Spending (Trillion U.S. Dollars)
0
1
2
3
4
5
Leisure Spending Domestic Spending Visitor Exports Business Spending Capital Investment
3.824.23
3.573.97
1.40 1.491.15 1.23
0.81 0.88
2016 2017
www.primeindexes.comPRIME INDEXES | www.primeindexes.com | Travel Tech Industry | 5
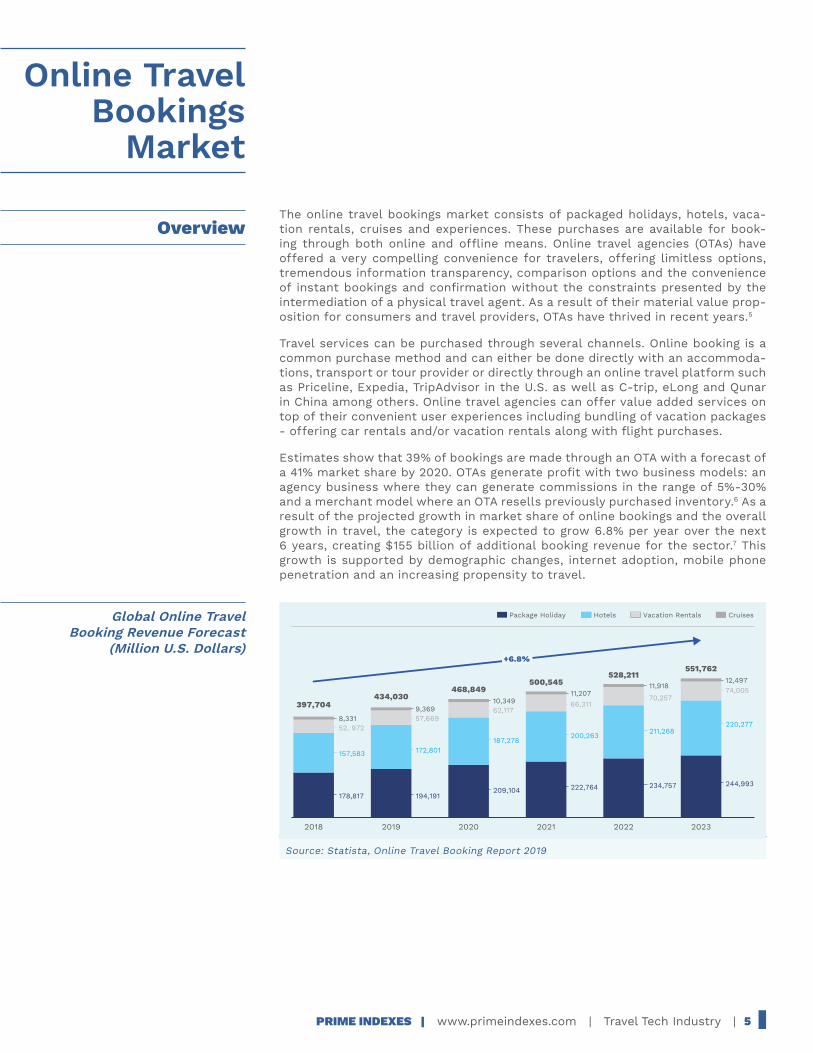
The online travel bookings market consists of packaged holidays, hotels, vaca-tion rentals, cruises and experiences. These purchases are available for book-ing through both online and offline means. Online travel agencies (OTAs) have offered a very compelling convenience for travelers, offering limitless options, tremendous information transparency, comparison options and the convenience of instant bookings and confirmation without the constraints presented by the intermediation of a physical travel agent. As a result of their material value prop-osition for consumers and travel providers, OTAs have thrived in recent years.5
Travel services can be purchased through several channels. Online booking is a common purchase method and can either be done directly with an accommoda-tions, transport or tour provider or directly through an online travel platform such as Priceline, Expedia, TripAdvisor in the U.S. as well as C-trip, eLong and Qunar in China among others. Online travel agencies can offer value added services on top of their convenient user experiences including bundling of vacation packages - offering car rentals and/or vacation rentals along with flight purchases.
Estimates show that 39% of bookings are made through an OTA with a forecast of a 41% market share by 2020. OTAs generate profit with two business models: an agency business where they can generate commissions in the range of 5%-30% and a merchant model where an OTA resells previously purchased inventory.6 As a result of the projected growth in market share of online bookings and the overall growth in travel, the category is expected to grow 6.8% per year over the next 6 years, creating $155 billion of additional booking revenue for the sector.7 This growth is supported by demographic changes, internet adoption, mobile phone penetration and an increasing propensity to travel.
Source: Statista, Online Travel Booking Report 2019
Online Travel Bookings
Market
Overview
Global Online Travel Booking Revenue Forecast
(Million U.S. Dollars)
2018 2019 2020 2021 2022 2023
Package Holiday Vacation RentalsHotels Cruises
157,583
52, 9728,331
178,817
172,801
57,6699,369
194,191
187,278
62,11710,349
209,104
200,263
66,31111,207
222,764
211,268
70,257
11,918
234,757
220,277
74,00512,497
244,993
397,704434,030
468,849500,545
528,211551,762
+6.8%
www.primeindexes.comPRIME INDEXES | www.primeindexes.com | Travel Tech Industry | 6
In 2018, customers spent $179 billion on packaged holidays online.7 A packaged holiday is one of the many ways online travel agencies can add similar value to that of an offline agent. By combining various travel items, consumers receive the benefit of a well-planned vacation at a discounted price. The convenience-ori-ented consumer preference will likely lead to a continued use of packaged holi-day deals, especially in an environment where the consumer is overwhelmed by the amount of travel destinations and trip types to choose from and in a category where personalization is highly valued. As the industry continues to grow, it’s natural to expect packaged holidays to keep pace as a result of this consumer and provider preference for bundling of services.
Annual spending on hotels totaled $570 billion in 2018.8 Roughly half of this an-nual spend9 is booked online and about half that is booked through an OTA, for a total OTA spend of $158 billion or 28% of total industry revenues. In the past decade, OTAs have taken a significant share (greater than 5%) of bookings away from hotels.10 The money at stake is massive as online-travel agencies collect 15-30% of the pre-tax notional value of the booking, so this loss in share has taken a large bite out of hotel’s profitability.
Due to the large stakes involved, a significant competition ensued over accom-modation bookings. To combat the increasing market share of OTAs, hotels have launched campaigns to try go get customers to book on their sites directly by providing membership reward incentives as part of their loyalty programs.11 How-ever, this campaign was largely unsuccessful as OTAs gained market share in the two years after such campaigns were launched.12
The primary reason for the resilience of OTAs is that many hotel chains have found the economics of acquiring a new user is often greater than the com-missions they pay to OTAs, especially in an environment of declining customer loyalty. Between the prevailing cost of clicks on google and the low conversion rates of clicks, the cost of acquiring a new customer can be multiples of the commission paid.13
This generally speaks to the moat of online travel agencies. They’re able to pass down superior unit economics of acquiring a customer down to the hotel chain, creating an environment where hotels are increasingly reliant upon them. From there, a hotel’s inability to attain the customer’s loyalty will lead the same cus-tomer to rebook on the same OTA platforms. As a result of these dynamics, OTAs surpasses hotel websites in gross bookings in 2016 and widened that lead in 2017. 13
Addressing hotel industry management, Expedia’s former CEO Dara Khosrowsha-hi summed it up best:
“You guys all criticize me for how much I charge you for guests to come to your hotel. I think you’re looking at it wrong. Look at us as the cheapest source of re-ferrals that you could imagine. If they come through me, you pay me once, and if they come back to me again and again, shame on you. You should make them a loyal customer”
There are a few reasons for a hotel’s inability to fight back against the OTA in a meaningful way. Most importantly, there’s an industry-wide standard of rate par-ity agreements that maintains similar pricing across all booking channels.14 Rate parity agreements are legal contracts between a hotel and an OTA and were put in place to ensure that neither party is able to undercut the other. However, an agreement that initially was supposed to prevent OTAs from undercutting prices, have effectively commoditized various accommodation booking channels.
Without being able to compete on price, hotels need to offer generous loyal-ty programs in order to get customers to change their price-shopping behavior. However, hotels generally cannot afford overly generous programs because the hotel industry’s profit margins are already fairly tight.15 Even if hotels were able to offer greater incentives, today’s price conscious consumer is likely to pick the
Packaged holidays
Hotels
www.primeindexes.comPRIME INDEXES | www.primeindexes.com | Travel Tech Industry | 7
best deal in each of their travel destination and a single hotel chain is unlikely to provide the best value in every market.
From the customer’s perspective, the ability to read reviews, price shop and compare on an OTAs site is unparalleled. In fact, according to TripAdvisor 96% of their users considered reading reviews important when booking a hotel.16 As a result of this value proposition, 52% of millennials prefer to book their hotels via an OTA vs a direct booking with the hotel site.
In 2018, $53 billion was spent on bookings of vacation rentals. Vacation rentals is an increasingly interesting sub-space –made popular by Airbnb. While players like VRBO and HomeAway (both owned by Expedia) have offered stays in vacation homes and apartments for many years, Airbnb’s primary focus is on short-term stays within a host’s primary residence, typically in urban areas. This shift has been controversial with many urban centers pushing back on the legality of such accommodations.17
The upshot is that the market share of vacation rentals is just 24% of total world-wide accommodation bookings.18 Which means that, there’s a long way to go for vacation rentals to catch-up to traditional hotels. While hotels are likely to respond to these changing consumer preferences, the addition of this vacation rental category is a boon to OTAs like Expedia or Priceline or online platforms like Airbnb that get a commission from these rentals. Whereas, with traditional ho-tels, consumers have an option to book directly with the hotel sites, in the case of vacation rentals, there is no alternative to an OTA booking.
Much of the interest in the alternatives to conventional accommodation is cata-lyzed both by trends of increased asset-utilization facilitated by digital platforms that allow owners to collect an economic rent, but also by consumer preferences for home-like alternative to hotels at a cheaper price. In fact, in a recent tripping.com survey19, survey responders attribute their decision to book a vacation rental to kitchen access, price, privacy and ample space to accommodate a group – as-pects that are not typically offered by a traditional hotel property.
To accommodate the evolving shifts in consumer preference and niche offerings from new market entrants, the hospitality industry is increasingly offering unique and more mobile accommodations for consumers seeking a more personalized travel experience. New accommodation concepts are bourgeoning by the year. Everything from secret cabin retreats, travel van resorts, modular hotels, and floating hotels are available to suit the varying preferences of today’s traveler.20 As the younger demographic seek a differentiated accommodation style, OTAs will naturally benefit from these shifting consumer preferences that overlap nicely with the cohort’s propensity to book through OTAs.
Source: Mauprieto, The State of Online Travel Agencies - 2019
Vacation rentals
Revenue Distribution, 2018
MakeMyTrip 11%
eDreamsOdigeo 13%
Despegar 11%
Lastminute 7%On The Beach 3%
Trip Advisor 33%
Trivago 22%
BOOKING41%
EXPEDIA32%
CTRIP 13%
OTHER 14%
www.primeindexes.comPRIME INDEXES | www.primeindexes.com | Travel Tech Industry | 8
The experience economy is expected to grow tremendously in the next ten years. Experiences and adventures are an obvious new service to sell to prospective tourists. Many surveys indicate that consumer are increasingly prioritizing ex-periences over material possessions. In fact, 55% of millennials report spending more on live events and experiences than ever before while 77% of responders say live experiences create irreplaceable memories21 and most importantly, 67% of affluent travelers would rather spend their money on experiences than on a nicer hotel, up 8% from the prior year.22 Some OTAs are laser focused on this category. For example, TripAdvisor’s purchase of Viator shows that OTAs are very serious about adding tours and experience to their gamut of offerings. Airbnb has also gotten into the mix by offering experiences along with advertising flats and vacation homes on its platform.
In 2018 cruise spending eclipsed the $9 billion level, marking a 12.5% YoY growth, the highest of all the travel categories.7 Cruises offer consumers the convenience of a bundled transportation and accommodation service. Aside from this bun-dling of core travel services, cruise ships allow for easy accommodations for large groups as well as families who are looking to day-care and youth-specific activities to generate interest amongst the entire family. Furthermore, the cruise format allows consumers to sample many destinations and get inspired for future trips down the line.23
Despite being a small segment of the travel booking market, the share of booking completed through traditional travel agents is fairly high at an estimated range of 46%-68%.24 These estimates imply that only a third of the sales is booked through digital channels. This travel category is full of personalization potential and consumers are still relying on offline travel agency services. However, there are new up-starts in the online travel agency space that are seeking to disrupt traditional channels. A new cruise-focused platform, CruiseWire offers a direct booking portal for 25,000 routes across 121 countries and 11 cruise lines.25 One of its differentiated offerings is a ‘back-to-back’ cruise search option where users can combine cruise bookings in order to fulfill a customized itinerary. By offering this unique search functionality and a rewards program, the platform hopes to attract a portion of off-line cruise bookings.
The bright prospects for online travel agency have other beneficiaries. There are many travel technology infrastructure providers that naturally benefit from the increased volumes of bookings that OTAs are projected to process. These provid-ers maintain the backend and the distribution infrastructure necessary for many of the online travel agencies and aggregators to function while bringing a wide variety of timely and accurate options for eCommere consumers.
Companies like Sabre are instrumental in providing a global distribution system for air and hotel rates and inventories across North America. Sabre is one of the few companies that maintain the distribution of flight information and prices across a network accessed directly by airlines, hotels, OTAs and travel wholesal-ers. This is a highly demanding role for the company as it processes over 85,000 data transactions every second for customers.26
In addition to supporting the backend, these providers are offering customer ex-perience enhancing tools including chatbots, AI and big data analytics. Amadeus, for example, has developed a schedule recovery software for airlines which aids in decisions regarding aircraft usage, landing slot assignment or flight delays. Qantas Airlines has seen a 60% reduction in air traffic delays using Amadeus’ schedule recovery software.27 Amadeus is also using predictive analytics in order to enhance the personalization of a prospective customer’s digital experience. These technology providers are instrumental in adding to the value proposition of OTAs over their direct booking or offline alternatives.
Beneficiaries of growth in OTA bookings
Experiences
Cruises
www.primeindexes.comPRIME INDEXES | www.primeindexes.com | Travel Tech Industry | 9
Online mobility services are typically segmented by bus, train, car rental, flight and ride-hailing services. At this point, the vast majority of booking for these services is happening through digital channels. Unlike, the travel booking market, mobility services have a cross-over to non-tourist applications. Namely, ride hail-ing services are able to complement the local transportation options available to urban dwellers.
In 2018, the entire digital mobility services category generated $734 billion of rev-enue. The vast majority ($405 billion) of that figure was spent on flights booked online. Ride hailing came in second with $154 billion, car rentals booked online ranked third at $57 billion while trains and buses booked online generated com-bined revenue of about $60 billion.28 On top of being a fairly large industry, the digital mobility service category is projected to grow more than 8% per annum. While all sub-categories of mobility services are projected to grow faster than 3% per annum, the large stand-out, of course, is ride-hailing which grew 20.2% in 2018 and is projected to grow 19.6% in 2019 and ultimately to taper off to an 11.6% growth rate by 2023. These growth rates compound to a doubling in the ride hailing market by 2023 in both ridership and annual revenues.29
The growth in mobility bookings is driven largely by global trends in urbaniza-tion, increased consumer spending, broadband accessibility rates in developing nations and the propensity to travel amongst the growing affluent class. Social networks and social media have promoted and inspired greater travel and to pre-viously un-trafficked destinations.
Source: Statista, Online Mobility Services Report 2019
Air flight is the largest category within mobility services ($405 billion spend in 2018) comprising 60% of the mobility service market. The benefit of booking flights online is fairly straightforward – it is both convenient and timesaving for customers. An online booking avoids the need to pay commissions to a travel agent , allows users to research a wide variety of flight options at their conve-nience and ultimately to book and receive confirmations instantly.
The International Air Transport Association (IATA) estimates that about $812 bil-lion was spent on flights in 2018, implying a market share of 47% for online bookings through an OTA.30 More interestingly, it seems that these bookings are
Overview
Flights
Mobility Services
Global Online Mobility Services Revenue Forecast
(Million U.S. Dollars)
2018 2019 2020 2021 2022 2023
Flights Ride Hailing TrainsCar Rentals Buses
57.3
153.6
48.910.7
405.6
59.5
183.7
52.711.1
427.5
61.7
216.8
57.111.6
451.5
63.8
251.3
61.512.0
477.5
65.8
285.6
65.512.5
504.7
67.5
318.8
68.912.9
532.2
676.0734.5
798.8866.1
934.01,000.2
+8.2%
www.primeindexes.comPRIME INDEXES | www.primeindexes.com | Travel Tech Industry | 10
skewed towards larger purchases as only 30% of the volume of airline bookings are made through an OTA.31 This share will naturally go up with increased broad-band, mobile phone and digital payments usage across all demographics.
Unlike hotels, the commissions at stake are at a more modest level of 3-4%.32 Airlines are already operating on extremely thin margins and can barely afford to pay those commissions on top of the $12/round trip global distribution fees (GDS) assessed by the infrastructure providers. In response, several airlines have pulled some of their listings from OTAs. For example, in 2013, Delta removed its flights from OTAs and metasearch sites and American Airlines did the same from Orbitz and Expedia over a dispute regarding GDS fees.33
Ultimately, history shows that airline-OTA agreements get renegotiated and car-riers return to OTA platforms, as both Delta and American flights are included on the Orbitz and Expedia sites today. As recently as September of 2019, United Airlines and Expedia announced that they signed a new multi-year agreement shortly after Expedia filed a lawsuit against United in April of 2019.34 The quick turn-around between conflict and resolutions suggests that everyone is incentiv-ized in maintaining this mutually beneficial eco-system.
In China, OTAs are even more dominant with a 78% market share in flight book-ings as these platforms are much more in tune to providing a seamless checkout process on mobile phones - the preferred channel of digital consumption in Chi-na. However, like in the US, major Chinese airlines have boycotted platforms like Qunar. Boycotts like these have been largely unsuccessful as platforms like Ctrip continue to invest in their mobile platform’s ease of use. This is good news for the travel tech market, as the vast majority of the 5.6% expected growth rate in OTA booking over the next five years will be driven by China.
As discussed earlier, the ride hailing market will experience rapid growth rates in the next five years that will more than double the addressable market both in terms of users and revenue. Currently, at $154 billion, ride hailing accounts for 23% of the digital mobility market, but will increase to 32% if the ride hailing market doubles as expected. While the digital market share of this category is very high, by definition, the market will grow purely due to demographics and the value proposition of ride hailing services over the alternative of hailing a cab or phoning a car-service. Geographically, by 2023, the vast majority of ride hailing will be in China, as ride hailing is already popular in most Asian urban centers.
Despite the high level of projected revenue growth, two other market forces will conspire to make the segment increasingly profitable - AI and autonomous vehicles. AI can optimize user experiences through automated suggestions and improvements in trip efficiency. Autonomous cars will directly benefit the ride hailing providers through lower costs, as the greatest cost of the service is the driver’s salary. While some of these savings will be absorbed by ride hailing op-erators, lower costs will trickle through the chain, freeing up consumers’ dispos-able income for other higher-margin, discretionary travel-related purchases such as tours and experiences.
Ride hailing and shared mobility services support a wide range of trip lengths. From scooters and bike rentals covering short distances (<5km) to ride hailing services that cover medium distances of 5-15km to car sharing and car rentals that provide access to shared rides of greater distance, this category will give each user the ability to both lower their transportation costs and improve conve-nience. Mobility as a service (MaaS) is the idea of a secular shift away from pri-vate car ownership and involves consolidating all of these transport services into a single platform. The vision is that this single transport platform will provide users a host of transportation options that address all trip lengths and applica-tions. You could see some of this activity is present with Lyft’s partnership with Citi bike in New York, Uber’s promotion of their scooter brand – Jump, indepen-dent scooter operator’s like Neutron holding’s Lime brand and Uber’s recent joint venture with car rental company, Hertz.
Ride hailing and shared mobility
www.primeindexes.comPRIME INDEXES | www.primeindexes.com | Travel Tech Industry | 11
At $57 billion car rental is the third largest category in the mobility space and is expected to grow modestly at 3.3% over the next 5 years. While some of this growth will be curtailed by ride-hailing, car rental remains a very viable option for long distances and provides tremendous optionality to travelers in non-urban settings. Furthermore, growing international tourism is expected to be a tailwind for the industry as an increase in air travel will naturally lead to growth in car rental bookings. The car rental market will remain a staple of the mobility ser-vices market and a boon for OTAs that provide a differentiated car rental booking experience.
New concepts are also transcending frontiers. Recently, there’s been a lot of discussion regarding space tourism. SpaceX has gained considerable recognition by delivering satellites into space at a fraction of the cost achieved by govern-ment-owned launch programs. Jeff Bezos has his own ambitions of colonizing the moon with his self-funded start-up – Blue Origin. Richard Branson’s Virgin Galactic dominated headlines when it raised $1 billion in 2017, and most recently raised several hundred million dollars in a reverse merger utilizing Social Capi-tal’s existing Special Purpose Acquisition Company in July 2019.35 In February, the company completed a mission that sent a passenger into space for the first time. The space tourism provider claims to have collected $80 million in deposits from more than 600 prospective customers who have pre-booked space flights. This is a testament that there’s tremendous pent-up demand for unique experienc-es and new-age mobility services. More importantly, as new mobility services become mainstream, they will likely be added to the suite of offerings amongst existing OTAs and mobility service providers.
The combination of a robust start-up scene and a well-funded venture capital industry will continue to push the boundary of what is possible. A potential in-crease in offerings will satiate consumers with unusual preferences and increase the number of players competing over a traveler’s mobility, accommodation or adventure dollars. Continued funding of new start-ups in the travel & leisure space will continue to oxygenate the travel-tech industry.
The future of mobility
www.primeindexes.comPRIME INDEXES | www.primeindexes.com | Travel Tech Industry | 12
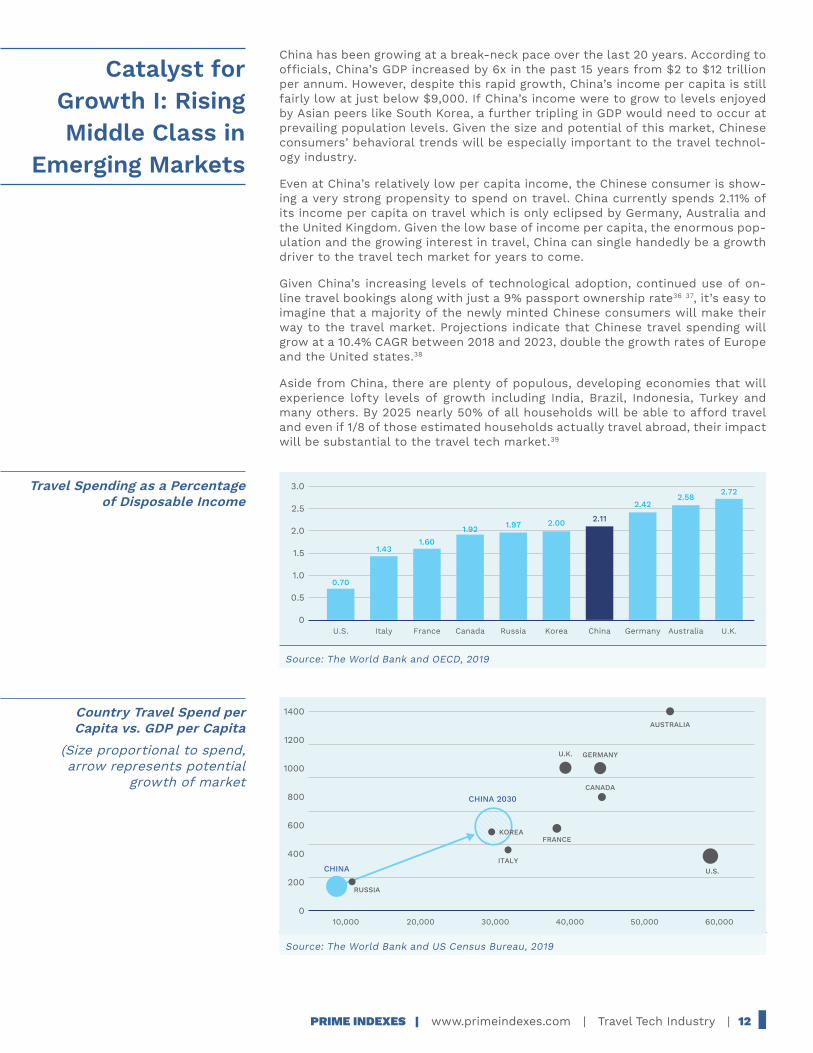
China has been growing at a break-neck pace over the last 20 years. According to officials, China’s GDP increased by 6x in the past 15 years from $2 to $12 trillion per annum. However, despite this rapid growth, China’s income per capita is still fairly low at just below $9,000. If China’s income were to grow to levels enjoyed by Asian peers like South Korea, a further tripling in GDP would need to occur at prevailing population levels. Given the size and potential of this market, Chinese consumers’ behavioral trends will be especially important to the travel technol-ogy industry.
Even at China’s relatively low per capita income, the Chinese consumer is show-ing a very strong propensity to spend on travel. China currently spends 2.11% of its income per capita on travel which is only eclipsed by Germany, Australia and the United Kingdom. Given the low base of income per capita, the enormous pop-ulation and the growing interest in travel, China can single handedly be a growth driver to the travel tech market for years to come.
Given China’s increasing levels of technological adoption, continued use of on-line travel bookings along with just a 9% passport ownership rate36 37, it’s easy to imagine that a majority of the newly minted Chinese consumers will make their way to the travel market. Projections indicate that Chinese travel spending will grow at a 10.4% CAGR between 2018 and 2023, double the growth rates of Europe and the United states.38
Aside from China, there are plenty of populous, developing economies that will experience lofty levels of growth including India, Brazil, Indonesia, Turkey and many others. By 2025 nearly 50% of all households will be able to afford travel and even if 1/8 of those estimated households actually travel abroad, their impact will be substantial to the travel tech market.39
Source: The World Bank and OECD, 2019
Source: The World Bank and US Census Bureau, 2019
Catalyst for Growth I: Rising Middle Class in
Emerging Markets
Travel Spending as a Percentage of Disposable Income
Country Travel Spend per Capita vs. GDP per Capita
(Size proportional to spend, arrow represents potential
growth of market
0
0.5
1.0
1.5
2.0
2.5
3.0
U.S. Italy France Canada Russia Korea China Germany Australia U.K.
0.70
1.431.60
1.92 1.97 2.00
2.422.58
2.72
2.11
0
200
400
600
800
1000
1400
1200
10,000 20,000 30,000 40,000 50,000 60,000
CHINA 2030
CHINA
RUSSIA
ITALY
KOREAFRANCE
U.S.
U.K. GERMANY
AUSTRALIA
CANADA
www.primeindexes.comPRIME INDEXES | www.primeindexes.com | Travel Tech Industry | 13
Travel tech firms utilizes existing technology in order improve the customer expe-rience and drive business to airlines, hotel providers, cruise ships and other travel and mobility providers. Other tech-related offerings have the potential to both grow the travel market and enhance the profitability of travel tech operations. Social media, artificial intelligence and virtual reality can all be used to enhance the convenience of OTA’s existing offerings at a better price.
Social media can be used as a medium for inspiration and information for pro-spective travelers. The influence of content presented by friends and family on social media is very strong as 89% of millennials say they plan their vacations based upon inspirations from social media. Within that same cohort, 97% of re-sponders said they would share photos or videos while on vacation, further ex-tending the chain of influence.
More than anything, social media is likely exacerbating the shift in consumer preference away from material possessions and towards experiences, such as travel to previously under-appreciated destinations. For example, Instagram has single handedly put many places on the travel bucket list, such as the Banff Na-tional Park in Alberta, Canada, Iceland’s Fjaorargljufur Canyon, “The Blue Pearl” of Chefchaouen in Morocco, Cappadocia in Turkey and the ‘figure eight pools’ in Australia’s Royal National Park.40
On the business side, peer-to-peer content is proving to be far more effective than advertising campaigns--the so-called “word-of-mouth” phenomenon. Con-sumers are typically suspicious of advertising but are more likely to trust the posts of their friends and family. If travel service providers embrace social media, they can effectively engage with their customers by quickly reacting to questions and criticisms, thus improving their digital reputations.
Virtual reality (VR) technologies are emerging as another tool of immersive ad-vertising which will allow users to intimately research sights, hotels and tours. Currently, Marriot is using virtual reality tours of their facilities in order to allow travelers to get an immersive view of the rooms, the gym, spas and common spaces.41 Airlines like Virgin Atlantic are using virtual reality to highlight the ad-vantages of first-class offerings by showcasing check-in processes, lounges and first-class cabins.42
Artificial intelligence (AI) is expected to be used to aid customers during the planning and booking process either through chatbots and assistants or through personalization. Customers can use these tools to effectively filter long lists of accommodation, travel and experience options. AI can offer customized travel suggestions based on prior travel destinations, lodging decisions and airline pref-erences. In the case of ride hailing, further breakthroughs in artificial intelligence will directly impact the profitability of ride hailing providers by removing the need for a human driver in the portion of rides deemed suitable for self-driving technology.
Catalyst for Growth II: Tech
Enabled Growth in Travel
www.primeindexes.comPRIME INDEXES | www.primeindexes.com | Travel Tech Industry | 14
$6,802
Millenials
$5,434
Gen X
$6,395
BabyBoomers
Anticipated Total Spend2018 Travel
Spend Comparedto 2017
41% Same12%Low 47% Higher
45% Same10%Low 45% Higher
52% Same11%Low 37% Higher
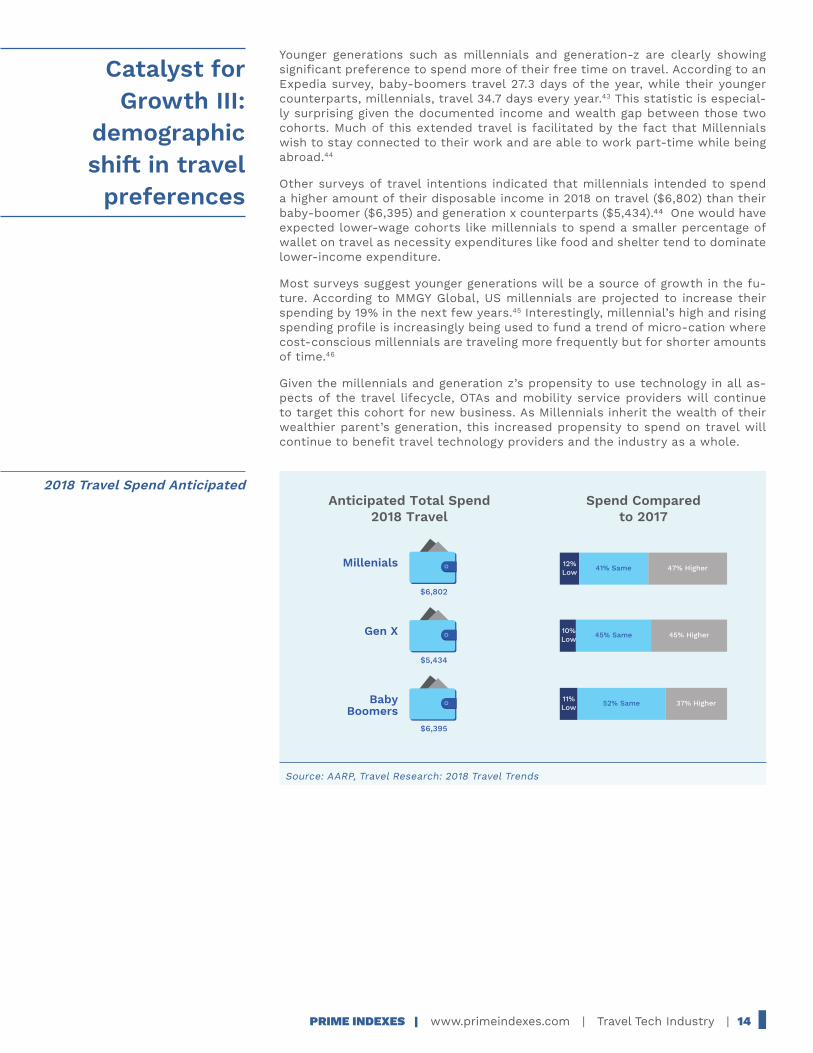
Younger generations such as millennials and generation-z are clearly showing significant preference to spend more of their free time on travel. According to an Expedia survey, baby-boomers travel 27.3 days of the year, while their younger counterparts, millennials, travel 34.7 days every year.43 This statistic is especial-ly surprising given the documented income and wealth gap between those two cohorts. Much of this extended travel is facilitated by the fact that Millennials wish to stay connected to their work and are able to work part-time while being abroad.44
Other surveys of travel intentions indicated that millennials intended to spend a higher amount of their disposable income in 2018 on travel ($6,802) than their baby-boomer ($6,395) and generation x counterparts ($5,434).44 One would have expected lower-wage cohorts like millennials to spend a smaller percentage of wallet on travel as necessity expenditures like food and shelter tend to dominate lower-income expenditure.
Most surveys suggest younger generations will be a source of growth in the fu-ture. According to MMGY Global, US millennials are projected to increase their spending by 19% in the next few years.45 Interestingly, millennial’s high and rising spending profile is increasingly being used to fund a trend of micro-cation where cost-conscious millennials are traveling more frequently but for shorter amounts of time.46
Given the millennials and generation z’s propensity to use technology in all as-pects of the travel lifecycle, OTAs and mobility service providers will continue to target this cohort for new business. As Millennials inherit the wealth of their wealthier parent’s generation, this increased propensity to spend on travel will continue to benefit travel technology providers and the industry as a whole.
Source: AARP, Travel Research: 2018 Travel Trends
2018 Travel Spend Anticipated
Catalyst for Growth III:
demographic shift in travel
preferences
www.primeindexes.comPRIME INDEXES | www.primeindexes.com | Travel Tech Industry | 15
Digital payments are becoming inextricably linked to travel technology. The two criteria that are required for a travel tech enabled booking is access to broad-band and a digital payment method. Without credit cards, debit cards or online checking accounts, it is very difficult to complete a sale on-line. As the global unbanked and under-banked receive necessary financial services, those under-served groups will have the ability to book travel online. In many countries that have historically been under-banked, the massive adoption of digital payments has gone straight to mobile, bypassing the typical adoption curve that saw cus-tomers first book with PCs. For this reason and others, mobile payments will continue to be a fixture of the travel tech industry.
As consumers are increasingly travelling with mobile phones and using them to document their trip and plan the details of their journey, mobile payments seem like a natural beneficiary in an environment where travelers are on-the-go and looking to simplify the purchase process. With travelers already using apps and digital wallets for boarding passes and travel bookings, mobile payment adoption should naturally prosper.
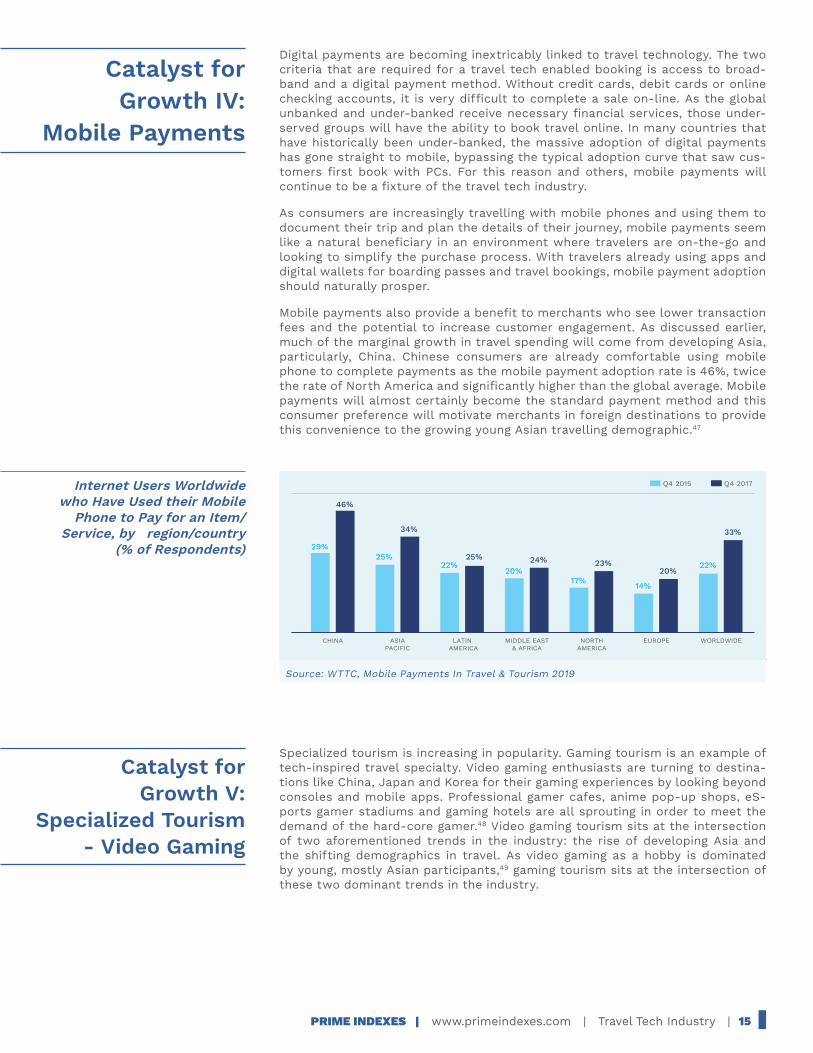
Mobile payments also provide a benefit to merchants who see lower transaction fees and the potential to increase customer engagement. As discussed earlier, much of the marginal growth in travel spending will come from developing Asia, particularly, China. Chinese consumers are already comfortable using mobile phone to complete payments as the mobile payment adoption rate is 46%, twice the rate of North America and significantly higher than the global average. Mobile payments will almost certainly become the standard payment method and this consumer preference will motivate merchants in foreign destinations to provide this convenience to the growing young Asian travelling demographic.47
Source: WTTC, Mobile Payments In Travel & Tourism 2019
Specialized tourism is increasing in popularity. Gaming tourism is an example of tech-inspired travel specialty. Video gaming enthusiasts are turning to destina-tions like China, Japan and Korea for their gaming experiences by looking beyond consoles and mobile apps. Professional gamer cafes, anime pop-up shops, eS-ports gamer stadiums and gaming hotels are all sprouting in order to meet the demand of the hard-core gamer.48 Video gaming tourism sits at the intersection of two aforementioned trends in the industry: the rise of developing Asia and the shifting demographics in travel. As video gaming as a hobby is dominated by young, mostly Asian participants,49 gaming tourism sits at the intersection of these two dominant trends in the industry.
Internet Users Worldwide who Have Used their Mobile
Phone to Pay for an Item/Service, by region/country
(% of Respondents)
Catalyst for Growth IV:
Mobile Payments
Catalyst for Growth V:
Specialized Tourism - Video Gaming
CHINA ASIAPACIFIC
LATIN AMERICA
MIDDLE EAST& AFRICA
WORLDWIDEEUROPENORTHAMERICA
29%
46%
22%25%
20%24%
17%
23%
14%
20%22%
33%
25%
34%
Q4 2015 Q4 2017
www.primeindexes.comPRIME INDEXES | www.primeindexes.com | Travel Tech Industry | 16
The effects of the US-China trade war have been felt on the tourism industry already. According to data, while the overall global travel spend continued to increase in year-over-year, the distribution of travel has shifted slightly, with Chi-nese tourism spending in the US slowing over the past several years. While this shift cannot be solely attributed to the trade war though,50 it has certainly been a major contributor.
The US/China tourism balance, a measure of the net spending of Chinese tourist’s in the US less American spending in China, grew at very rapid rates from 2009 to 2016, growing 7-fold from around $4 billion to $28 billion per annum. But growth decelerated in the past few years.51 Even amidst this decline, China is still the largest contributor to the US’ positive tourism balance with the rest of the world. China runs a $30 billion annual travel deficit with the US, more than twice the amount of the next country in the list – Canada.52
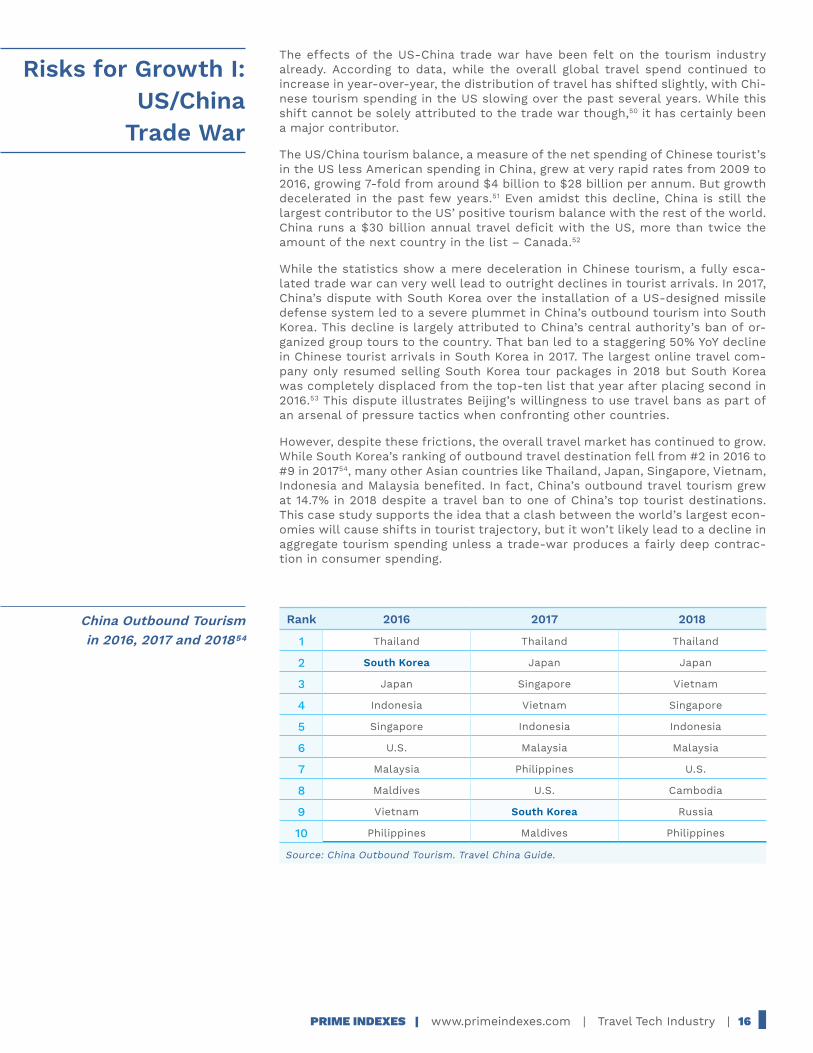
While the statistics show a mere deceleration in Chinese tourism, a fully esca-lated trade war can very well lead to outright declines in tourist arrivals. In 2017, China’s dispute with South Korea over the installation of a US-designed missile defense system led to a severe plummet in China’s outbound tourism into South Korea. This decline is largely attributed to China’s central authority’s ban of or-ganized group tours to the country. That ban led to a staggering 50% YoY decline in Chinese tourist arrivals in South Korea in 2017. The largest online travel com-pany only resumed selling South Korea tour packages in 2018 but South Korea was completely displaced from the top-ten list that year after placing second in 2016.53 This dispute illustrates Beijing’s willingness to use travel bans as part of an arsenal of pressure tactics when confronting other countries.
However, despite these frictions, the overall travel market has continued to grow. While South Korea’s ranking of outbound travel destination fell from #2 in 2016 to #9 in 201754, many other Asian countries like Thailand, Japan, Singapore, Vietnam, Indonesia and Malaysia benefited. In fact, China’s outbound travel tourism grew at 14.7% in 2018 despite a travel ban to one of China’s top tourist destinations. This case study supports the idea that a clash between the world’s largest econ-omies will cause shifts in tourist trajectory, but it won’t likely lead to a decline in aggregate tourism spending unless a trade-war produces a fairly deep contrac-tion in consumer spending.
Rank 2016 2017 2018
1 Thailand Thailand Thailand
2 South Korea Japan Japan
3 Japan Singapore Vietnam
4 Indonesia Vietnam Singapore
5 Singapore Indonesia Indonesia
6 U.S. Malaysia Malaysia
7 Malaysia Philippines U.S.
8 Maldives U.S. Cambodia
9 Vietnam South Korea Russia
10 Philippines Maldives Philippines
Source: China Outbound Tourism. Travel China Guide.
Risks for Growth I: US/China
Trade War
China Outbound Tourism in 2016, 2017 and 201854
www.primeindexes.comPRIME INDEXES | www.primeindexes.com | Travel Tech Industry | 17
Sustainable tourism is becoming top of mind for an increasingly environmentally conscious consumer base. Airlines have proposed ways to lower their carbon footprint, such as Virgin Group’s Richard Branson’s proposal to cut emission 25% by minimizing engine use on the tarmac, changing the timing of descent and switching to lighter aircraft materials.55 While many of these measures are still hypothetical to this day, there is mounting pressure among climate change activ-ists to make them a reality. In 2019, the “flight shame” movement in Europe has captured the attention of a broader consumer audience, as well as travel industry officials and politicians. This is expected to lead to more anti-flight activism, which could spur airlines to implement operational changes or technological en-hancements to reduce their carbon emissions.56 If such movements take hold in the U.S., the potential risk to airlines is that consumers may change their travel preferences.
Many ‘better practices’ have been espoused to reduce carbon emissions and environmental impact. Some of those include: taking trains over planes, reduc-ing the use of plastic, avoiding over-crowded destinations, supporting the local economy, carbon-offsetting and banning the purchase and sale of wildlife prod-ucts.57 Most of the efforts have been geared towards changing behaviors and few have called for a reduction in travel. In fact there has been a shift towards eco-tourism which can both incentivize communities to protect the eco-system and connect an adventurer to the areas that are most vulnerable to environmen-tal harm.58 Aside from environmental impact, there has been an increased trend of volunteer-related travel to help vulnerable communities abroad.
Consumers have coalesced around the idea of carbon offsetting as a way to deal with the carbon footprint of travel. Multiple apps and tools are available for eco-conscious travelers to both measure and offset their carbon footprints. This voluntary approach appeases the eco-conscious travelers while maintaining the cost accessibility of air travel to the average consumer.
The flipside of mobile phone use while travelling is the threat of cyber-crime. Travelers possess highly valuable information that potential hackers can mone-tize. This includes their travel documents, payment information and their detailed travel plans. A potential hacker can use this information to successfully steal identities, to perform ‘phishing attacks’ or to sell customer information such as passwords and payment details on the internet.
Travelers also become a vulnerable, easy target for cyber-criminals as they con-nect to insecure WiFi connections, use public charging stations or enable au-to-connect on their devices. Typical behaviors during travel expose users to a much higher extent than technology practices at home. According to a 2019 IBM X-Force Threat Intelligence index, the transportation industry has become a key target for cybercriminals, attracting 13% of attacks.59 The number of attacks grew tremendously in the past two years as the transport industry has catapulted to the second-most vulnerable from number 10 in 2017. Cyber-security firms will be beneficiaries as the increased propensity to travel will naturally lead to a higher volume of exposed individuals and greater amount of exposed data.60
Risks for Growth II:
Sustainable Tourism
Risks for Growth III:
Cyber Security
www.primeindexes.comPRIME INDEXES | www.primeindexes.com | Travel Tech Industry | 18
The online travel and mobility services market will continue to thrive as a result of a few broad themes: the high growth in travel spending globally, a rising middle class in the developing world, increased access to broadband connectivity and eCommerce. All of these have been a boon for Online Travel Agencies, their in-frastructure providers and Mobility-as-a-Service companies. Their existing value proposition over their offline counterparts is extremely compelling for both the consumer and the provider. Booking travel via human interaction is a thing of the past. An obvious example of this was the compulsory liquidation of Thomas Cook in 2019, the UK based airline carrier, tour operator & offline travel agent.61
While the present is bright, the future for travel technology looks even brighter. Continued development in artificial intelligence, virtual reality, mobile payments, broadband accessibility, self-driving cars and social-network interaction will continue to support the industry through travel inspiration, immersive experi-ences and cost-reduction. The travel tech market will benefit by being at the in-tersection of many of these trends. Although trade disputes, cybersecurity fears, and climate change activism pose industry growth risks, they are unlikely to de-rail the overall theme; rather, they will change consumer habits and preferences. In the end, travel tech has made the world a lot smaller, where no destination is too remote and where booking a trip has become cheaper, easier, and faster for the online consumer.
Conclusion
www.primeindexes.comPRIME INDEXES | www.primeindexes.com | Travel Tech Industry | 19
1 WTTC. World Travel & Tourism Council Read more at: https://www.wttc.org/ Copy-right @ WTTC 2019. WTTC. [Online] 2019. https://www.wttc.org.
2 UNWTO. 2017 International Tourism Results: the highest in seven years . UNWTO. [Online] January 15, 2018. http://media.unwto.org/press-release/2018-01-15/2017-interna-tional-tourism-results-highest-seven-years.
3 Statista. eTravel. Statista. [Online] https://static2.statista.com/statistics/298060/contribution-of-travel-and-tourism-to-the-global-economy-by-type-of-spending/.
4 Online Travel Booking Report 2019. Berlin : Statista, 2019.
5 adbrands. Booking Holdings : advertising & marketing assignments . adbrands. [On-line] https://www.adbrands.net/us/booking_us.htm
6 Prieto, Mauricio. The State of Online Travel Agencies - 2019 . Medium. [Online] March 27, 2019. https://medium.com/traveltechmedia/the-state-of-online-travel-agencies-2019-8b188e8661ac.
7 Statista. Online Travel Booking Report 2019. s.l. : Statista, 2019.
8 TUI Group. 2018 annual report of the TUI group. s.l. : TUI Group, 2018.
9 Capital Panel. Advantage of online vs. offline bookings . CaptainPaneld. [Online] https://www.captainpanel.com/blog/online-vs-offline-bookings/.
10 Merlino, Diane. Changes in consumer booking patterns reshape distribution strat-egies for hoteliers. phocuswire.com. [Online] March 18, 2019. https://www.phocuswire.com/Consumer-booking-patterns-hotel-distribution.
11 Feinsein, Eran. OTA’s vs. direct hotel bookings: Which is the leading trend for 2018? . traveldailynews.com. [Online] February 23, 2018. https://www.traveldailynews.com/post/otas-vs-direct-hotel-bookings-which-is-the-leading-trend-for-2018.
12 Watanabe, Neil. The decline of customer loyalty—and what the travel industry can do about it. Vision Critical. [Online] April 27, 2019. https://www.visioncritical.com/blog/decline-customer-loyalty-travel-industry.
13 Prieto, Mauricio. Online Hotel Bookings: Hotel Direct vs OTA. Medium. [Online] De-cember 26, 2017. https://medium.com/traveltechmedia/online-hotel-bookings-hotel-di-rect-vs-ota-cdbd8bfd3f7.
14 Trivago Business Blog. What’s Happening with Rate Parity in the Hotel Industry? businessblog.trivago.com. [Online] March 14, 2019. https://businessblog.trivago.com/rate-parity-hotel-industry-status/.
15 Forum. What is the average profit margin of running a hotel? . Quora. [Online] Jun 27, 2017. https://www.quora.com/What-is-the-average-profit-margin-of-running-a-hotel.
16 TripAdvisor. 5 Tips Inspired by Our New Traveler Survey . TripAdvisor.com. [Online] November 12, 2015. https://www.tripadvisor.com/TripAdvisorInsights/w661.
17 Valle, Gaby Del. A federal judge blocked New York’s latest attempt to crack down on Airbnb . Vox. [Online] Vox, Jan 10, 2019. https://www.vox.com/the-goods/2019/1/9/18174095/airbnb-lawsuit-new-york-city.
18 Statista. Global Consumer Survey. s.l. : Statista, 2019.
19 tripping. The Ideal Vacation Rental Home for Millennials, Boomers and Beyond . trip-ping.com. [Online] June 2, 2016. https://www.tripping.com/industry/trends/insights-from-the-home-depot-and-trippingcom-survey.
20 Trend Hunter. Trend-Report-2019. TrendHunterStatic.com. [Online] 2019. https://cdn.trendhunterstatic.com/r/trend-report-2019.pdf?inf_contact_key=d2454833dd1213be165b-d9c640d3e6d716358d5485884e2f31e6019a0d26c8b0.
21 EventBrite. Millenials: Fueling the Experience Economy. Eventbrite. [Online] 2014. https://eventbrite-s3.s3.amazonaws.com/marketing/Millennials_Research/Gen_PR_Final.pdf.
22 Meghan Carty + Skift Research. U.S. Affluent Traveler Trends 2018: Annual Survey on Travel Behavoir. s.l. : Skift Research, 2018.
References
www.primeindexes.comPRIME INDEXES | www.primeindexes.com | Travel Tech Industry | 20
23 CLIA. CLIA Cruise Travel Report. cruising.org. [Online] January 2018. https://cruising.org/-/media/research-updates/research/consumer-research/2018-clia-travel-report.pdf.
24 D'Ambrosio, Richard. Travel Agents Continue to Dominate Cruise and Tour Sales . travelmarketreport.com. [Online] March 29, 2018. https://www.travelmarketreport.com/articles/Travel-Agents-Continue-to-Dominate-Cruise-and-Tour-Sales.
25 Sorrells, Mitra. New online booking site facilitates one-way cruise travel . pho-cuswire.com. [Online] September 18, 2018. https://www.phocuswire.com/CruiseWire-OTA-one-way-cruises.
26 Wikipedia. Sabre Corporation. wikipedia.org. [Online] October 3, 2019. https://en.wikipedia.org/wiki/Sabre_Corporation.
27 MIT Technology Review Insights. The Travel Ecosystem: An Industry on the Go . technologyreview.com. [Online] February 23, 2018.
28 Statista. Online Mobility Services Report 2019. s.l. : Statista, 2019.
29 Ride Hailing. Statista. [Online] 2019. https://www.statista.com/outlook/368/100/ride-hailing/worldwide.
30 IATA. Industry Statistics: Fact Sheet. IATA.org. [Online] June 2019. https://www.iata.org/pressroom/facts_figures/fact_sheets/Documents/fact-sheet-industry-facts.pdf.
31 Atmosphere Research Group. The Future of Airline Distribution. s.l. : IATA, 2016.
32 Economist. The world’s largest online-travel company . economist.com. [Online] June 29, 2017. https://www.economist.com/business/2017/07/29/the-worlds-largest-on-line-travel-company.
33 D'Souza, Ryan. The Relationship Between Airlines and Online Travel Agencies (OTAs). yieldr.com. [Online] 2019. https://blog.yieldr.com/the-relationship-between-air-lines-and-online-travel-agencies/.
34 Park, Michael Y. United and Expedia end their feud and form a new agreement . thepointsguy.com. [Online] September 16, 2019. https://thepointsguy.com/news/united-and-expedia-end-their-feud-and-form-a-new-agreement/.
35 Virgin Galactic. Virgin Galactic and Social Capital Hedosophia Announce Merg-er to Create the World's First and Only Publicly Traded Commercial Human Space-flight Company . Virgin Galactic. [Online] July 15, 2019. https://www.virgingalactic.com/articles/virgin-galactic-and-social-capital-hedosophia-announce-merger-to-cre-ate-the-worlds-first-and-only-publicly-traded-commercial-human-spaceflight-compa-ny/.
36 Smith, Oliver. The unstoppable rise of the Chinese traveller – where are they going and what does it mean for overtourism? . Telegraph. [Online] July 2, 2019. https://www.telegraph.co.uk/travel/comment/rise-of-the-chinese-tourist/.
37 Goldman Sachs: Sho Kawano, Joshua Lu, Ricky Tsang, Jingyuan Liu. The Chinese Tourist Boom. s.l. : Goldman Sachs, 2015.
38 Statista. Online Travel Market. s.l. : Statista, 2016.
39 VISA. Mapping the Futue of Global Travel and Tourism. s.l. : VISA, 2014.
40 Cranley, Ellen. 11 places that Instagram made famous . Insider. [Online] Aug 3, 2019. https://www.insider.com/instagram-travel-tourists-popular-places-nature-cit-ies-2019-8#pig-beach-bahamas-10.
41 Marriott. Marriott Hotels Introduces The First Ever In-Room Virtual Reality Travel Ex-perience . Marriott.com. [Online] September 9, 2017. https://news.marriott.com/2015/09/marriott-hotels-introduces-the-first-ever-in-room-virtual-reality-travel-experience/.
42 Jordan Yerman. Upper-Class Immersion: Virgin Atlantic’s Virtual Reality Sales Pitch. apex.aero. [Online] November 23, 2015. https://apex.aero/2015/11/19/virgin-atlantic-virtu-al-reality.
43 Expedia Group Media Solutions. American Multi-Generational Travel Trend. expedia group. [Online] April 7, 2017. https://info.advertising.expedia.com/hubfs/Content_Docs/Rebrand-2018/American_Multi-Generational_Travel_Trends.pdf?hsCtaTracking=582427c6-6360-4001-a435-49397e2d696a%7Cd94ea98b-e615-4e97-804d-8b2969ea32de.
44 Gelfeld, Vicki. Travel Research: 2018 Travel Trends. AARP. [Online] AARP, Novem-ber 2017. https://www.aarp.org/content/dam/aarp/research/surveys_statistics/life-lei-sure/2017/2018-travel-trends.doi.10.26419%252Fres.00179.001.pdf.
www.primeindexes.comPRIME INDEXES | www.primeindexes.com | Travel Tech Industry | 21
45 MMGY Global. Stats: Millennials To Travel 35 Percent More In 2017, According To MMGY . travelagentcentral.com. [Online] June 29, 2017. https://www.travelagentcentral.com/running-your-business/stats-millennials-to-travel-35-percent-more-2017-accord-ing-to-mmgy.
46 Allianz Partners. 2019 Vacation Confidence INdex. s.l. : Allianz World Partners, 2019.
47 Prime Indexes. Mobily Payments Industry Overview.
48 Trend Hunter. Gamer Tourism . Trend Hunter. [Online] https://www.trendhunter.com/protrends/gamer-tourism.
49 Gough, Christina. Games market revenue worldwide from 2015 to 2018, by region (in billion U.S. dollars) . Statista. [Online] Statista, May 8, 2018. https://www.statista.com/statistics/539572/games-market-revenue-by-region/.
50 Smith, Ernie. INTERNATIONAL TRAVEL ON THE DECLINE, U.S. TRAVEL WARNS. asso-ciationsnow.com. [Online] August 13, 2019. https://associationsnow.com/2019/08/interna-tional-travel-on-the-downswing-u-s-travel-warns/.
51 Feldman, Sarah. Chinese-U.S. Tourism Flatlines. Statista. [Online] May 29, 2019. https://www.statista.com/chart/18212/us-chinese-tourism/.
52 U.S. Travel Assocation. Reducing The Trade Defiict by Growing International Travel. ustravel.org. [Online] march 2019. https://www.ustravel.org/system/files/media_root/document/Research_Fact-Sheet_Travel_and_Trade.pdf.
53 Zhour, Laura. Promises, promises ... but still no end to China's ban on grup tours to South Korea. South China Morning Post. [Online] December 20, 2017. https://www.scmp.com/news/china/diplomacy-defence/article/2125018/china-bans-group-tours-south-ko-rea-once-again-says.
54 Travel China Guide. China Inbound Tourism in 2017. Travel China Guide. [Online] May 29, 2019. https://www.travelchinaguide.com/tourism/2017statistics/inbound.htm.
55 Clark, Aaron. Global Warming and the Traveler's World . Travel & Leisure. [Online] January 24, 2017. https://www.travelandleisure.com/articles/global-warming-and-the-travelers-world.
56 Irfan, Umair. Air travel is a huge contributor to climate change. A new global move-ment wants you to be ashamed to fly. Vox.com. [Online] September 27, 2019. https://www.vox.com/the-highlight/2019/7/25/8881364/greta-thunberg-climate-change-fly-ing-airline.
57 McKibben, Bill. Global Warming and the Traveler's World . travel and leisure. [Online] Jan 24, 2017. https://www.travelandleisure.com/articles/global-warming-and-the-travel-ers-world.
58 Flint, Jessica. Travel will change for the better this year—here’s how. National Geo-graphic. [Online] January 3, 2019. https://www.nationalgeographic.com/travel/lists/top-travel-trends-this-year/.
59 IBM. IBM Security: Cybersecurity Threats Growing In Travel and Transportation Industries. www.prnewswire.com. [Online] May 21, 2019. https://www.prnewswire.com/news-releases/ibm-security-cybersecurity-threats-growing-in-travel-and-transporta-tion-industries-300853653.html.
60 Prime Indexes. The Cyber Defense Index: A Primer.
61 Perez, Luca Casiraghi and Irene Garcia. Thomas Cook's Liquidation Step by Step And What Happens Next. bloomberg.com. [Online] September 23, 2019. https://www.bloomberg.com/news/articles/2019-09-23/thomas-cook-s-liquidation-step-by-step-and-what-happens-next.

www.primeindexes.com