Embed Size (px)
Citation preview
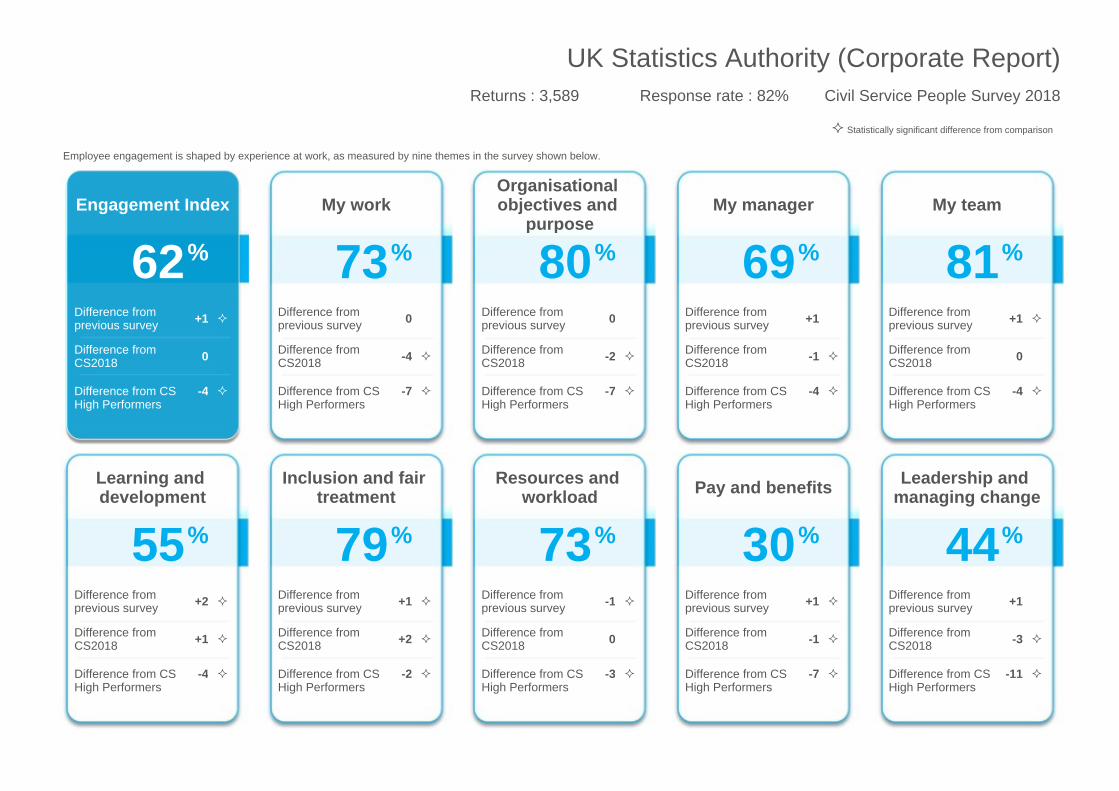
Engagement Index
62%
Difference from previous survey +1
Difference from CS2018 0
Difference from CS High Performers
-4
My work
73%
Difference from previous survey 0
Difference from CS2018 -4
Difference from CS High Performers
-7
Organisational objectives and
purpose
80%
Difference from previous survey 0
Difference from CS2018 -2
Difference from CS High Performers
-7
My manager
69%
Difference from previous survey +1
Difference from CS2018 -1
Difference from CS High Performers
-4
My team
81%
Difference from previous survey +1
Difference from CS2018 0
Difference from CS High Performers
-4
Learning and development
55%
Difference from previous survey +2
Difference from CS2018 +1
Difference from CS High Performers
-4
Inclusion and fair treatment
79%
Difference from previous survey +1
Difference from CS2018 +2
Difference from CS High Performers
-2
Resources and workload
73%
Difference from previous survey -1
Difference from CS2018 0
Difference from CS High Performers
-3
Pay and benefits
30%
Difference from previous survey +1
Difference from CS2018 -1
Difference from CS High Performers
-7
Leadership and managing change
44%
Difference from previous survey +1
Difference from CS2018 -3
Difference from CS High Performers
-11
Statistically significant difference from comparison
Employee engagement is shaped by experience at work, as measured by nine themes in the survey shown below.
UK Statistics Authority (Corporate Report)Civil Service People Survey 2018Returns : 3,589 Response rate : 82%
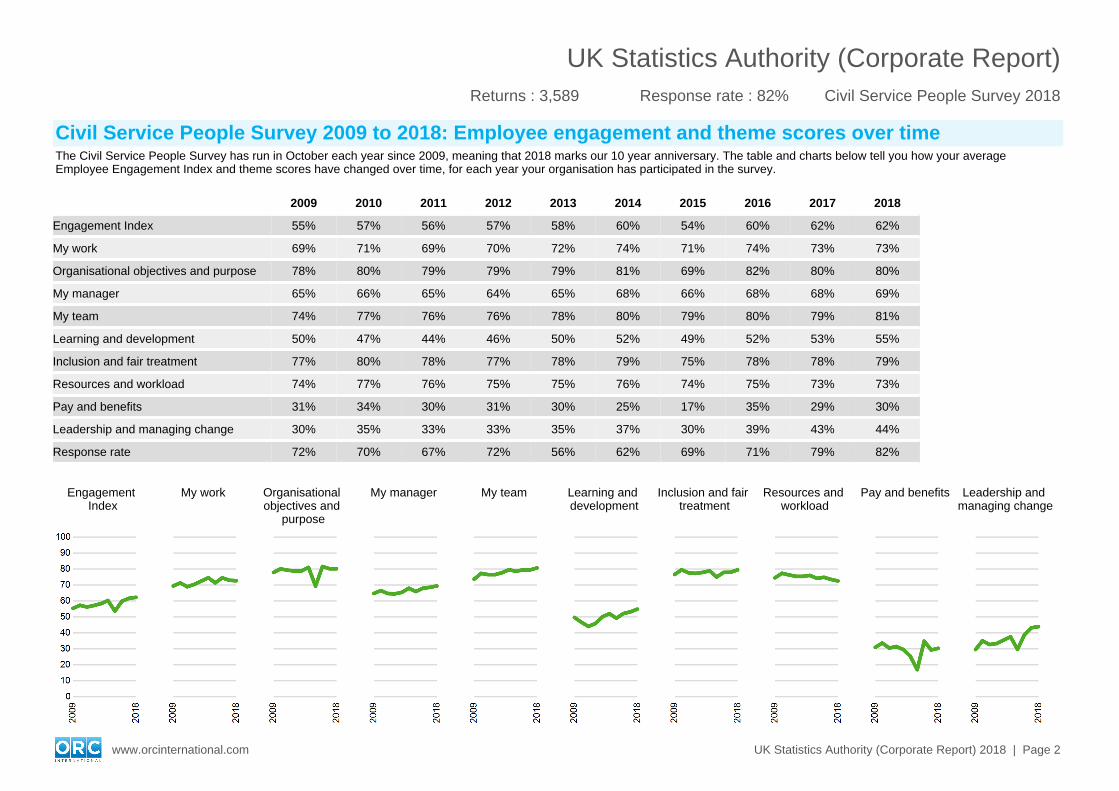
Civil Service People Survey 2009 to 2018: Employee engagement and theme scores over timeThe Civil Service People Survey has run in October each year since 2009, meaning that 2018 marks our 10 year anniversary. The table and charts below tell you how your average Employee Engagement Index and theme scores have changed over time, for each year your organisation has participated in the survey.
2009 2010 2011 2012 2013 2014 2015 2016 2017 2018
Engagement Index 55% 57% 56% 57% 58% 60% 54% 60% 62% 62%
My work 69% 71% 69% 70% 72% 74% 71% 74% 73% 73%
Organisational objectives and purpose 78% 80% 79% 79% 79% 81% 69% 82% 80% 80%
My manager 65% 66% 65% 64% 65% 68% 66% 68% 68% 69%
My team 74% 77% 76% 76% 78% 80% 79% 80% 79% 81%
Learning and development 50% 47% 44% 46% 50% 52% 49% 52% 53% 55%
Inclusion and fair treatment 77% 80% 78% 77% 78% 79% 75% 78% 78% 79%
Resources and workload 74% 77% 76% 75% 75% 76% 74% 75% 73% 73%
Pay and benefits 31% 34% 30% 31% 30% 25% 17% 35% 29% 30%
Leadership and managing change 30% 35% 33% 33% 35% 37% 30% 39% 43% 44%
Response rate 72% 70% 67% 72% 56% 62% 69% 71% 79% 82%
Engagement Index
My work Organisational objectives and
purpose
My manager My team Learning and development
Inclusion and fair treatment
Resources and workload
Pay and benefits Leadership and managing change
www.orcinternational.com UK Statistics Authority (Corporate Report) 2018 | Page 2
UK Statistics Authority (Corporate Report)Civil Service People Survey 2018Returns : 3,589 Response rate : 82%
Statistically significant difference from comparison
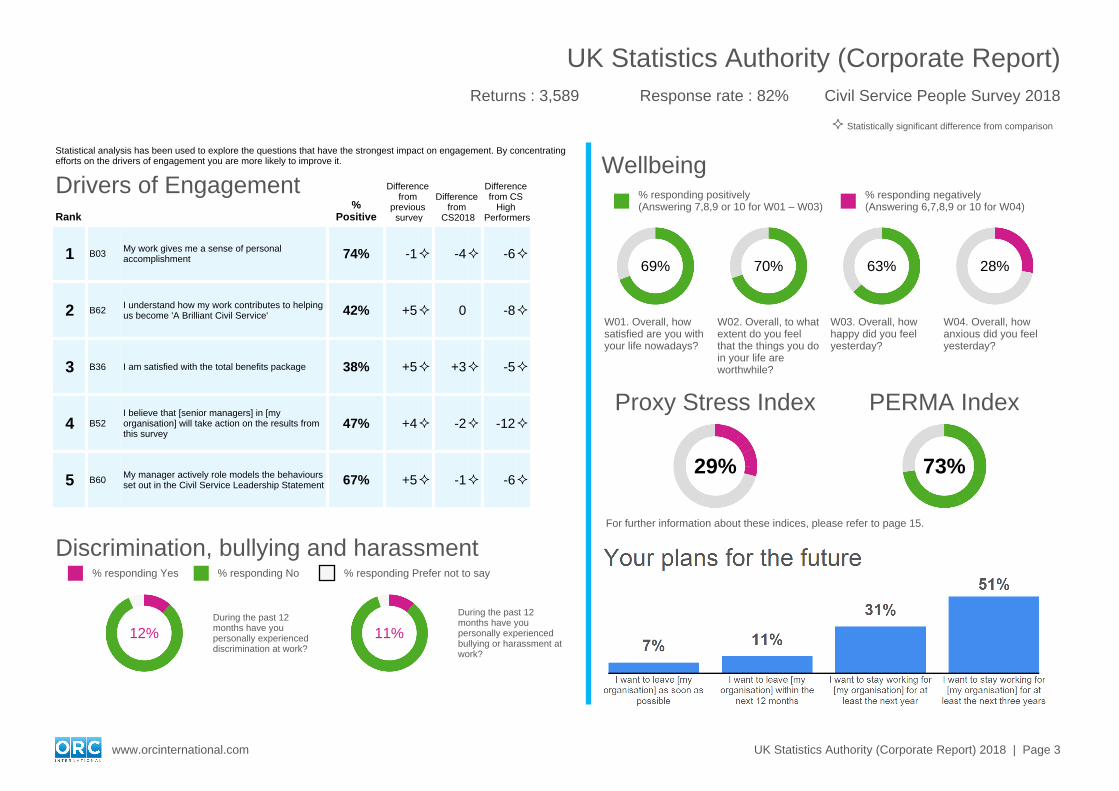
69% 70% 63% 28%
W01. Overall, how satisfied are you with your life nowadays?
W02. Overall, to what extent do you feel that the things you do in your life are worthwhile?
W03. Overall, how happy did you feel yesterday?
W04. Overall, how anxious did you feel yesterday?
Wellbeing% responding positively(Answering 7,8,9 or 10 for W01 – W03)
Proxy Stress Index PERMA Index
29% 73%
For further information about these indices, please refer to page 15.
% responding negatively(Answering 6,7,8,9 or 10 for W04)
Statistical analysis has been used to explore the questions that have the strongest impact on engagement. By concentrating efforts on the drivers of engagement you are more likely to improve it.
Drivers of EngagementRank
%Positive
Difference from
previous survey
Difference from
CS2018
Difference from CS
High Performers
1 B03 My work gives me a sense of personal accomplishment 74% -1 -4 -6
2 B62 I understand how my work contributes to helping us become 'A Brilliant Civil Service' 42% +5 0 -8
3 B36 I am satisfied with the total benefits package 38% +5 +3 -5
4 B52I believe that [senior managers] in [my organisation] will take action on the results from this survey
47% +4 -2 -12
5 B60 My manager actively role models the behaviours set out in the Civil Service Leadership Statement 67% +5 -1 -6
Discrimination, bullying and harassment% responding Yes
12%During the past 12 months have you personally experienced discrimination at work?
11%
During the past 12 months have you personally experienced bullying or harassment at work?
% responding No % responding Prefer not to say
www.orcinternational.com UK Statistics Authority (Corporate Report) 2018 | Page 3
UK Statistics Authority (Corporate Report)Civil Service People Survey 2018Returns : 3,589 Response rate : 82%
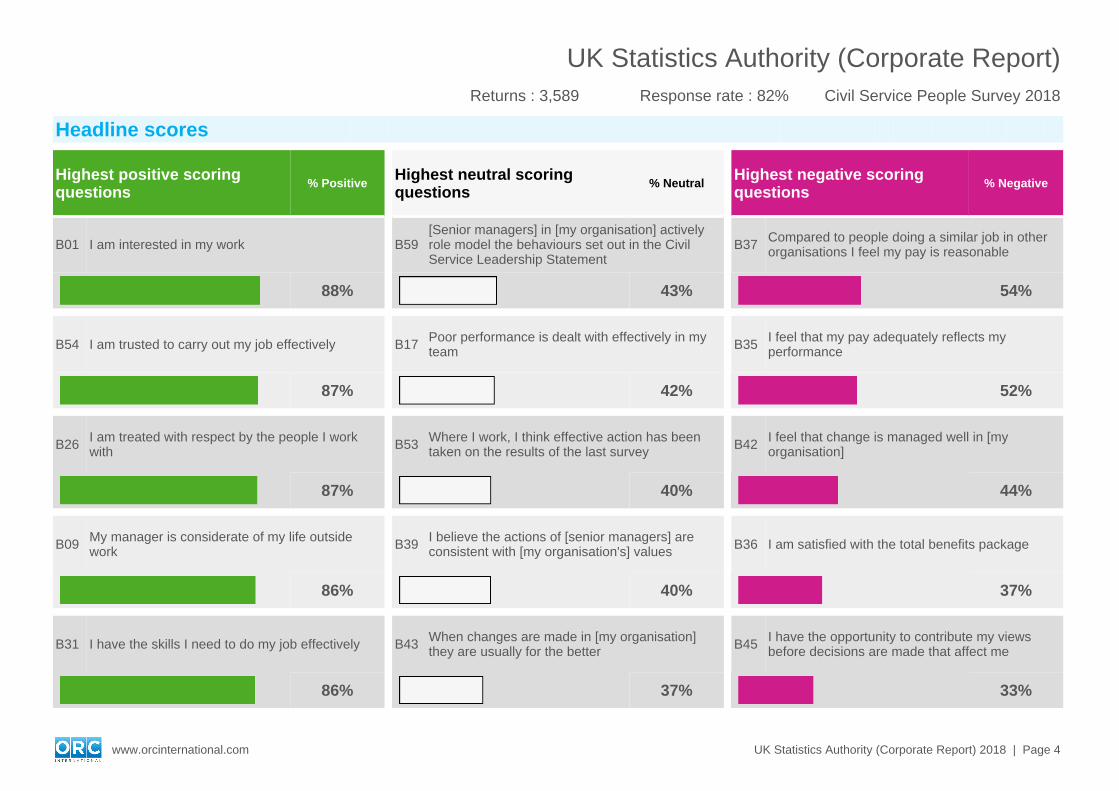
Headline scores
Highest positive scoring questions
% Positive
B01 I am interested in my work
88%
B54 I am trusted to carry out my job effectively
87%
B26 I am treated with respect by the people I work with
87%
B09 My manager is considerate of my life outside work
86%
B31 I have the skills I need to do my job effectively
86%
Highest neutral scoring questions
% Neutral
B59[Senior managers] in [my organisation] actively role model the behaviours set out in the Civil Service Leadership Statement
43%
B17 Poor performance is dealt with effectively in my team
42%
B53 Where I work, I think effective action has been taken on the results of the last survey
40%
B39 I believe the actions of [senior managers] are consistent with [my organisation's] values
40%
B43 When changes are made in [my organisation] they are usually for the better
37%
Highest negative scoring questions
% Negative
B37 Compared to people doing a similar job in other organisations I feel my pay is reasonable
54%
B35 I feel that my pay adequately reflects my performance
52%
B42 I feel that change is managed well in [my organisation]
44%
B36 I am satisfied with the total benefits package
37%
B45 I have the opportunity to contribute my views before decisions are made that affect me
33%
www.orcinternational.com UK Statistics Authority (Corporate Report) 2018 | Page 4
UK Statistics Authority (Corporate Report)Civil Service People Survey 2018Returns : 3,589 Response rate : 82%
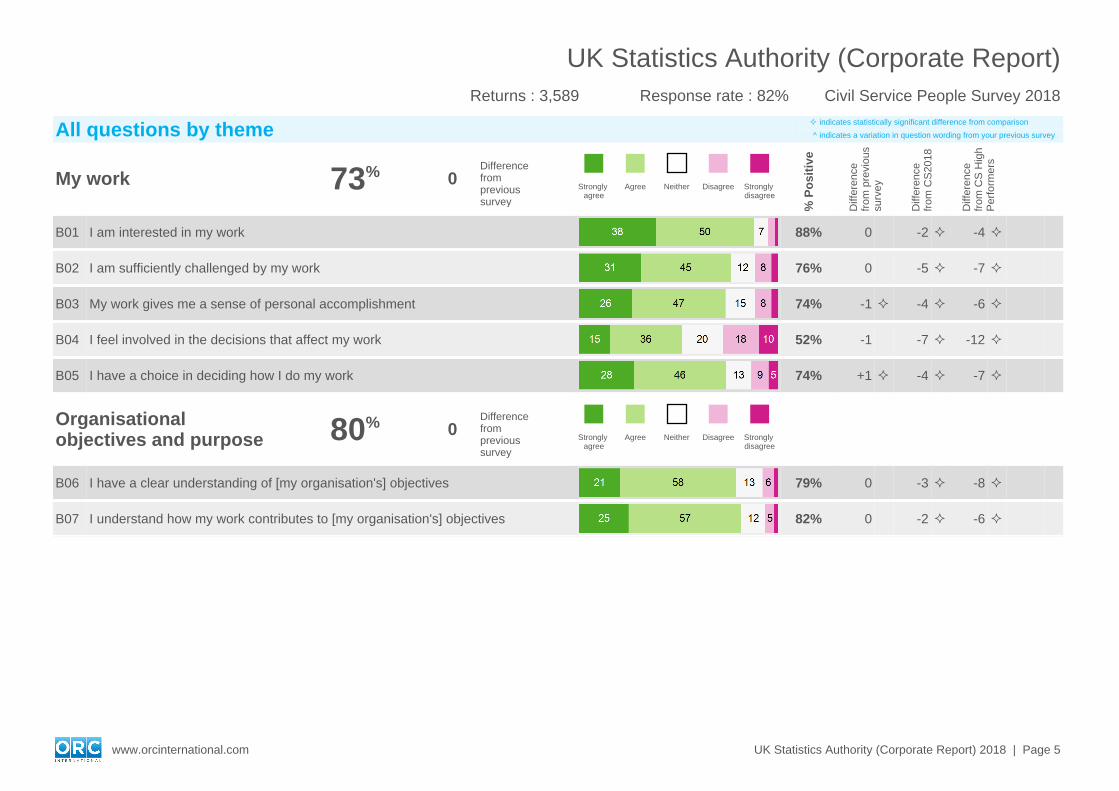
All questions by theme indicates statistically significant difference from comparison
^ indicates a variation in question wording from your previous survey
My work 73% 0Difference from previous survey
Strongly agree
Agree Neither Disagree Strongly disagree
% P
osi
tive
Diff
eren
ce
from
pre
viou
s su
rvey
Diff
eren
ce
from
CS
2018
Diff
eren
ce
from
CS
Hig
h P
erfo
rmer
s
B01 I am interested in my work 88% 0 -2 -4
B02 I am sufficiently challenged by my work 76% 0 -5 -7
B03 My work gives me a sense of personal accomplishment 74% -1 -4 -6
B04 I feel involved in the decisions that affect my work 52% -1 -7 -12
B05 I have a choice in deciding how I do my work 74% +1 -4 -7
Organisational objectives and purpose 80% 0
Difference from previous survey
Strongly agree
Agree Neither Disagree Strongly disagree
B06 I have a clear understanding of [my organisation's] objectives 79% 0 -3 -8
B07 I understand how my work contributes to [my organisation's] objectives 82% 0 -2 -6
www.orcinternational.com UK Statistics Authority (Corporate Report) 2018 | Page 5
UK Statistics Authority (Corporate Report)Civil Service People Survey 2018Returns : 3,589 Response rate : 82%
All questions by theme indicates statistically significant difference from comparison
^ indicates a variation in question wording from your previous survey
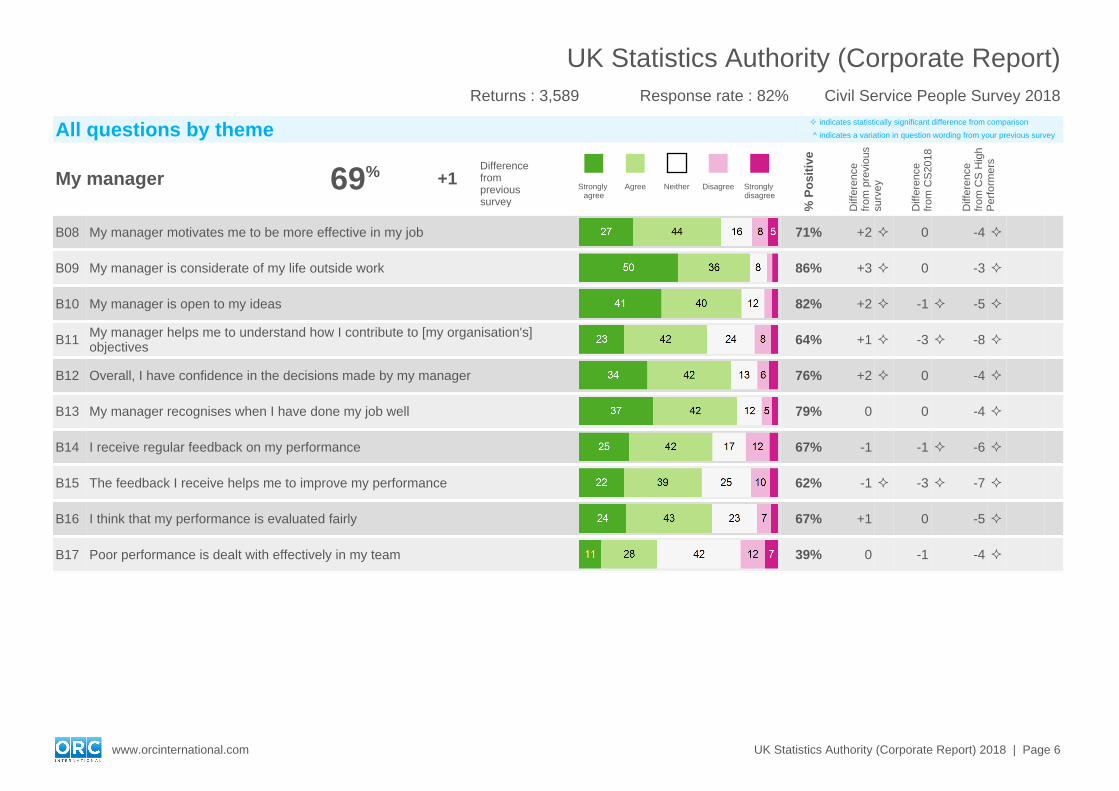
My manager 69% +1Difference from previous survey
Strongly agree
Agree Neither Disagree Strongly disagree
% P
osi
tive
Diff
eren
ce
from
pre
viou
s su
rvey
Diff
eren
ce
from
CS
2018
Diff
eren
ce
from
CS
Hig
h P
erfo
rmer
s
B08 My manager motivates me to be more effective in my job 71% +2 0 -4
B09 My manager is considerate of my life outside work 86% +3 0 -3
B10 My manager is open to my ideas 82% +2 -1 -5
B11 My manager helps me to understand how I contribute to [my organisation's] objectives 64% +1 -3 -8
B12 Overall, I have confidence in the decisions made by my manager 76% +2 0 -4
B13 My manager recognises when I have done my job well 79% 0 0 -4
B14 I receive regular feedback on my performance 67% -1 -1 -6
B15 The feedback I receive helps me to improve my performance 62% -1 -3 -7
B16 I think that my performance is evaluated fairly 67% +1 0 -5
B17 Poor performance is dealt with effectively in my team 39% 0 -1 -4
www.orcinternational.com UK Statistics Authority (Corporate Report) 2018 | Page 6
UK Statistics Authority (Corporate Report)Civil Service People Survey 2018Returns : 3,589 Response rate : 82%
All questions by theme indicates statistically significant difference from comparison
^ indicates a variation in question wording from your previous survey
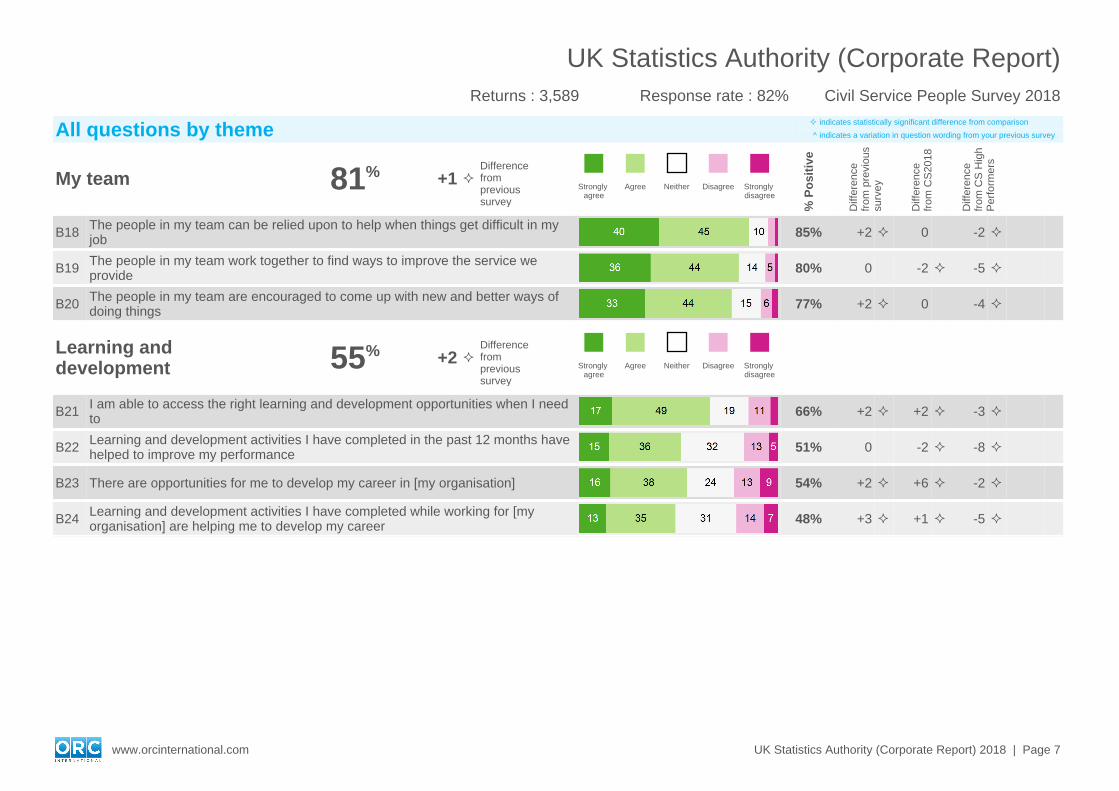
My team 81% +1 Difference from previous survey
Strongly agree
Agree Neither Disagree Strongly disagree
% P
osi
tive
Diff
eren
ce
from
pre
viou
s su
rvey
Diff
eren
ce
from
CS
2018
Diff
eren
ce
from
CS
Hig
h P
erfo
rmer
s
B18 The people in my team can be relied upon to help when things get difficult in my job 85% +2 0 -2
B19 The people in my team work together to find ways to improve the service we provide 80% 0 -2 -5
B20 The people in my team are encouraged to come up with new and better ways of doing things 77% +2 0 -4
Learning and development 55% +2
Difference from previous survey
Strongly agree
Agree Neither Disagree Strongly disagree
B21 I am able to access the right learning and development opportunities when I need to 66% +2 +2 -3
B22 Learning and development activities I have completed in the past 12 months have helped to improve my performance 51% 0 -2 -8
B23 There are opportunities for me to develop my career in [my organisation] 54% +2 +6 -2
B24 Learning and development activities I have completed while working for [my organisation] are helping me to develop my career 48% +3 +1 -5
www.orcinternational.com UK Statistics Authority (Corporate Report) 2018 | Page 7
UK Statistics Authority (Corporate Report)Civil Service People Survey 2018Returns : 3,589 Response rate : 82%
All questions by theme indicates statistically significant difference from comparison
^ indicates a variation in question wording from your previous survey
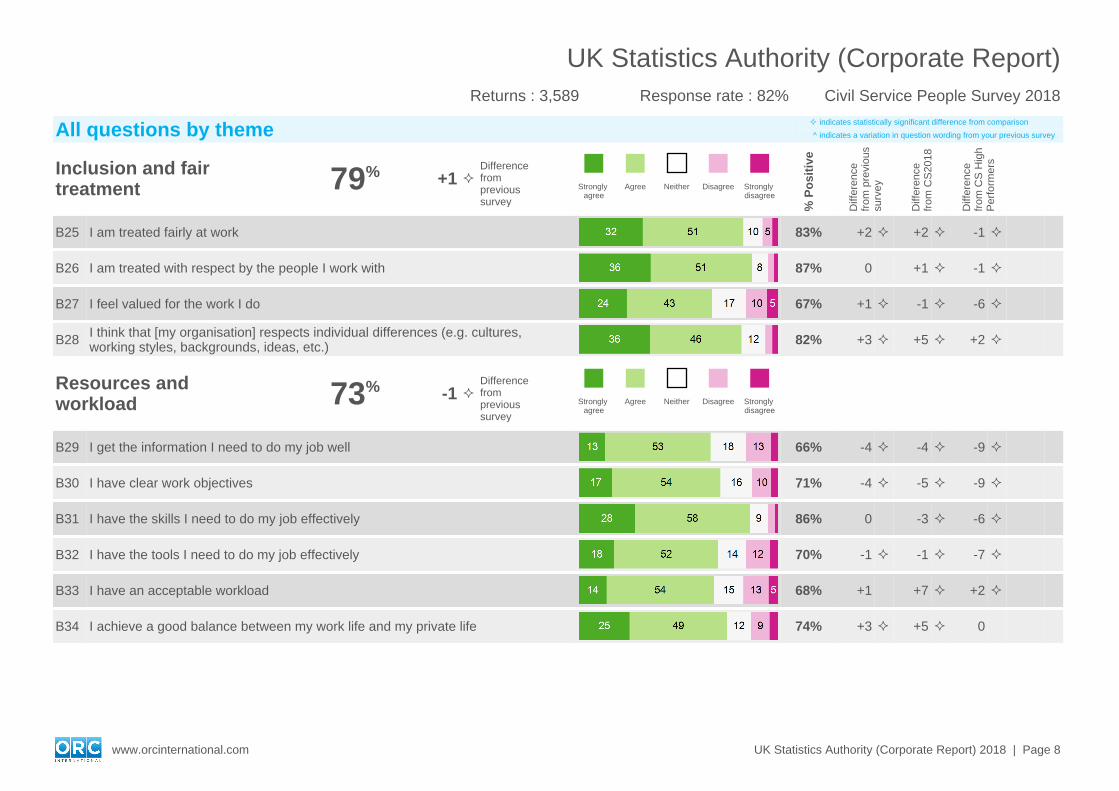
Inclusion and fair treatment 79% +1
Difference from previous survey
Strongly agree
Agree Neither Disagree Strongly disagree
% P
osi
tive
Diff
eren
ce
from
pre
viou
s su
rvey
Diff
eren
ce
from
CS
2018
Diff
eren
ce
from
CS
Hig
h P
erfo
rmer
s
B25 I am treated fairly at work 83% +2 +2 -1
B26 I am treated with respect by the people I work with 87% 0 +1 -1
B27 I feel valued for the work I do 67% +1 -1 -6
B28 I think that [my organisation] respects individual differences (e.g. cultures, working styles, backgrounds, ideas, etc.) 82% +3 +5 +2
Resources and workload 73% -1
Difference from previous survey
Strongly agree
Agree Neither Disagree Strongly disagree
B29 I get the information I need to do my job well 66% -4 -4 -9
B30 I have clear work objectives 71% -4 -5 -9
B31 I have the skills I need to do my job effectively 86% 0 -3 -6
B32 I have the tools I need to do my job effectively 70% -1 -1 -7
B33 I have an acceptable workload 68% +1 +7 +2
B34 I achieve a good balance between my work life and my private life 74% +3 +5 0
www.orcinternational.com UK Statistics Authority (Corporate Report) 2018 | Page 8
UK Statistics Authority (Corporate Report)Civil Service People Survey 2018Returns : 3,589 Response rate : 82%
All questions by theme indicates statistically significant difference from comparison
^ indicates a variation in question wording from your previous survey
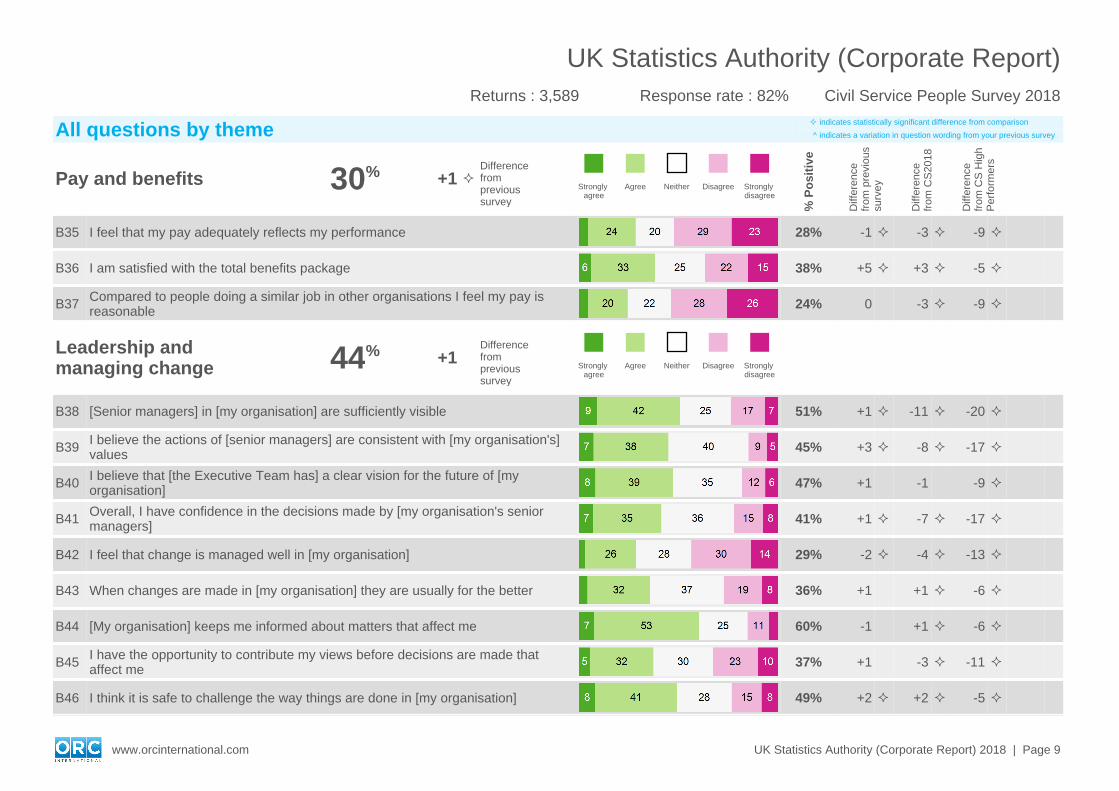
Pay and benefits 30% +1 Difference from previous survey
Strongly agree
Agree Neither Disagree Strongly disagree
% P
osi
tive
Diff
eren
ce
from
pre
viou
s su
rvey
Diff
eren
ce
from
CS
2018
Diff
eren
ce
from
CS
Hig
h P
erfo
rmer
s
B35 I feel that my pay adequately reflects my performance 28% -1 -3 -9
B36 I am satisfied with the total benefits package 38% +5 +3 -5
B37 Compared to people doing a similar job in other organisations I feel my pay is reasonable 24% 0 -3 -9
Leadership and managing change 44% +1
Difference from previous survey
Strongly agree
Agree Neither Disagree Strongly disagree
B38 [Senior managers] in [my organisation] are sufficiently visible 51% +1 -11 -20
B39 I believe the actions of [senior managers] are consistent with [my organisation's] values 45% +3 -8 -17
B40 I believe that [the Executive Team has] a clear vision for the future of [my organisation] 47% +1 -1 -9
B41 Overall, I have confidence in the decisions made by [my organisation's senior managers] 41% +1 -7 -17
B42 I feel that change is managed well in [my organisation] 29% -2 -4 -13
B43 When changes are made in [my organisation] they are usually for the better 36% +1 +1 -6
B44 [My organisation] keeps me informed about matters that affect me 60% -1 +1 -6
B45 I have the opportunity to contribute my views before decisions are made that affect me 37% +1 -3 -11
B46 I think it is safe to challenge the way things are done in [my organisation] 49% +2 +2 -5
www.orcinternational.com UK Statistics Authority (Corporate Report) 2018 | Page 9
UK Statistics Authority (Corporate Report)Civil Service People Survey 2018Returns : 3,589 Response rate : 82%
All questions by theme indicates statistically significant difference from comparison
^ indicates a variation in question wording from your previous survey
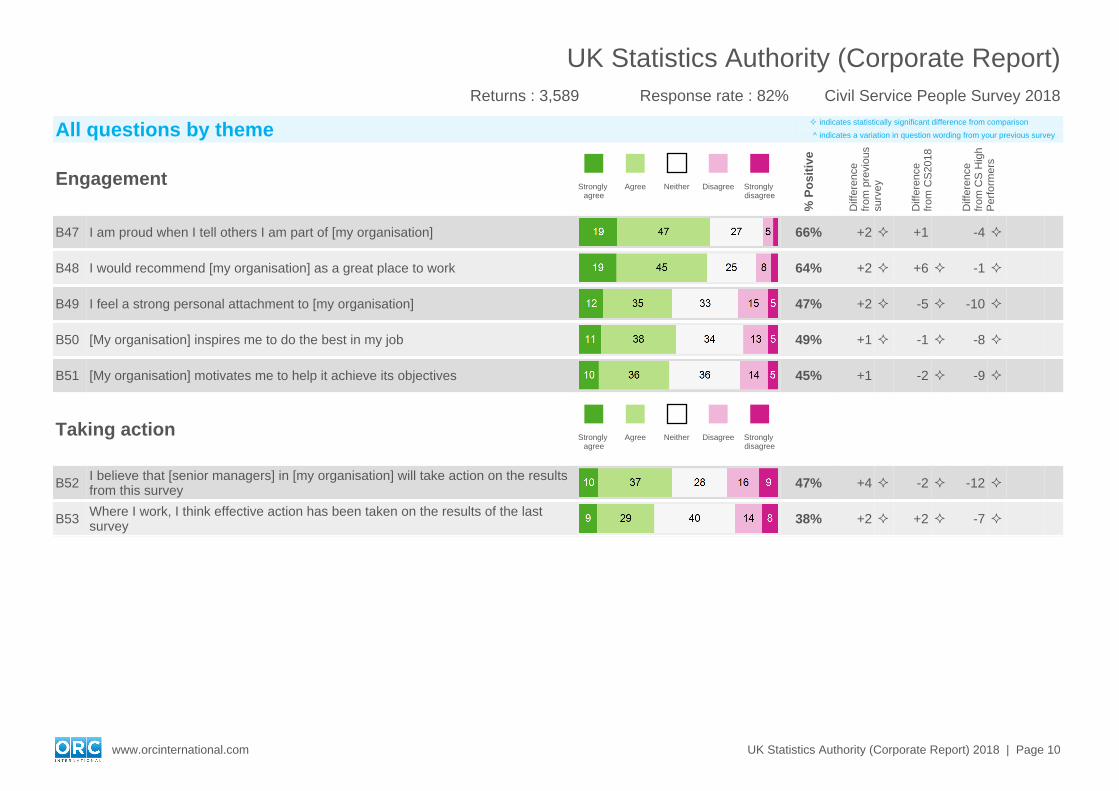
Engagement Strongly agree
Agree Neither Disagree Strongly disagree
% P
osi
tive
Diff
eren
ce
from
pre
viou
s su
rvey
Diff
eren
ce
from
CS
2018
Diff
eren
ce
from
CS
Hig
h P
erfo
rmer
s
B47 I am proud when I tell others I am part of [my organisation] 66% +2 +1 -4
B48 I would recommend [my organisation] as a great place to work 64% +2 +6 -1
B49 I feel a strong personal attachment to [my organisation] 47% +2 -5 -10
B50 [My organisation] inspires me to do the best in my job 49% +1 -1 -8
B51 [My organisation] motivates me to help it achieve its objectives 45% +1 -2 -9
Taking action Strongly agree
Agree Neither Disagree Strongly disagree
B52 I believe that [senior managers] in [my organisation] will take action on the results from this survey 47% +4 -2 -12
B53 Where I work, I think effective action has been taken on the results of the last survey 38% +2 +2 -7
www.orcinternational.com UK Statistics Authority (Corporate Report) 2018 | Page 10
UK Statistics Authority (Corporate Report)Civil Service People Survey 2018Returns : 3,589 Response rate : 82%
All questions by theme indicates statistically significant difference from comparison
^ indicates a variation in question wording from your previous survey
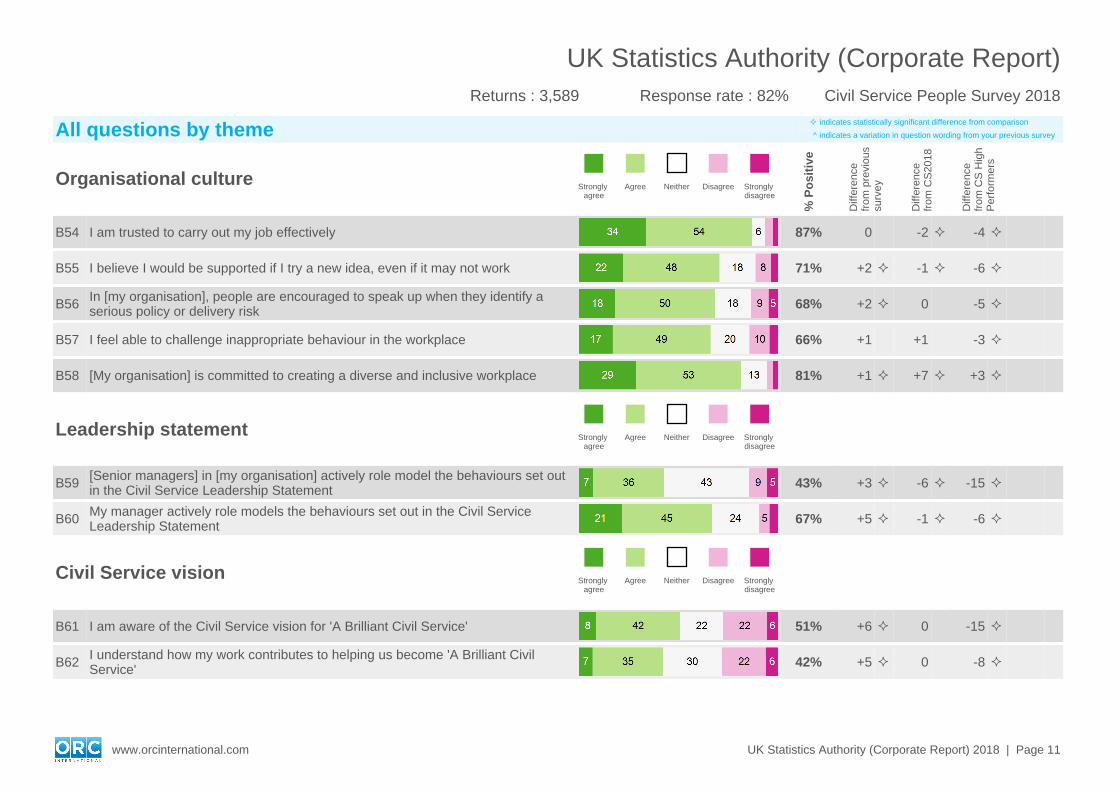
Organisational culture Strongly agree
Agree Neither Disagree Strongly disagree
% P
osi
tive
Diff
eren
ce
from
pre
viou
s su
rvey
Diff
eren
ce
from
CS
2018
Diff
eren
ce
from
CS
Hig
h P
erfo
rmer
s
B54 I am trusted to carry out my job effectively 87% 0 -2 -4
B55 I believe I would be supported if I try a new idea, even if it may not work 71% +2 -1 -6
B56 In [my organisation], people are encouraged to speak up when they identify a serious policy or delivery risk 68% +2 0 -5
B57 I feel able to challenge inappropriate behaviour in the workplace 66% +1 +1 -3
B58 [My organisation] is committed to creating a diverse and inclusive workplace 81% +1 +7 +3
Leadership statement Strongly agree
Agree Neither Disagree Strongly disagree
B59 [Senior managers] in [my organisation] actively role model the behaviours set out in the Civil Service Leadership Statement 43% +3 -6 -15
B60 My manager actively role models the behaviours set out in the Civil Service Leadership Statement 67% +5 -1 -6
Civil Service vision Strongly agree
Agree Neither Disagree Strongly disagree
B61 I am aware of the Civil Service vision for 'A Brilliant Civil Service' 51% +6 0 -15
B62 I understand how my work contributes to helping us become 'A Brilliant Civil Service' 42% +5 0 -8
www.orcinternational.com UK Statistics Authority (Corporate Report) 2018 | Page 11
UK Statistics Authority (Corporate Report)Civil Service People Survey 2018Returns : 3,589 Response rate : 82%
All questions by theme indicates statistically significant difference from comparison
^ indicates a variation in question wording from your previous survey
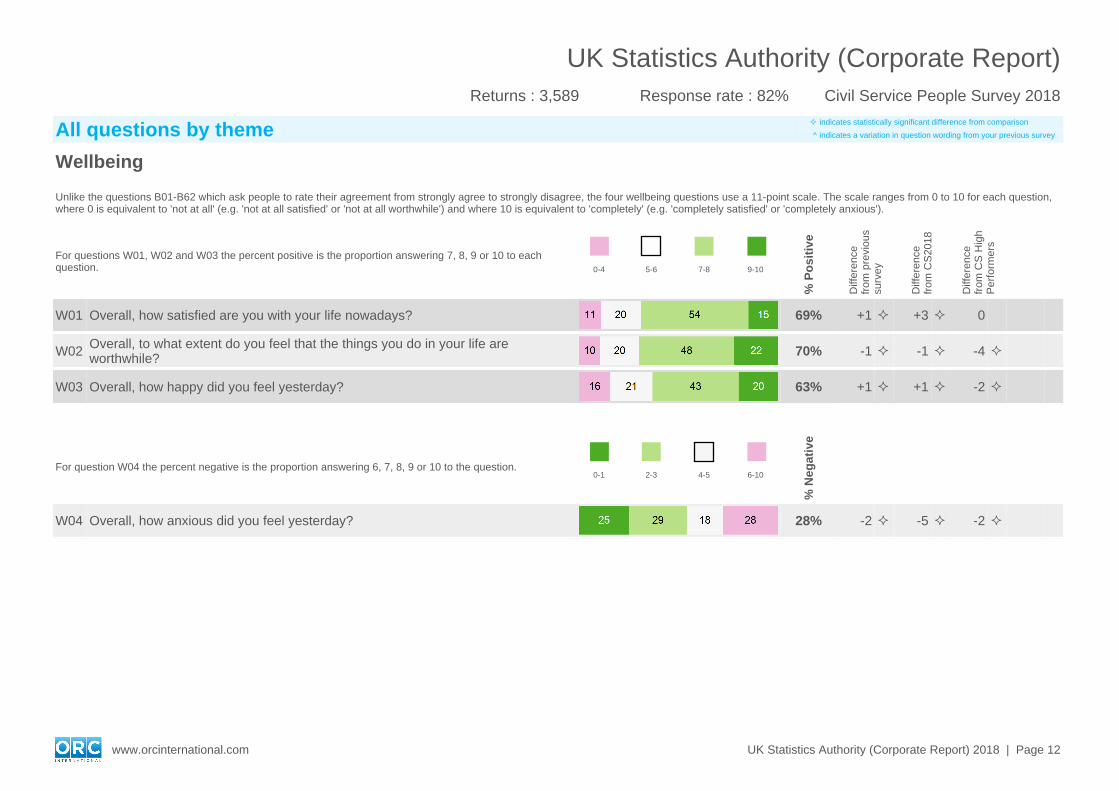
Wellbeing
Unlike the questions B01-B62 which ask people to rate their agreement from strongly agree to strongly disagree, the four wellbeing questions use a 11-point scale. The scale ranges from 0 to 10 for each question, where 0 is equivalent to 'not at all' (e.g. 'not at all satisfied' or 'not at all worthwhile') and where 10 is equivalent to 'completely' (e.g. 'completely satisfied' or 'completely anxious').
For questions W01, W02 and W03 the percent positive is the proportion answering 7, 8, 9 or 10 to each question. 0-4 5-6 7-8 9-10
% P
osi
tive
Diff
eren
ce
from
pre
viou
s su
rvey
Diff
eren
ce
from
CS
2018
Diff
eren
ce
from
CS
Hig
h P
erfo
rmer
s
W01 Overall, how satisfied are you with your life nowadays? 69% +1 +3 0
W02 Overall, to what extent do you feel that the things you do in your life are worthwhile? 70% -1 -1 -4
W03 Overall, how happy did you feel yesterday? 63% +1 +1 -2
For question W04 the percent negative is the proportion answering 6, 7, 8, 9 or 10 to the question.0-1 2-3 4-5 6-10
% N
egat
ive
W04 Overall, how anxious did you feel yesterday? 28% -2 -5 -2
www.orcinternational.com UK Statistics Authority (Corporate Report) 2018 | Page 12
UK Statistics Authority (Corporate Report)Civil Service People Survey 2018Returns : 3,589 Response rate : 82%
All questions by theme indicates statistically significant difference from comparison
^ indicates a variation in question wording from your previous survey
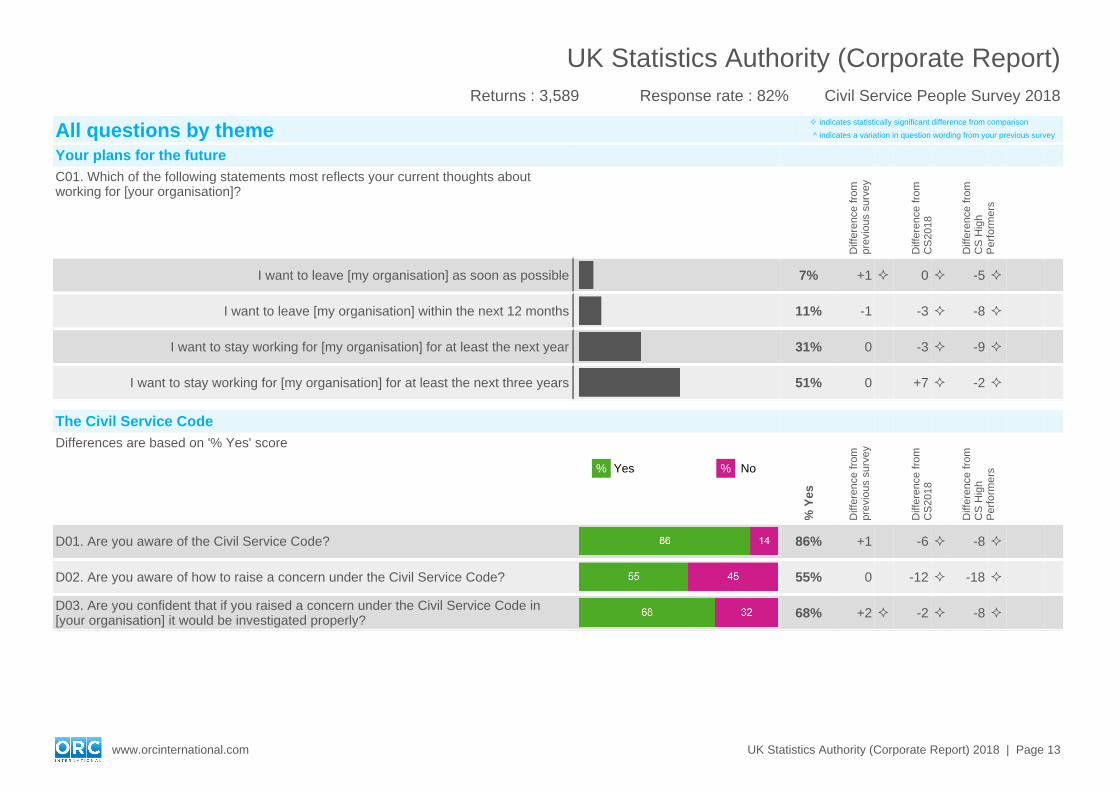
Your plans for the futureC01. Which of the following statements most reflects your current thoughts about working for [your organisation]?
Diff
eren
ce fr
om
prev
ious
sur
vey
Diff
eren
ce fr
om
CS
2018
Diff
eren
ce fr
om
CS
Hig
h P
erfo
rmer
s
I want to leave [my organisation] as soon as possible 7% +1 0 -5
I want to leave [my organisation] within the next 12 months 11% -1 -3 -8
I want to stay working for [my organisation] for at least the next year 31% 0 -3 -9
I want to stay working for [my organisation] for at least the next three years 51% 0 +7 -2
The Civil Service CodeDifferences are based on '% Yes' score
% Yes % No
% Y
es
Diff
eren
ce fr
om
prev
ious
sur
vey
Diff
eren
ce fr
om
CS
2018
Diff
eren
ce fr
om
CS
Hig
h P
erfo
rmer
s
D01. Are you aware of the Civil Service Code? 86% +1 -6 -8
D02. Are you aware of how to raise a concern under the Civil Service Code? 55% 0 -12 -18
D03. Are you confident that if you raised a concern under the Civil Service Code in [your organisation] it would be investigated properly? 68% +2 -2 -8
www.orcinternational.com UK Statistics Authority (Corporate Report) 2018 | Page 13
UK Statistics Authority (Corporate Report)Civil Service People Survey 2018Returns : 3,589 Response rate : 82%
All questions by theme indicates statistically significant difference from comparison
^ indicates a variation in question wording from your previous survey
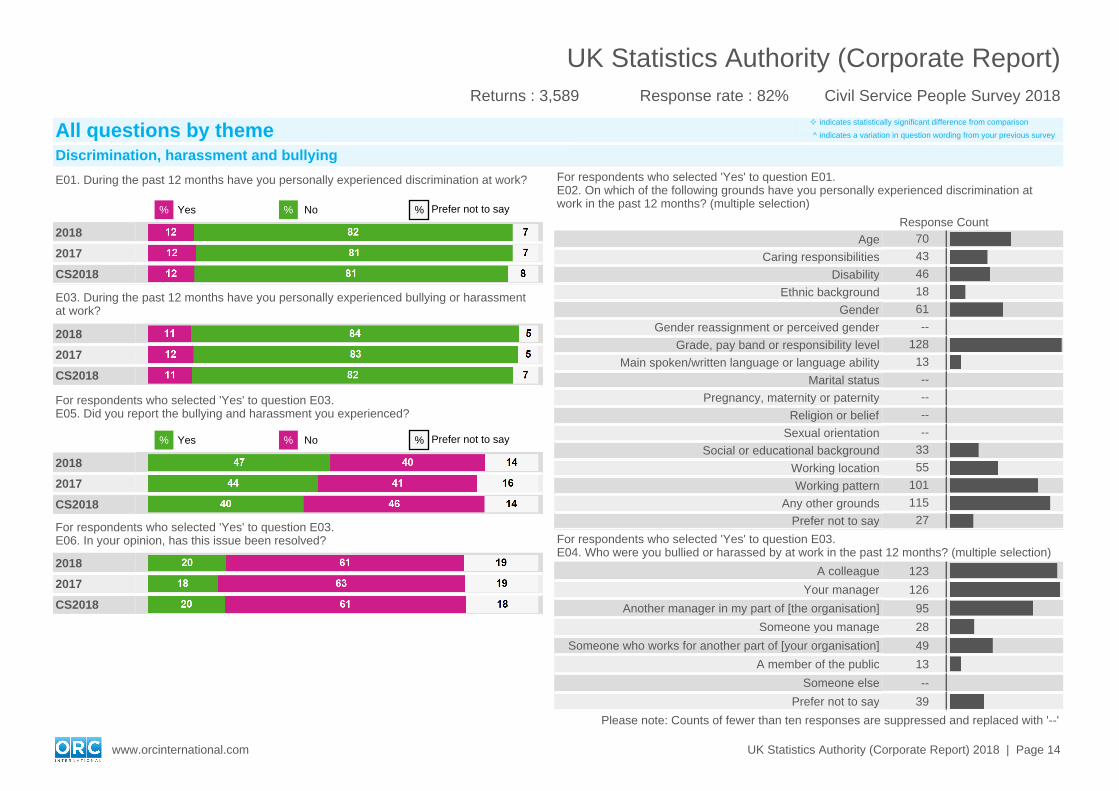
Discrimination, harassment and bullyingFor respondents who selected 'Yes' to question E01.E02. On which of the following grounds have you personally experienced discrimination at work in the past 12 months? (multiple selection)
Response CountAge 70
Caring responsibilities 43
Disability 46
Ethnic background 18
Gender 61
Gender reassignment or perceived gender --
Grade, pay band or responsibility level 128
Main spoken/written language or language ability 13
Marital status --
Pregnancy, maternity or paternity --
Religion or belief --
Sexual orientation --
Social or educational background 33
Working location 55
Working pattern 101
Any other grounds 115
Prefer not to say 27
For respondents who selected 'Yes' to question E03.E04. Who were you bullied or harassed by at work in the past 12 months? (multiple selection)
A colleague 123
Your manager 126
Another manager in my part of [the organisation] 95
Someone you manage 28
Someone who works for another part of [your organisation] 49
A member of the public 13
Someone else --
Prefer not to say 39
Please note: Counts of fewer than ten responses are suppressed and replaced with '--'
E01. During the past 12 months have you personally experienced discrimination at work?
% Yes % No % Prefer not to say
2018
2017
CS2018
E03. During the past 12 months have you personally experienced bullying or harassment at work?
2018
2017
CS2018
For respondents who selected 'Yes' to question E03.E05. Did you report the bullying and harassment you experienced?
% Yes % No % Prefer not to say
2018
2017
CS2018
For respondents who selected 'Yes' to question E03.E06. In your opinion, has this issue been resolved?
2018
2017
CS2018
www.orcinternational.com UK Statistics Authority (Corporate Report) 2018 | Page 14
UK Statistics Authority (Corporate Report)Civil Service People Survey 2018Returns : 3,589 Response rate : 82%
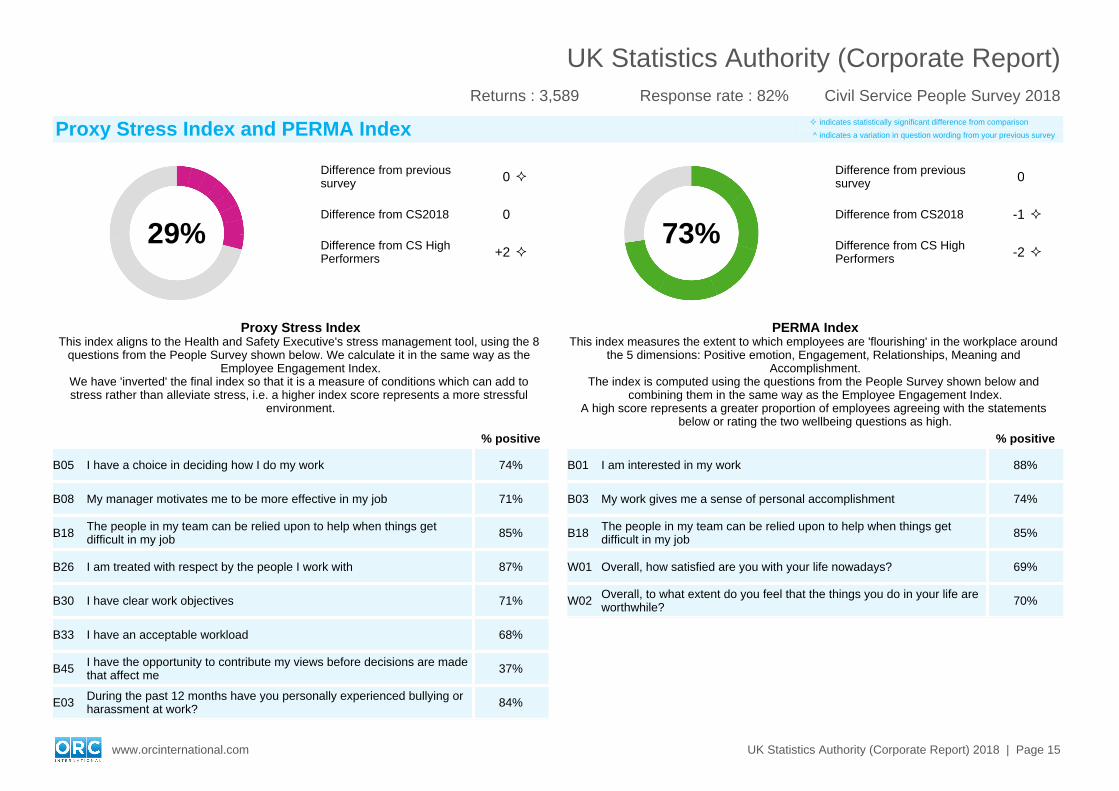
29%
Difference from previous survey 0
Difference from CS2018 0
Difference from CS High Performers +2
73%
Difference from previous survey 0
Difference from CS2018 -1
Difference from CS High Performers -2
Proxy Stress IndexThis index aligns to the Health and Safety Executive's stress management tool, using the 8
questions from the People Survey shown below. We calculate it in the same way as the Employee Engagement Index.
We have 'inverted' the final index so that it is a measure of conditions which can add to stress rather than alleviate stress, i.e. a higher index score represents a more stressful
environment.
PERMA IndexThis index measures the extent to which employees are 'flourishing' in the workplace around
the 5 dimensions: Positive emotion, Engagement, Relationships, Meaning and Accomplishment.
The index is computed using the questions from the People Survey shown below and combining them in the same way as the Employee Engagement Index.
A high score represents a greater proportion of employees agreeing with the statements below or rating the two wellbeing questions as high.
% positive
B05 I have a choice in deciding how I do my work 74%
B08 My manager motivates me to be more effective in my job 71%
B18 The people in my team can be relied upon to help when things get difficult in my job 85%
B26 I am treated with respect by the people I work with 87%
B30 I have clear work objectives 71%
B33 I have an acceptable workload 68%
B45 I have the opportunity to contribute my views before decisions are made that affect me 37%
E03 During the past 12 months have you personally experienced bullying or harassment at work? 84%
% positive
B01 I am interested in my work 88%
B03 My work gives me a sense of personal accomplishment 74%
B18 The people in my team can be relied upon to help when things get difficult in my job 85%
W01 Overall, how satisfied are you with your life nowadays? 69%
W02 Overall, to what extent do you feel that the things you do in your life are worthwhile? 70%
Proxy Stress Index and PERMA Index indicates statistically significant difference from comparison
^ indicates a variation in question wording from your previous survey
www.orcinternational.com UK Statistics Authority (Corporate Report) 2018 | Page 15
UK Statistics Authority (Corporate Report)Civil Service People Survey 2018Returns : 3,589 Response rate : 82%
AppendixGlossary of key terms
% positive The proportion who selected either "agree" or "strongly agree" for a question (or all questions within a theme in the case of Theme score % positive).
Previous survey Comparisons to the previous survey relate to the results from the 2017 Civil Service People Survey. Where a question is flagged as changed since the last survey comparisons should be treated with caution as changes to wording may affect how people respond to the question.
CS2018 The CS2018 benchmark is the median percent positive across all organisations that participated in the 2018 Civil Service People Survey.
CS High Performers For each question, this is the upper quartile score across all organisations that have taken part in the 2018 Civil Service People Survey.The 'CS High Performer' comparator for the Proxy Stress Index has been corrected (reissued 23/11/2018).
Rounding
Results are presented as whole numbers for ease of reading, with rounding performed at the last stage of calculation for maximum accuracy. Therefore in some instances, the differences presented in this report will not match the rounded figures of the scores being compared. For example, if your unrounded Engagement Index score is 75.43647583%, your organisation overall's score is 74.63572484% and the difference between the two is +0.800751%, in this report these scores would appear as 75%, 75% and +1.
Statistical significance: Statistical testing has been carried out to identify statistically significant* differences between your results and a number of comparators. You can therefore be confident that the difference represents a real difference in opinion between the results.*Note, there needs to be 30 responses at question level, 20 responses at theme level or 10 responses at index level for statistical testing to be carried out on the corresponding scores.
The employee engagement index
The survey includes five questions that make up the engagement index (B47-B51). The index score represents the average level of engagement in that unit and ranges from 0 to 100. An index score of 0 represents all respondents in that unit saying they strongly disagree to all five engagement questions and a score of 100 represents all respondents saying they strongly agree to all five engagement questions.
The drivers of engagement
While the engagement index shows the average level of engagement, it does not show what you can do to improve engagement. A statistical technique (a form of regression) is used to identify the extent to which each question in the survey has an association with engagement. Questions identified as having an association are called ‘Drivers of engagement’: page 3 of this report shows the questions that had the strongest association with engagement in this unit.
Confidentiality
The survey was carried out as part of the 2018 Civil Service People Survey, which is managed by the Cabinet Office on behalf of all participating organisations. The Cabinet Office commissioned ORC International to carry out the survey. ORC International is a member of the Market Research Society, and is bound by their strict code of conduct and confidentiality rules. These rules do not allow for the breakdown of the results to the extent where the anonymity of individuals may be compromised. Groups of fewer than 10 respondents will not be reported on, however their responses do contribute to the overall scores for the unit and organisation they belong to and the overall Civil Service results.
ORC's Privacy Policy (www.orcinternational.co.uk/privacy) tells you how they keep personal data safe and who to contact to exercise your rights of control under the new GDPR regulations.
www.orcinternational.com UK Statistics Authority (Corporate Report) 2018 | Page 16
UK Statistics Authority (Corporate Report)Civil Service People Survey 2018Returns : 3,589 Response rate : 82%