Embed Size (px)
Citation preview
2017 UNICON Membership Benchmarking Survey
© Copyright 2017 Percept Research Inc. | Proprietary & Confidential
2017
UNICON Membership
Benchmarking Survey
Executive Summary
2017 UNICON Membership Benchmarking Survey
© Copyright 2017 Percept Research Inc. | Proprietary & Confidential
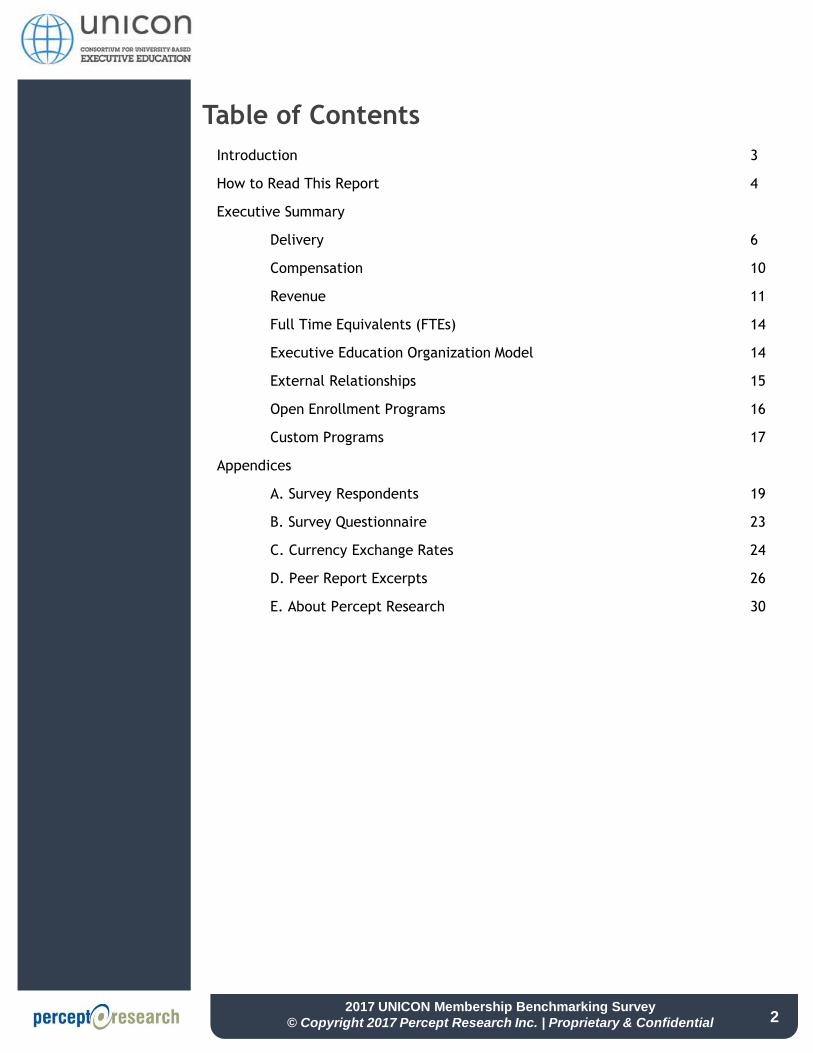
Introduction 3
How to Read This Report 4
Executive Summary
Delivery 6
Compensation 10
Revenue 11
Full Time Equivalents (FTEs) 14
Executive Education Organization Model 14
External Relationships 15
Open Enrollment Programs 16
Custom Programs 17
Appendices
A. Survey Respondents 19
B. Survey Questionnaire 23
C. Currency Exchange Rates 24
D. Peer Report Excerpts 26
E. About Percept Research 30
Table of Contents
2

2017 UNICON Membership Benchmarking Survey
© Copyright 2017 Percept Research Inc. | Proprietary & Confidential
Objectives
This study was conducted in order to:
Benchmark and track the non-degree executive education business.
Provide members with a credible, comparative, and confidential assessment.
Methodology
The questionnaire was developed by UNICON and Percept Research.
The questionnaire was administered via a web survey hosted by Percept Research.
Percept Research fielded the survey, tabulated data, and developed the graphical presentation.
Fielding Overview
Fielding Started: 31 Aug 2017
Fielding Completed: 08 Oct 2017
*Margin of error is calculated using the UNICON membership population with a 95% confidence interval.
Sample Sizes (‘N’)
‘N’ is an abbreviation for the number of schools that provided a valid response to the question represented in
charts and tables. Below is a table of ‘N’ values by year and segment.
Introduction
3
Total
Membership
Completed
Surveys
Response
Rate
Margin of
Error*
113 99 87.6% 3.5%
* Total N for Revenue does not equal Total N due to the exclusion of invalid revenue responses from the data set
US /
CanadaEurope
Latin
America
Asia /
Oceanic
Middle
East /
Africa
$3M and
Below
>$3M to
$12M
>$12M to
$20M>$20M
2012-13 77 42 15 10 10 0 18 30 11 13
2013-14 93 45 20 10 15 3 17 40 10 21
2014-15 94 48 22 9 13 2 18 37 17 21
2015-16 98 48 23 9 15 3 16 46 13 21
2016-17 99 48 22 10 16 3 17 41 17 19
Geography Revenue*
YearTotal #
Schools

2017 UNICON Membership Benchmarking Survey
© Copyright 2017 Percept Research Inc. | Proprietary & Confidential
How to Read this Report
The report (main body plus appendices) presents the entire 2017 survey.
The table on the previous page shows approximate margins of error (95% confidence intervals) for means and
percentages presented in this report.
Segmentation by geography and revenue are displayed to provide additional insights.
When available, data is displayed over the past five years to show trending.
Verbatim comments and “other specify” results are displayed exactly as the school entered the information.
Percept Research does not modify responses for spelling, grammar, etc.
Methodology Notes
The high response rate, with no evidence of bias, indicates that results are representative of the entire UNICON
population for 2016-17. Individual members can benchmark themselves against the rest of the industry and
relevant subsets on both actual and expected measures.
Although the response rate was high, the absolute sample size is still fairly small. Differences by program type,
location, size, or survey year – even as large as 20% or more – may not be statistically significant. These
comparisons still provide useful directional insights.
Reading Chart Values
Aggregated values for single response questions in this report may not always sum to 100%. This is due to
rounding. Multiple response questions will usually not equal 100% as respondents can select more than one
answer choice.
Some values differ very slightly from previous reports due to a small number of schools correcting inadvertent,
erroneous outlier responses after report publication. Corrected responses are included to ensure accurate
trending going forward.
Uniform Group Analysis
Uniform Group Analyses (UGA) indicate trends based on the same group of schools participating in the
benchmark survey for the past three years to factor out the influence of new programs entering the
membership or not participating consistently during this timeframe. There are 81 of 99 schools included in the
UGA. Please note that UGA is provided for select slides.
How to Read this Report
4
* Total N for Revenue does not equal Total N due to the exclusion of invalid revenue responses from the data set.
US /
CanadaEurope
Latin
America
Asia /
Oceanic
Middle
East /
Africa
$3M and
Below
>$3M to
$12M
>$12M to
$20M>$20M
2014-15 81 44 16 8 11 2 17 32 14 17
2015-16 81 43 17 8 11 2 14 36 11 18
2016-17 81 44 16 8 11 2 16 31 13 17
Year
(UGA)
Total #
Schools
(UGA)
Geography (UGA) Revenue* (UGA)
2017 UNICON Membership Benchmarking Survey
© Copyright 2017 Percept Research Inc. | Proprietary & Confidential
Executive Summary
5
2017 UNICON Membership Benchmarking Survey
© Copyright 2017 Percept Research Inc. | Proprietary & Confidential
Delivery
6
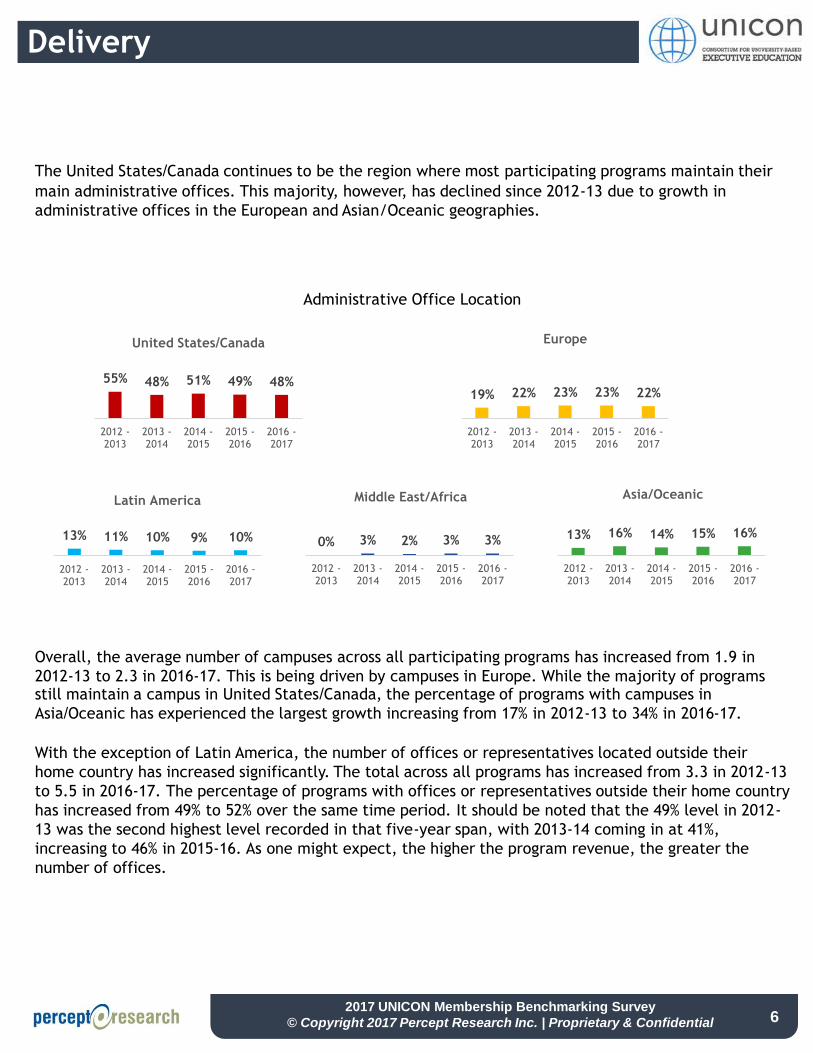
The United States/Canada continues to be the region where most participating programs maintain their
main administrative offices. This majority, however, has declined since 2012-13 due to growth in
administrative offices in the European and Asian/Oceanic geographies.
55% 48% 51% 49% 48%
2012 -2013
2013 -2014
2014 -2015
2015 -2016
2016 -2017
United States/Canada
19% 22% 23% 23% 22%
2012 -2013
2013 -2014
2014 -2015
2015 -2016
2016 -2017
Europe
13% 11% 10% 9% 10%
2012 -2013
2013 -2014
2014 -2015
2015 -2016
2016 -2017
Latin America
0% 3% 2% 3% 3%
2012 -2013
2013 -2014
2014 -2015
2015 -2016
2016 -2017
Middle East/Africa
13% 16% 14% 15% 16%
2012 -2013
2013 -2014
2014 -2015
2015 -2016
2016 -2017
Asia/Oceanic
Overall, the average number of campuses across all participating programs has increased from 1.9 in
2012-13 to 2.3 in 2016-17. This is being driven by campuses in Europe. While the majority of programs still maintain a campus in United States/Canada, the percentage of programs with campuses in
Asia/Oceanic has experienced the largest growth increasing from 17% in 2012-13 to 34% in 2016-17.
With the exception of Latin America, the number of offices or representatives located outside their
home country has increased significantly. The total across all programs has increased from 3.3 in 2012-13
to 5.5 in 2016-17. The percentage of programs with offices or representatives outside their home country
has increased from 49% to 52% over the same time period. It should be noted that the 49% level in 2012-
13 was the second highest level recorded in that five-year span, with 2013-14 coming in at 41%,
increasing to 46% in 2015-16. As one might expect, the higher the program revenue, the greater the
number of offices.
Administrative Office Location
2017 UNICON Membership Benchmarking Survey
© Copyright 2017 Percept Research Inc. | Proprietary & Confidential
Delivery
7
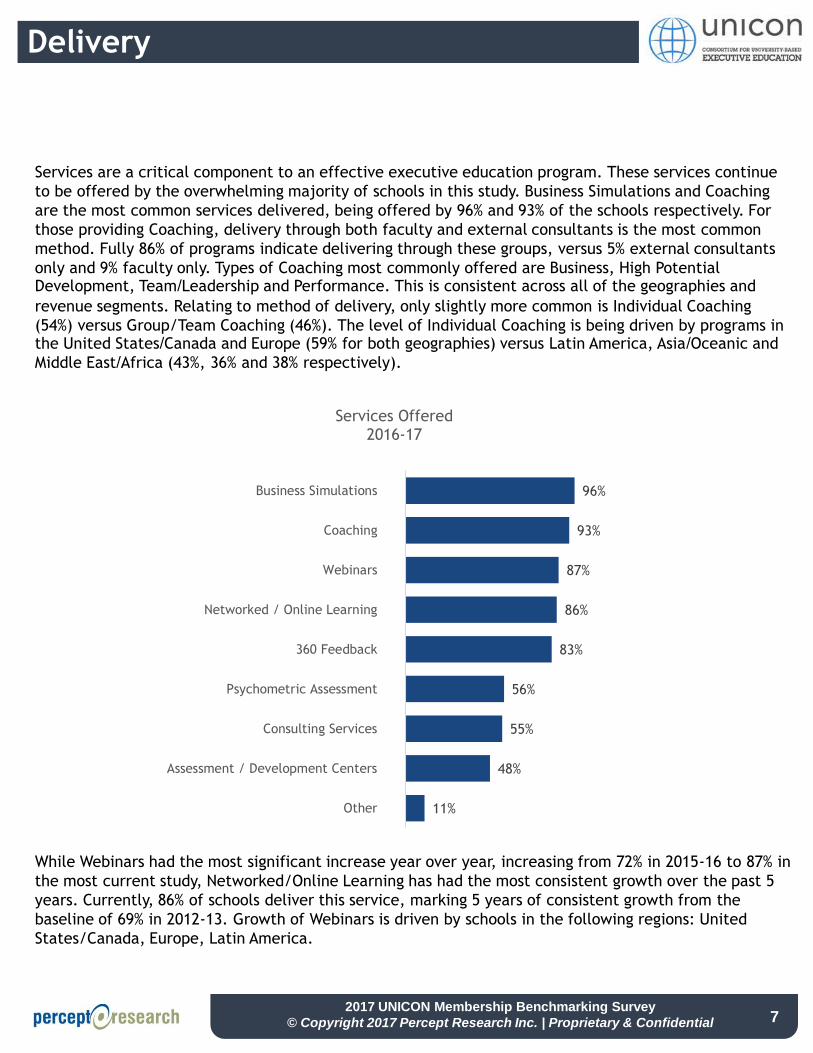
Services are a critical component to an effective executive education program. These services continue
to be offered by the overwhelming majority of schools in this study. Business Simulations and Coaching
are the most common services delivered, being offered by 96% and 93% of the schools respectively. For
those providing Coaching, delivery through both faculty and external consultants is the most common
method. Fully 86% of programs indicate delivering through these groups, versus 5% external consultants
only and 9% faculty only. Types of Coaching most commonly offered are Business, High Potential Development, Team/Leadership and Performance. This is consistent across all of the geographies and
revenue segments. Relating to method of delivery, only slightly more common is Individual Coaching
(54%) versus Group/Team Coaching (46%). The level of Individual Coaching is being driven by programs in the United States/Canada and Europe (59% for both geographies) versus Latin America, Asia/Oceanic and
Middle East/Africa (43%, 36% and 38% respectively).
While Webinars had the most significant increase year over year, increasing from 72% in 2015-16 to 87% in
the most current study, Networked/Online Learning has had the most consistent growth over the past 5
years. Currently, 86% of schools deliver this service, marking 5 years of consistent growth from the
baseline of 69% in 2012-13. Growth of Webinars is driven by schools in the following regions: United
States/Canada, Europe, Latin America.
11%
48%
55%
56%
83%
86%
87%
93%
96%
Other
Assessment / Development Centers
Consulting Services
Psychometric Assessment
360 Feedback
Networked / Online Learning
Webinars
Coaching
Business Simulations
Services Offered2016-17

2017 UNICON Membership Benchmarking Survey
© Copyright 2017 Percept Research Inc. | Proprietary & Confidential
Delivery
8
Technology adoption continues to increase among executive education programs. In 2012-13, Classroom
Video Capture was the most common type of technology being leveraged at a rate of 56% across all
schools. Now, six of the seven technologies studied are being leveraged at this rate or higher. Smart
Board Technologies is the only type that has not grown significantly over this timeframe and remains at
35% utilization. Asynchronous Learning Platforms is the most commonly adopted technology with 83%
utilization with another 11% planning to adopt in the next two years. This is followed by Classroom Video
Capture (78%), Tablets or Laptops (75%), Synchronous Learning Platforms (74%), and Instant Class Polling
(67%). Smart Board Technologies, with the largest percentage of planning to adopt at 24%, has
demonstrated minimal realization of these plans as growth has been minimal (1%) over the past 5 years
in spite of large planned adoption numbers. For example, in 2014-15 (two years ago), respondents
reported usage of Smart Board Tech’s at 38% with 19% planning to adopt in two years. These data show
that those plans remain unrealized. Conversely, Tele-presence with its significant planned adoption of
23% has grown 25% since 2012-13 in conjunction with large planned growth percentages.
10%
35%
56%
67%
74%
75%
78%
83%
3%
24%
23%
17%
17%
10%
8%
11%
87%
40%
21%
16%
9%
15%
14%
6%
Other
Smart Board Technologies
Tele-presence
Instant Class Polling
Synchronous Learning Platforms
Tablets or Laptops
Classroom Video Capture
Asynchronous Learning Platforms
Technology Adoption2016-17
Adopted Plan to Adopt No Plan to Adopt
2017 UNICON Membership Benchmarking Survey
© Copyright 2017 Percept Research Inc. | Proprietary & Confidential
Tablets or Laptops
Asynchronous Learning Platforms
Synchronous Learning Platforms
Smart Board Technologies
Other
Instant Class Polling
Classroom Video Capture
Tele-presence
3.0
3.3
3.5
3.8
4.0
4.3
4.5
4.8
5.0
0% 10% 20% 30% 40% 50% 60%
Eff
ecti
veness
of
Technolo
gy (
1-5
Scale
)
Percent of Programs Leveraging Technology
Average Effectiveness
Average Usage
Delivery
9
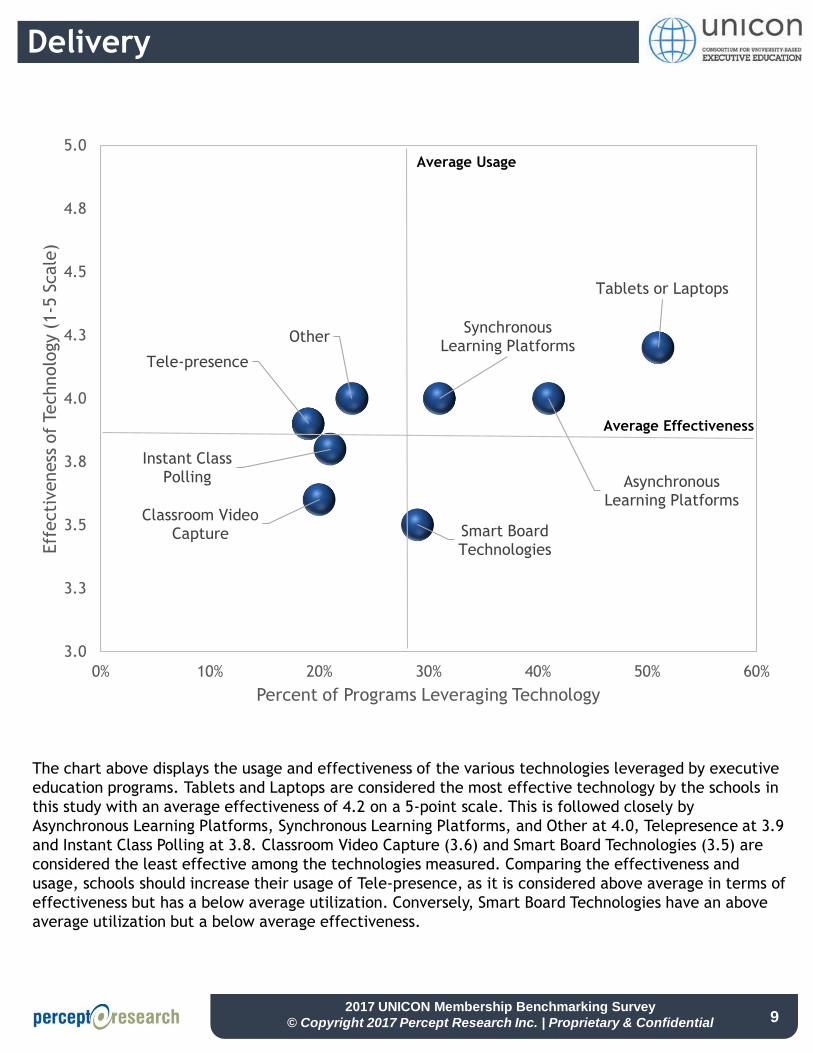
The chart above displays the usage and effectiveness of the various technologies leveraged by executive
education programs. Tablets and Laptops are considered the most effective technology by the schools in
this study with an average effectiveness of 4.2 on a 5-point scale. This is followed closely by
Asynchronous Learning Platforms, Synchronous Learning Platforms, and Other at 4.0, Telepresence at 3.9
and Instant Class Polling at 3.8. Classroom Video Capture (3.6) and Smart Board Technologies (3.5) are
considered the least effective among the technologies measured. Comparing the effectiveness and
usage, schools should increase their usage of Tele-presence, as it is considered above average in terms of
effectiveness but has a below average utilization. Conversely, Smart Board Technologies have an above
average utilization but a below average effectiveness.
2017 UNICON Membership Benchmarking Survey
© Copyright 2017 Percept Research Inc. | Proprietary & Confidential
Compensation
10
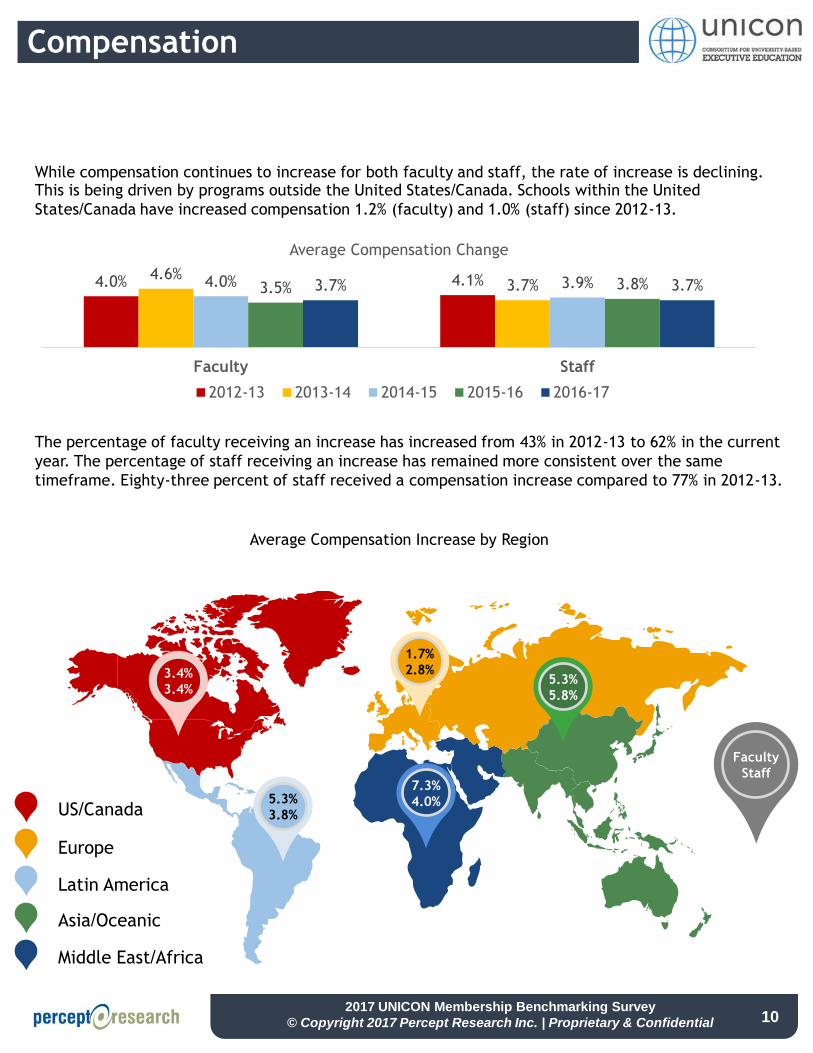
While compensation continues to increase for both faculty and staff, the rate of increase is declining. This is being driven by programs outside the United States/Canada. Schools within the United
States/Canada have increased compensation 1.2% (faculty) and 1.0% (staff) since 2012-13.
4.0% 4.1%4.6%3.7%4.0% 3.9%3.5% 3.8%3.7% 3.7%
Faculty Staff
Average Compensation Change
2012-13 2013-14 2014-15 2015-16 2016-17
3.4%
3.4%
5.3%
3.8%
7.3%
4.0%
1.7%
2.8%5.3%
5.8%
US/Canada
Europe
Asia/Oceanic
Middle East/Africa
Latin America
Faculty
Staff
Average Compensation Increase by Region
The percentage of faculty receiving an increase has increased from 43% in 2012-13 to 62% in the current
year. The percentage of staff receiving an increase has remained more consistent over the same
timeframe. Eighty-three percent of staff received a compensation increase compared to 77% in 2012-13.
2017 UNICON Membership Benchmarking Survey
© Copyright 2017 Percept Research Inc. | Proprietary & Confidential
Revenue
11
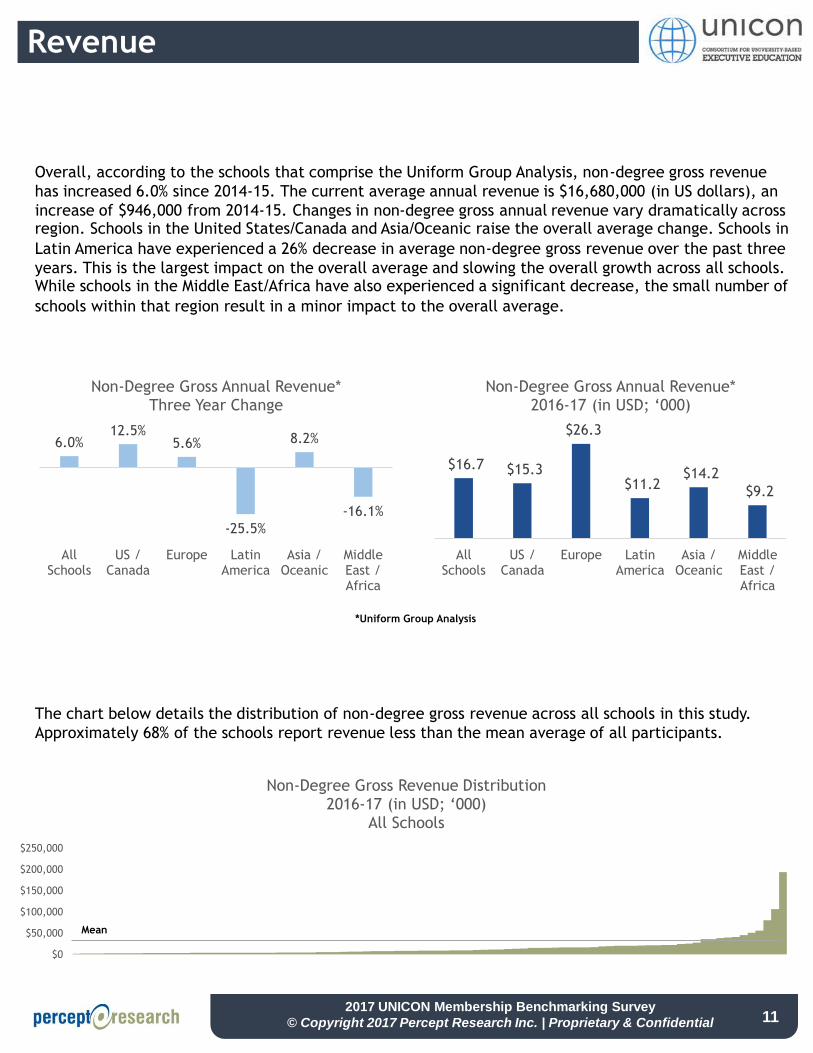
Overall, according to the schools that comprise the Uniform Group Analysis, non-degree gross revenue
has increased 6.0% since 2014-15. The current average annual revenue is $16,680,000 (in US dollars), an
increase of $946,000 from 2014-15. Changes in non-degree gross annual revenue vary dramatically across region. Schools in the United States/Canada and Asia/Oceanic raise the overall average change. Schools in
Latin America have experienced a 26% decrease in average non-degree gross revenue over the past three
years. This is the largest impact on the overall average and slowing the overall growth across all schools. While schools in the Middle East/Africa have also experienced a significant decrease, the small number of
schools within that region result in a minor impact to the overall average.
6.0%12.5%
5.6%
-25.5%
8.2%
-16.1%
AllSchools
US /Canada
Europe LatinAmerica
Asia /Oceanic
MiddleEast /Africa
Non-Degree Gross Annual Revenue*Three Year Change
$16.7 $15.3
$26.3
$11.2 $14.2
$9.2
AllSchools
US /Canada
Europe LatinAmerica
Asia /Oceanic
MiddleEast /Africa
Non-Degree Gross Annual Revenue*2016-17 (in USD; ‘000)
*Uniform Group Analysis
The chart below details the distribution of non-degree gross revenue across all schools in this study.
Approximately 68% of the schools report revenue less than the mean average of all participants.
$0
$50,000
$100,000
$150,000
$200,000
$250,000
Non-Degree Gross Revenue Distribution2016-17 (in USD; ‘000)
All Schools
Mean
2017 UNICON Membership Benchmarking Survey
© Copyright 2017 Percept Research Inc. | Proprietary & Confidential
Revenue
12
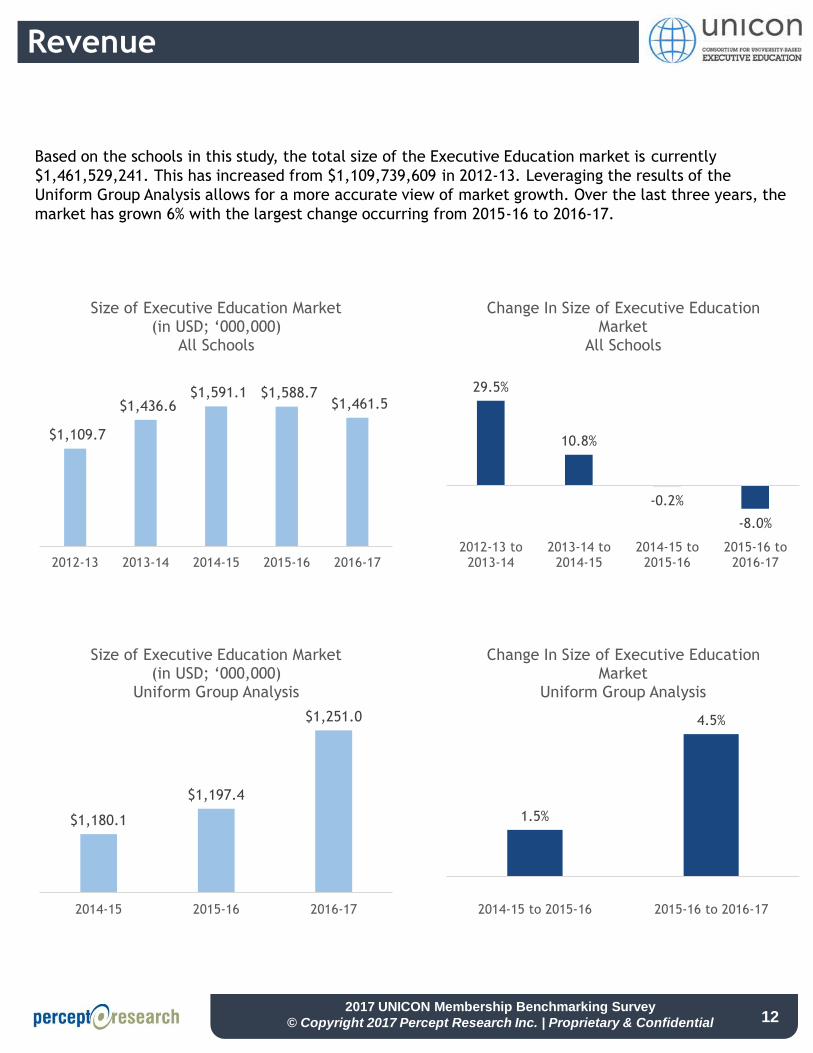
Based on the schools in this study, the total size of the Executive Education market is currently
$1,461,529,241. This has increased from $1,109,739,609 in 2012-13. Leveraging the results of the
Uniform Group Analysis allows for a more accurate view of market growth. Over the last three years, the
market has grown 6% with the largest change occurring from 2015-16 to 2016-17.
$1,109.7
$1,436.6 $1,591.1 $1,588.7
$1,461.5
2012-13 2013-14 2014-15 2015-16 2016-17
Size of Executive Education Market(in USD; ‘000,000)
All Schools
29.5%
10.8%
-0.2%
-8.0%
2012-13 to2013-14
2013-14 to2014-15
2014-15 to2015-16
2015-16 to2016-17
Change In Size of Executive Education Market
All Schools
$1,180.1
$1,197.4
$1,251.0
2014-15 2015-16 2016-17
Size of Executive Education Market(in USD; ‘000,000)
Uniform Group Analysis
1.5%
4.5%
2014-15 to 2015-16 2015-16 to 2016-17
Change In Size of Executive Education Market
Uniform Group Analysis
2017 UNICON Membership Benchmarking Survey
© Copyright 2017 Percept Research Inc. | Proprietary & Confidential
Revenue
13
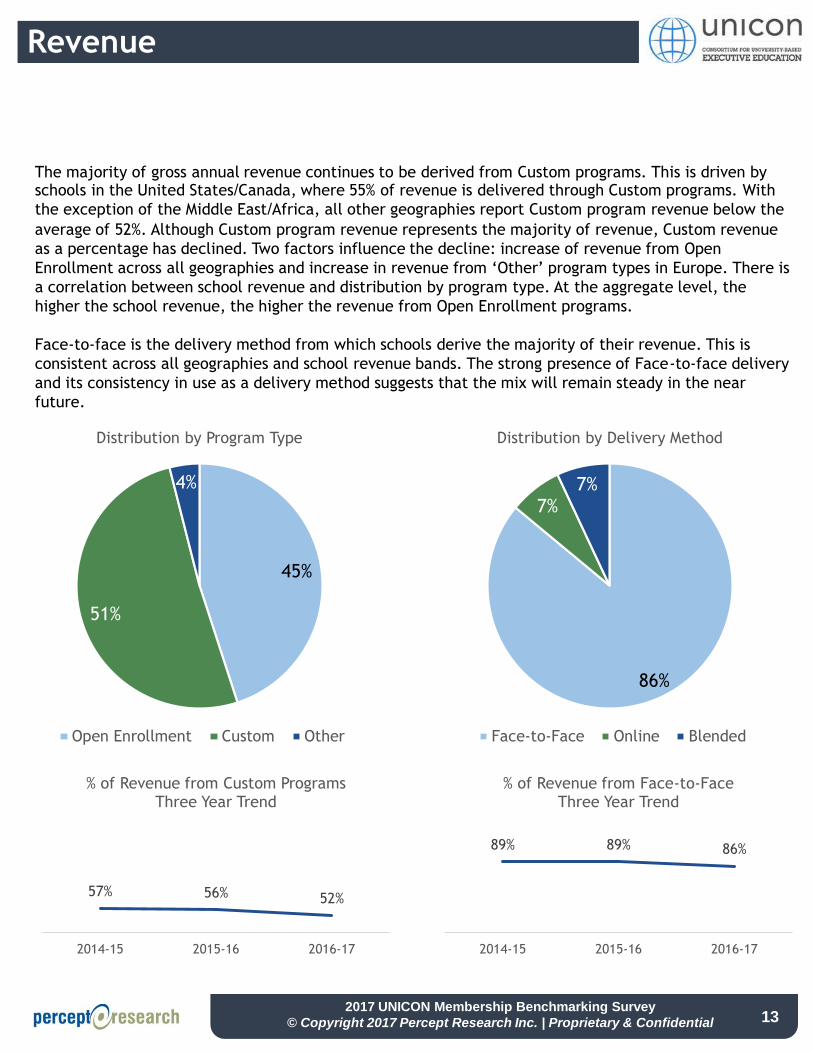
The majority of gross annual revenue continues to be derived from Custom programs. This is driven by schools in the United States/Canada, where 55% of revenue is delivered through Custom programs. With
the exception of the Middle East/Africa, all other geographies report Custom program revenue below the
average of 52%. Although Custom program revenue represents the majority of revenue, Custom revenue
as a percentage has declined. Two factors influence the decline: increase of revenue from Open
Enrollment across all geographies and increase in revenue from ‘Other’ program types in Europe. There is
a correlation between school revenue and distribution by program type. At the aggregate level, the
higher the school revenue, the higher the revenue from Open Enrollment programs.
Face-to-face is the delivery method from which schools derive the majority of their revenue. This is
consistent across all geographies and school revenue bands. The strong presence of Face-to-face delivery
and its consistency in use as a delivery method suggests that the mix will remain steady in the near
future.
45%
51%
4%
Distribution by Program Type
Open Enrollment Custom Other
86%
7%7%
Distribution by Delivery Method
Face-to-Face Online Blended
57% 56% 52%
2014-15 2015-16 2016-17
% of Revenue from Custom ProgramsThree Year Trend
89% 89% 86%
2014-15 2015-16 2016-17
% of Revenue from Face-to-FaceThree Year Trend
2017 UNICON Membership Benchmarking Survey
© Copyright 2017 Percept Research Inc. | Proprietary & Confidential
Full Time Equivalents (FTEs)
14
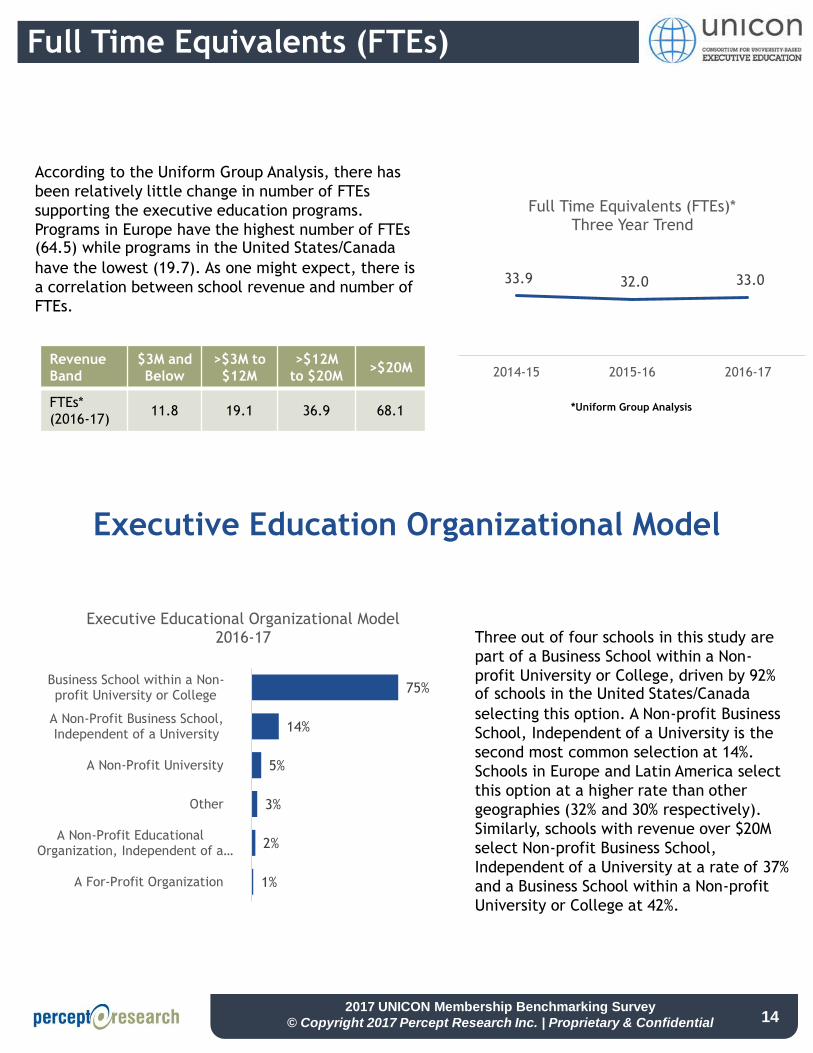
According to the Uniform Group Analysis, there has
been relatively little change in number of FTEs
supporting the executive education programs.
Programs in Europe have the highest number of FTEs (64.5) while programs in the United States/Canada
have the lowest (19.7). As one might expect, there is
a correlation between school revenue and number of
FTEs.
33.9 32.0 33.0
2014-15 2015-16 2016-17
Full Time Equivalents (FTEs)*Three Year Trend
*Uniform Group Analysis
Revenue
Band
$3M and
Below
>$3M to
$12M
>$12M
to $20M>$20M
FTEs*
(2016-17)11.8 19.1 36.9 68.1
Executive Education Organizational Model
1%
2%
3%
5%
14%
75%
A For-Profit Organization
A Non-Profit EducationalOrganization, Independent of a…
Other
A Non-Profit University
A Non-Profit Business School,Independent of a University
Business School within a Non-profit University or College
Executive Educational Organizational Model2016-17 Three out of four schools in this study are
part of a Business School within a Non-
profit University or College, driven by 92% of schools in the United States/Canada
selecting this option. A Non-profit Business
School, Independent of a University is the
second most common selection at 14%.
Schools in Europe and Latin America select
this option at a higher rate than other
geographies (32% and 30% respectively).
Similarly, schools with revenue over $20M
select Non-profit Business School,
Independent of a University at a rate of 37%
and a Business School within a Non-profit
University or College at 42%.
2017 UNICON Membership Benchmarking Survey
© Copyright 2017 Percept Research Inc. | Proprietary & Confidential
External Relationships
15
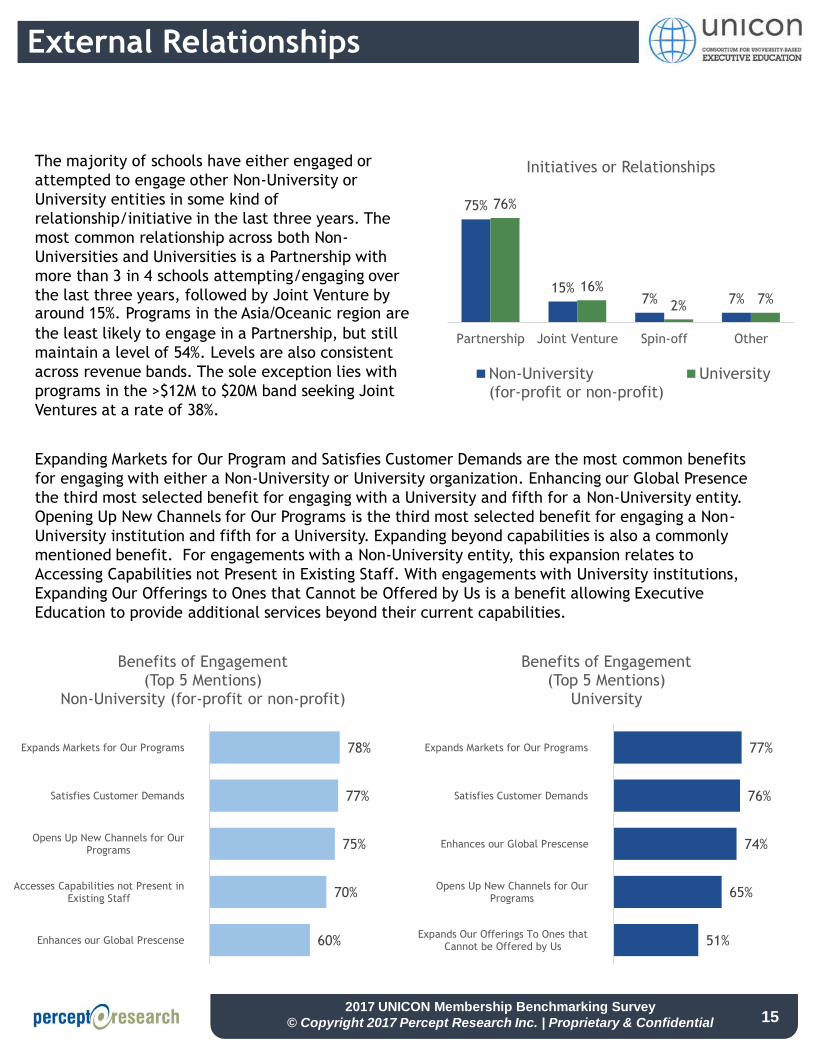
The majority of schools have either engaged or
attempted to engage other Non-University or
University entities in some kind of
relationship/initiative in the last three years. The
most common relationship across both Non-
Universities and Universities is a Partnership with
more than 3 in 4 schools attempting/engaging over
the last three years, followed by Joint Venture by around 15%. Programs in the Asia/Oceanic region are
the least likely to engage in a Partnership, but still
maintain a level of 54%. Levels are also consistent
across revenue bands. The sole exception lies with
programs in the >$12M to $20M band seeking Joint
Ventures at a rate of 38%.
60%
70%
75%
77%
78%
Enhances our Global Prescense
Accesses Capabilities not Present inExisting Staff
Opens Up New Channels for OurPrograms
Satisfies Customer Demands
Expands Markets for Our Programs
Benefits of Engagement(Top 5 Mentions)
Non-University (for-profit or non-profit)
75%
15%7% 7%
76%
16%
2%7%
Partnership Joint Venture Spin-off Other
Initiatives or Relationships
Non-University(for-profit or non-profit)
University
51%
65%
74%
76%
77%
Expands Our Offerings To Ones thatCannot be Offered by Us
Opens Up New Channels for OurPrograms
Enhances our Global Prescense
Satisfies Customer Demands
Expands Markets for Our Programs
Benefits of Engagement(Top 5 Mentions)
University
Expanding Markets for Our Program and Satisfies Customer Demands are the most common benefits
for engaging with either a Non-University or University organization. Enhancing our Global Presence
the third most selected benefit for engaging with a University and fifth for a Non-University entity.
Opening Up New Channels for Our Programs is the third most selected benefit for engaging a Non-
University institution and fifth for a University. Expanding beyond capabilities is also a commonly
mentioned benefit. For engagements with a Non-University entity, this expansion relates to
Accessing Capabilities not Present in Existing Staff. With engagements with University institutions,
Expanding Our Offerings to Ones that Cannot be Offered by Us is a benefit allowing Executive
Education to provide additional services beyond their current capabilities.
2017 UNICON Membership Benchmarking Survey
© Copyright 2017 Percept Research Inc. | Proprietary & Confidential
Open Enrollment Programs
16
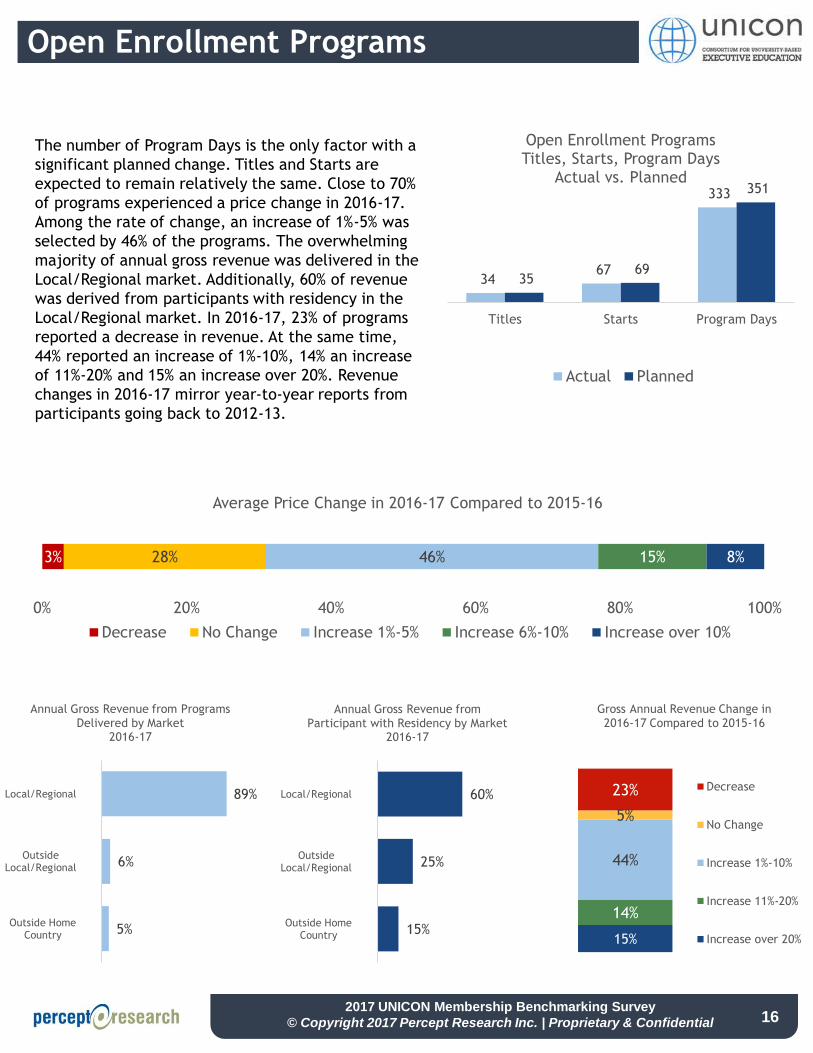
The number of Program Days is the only factor with a
significant planned change. Titles and Starts are
expected to remain relatively the same. Close to 70%
of programs experienced a price change in 2016-17.
Among the rate of change, an increase of 1%-5% was
selected by 46% of the programs. The overwhelming
majority of annual gross revenue was delivered in the
Local/Regional market. Additionally, 60% of revenue
was derived from participants with residency in the
Local/Regional market. In 2016-17, 23% of programs
reported a decrease in revenue. At the same time,
44% reported an increase of 1%-10%, 14% an increase
of 11%-20% and 15% an increase over 20%. Revenue
changes in 2016-17 mirror year-to-year reports from
participants going back to 2012-13.
5%
6%
89%
Outside HomeCountry
OutsideLocal/Regional
Local/Regional
Annual Gross Revenue from Programs
Delivered by Market2016-17
34 67
333
35 69
351
Titles Starts Program Days
Open Enrollment ProgramsTitles, Starts, Program Days
Actual vs. Planned
Actual Planned
3% 28% 46% 15% 8%
0% 20% 40% 60% 80% 100%
Average Price Change in 2016-17 Compared to 2015-16
Decrease No Change Increase 1%-5% Increase 6%-10% Increase over 10%
15%
25%
60%
Outside HomeCountry
OutsideLocal/Regional
Local/Regional
Annual Gross Revenue from
Participant with Residency by Market2016-17
15%
14%
44%
5%
23%
Gross Annual Revenue Change in
2016-17 Compared to 2015-16
Decrease
No Change
Increase 1%-10%
Increase 11%-20%
Increase over 20%
2017 UNICON Membership Benchmarking Survey
© Copyright 2017 Percept Research Inc. | Proprietary & Confidential
Custom Programs
17
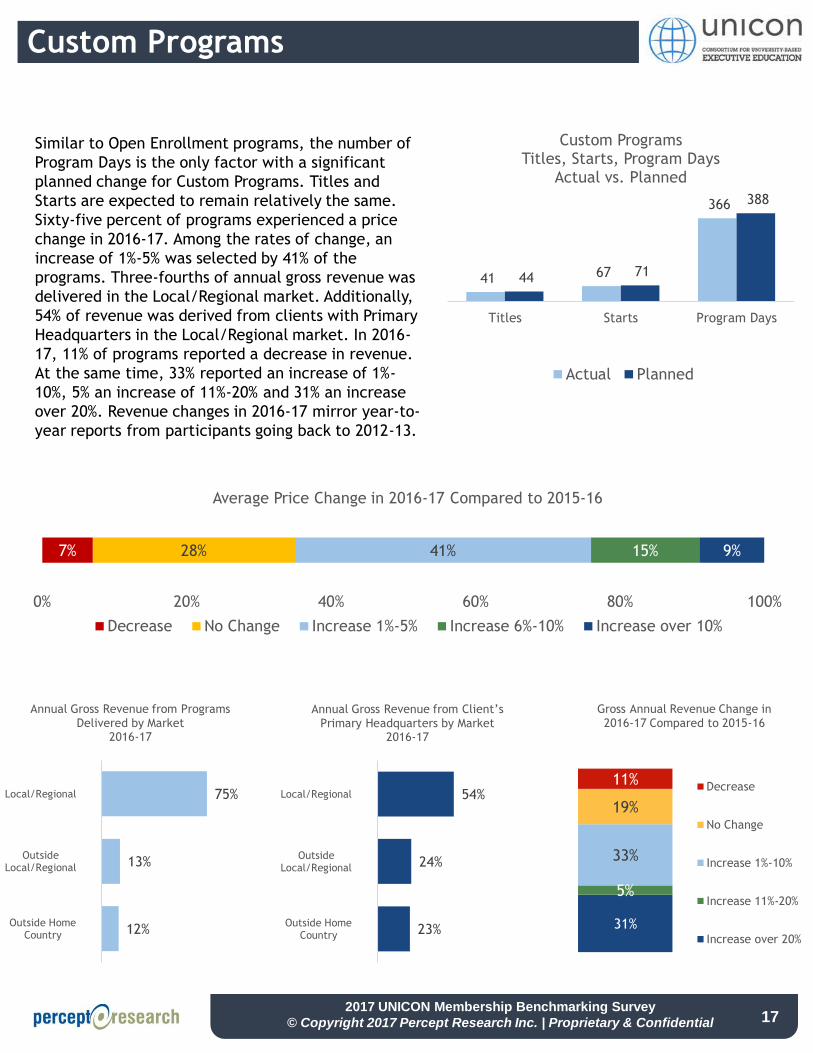
Similar to Open Enrollment programs, the number of
Program Days is the only factor with a significant
planned change for Custom Programs. Titles and
Starts are expected to remain relatively the same.
Sixty-five percent of programs experienced a price
change in 2016-17. Among the rates of change, an
increase of 1%-5% was selected by 41% of the
programs. Three-fourths of annual gross revenue was
delivered in the Local/Regional market. Additionally,
54% of revenue was derived from clients with Primary
Headquarters in the Local/Regional market. In 2016-
17, 11% of programs reported a decrease in revenue.
At the same time, 33% reported an increase of 1%-
10%, 5% an increase of 11%-20% and 31% an increase
over 20%. Revenue changes in 2016-17 mirror year-to-
year reports from participants going back to 2012-13.
12%
13%
75%
Outside HomeCountry
OutsideLocal/Regional
Local/Regional
Annual Gross Revenue from Programs
Delivered by Market2016-17
41 67
366
44 71
388
Titles Starts Program Days
Custom ProgramsTitles, Starts, Program Days
Actual vs. Planned
Actual Planned
7% 28% 41% 15% 9%
0% 20% 40% 60% 80% 100%
Average Price Change in 2016-17 Compared to 2015-16
Decrease No Change Increase 1%-5% Increase 6%-10% Increase over 10%
23%
24%
54%
Outside HomeCountry
OutsideLocal/Regional
Local/Regional
Annual Gross Revenue from Client’s
Primary Headquarters by Market2016-17
31%
5%
33%
19%
11%
Gross Annual Revenue Change in
2016-17 Compared to 2015-16
Decrease
No Change
Increase 1%-10%
Increase 11%-20%
Increase over 20%
2017 UNICON Membership Benchmarking Survey
© Copyright 2017 Percept Research Inc. | Proprietary & Confidential
Appendices
18

2017 UNICON Membership Benchmarking Survey
© Copyright 2017 Percept Research Inc. | Proprietary & Confidential
Appendix A:
Survey Respondents
19
2017 UNICON Membership Benchmarking Survey
© Copyright 2017 Percept Research Inc. | Proprietary & Confidential
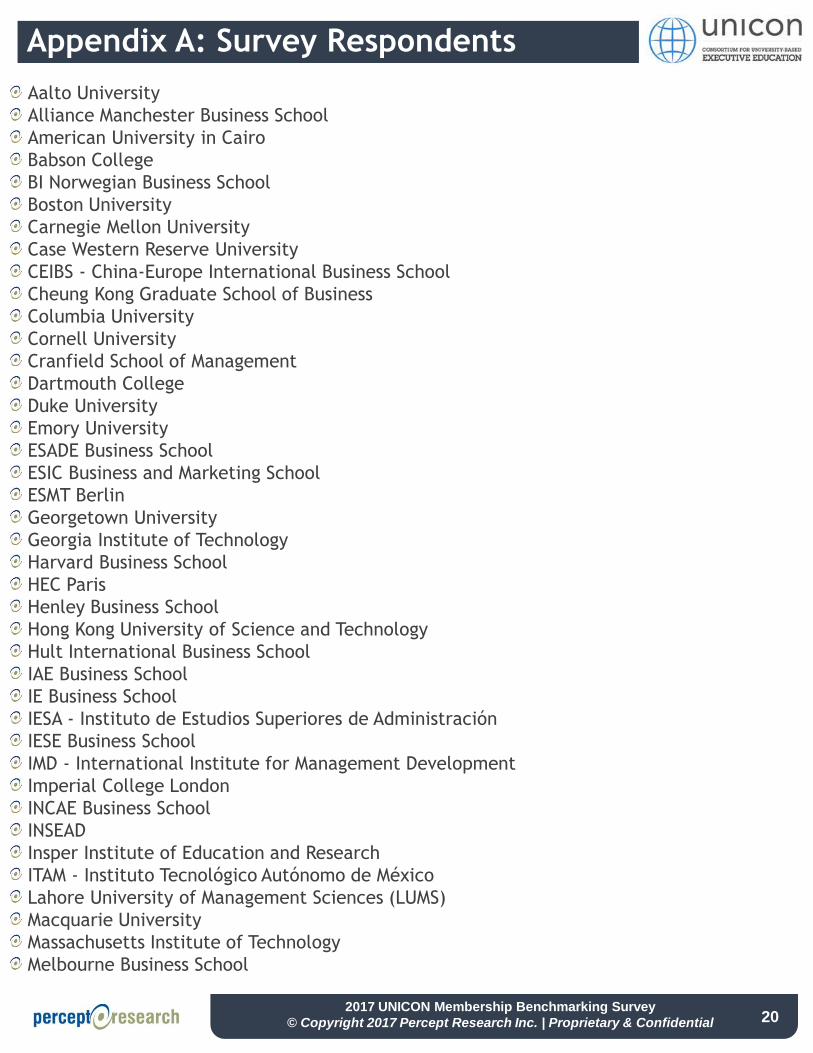
Appendix A: Survey Respondents
Aalto University
Alliance Manchester Business School
American University in Cairo
Babson College
BI Norwegian Business School
Boston University
Carnegie Mellon University
Case Western Reserve University
CEIBS - China-Europe International Business School
Cheung Kong Graduate School of Business
Columbia University
Cornell University
Cranfield School of Management
Dartmouth College
Duke University
Emory University
ESADE Business School
ESIC Business and Marketing School
ESMT Berlin
Georgetown University
Georgia Institute of Technology
Harvard Business School
HEC Paris
Henley Business School
Hong Kong University of Science and Technology
Hult International Business School
IAE Business School
IE Business School
IESA - Instituto de Estudios Superiores de Administración
IESE Business School
IMD - International Institute for Management Development
Imperial College London
INCAE Business School
INSEAD
Insper Institute of Education and Research
ITAM - Instituto Tecnológico Autónomo de México
Lahore University of Management Sciences (LUMS)
Macquarie University
Massachusetts Institute of Technology
Melbourne Business School
20
2017 UNICON Membership Benchmarking Survey
© Copyright 2017 Percept Research Inc. | Proprietary & Confidential
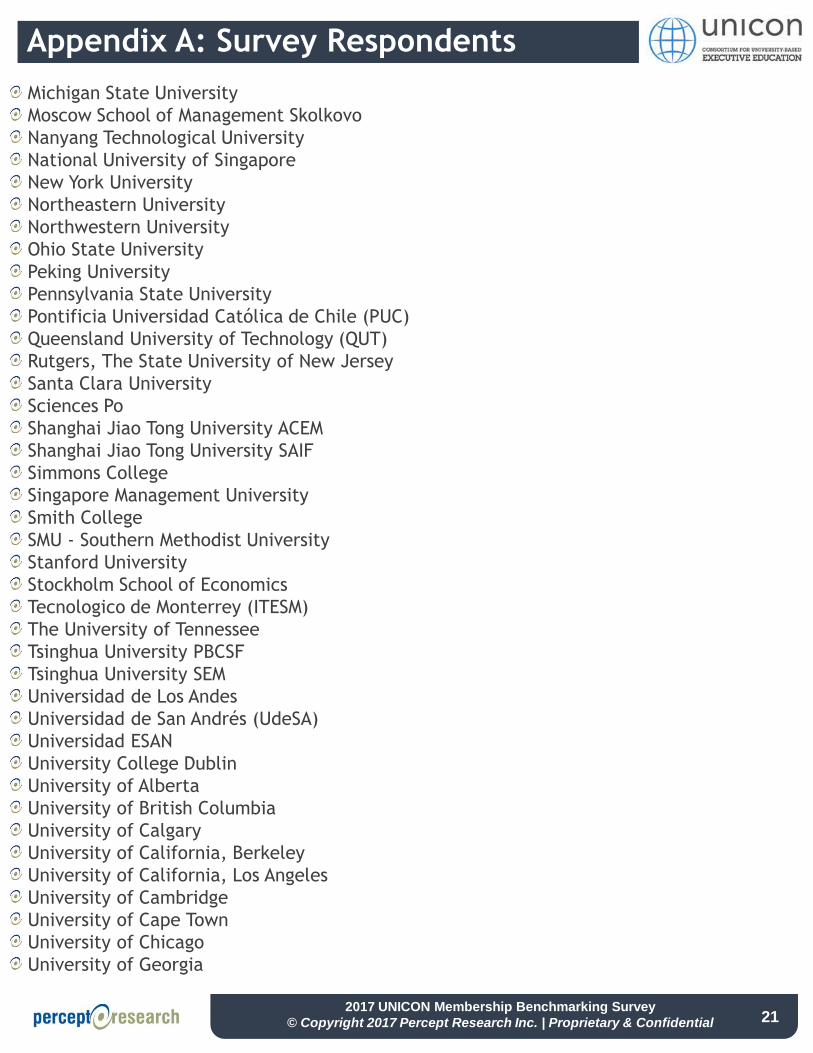
Appendix A: Survey Respondents
Michigan State University
Moscow School of Management Skolkovo
Nanyang Technological University
National University of Singapore
New York University
Northeastern University
Northwestern University
Ohio State University
Peking University
Pennsylvania State University
Pontificia Universidad Católica de Chile (PUC)
Queensland University of Technology (QUT)
Rutgers, The State University of New Jersey
Santa Clara University
Sciences Po
Shanghai Jiao Tong University ACEM
Shanghai Jiao Tong University SAIF
Simmons College
Singapore Management University
Smith College
SMU - Southern Methodist University
Stanford University
Stockholm School of Economics
Tecnologico de Monterrey (ITESM)
The University of Tennessee
Tsinghua University PBCSF
Tsinghua University SEM
Universidad de Los Andes
Universidad de San Andrés (UdeSA)
Universidad ESAN
University College Dublin
University of Alberta
University of British Columbia
University of Calgary
University of California, Berkeley
University of California, Los Angeles
University of Cambridge
University of Cape Town
University of Chicago
University of Georgia
21
2017 UNICON Membership Benchmarking Survey
© Copyright 2017 Percept Research Inc. | Proprietary & Confidential
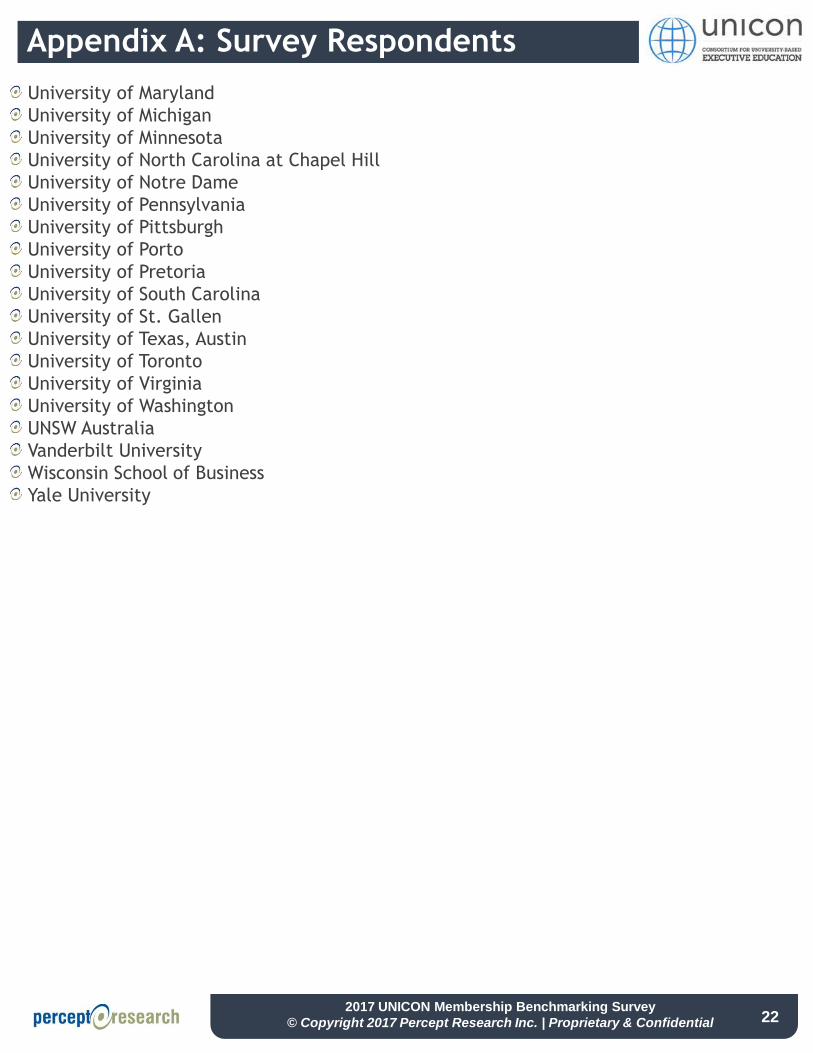
Appendix A: Survey Respondents
University of Maryland
University of Michigan
University of Minnesota
University of North Carolina at Chapel Hill
University of Notre Dame
University of Pennsylvania
University of Pittsburgh
University of Porto
University of Pretoria
University of South Carolina
University of St. Gallen
University of Texas, Austin
University of Toronto
University of Virginia
University of Washington
UNSW Australia
Vanderbilt University
Wisconsin School of Business
Yale University
22

2017 UNICON Membership Benchmarking Survey
© Copyright 2017 Percept Research Inc. | Proprietary & Confidential
Appendix B:
Survey Questionnaire
23
Separate Document Provided
2017 UNICON Membership Benchmarking Survey
© Copyright 2017 Percept Research Inc. | Proprietary & Confidential
Appendix C:
Currency Exchange Rates
24

2017 UNICON Membership Benchmarking Survey
© Copyright 2017 Percept Research Inc. | Proprietary & Confidential
Appendix C: Currency Exchange Rates
Annual average (2016) exchange rates used to convert revenues
into U.S. dollars for 2016-17 data
25
*Multiplied by local currency to convert to USD
Source: www.irs.gov
Currency Rate*
US Dollars 1.000
Canadian Dollars 0.725
British Pounds 1.299
Euros 1.064
Brazilian Reais 0.275
Argentinian Pesos 0.065
Australian Dollars 0.714
Chinese Yuan 0.145
Hong Kong Dollars 0.124
Indian Rupees 0.014
Japanese Yen 0.009
Mexican Pesos 0.051
New Zealand Dollars 0.669
Russian Rubles 0.014
Saudi Arabian Riyals 0.256
South African Rand 0.065
South Korean Won 0.001
2017 UNICON Membership Benchmarking Survey
© Copyright 2017 Percept Research Inc. | Proprietary & Confidential
Appendix D:
Peer Report Excerpts
26
2017 UNICON Membership Benchmarking Survey
© Copyright 2017 Percept Research Inc. | Proprietary & Confidential
Appendix D: Peer Report Excerpts
27
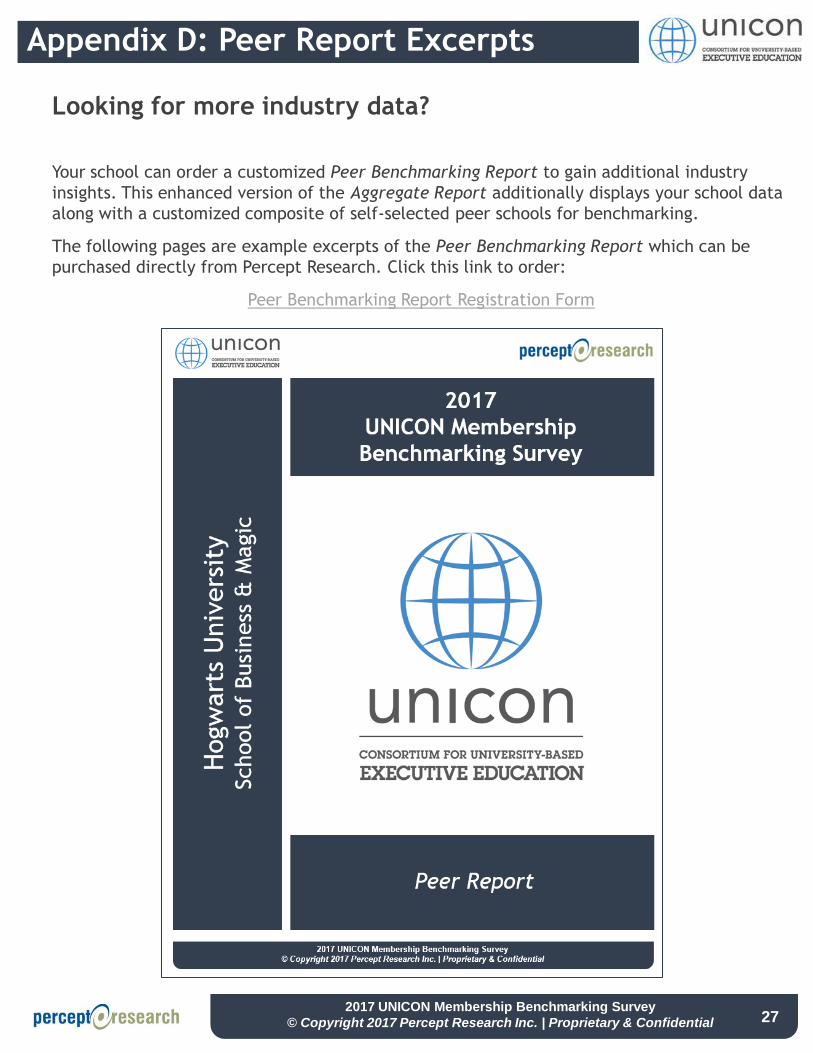
Looking for more industry data?
Your school can order a customized Peer Benchmarking Report to gain additional industry
insights. This enhanced version of the Aggregate Report additionally displays your school data
along with a customized composite of self-selected peer schools for benchmarking.
The following pages are example excerpts of the Peer Benchmarking Report which can be
purchased directly from Percept Research. Click this link to order:
Peer Benchmarking Report Registration Form
2017 UNICON Membership Benchmarking Survey
© Copyright 2017 Percept Research Inc. | Proprietary & Confidential
6%
3%
1%
100%
20%
38%
40%
36%
100%
25%
36%
33%
38%
100%
75%
75%
80%
14%
15%
19%
25%
7%
9%
6%
All Schools 2014-15
All Schools 2015-16
All Schools 2016-17
Your School 2014-15
Your School 2015-16
Your School 2016-17
Peer Composite 2014-15
Peer Composite 2015-16
Peer Composite 2016-17
0% 20% 40% 60% 80% 100%
Decrease No Change Increase 1%-5%
Increase 6%-10% Increase over 10%
Appendix D: Peer Report Excerpts
28
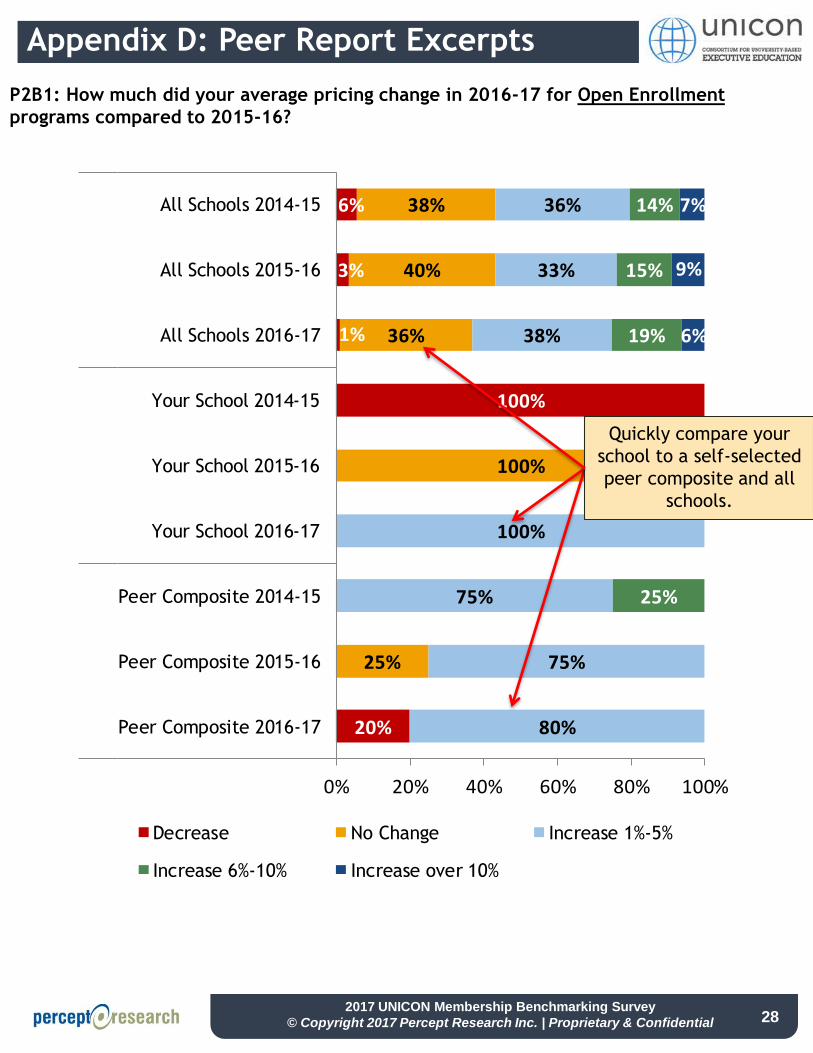
P2B1: How much did your average pricing change in 2016-17 for Open Enrollment
programs compared to 2015-16?
Quickly compare your
school to a self-selected
peer composite and all
schools.
2017 UNICON Membership Benchmarking Survey
© Copyright 2017 Percept Research Inc. | Proprietary & Confidential
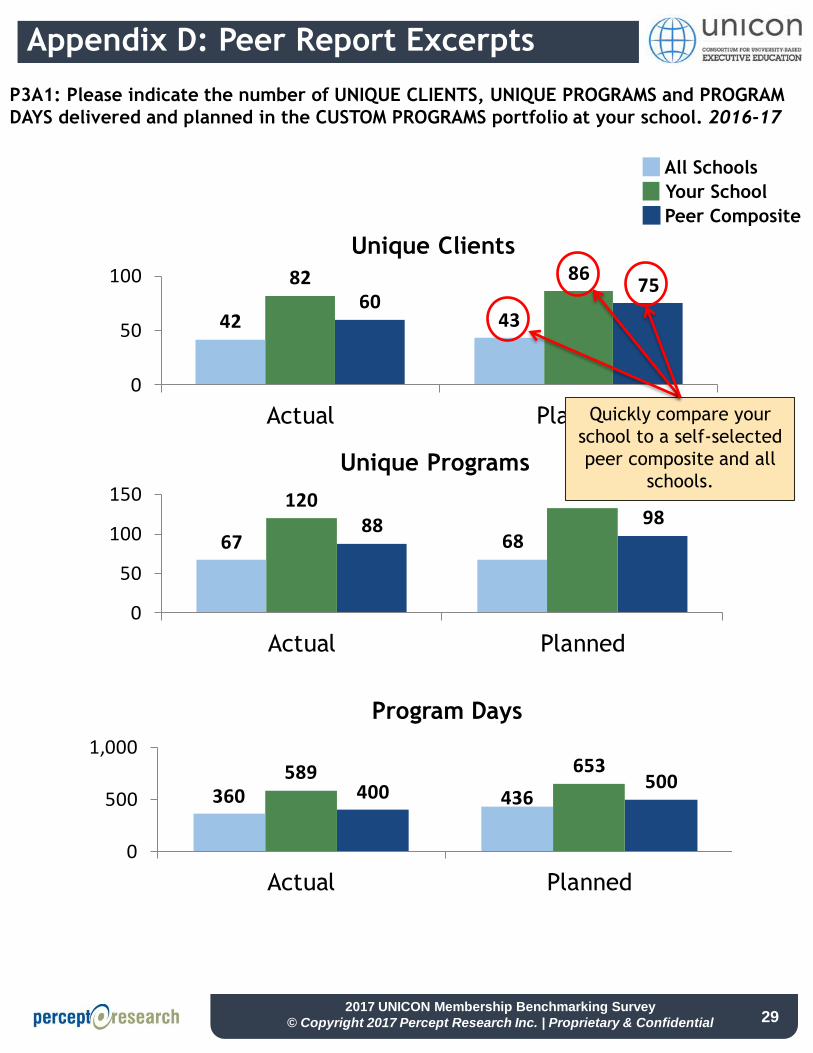
9888
133120
6867
PlannedActual
0
50
100
150
Unique Programs
7560
8682
4342
PlannedActual
0
50
100
Unique Clients
P3A1: Please indicate the number of UNIQUE CLIENTS, UNIQUE PROGRAMS and PROGRAM
DAYS delivered and planned in the CUSTOM PROGRAMS portfolio at your school. 2016-17
All Schools
Your School
Peer Composite
Appendix D: Peer Report Excerpts
29
Quickly compare your
school to a self-selected
peer composite and all
schools.
500400
653589436360
PlannedActual
0
500
1,000
Program Days

2017 UNICON Membership Benchmarking Survey
© Copyright 2017 Percept Research Inc. | Proprietary & Confidential
Appendix E:
About Percept Research
30
2017 UNICON Membership Benchmarking Survey
© Copyright 2017 Percept Research Inc. | Proprietary & ConfidentialR E S U LT S T H AT D R I V E C H A N G E / / / /
About Percept Research
twitter.com/perceptresearch
Our consultant team has decades of experience in every aspect of the delivery of graduate management degree
and non-degree programs, using data-driven, collaborative approaches to assess your challenges and devise the
most effective and efficient strategies. The administrative and faculty experience of our consultant team can be
leveraged to advocate for change so you can create buy-in and unify your colleagues around those strategies.
Contact us to learn how your school can stay ahead and grow through stakeholder-centered innovation.
Custom Market
Research
http://bschoolresear.ch/customresearch
• Admissions Funnel Assessment
• Brand Positioning Assessment (Image & Awareness)
• Competitive Secondary Analysis
• Focus Groups (Internal & External)
• Identity & Naming Assessment
• In-Depth Interviews
• Product Expansion Feasibility (Attitude & Usage)
Marketing Communications
and Consulting
http://bschoolresear.ch/consulting
• Influential Testimonial Development
• Information Sessions Optimization
• Lead Nurturing
• Marketing Communications (messaging)
• Media Rankings Management
• Referral Programs Development
• Social Media Strategy
CONNECT AND STAY UPDATED WITH US
Subscribe to our blog for tips
and best practices in research
and marketing communications.
Stay up-to-date with the
graduate management industry
via our social networks.
bschoolresear.ch/blog
facebook.com/PerceptResearch
linkedin.com/company/percept-research
TURN INS IGHT INTO ACTION
bschoolresear.ch/home
2015 EMBA Council Membership Program Survey
Proprietary & Confidential
Do you have questions about this report
or suggestions for improvement?
Visit www.perceptresearch.com/UNICON/support
Instantly retrieve responses to FAQs and submit support/feature requests.
R E S U LT S T H AT D R I V E C H A N G E bschoolresear.ch/home/ / / /