Embed Size (px)
Citation preview
1
United States Natural c/o USDA Forest Service Department of Resources 11 Campus Boulevard Agriculture Conservation Suite 200 Service Newtown Square, PA 19073 (610) 557-4233; FAX: (610) 557-4200 Subject: ENG -- Electromagnetic Induction (EMI) Assistance Date: 18 April 2005 To: Joseph Delvecchio
State Conservationist USDA-NRCS,
The Galleries of Syracuse 441 South Salina Street, Suite 354 Syracuse, New York 13202-2450 Purpose: Electromagnetic induction was used to assess seepage and the structural integrity of animal waste storage pits in Cayuga, Cortland, Onondaga, and Seneca counties. A majority of the investigated animal waste storage pits were not designed by USDA-NRCS. Participants: Jim Doolittle, Research Soil Scientist, USDA-NRCS-NSSC, Newtown Square, PA Suzette Kocher, District Conservationist, USDA-NRCS, Cortland, NY Dave Sullivan, State Geologist, USDA-NRCS, Syracuse, NY Mary Thomas, District Conservationists, USDA-NRCS, LaFayette, NY Shannon Bozeat, Soil Conservation Technician, USDA-NRCS, Auburn, NY Ron Vanacore, District Conservationist, USDA-NRCS, Seneca Falls, NY Activities: All field activities were completed during on 28 March to 31 March 2005. Observations:
1. Results from this study suggest that EMI can be very useful for locating and mapping the extent of seepage and overflow of contaminants from manure pits.
2. Based on interpretation of spatial patterns of apparent conductivity (ECa) obtained from the EMI
surveys discussed in this report, seepage appears to be restricted to the embankment areas of most waste-holding structures. Based on these spatial patterns, most manure pits appear to be operating well. At some sites, patterns of higher ECa were attributed to overland flow of contaminants from manure pits, animal holding areas, and silage storage areas.
3. At many of the visited site, if present, patterns of seepage from the waste-holding facility were masked
by interference caused by farm structures, implements and trash. As waste-holding facilities are usually constructed near farm structures, the area available to conduct EMI surveys is often restricted. In addition, spatial patterns of ECa on one to three sides of most pits will show interference from these cultural features. On these sides of pits, the use of EMI produces ambiguous interpretations and its effectiveness is questionable.
4. Geophysical interpretations are considered preliminary estimates of site conditions. The results of
2
geophysical site investigations are interpretive and do not substitute for direct ground-truth observations (soil sampling). The use of geophysical methods can reduce the number of coring observations, direct their placement, and supplement their interpretations. Interpretations contained in this report should be verified by ground-truth observations.
It was my pleasure to work in New York and with members of your fine staff. With kind regards, James A. Doolittle Research Soil Scientist National Soil Survey Center cc: R. Ahrens, Director, USDA-USDA, National Soil Survey Center, Federal Building, Room 152,100 Centennial
Mall North, Lincoln, NE 68508-3866 S. Carpenter, MO Leader, USDA-NRCS, 75 High Street, Room 301, Morgantown, WV 26505 M. Golden, Director of Soils Survey Division, USDA-NRCS, Room 4250 South Building, 14th & Independence
Ave. SW, Washington, DC 20250 D. Hammer, National Leader for Soil Investigations, USDA-USDA, National Soil Survey Center, Federal
Building, Room 152,100 Centennial Mall North, Lincoln, NE 68508-3866 D. Sullivan, State Geologist, USDA-NRCS, The Galleries of Syracuse, 441 South Salina Street, Suite
354,Syracuse, New York 13202-2450 W. Tuttle, Soil Scientist (Geophysical), USDA-NRCS-NSSC, P.O. Box 60, Federal Building, Room G-08, 207
West Main Street, Wilkesboro, NC 28697 P. Wright, Supervisory Engineer, USDA-NRCS, The Galleries of Syracuse, 441 South Salina Street, Suite 354,
Syracuse, New York 13202-2450
3
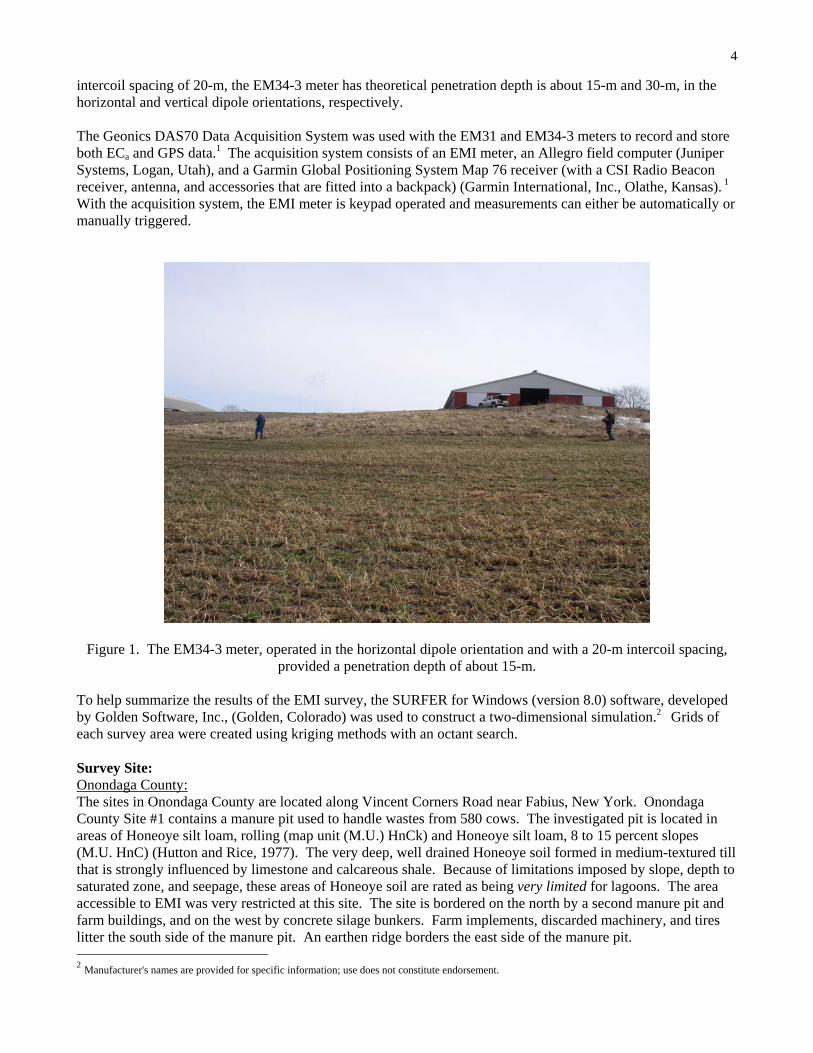
Background: Animal waste-holding facilities are an economical means of handling large quantities of wastes from confined livestock operations. Studies indicate that these structures self-seal within two to twelve months of operation (Swell et al., 1975; Miller et al., 1985). While the bulk perimeter area of these structures is though to self-seal, in some, a few isolated areas do not seal resulting in the discharge of contaminants. Brune and Doolittle (1990) describe these non-sealing events as being sporadic and unpredictable. Electromagnetic induction (EMI) is a noninvasive geophysical tool that has been used to assess seepage and the structural integrity of animal waste holding facilities. Advantages of EMI are its portability, speed of operation, flexible observation depths, and moderate resolution of subsurface features. Electromagnetic induction can provide in a relatively short time, the large number of observations required to detect contaminant plumes emanating from waste-storage facilities. Maps prepared from properly interpreted EMI data provide the basis for assessing site conditions, planning further investigations, and locating sampling or monitoring sites. Electromagnetic induction uses electromagnetic energy to measure the apparent conductivity (ECa) of earthen materials. Apparent conductivity is the weighted, average conductivity for a column of earthen materials (Greenhouse and Slaine, 1983). Variations in ECa are produced by changes in the electrical conductivity of earthen materials. Electrical conductivity is influenced by the volumetric water content, type and concentration of ions in solution, temperature and phase of the soil water, and amount and type of clays in the soil matrix (McNeill, 1980a). The ECa of earthen materials increases with increased soluble salt, water, and clay contents (Kachanoski et al., 1988; Rhoades et al., 1976). Electromagnetic induction measures vertical and lateral variations in ECa. Values of ECa are seldom diagnostic in themselves. However, lateral and vertical variations in ECa can be used to infer changes in soils and soil properties. Interpretations are based on the identification of spatial patterns within data sets. To assist interpretations, computer simulations are normally used. Electromagnetic induction has been used to investigate the migration of contaminants from animal-waste sites (Eigenberg et al., 1998; Drommerhausen, et al., 1995; Ranjan and Karthigesu, 1995; Radcliffe et al., 1994; Brune and Doolittle, 1990; Siegrist and Hargett, 1989; and Stierman and Ruedisili, 1988). Typically soils affected by animal wastes have higher ECa than soils that are unaffected by these contaminants. Electromagnetic induction has been used to infer the relative concentrations, extent, and movement of contaminants from waste-holding facilities. While EMI does not provide a direct measurement of specific ions or compounds, ECa has been correlated with concentrations of chloride, ammonia, and nitrate nitrogen in soils (Eigenberg et al., 1998; Ranjan and Karthigesu, 1995; Brune and Doolittle, 1990). Equipment: The EM31 and EM34-3 meters were used in this study. Geonics Limited (Mississauga, Ontario) manufactures the two meters.1 No ground contact is required with either meter. Lateral resolution is approximately equal to the intercoil spacing. McNeill (1980b) has described the principles of operation of the EM31 meter. The EM31 meter has a 3.66-m intercoil spacing and operates at a frequency of 9,810 Hz. When placed on the soil surface, the EM31 meter provides theoretical penetration depths of about 3-m and 6-m in the horizontal and vertical dipole orientations, respectively (McNeill, 1980b). Geonics Limited (1990) describes the operation of the EM34-3 meter. The EM34-3 meter consists of a receiver and transmitter coil, three reference cables (10, 20, and 30 m), a receiver and transmitter console. In this investigation, the EM34-3 meter was used in the horizontal dipole orientation with a 20-m intercoil spacing (Figure 1). With a 20-m intercoil spacing, the EM34-3 meter operates at a frequency of 1,600 Hz. With an
1 Manufacturer's names are provided for specific information; use does not constitute endorsement.
4
intercoil spacing of 20-m, the EM34-3 meter has theoretical penetration depth is about 15-m and 30-m, in the horizontal and vertical dipole orientations, respectively. The Geonics DAS70 Data Acquisition System was used with the EM31 and EM34-3 meters to record and store both ECa and GPS data.1 The acquisition system consists of an EMI meter, an Allegro field computer (Juniper Systems, Logan, Utah), and a Garmin Global Positioning System Map 76 receiver (with a CSI Radio Beacon receiver, antenna, and accessories that are fitted into a backpack) (Garmin International, Inc., Olathe, Kansas). 1 With the acquisition system, the EMI meter is keypad operated and measurements can either be automatically or manually triggered.
Figure 1. The EM34-3 meter, operated in the horizontal dipole orientation and with a 20-m intercoil spacing, provided a penetration depth of about 15-m.
To help summarize the results of the EMI survey, the SURFER for Windows (version 8.0) software, developed by Golden Software, Inc., (Golden, Colorado) was used to construct a two-dimensional simulation.2 Grids of each survey area were created using kriging methods with an octant search. Survey Site: Onondaga County: The sites in Onondaga County are located along Vincent Corners Road near Fabius, New York. Onondaga County Site #1 contains a manure pit used to handle wastes from 580 cows. The investigated pit is located in areas of Honeoye silt loam, rolling (map unit (M.U.) HnCk) and Honeoye silt loam, 8 to 15 percent slopes (M.U. HnC) (Hutton and Rice, 1977). The very deep, well drained Honeoye soil formed in medium-textured till that is strongly influenced by limestone and calcareous shale. Because of limitations imposed by slope, depth to saturated zone, and seepage, these areas of Honeoye soil are rated as being very limited for lagoons. The area accessible to EMI was very restricted at this site. The site is bordered on the north by a second manure pit and farm buildings, and on the west by concrete silage bunkers. Farm implements, discarded machinery, and tires litter the south side of the manure pit. An earthen ridge borders the east side of the manure pit. 2 Manufacturer's names are provided for specific information; use does not constitute endorsement.
5
Onondaga County Site #2 consists of a manure storage structure, which provides 10-month storage for about 110 yearlings and 80 dry cows. The structure is located in areas of Howard gravelly silt loam, 0 to 3 percent slopes (M.U. HyA), and Teel silt loam (M.U. Te) (Hutton and Rice, 1977). The very deep, well drained and somewhat excessively drained Howard soil formed in medium-textured glacial outwash deposits. The very deep, moderately well drained Teel soil formed in silty alluvial deposits. Because of limitations imposed by seepage in Howard soil and flooding, depth to saturated zone and seepage in Teel soil, these soils are rated as being very limited for lagoons. The area accessible to EMI was restricted on three sides of the structure. Vincent Corners Road borders the survey area on the west. Overhead and buried utility lines parallel this road and the western boundary of the survey area. A farm building borders the southern side of the manure pit. The east side of the pit contains heavily disturbed and uneven earthen materials. Cayuga County: Cayuga County Site # 1 is located along Moshor Road in Scipio Township. The structure is located in an area of Honeoye silt loam, 2 to 8 percent slopes (M.U. HnB), and Kendaia and Lyons silt loams, 0 to 3 percent slopes (M.U. KlA) (Hutton, 1971). The very deep, poorly and very poorly drained Lyons, somewhat poorly drained Kendaia, and well drained Honeoye soils formed in medium-textured till that is strongly influenced by limestone and calcareous shale. Because of limitations imposed by slope, depth to saturated zone, and seepage, areas of Honeoye soil are rated as being somewhat limited for lagoons. Because of limitations imposed by ponding, depth to saturated zone, and seepage, areas of Kendaia and Lyons soils are rated as being very limited for lagoons. Large barns bordered the east and southeast portions of the survey area. Farm implements and trash littered the area to the immediate north of the manure pit. The survey area was unrestricted in open fields located to the west and northwest. Cayuga County Site # 2 is located along Saxton Road in Venice Township. The structure is located in an area of Honeoye silt loam, 2 to 8 percent slopes (M. U. HnB), and Lima silt loam, 0 to 3 percent slopes (M.U. LtA) (Hutton, 1971). Because of limitations imposed by slope, depth to saturated zone, and seepage, these soils are rated as being somewhat limited for lagoons. The area accessible to EMI was restricted all sides. Saxton Road borders the survey area on the north. Overhead and buried utility lines parallel this road and the northern boundary of the survey area. Large barns closely parallel the east and west borders of the survey area. To the south, additional farm buildings and heavily disturbed and uneven grounds limited the survey. Seneca County: The two sites are located south southeast of Seneca Falls near Canoga Springs. These two waste storage structures were not designed by USDA-NRCS. Seneca County Site #1 is located in an area of Odessa silt loam, 0 to 2 percent slopes (M.U. OdA) and Schoharie silty clay loam, 2 to 6 percent slopes (M.U. ShB) (Hutton, 1972). The very deep, somewhat poorly drained Odessa and moderately well drained Schoharie soils formed in fine-textured lacustrine deposits. Because of limitations imposed by the depth to a saturated zone, areas of Odessa soil are rated as being very limited for lagoons. Because of limitations imposed by slope and depth to a saturated zone, areas of Schoharie soil are rated as being somewhat limited for lagoons. The presence of farm structures and implements restricted the survey area at Seneca County Site #1 (Figure 2). The site is bounded on the north by concrete silage bunkers and on the south and east by large barns. The survey area was open to the west. However, electric fences limited access to this area (to the west). Seneca County Site #2 is located in an open field that is bordered on the north by a woodlot. Seneca County Site #2 is located principally in an area of Dunkirk silt loam, 1 to 6 percent slopes (M.U. DuB), which is bordered on the south and southwest by areas of Dunkirk silt loam, 12 to 20 percent slopes (M. U. DuD) and Dunkirk silt loam, 6 to 12 percent slopes, eroded (M.U. DuC3), respectively (Hutton, 1972). The very deep, well drained Dunkirk soil formed in medium-textured glacio-lacustrine sediments. Because of limitations imposed by slope and seepage, areas of Dunkirk soil on 1 to 6 percent slopes are rated as being somewhat limited for lagoons. However, areas of Dunkirk soils on slopes greater than 6 percent are rated as being very limited for lagoons because of slope and seepage concerns. With the exception of the woodlot (located north of the pit), which was littered with metallic debris and farm implements, all sides of this pit were accessible to
6
EMI. An intermittent stream forms most of the southern border to the survey area.
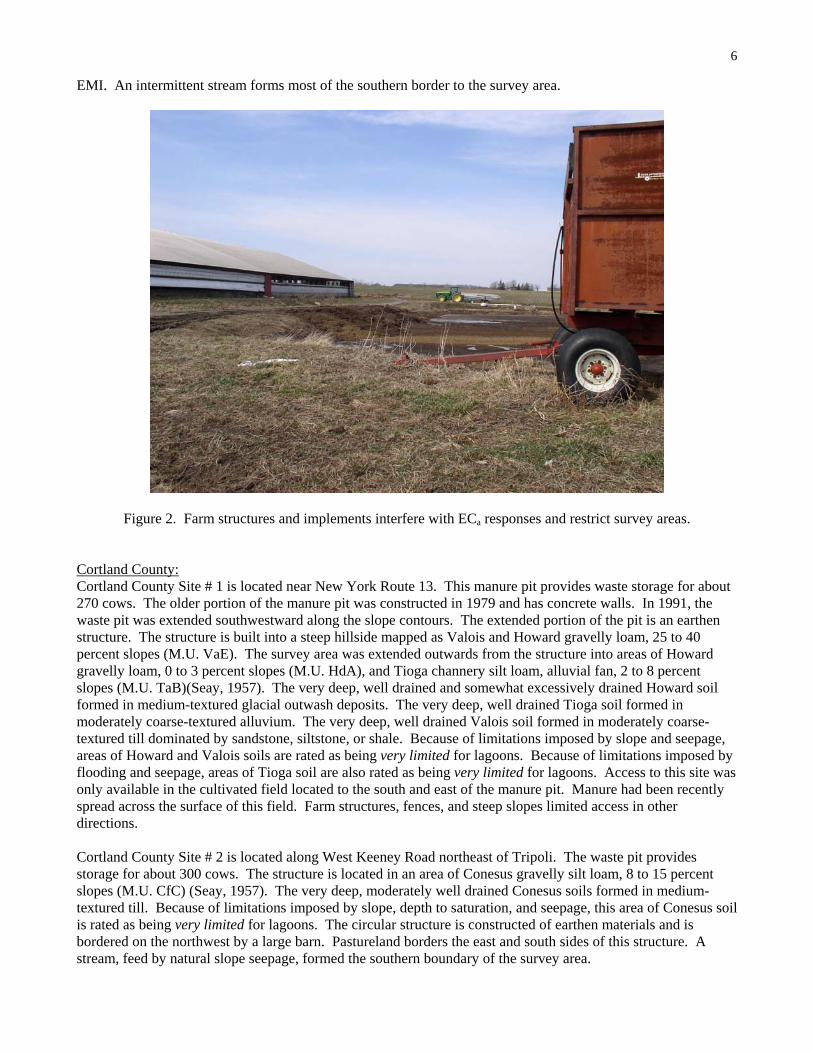
Figure 2. Farm structures and implements interfere with ECa responses and restrict survey areas.
Cortland County: Cortland County Site # 1 is located near New York Route 13. This manure pit provides waste storage for about 270 cows. The older portion of the manure pit was constructed in 1979 and has concrete walls. In 1991, the waste pit was extended southwestward along the slope contours. The extended portion of the pit is an earthen structure. The structure is built into a steep hillside mapped as Valois and Howard gravelly loam, 25 to 40 percent slopes (M.U. VaE). The survey area was extended outwards from the structure into areas of Howard gravelly loam, 0 to 3 percent slopes (M.U. HdA), and Tioga channery silt loam, alluvial fan, 2 to 8 percent slopes (M.U. TaB)(Seay, 1957). The very deep, well drained and somewhat excessively drained Howard soil formed in medium-textured glacial outwash deposits. The very deep, well drained Tioga soil formed in moderately coarse-textured alluvium. The very deep, well drained Valois soil formed in moderately coarse-textured till dominated by sandstone, siltstone, or shale. Because of limitations imposed by slope and seepage, areas of Howard and Valois soils are rated as being very limited for lagoons. Because of limitations imposed by flooding and seepage, areas of Tioga soil are also rated as being very limited for lagoons. Access to this site was only available in the cultivated field located to the south and east of the manure pit. Manure had been recently spread across the surface of this field. Farm structures, fences, and steep slopes limited access in other directions. Cortland County Site # 2 is located along West Keeney Road northeast of Tripoli. The waste pit provides storage for about 300 cows. The structure is located in an area of Conesus gravelly silt loam, 8 to 15 percent slopes (M.U. CfC) (Seay, 1957). The very deep, moderately well drained Conesus soils formed in medium-textured till. Because of limitations imposed by slope, depth to saturation, and seepage, this area of Conesus soil is rated as being very limited for lagoons. The circular structure is constructed of earthen materials and is bordered on the northwest by a large barn. Pastureland borders the east and south sides of this structure. A stream, feed by natural slope seepage, formed the southern boundary of the survey area.
7
The taxonomic classifications of all soils mentioned in this report are listed in Table 1.
Table 1. Taxonomic Classification of Soils Soil Series Taxonomic classification Conesus Fine-loamy, mixed, active, mesic Glossaquic Hapludalfs Dunkirk Fine-silty, mixed, active, mesic Glossic Hapludalfs Honeoye Fine-loamy, mixed, active, mesic Glossic Hapludalfs Howard Loamy-skeletal, mixed, active, mesic Glossic Hapludalfs Kendaia Fine-loamy, mixed, active, nonacid, mesic Aeric Endoaquepts Lima Fine-loamy, mixed, active, mesic Oxyaquic Hapludalfs Lyons Fine-loamy, mixed, active, nonacid, mesic Mollic Endoaquepts Odessa Fine, illitic, mesic Aeric Endoaqualfs Schoharie Fine, illitic, mesic Oxyaquic Hapludalfs Teel Coarse-silty, mixed, active, mesic Fluvaquentic Eutrudepts Tioga Coarse-loamy, mixed, superactive, mesic Dystric Fluventic Eutrudepts Valois Coarse-loamy, mixed, superactive, mesic Typic Dystrudepts
Field Procedures: The EM31 meter was operated in the continuous mode with measurements recorded at 1-sec intervals. The EM31 meter was held at hip-height with its long axis parallel to the direction of traverse. Generally, at each site, two separate surveys were completed with the EM31 meter: one with the meter held in the horizontal dipole orientation and one with the meter held in the vertical dipole orientation. However, because of time constraints, the number of sites visited, and the results of prior surveys, latter surveys were complete with only one pass of the EM31 meter operated in the deeper-sensing, vertical dipole orientation. Walking at a fairly brisk and uniform pace, in a random back and forth pattern across each survey area completed an EMI survey. Cultural features were avoided where possible. However, interference and anomalous EMI responses from these features are evident in some datasets and cannot be ruled out in others. Because of ambiguity as to existence of deep seepage at Cayuga County Site # 1, a survey was completed with the EM34-3 meter. Measurements were manually triggered along parallel lines spaced about 15 m apart. To record measurements, the coils of the EM34-3 meter were placed on the ground surface, orientated in the direction of traverse, and adjusted to the correct intercoil distance. The operation of this meter requires 2 people: one handling the transmitter coil and one operating the receiver coil (see Figure 1). With a 20-m intercoil spacing the area covered by this meter is comparatively large (see Figure 1) and resolution of subsurface features is coarse. Results: All plots of ECa shown in this report use the same color scale and an isoline interval of 2 mS/m. This has been done so that values and patterns of ECa can be compared among the sites. Onondaga County: Table 2 summarizes the basic statistics for the EMI surveys that were conducted in Onondaga County. At both sites, ECa increased and became more variable with increasing depth of observation (shallow-sensing horizontal dipole orientation (0 to 3 m) measurement were less than those of the deeper-sensing, vertical dipole orientation (0 to 6 m)). This relationship was attributed to increased moisture and soluble salt contents with increasing depth. At Onondaga County Site #1, ECa averaged 8.8 mS/m and 14.0 mS/m in the horizontal and vertical dipole orientations, respectively. In the shallower-sensing, horizontal dipole orientation, one-half the observations had values of ECa between 6.7 and 9.9 mS/m. In the deeper-sensing, vertical dipole orientation, one-half the
8
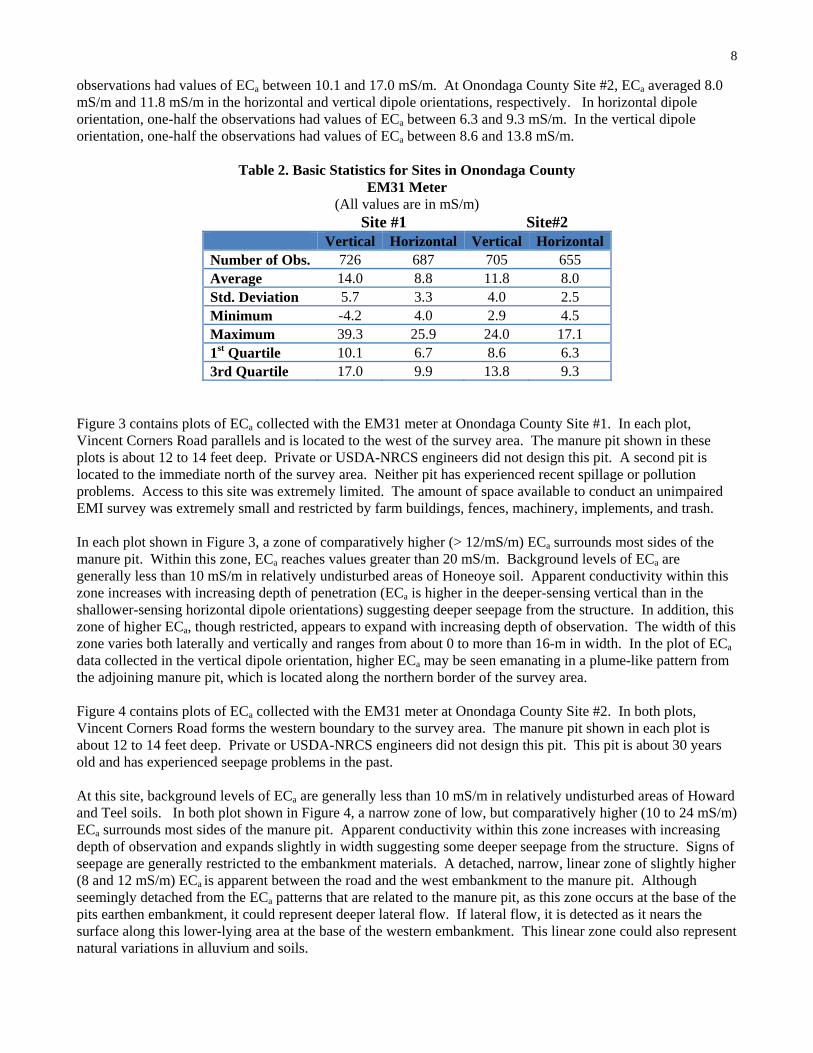
observations had values of ECa between 10.1 and 17.0 mS/m. At Onondaga County Site #2, ECa averaged 8.0 mS/m and 11.8 mS/m in the horizontal and vertical dipole orientations, respectively. In horizontal dipole orientation, one-half the observations had values of ECa between 6.3 and 9.3 mS/m. In the vertical dipole orientation, one-half the observations had values of ECa between 8.6 and 13.8 mS/m.
Table 2. Basic Statistics for Sites in Onondaga County EM31 Meter
(All values are in mS/m) Site #1 Site#2
Vertical Horizontal Vertical Horizontal Number of Obs. 726 687 705 655 Average 14.0 8.8 11.8 8.0 Std. Deviation 5.7 3.3 4.0 2.5 Minimum -4.2 4.0 2.9 4.5 Maximum 39.3 25.9 24.0 17.1 1st Quartile 10.1 6.7 8.6 6.3 3rd Quartile 17.0 9.9 13.8 9.3
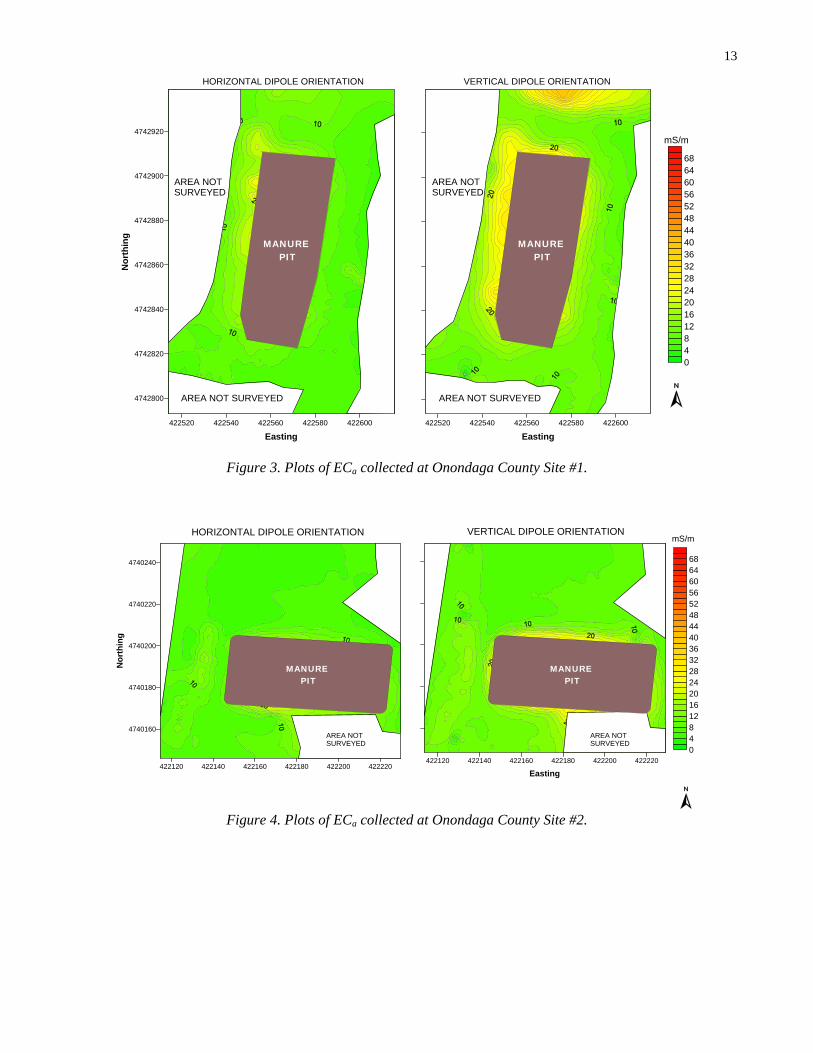
Figure 3 contains plots of ECa collected with the EM31 meter at Onondaga County Site #1. In each plot, Vincent Corners Road parallels and is located to the west of the survey area. The manure pit shown in these plots is about 12 to 14 feet deep. Private or USDA-NRCS engineers did not design this pit. A second pit is located to the immediate north of the survey area. Neither pit has experienced recent spillage or pollution problems. Access to this site was extremely limited. The amount of space available to conduct an unimpaired EMI survey was extremely small and restricted by farm buildings, fences, machinery, implements, and trash. In each plot shown in Figure 3, a zone of comparatively higher (> 12/mS/m) ECa surrounds most sides of the manure pit. Within this zone, ECa reaches values greater than 20 mS/m. Background levels of ECa are generally less than 10 mS/m in relatively undisturbed areas of Honeoye soil. Apparent conductivity within this zone increases with increasing depth of penetration (ECa is higher in the deeper-sensing vertical than in the shallower-sensing horizontal dipole orientations) suggesting deeper seepage from the structure. In addition, this zone of higher ECa, though restricted, appears to expand with increasing depth of observation. The width of this zone varies both laterally and vertically and ranges from about 0 to more than 16-m in width. In the plot of ECa data collected in the vertical dipole orientation, higher ECa may be seen emanating in a plume-like pattern from the adjoining manure pit, which is located along the northern border of the survey area. Figure 4 contains plots of ECa collected with the EM31 meter at Onondaga County Site #2. In both plots, Vincent Corners Road forms the western boundary to the survey area. The manure pit shown in each plot is about 12 to 14 feet deep. Private or USDA-NRCS engineers did not design this pit. This pit is about 30 years old and has experienced seepage problems in the past. At this site, background levels of ECa are generally less than 10 mS/m in relatively undisturbed areas of Howard and Teel soils. In both plot shown in Figure 4, a narrow zone of low, but comparatively higher (10 to 24 mS/m) ECa surrounds most sides of the manure pit. Apparent conductivity within this zone increases with increasing depth of observation and expands slightly in width suggesting some deeper seepage from the structure. Signs of seepage are generally restricted to the embankment materials. A detached, narrow, linear zone of slightly higher (8 and 12 mS/m) ECa is apparent between the road and the west embankment to the manure pit. Although seemingly detached from the ECa patterns that are related to the manure pit, as this zone occurs at the base of the pits earthen embankment, it could represent deeper lateral flow. If lateral flow, it is detected as it nears the surface along this lower-lying area at the base of the western embankment. This linear zone could also represent natural variations in alluvium and soils.
9
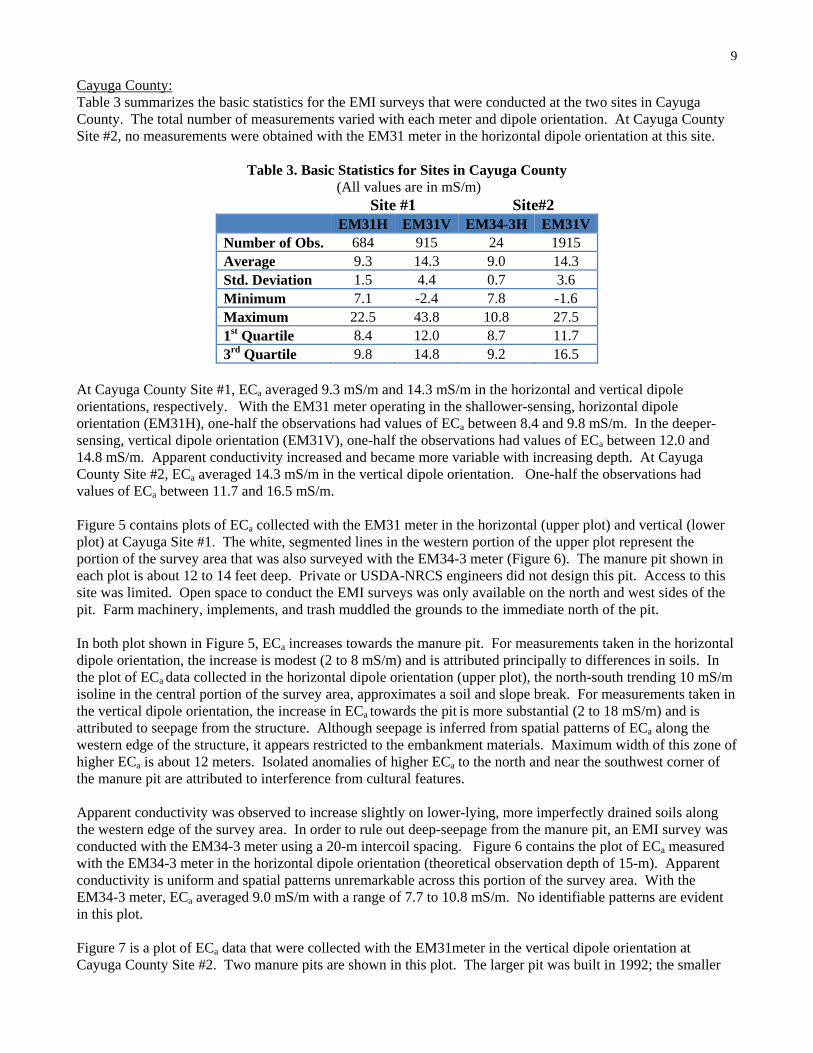
Cayuga County: Table 3 summarizes the basic statistics for the EMI surveys that were conducted at the two sites in Cayuga County. The total number of measurements varied with each meter and dipole orientation. At Cayuga County Site #2, no measurements were obtained with the EM31 meter in the horizontal dipole orientation at this site.
Table 3. Basic Statistics for Sites in Cayuga County (All values are in mS/m)
Site #1 Site#2 EM31H EM31V EM34-3H EM31V Number of Obs. 684 915 24 1915 Average 9.3 14.3 9.0 14.3 Std. Deviation 1.5 4.4 0.7 3.6 Minimum 7.1 -2.4 7.8 -1.6 Maximum 22.5 43.8 10.8 27.5 1st Quartile 8.4 12.0 8.7 11.7 3rd Quartile 9.8 14.8 9.2 16.5
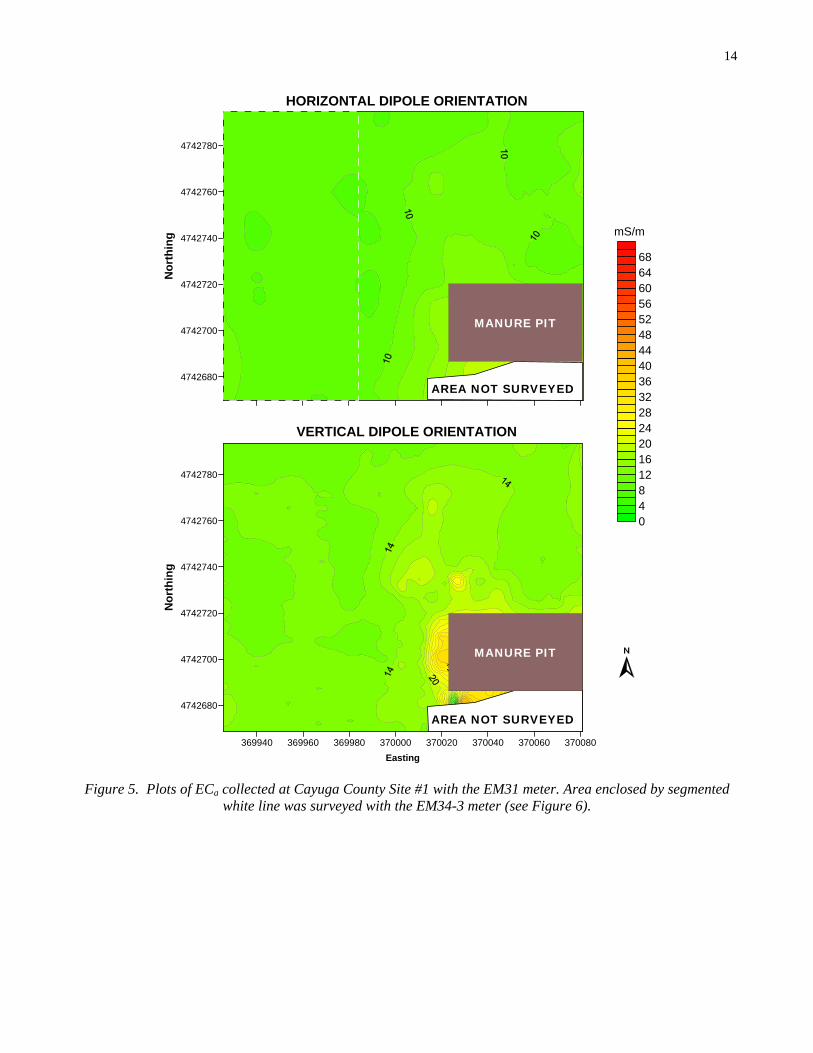
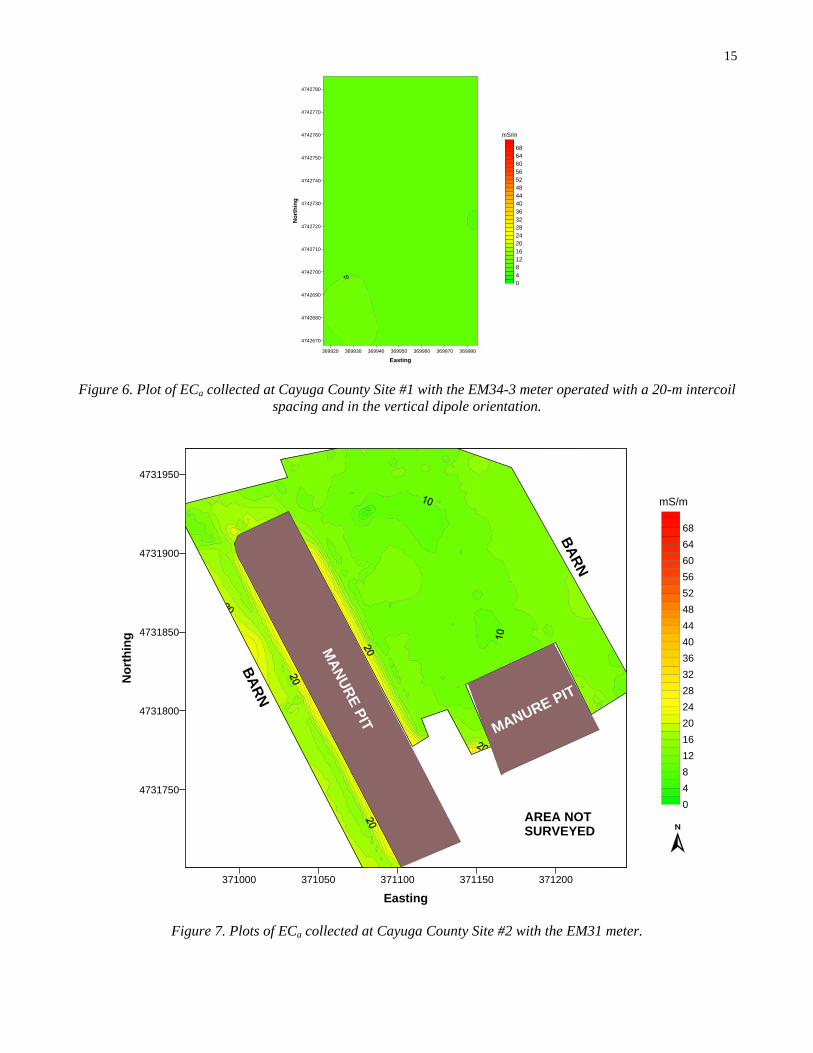
At Cayuga County Site #1, ECa averaged 9.3 mS/m and 14.3 mS/m in the horizontal and vertical dipole orientations, respectively. With the EM31 meter operating in the shallower-sensing, horizontal dipole orientation (EM31H), one-half the observations had values of ECa between 8.4 and 9.8 mS/m. In the deeper-sensing, vertical dipole orientation (EM31V), one-half the observations had values of ECa between 12.0 and 14.8 mS/m. Apparent conductivity increased and became more variable with increasing depth. At Cayuga County Site #2, ECa averaged 14.3 mS/m in the vertical dipole orientation. One-half the observations had values of ECa between 11.7 and 16.5 mS/m. Figure 5 contains plots of ECa collected with the EM31 meter in the horizontal (upper plot) and vertical (lower plot) at Cayuga Site #1. The white, segmented lines in the western portion of the upper plot represent the portion of the survey area that was also surveyed with the EM34-3 meter (Figure 6). The manure pit shown in each plot is about 12 to 14 feet deep. Private or USDA-NRCS engineers did not design this pit. Access to this site was limited. Open space to conduct the EMI surveys was only available on the north and west sides of the pit. Farm machinery, implements, and trash muddled the grounds to the immediate north of the pit. In both plot shown in Figure 5, ECa increases towards the manure pit. For measurements taken in the horizontal dipole orientation, the increase is modest (2 to 8 mS/m) and is attributed principally to differences in soils. In the plot of ECa data collected in the horizontal dipole orientation (upper plot), the north-south trending 10 mS/m isoline in the central portion of the survey area, approximates a soil and slope break. For measurements taken in the vertical dipole orientation, the increase in ECa towards the pit is more substantial (2 to 18 mS/m) and is attributed to seepage from the structure. Although seepage is inferred from spatial patterns of ECa along the western edge of the structure, it appears restricted to the embankment materials. Maximum width of this zone of higher ECa is about 12 meters. Isolated anomalies of higher ECa to the north and near the southwest corner of the manure pit are attributed to interference from cultural features. Apparent conductivity was observed to increase slightly on lower-lying, more imperfectly drained soils along the western edge of the survey area. In order to rule out deep-seepage from the manure pit, an EMI survey was conducted with the EM34-3 meter using a 20-m intercoil spacing. Figure 6 contains the plot of ECa measured with the EM34-3 meter in the horizontal dipole orientation (theoretical observation depth of 15-m). Apparent conductivity is uniform and spatial patterns unremarkable across this portion of the survey area. With the EM34-3 meter, ECa averaged 9.0 mS/m with a range of 7.7 to 10.8 mS/m. No identifiable patterns are evident in this plot. Figure 7 is a plot of ECa data that were collected with the EM31meter in the vertical dipole orientation at Cayuga County Site #2. Two manure pits are shown in this plot. The larger pit was built in 1992; the smaller
10
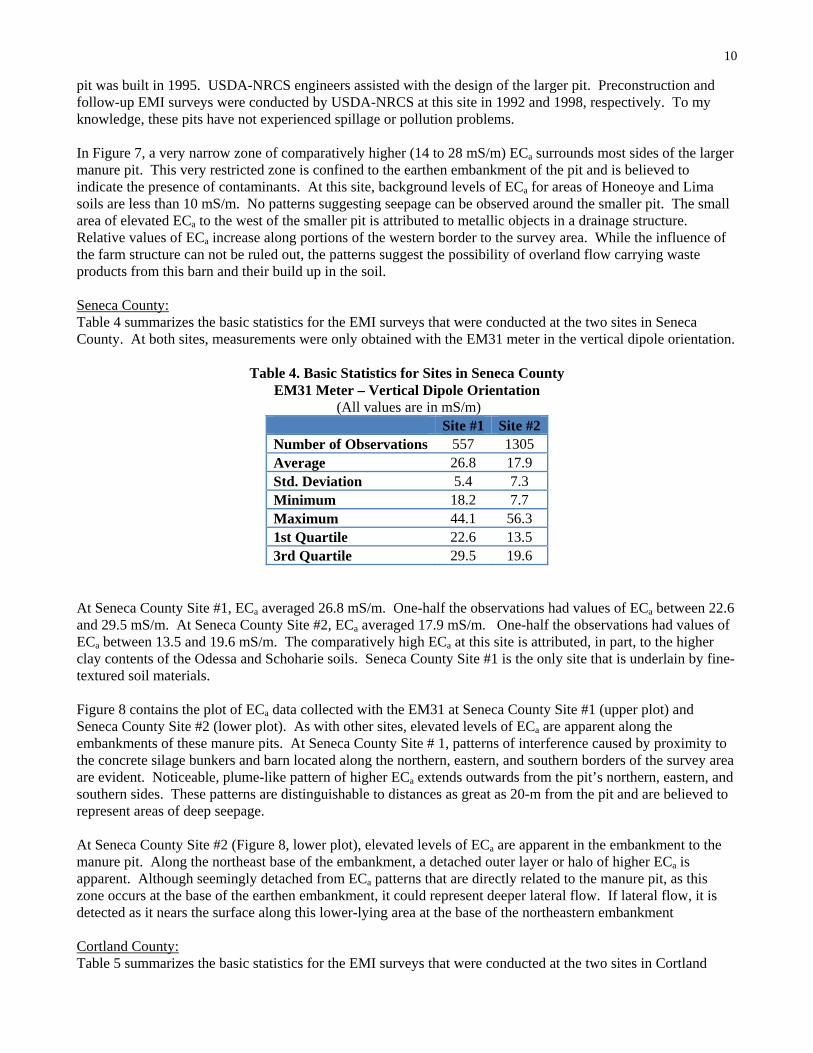
pit was built in 1995. USDA-NRCS engineers assisted with the design of the larger pit. Preconstruction and follow-up EMI surveys were conducted by USDA-NRCS at this site in 1992 and 1998, respectively. To my knowledge, these pits have not experienced spillage or pollution problems. In Figure 7, a very narrow zone of comparatively higher (14 to 28 mS/m) ECa surrounds most sides of the larger manure pit. This very restricted zone is confined to the earthen embankment of the pit and is believed to indicate the presence of contaminants. At this site, background levels of ECa for areas of Honeoye and Lima soils are less than 10 mS/m. No patterns suggesting seepage can be observed around the smaller pit. The small area of elevated ECa to the west of the smaller pit is attributed to metallic objects in a drainage structure. Relative values of ECa increase along portions of the western border to the survey area. While the influence of the farm structure can not be ruled out, the patterns suggest the possibility of overland flow carrying waste products from this barn and their build up in the soil. Seneca County: Table 4 summarizes the basic statistics for the EMI surveys that were conducted at the two sites in Seneca County. At both sites, measurements were only obtained with the EM31 meter in the vertical dipole orientation.
Table 4. Basic Statistics for Sites in Seneca County EM31 Meter – Vertical Dipole Orientation
(All values are in mS/m) Site #1 Site #2Number of Observations 557 1305 Average 26.8 17.9 Std. Deviation 5.4 7.3 Minimum 18.2 7.7 Maximum 44.1 56.3 1st Quartile 22.6 13.5 3rd Quartile 29.5 19.6
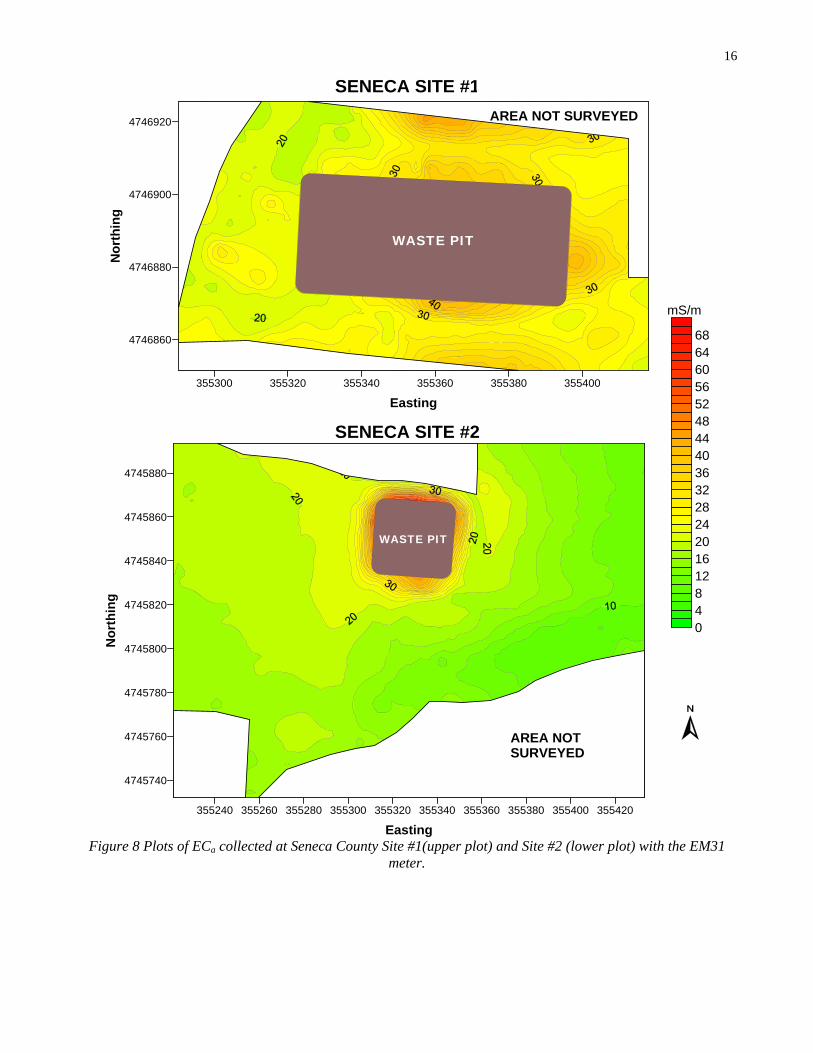
At Seneca County Site #1, ECa averaged 26.8 mS/m. One-half the observations had values of ECa between 22.6 and 29.5 mS/m. At Seneca County Site #2, ECa averaged 17.9 mS/m. One-half the observations had values of ECa between 13.5 and 19.6 mS/m. The comparatively high ECa at this site is attributed, in part, to the higher clay contents of the Odessa and Schoharie soils. Seneca County Site #1 is the only site that is underlain by fine-textured soil materials. Figure 8 contains the plot of ECa data collected with the EM31 at Seneca County Site #1 (upper plot) and Seneca County Site #2 (lower plot). As with other sites, elevated levels of ECa are apparent along the embankments of these manure pits. At Seneca County Site # 1, patterns of interference caused by proximity to the concrete silage bunkers and barn located along the northern, eastern, and southern borders of the survey area are evident. Noticeable, plume-like pattern of higher ECa extends outwards from the pit’s northern, eastern, and southern sides. These patterns are distinguishable to distances as great as 20-m from the pit and are believed to represent areas of deep seepage. At Seneca County Site #2 (Figure 8, lower plot), elevated levels of ECa are apparent in the embankment to the manure pit. Along the northeast base of the embankment, a detached outer layer or halo of higher ECa is apparent. Although seemingly detached from ECa patterns that are directly related to the manure pit, as this zone occurs at the base of the earthen embankment, it could represent deeper lateral flow. If lateral flow, it is detected as it nears the surface along this lower-lying area at the base of the northeastern embankment Cortland County: Table 5 summarizes the basic statistics for the EMI surveys that were conducted at the two sites in Cortland
11
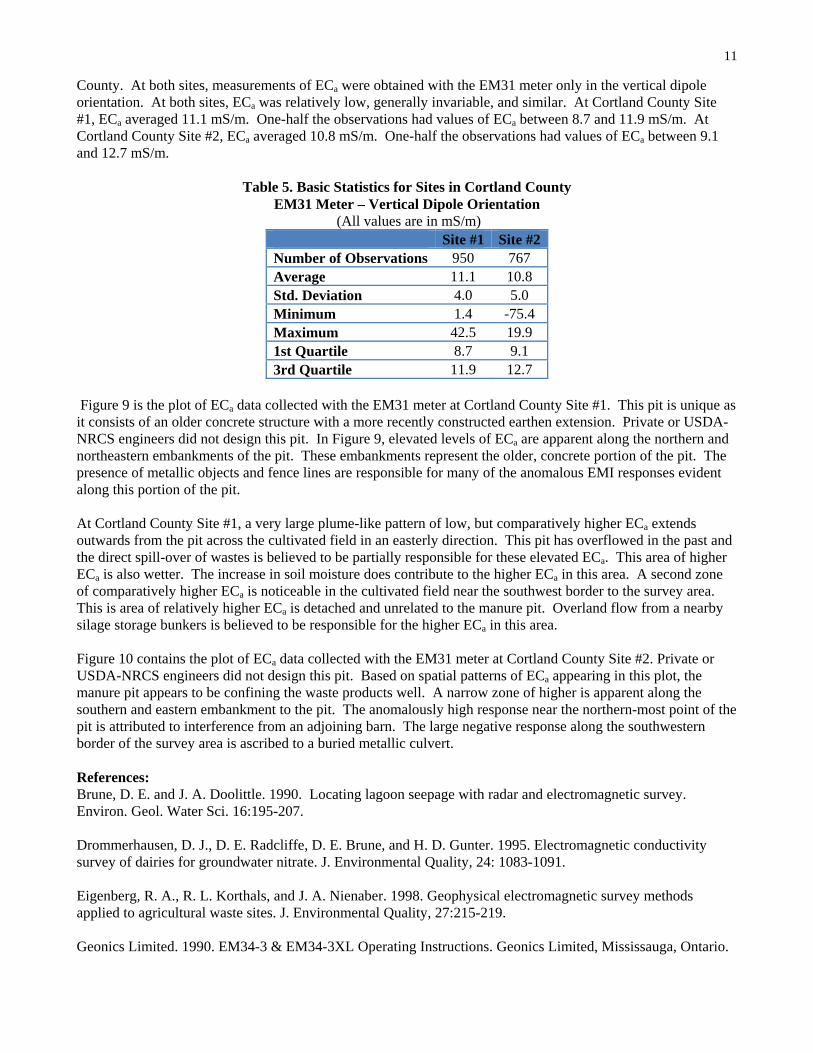
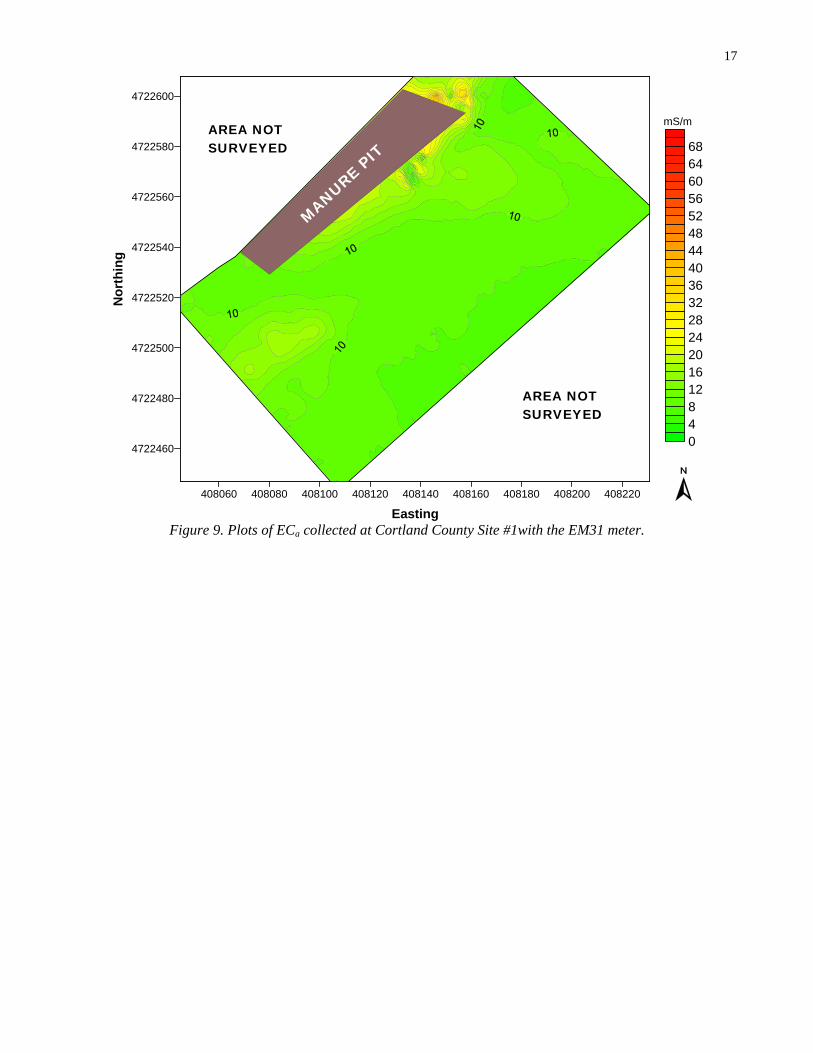
County. At both sites, measurements of ECa were obtained with the EM31 meter only in the vertical dipole orientation. At both sites, ECa was relatively low, generally invariable, and similar. At Cortland County Site #1, ECa averaged 11.1 mS/m. One-half the observations had values of ECa between 8.7 and 11.9 mS/m. At Cortland County Site #2, ECa averaged 10.8 mS/m. One-half the observations had values of ECa between 9.1 and 12.7 mS/m.
Table 5. Basic Statistics for Sites in Cortland County EM31 Meter – Vertical Dipole Orientation
(All values are in mS/m) Site #1 Site #2Number of Observations 950 767 Average 11.1 10.8 Std. Deviation 4.0 5.0 Minimum 1.4 -75.4 Maximum 42.5 19.9 1st Quartile 8.7 9.1 3rd Quartile 11.9 12.7
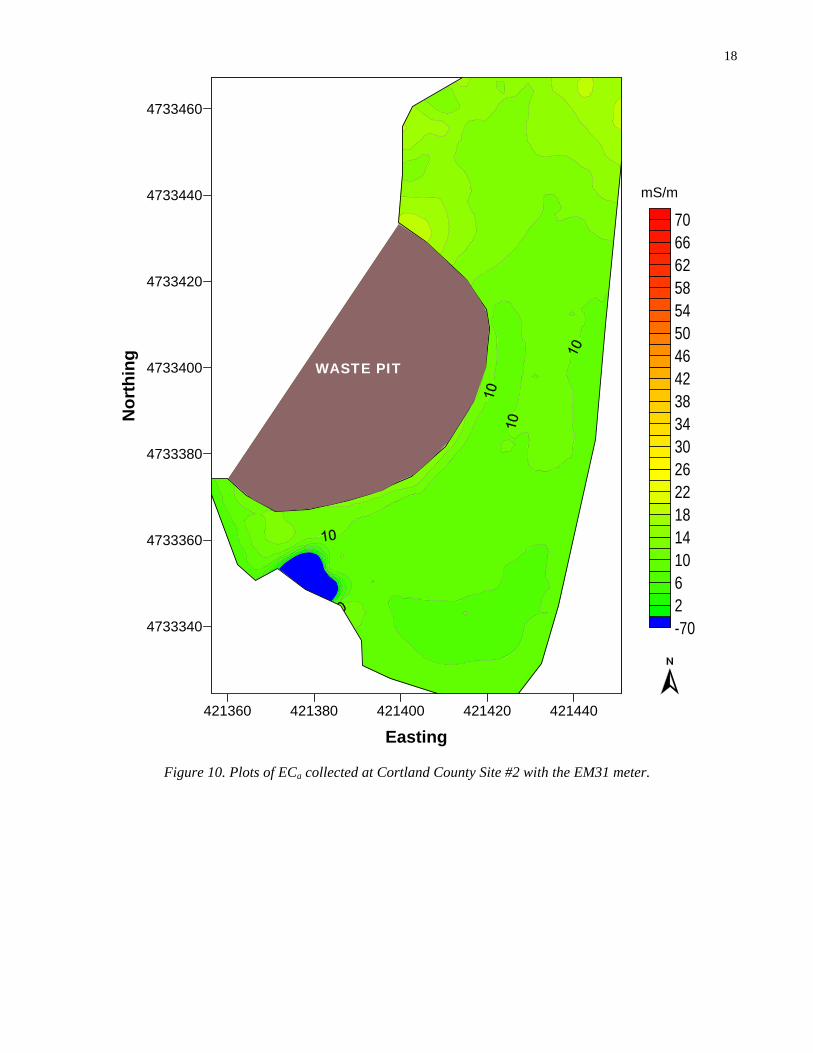
Figure 9 is the plot of ECa data collected with the EM31 meter at Cortland County Site #1. This pit is unique as it consists of an older concrete structure with a more recently constructed earthen extension. Private or USDA-NRCS engineers did not design this pit. In Figure 9, elevated levels of ECa are apparent along the northern and northeastern embankments of the pit. These embankments represent the older, concrete portion of the pit. The presence of metallic objects and fence lines are responsible for many of the anomalous EMI responses evident along this portion of the pit. At Cortland County Site #1, a very large plume-like pattern of low, but comparatively higher ECa extends outwards from the pit across the cultivated field in an easterly direction. This pit has overflowed in the past and the direct spill-over of wastes is believed to be partially responsible for these elevated ECa. This area of higher ECa is also wetter. The increase in soil moisture does contribute to the higher ECa in this area. A second zone of comparatively higher ECa is noticeable in the cultivated field near the southwest border to the survey area. This is area of relatively higher ECa is detached and unrelated to the manure pit. Overland flow from a nearby silage storage bunkers is believed to be responsible for the higher ECa in this area. Figure 10 contains the plot of ECa data collected with the EM31 meter at Cortland County Site #2. Private or USDA-NRCS engineers did not design this pit. Based on spatial patterns of ECa appearing in this plot, the manure pit appears to be confining the waste products well. A narrow zone of higher is apparent along the southern and eastern embankment to the pit. The anomalously high response near the northern-most point of the pit is attributed to interference from an adjoining barn. The large negative response along the southwestern border of the survey area is ascribed to a buried metallic culvert. References: Brune, D. E. and J. A. Doolittle. 1990. Locating lagoon seepage with radar and electromagnetic survey. Environ. Geol. Water Sci. 16:195-207. Drommerhausen, D. J., D. E. Radcliffe, D. E. Brune, and H. D. Gunter. 1995. Electromagnetic conductivity survey of dairies for groundwater nitrate. J. Environmental Quality, 24: 1083-1091. Eigenberg, R. A., R. L. Korthals, and J. A. Nienaber. 1998. Geophysical electromagnetic survey methods applied to agricultural waste sites. J. Environmental Quality, 27:215-219. Geonics Limited. 1990. EM34-3 & EM34-3XL Operating Instructions. Geonics Limited, Mississauga, Ontario.
12
Greenhouse, J. P., and D. D. Slaine. 1983. The use of reconnaissance electromagnetic methods to map contaminant migration. Ground Water Monitoring Review 3(2): 47-59. Hutton, F. Z. 1971. Soil survey of Cayuga County, New York. USDA-Soil Conservation Service and Cornell University Agricultural Experiment. Government Printing Office, Washington DC. Hutton, F. Z. 1972. Soil survey of Seneca County, New York. USDA-Soil Conservation Service and Cornell University Agricultural Experiment. Government Printing Office, Washington DC. Hutton, F. Z. and C. E. Rice. 1977. Soil survey of Onondaga County, New York. USDA-Soil Conservation Service and Cornell University Agricultural Experiment. Government Printing Office, Washington DC. Kachanoski, R. G., E. G. Gregorich, and I. J. Van Wesenbeeck. 1988. Estimating spatial variations of soil water content using noncontacting electromagnetic inductive methods. Can. J. Soil Sci. 68:715-722. McNeill, J. D. 1980a. Electrical Conductivity of soils and rocks. Technical Note TN-5. Geonics Ltd., Mississauga, Ontario. McNeill, J. D. 1980b. Electromagnetic terrain conductivity measurement at low induction numbers. Technical Note TN-6. Geonics Limited, Mississauga, Ontario. Miller, M.H., J.B. Robinson, and R.W. Gillham. 1985. Self-sealing of earthen liquid manure storage ponds: I. A case study. Journal of Environmental Quality 14:553-538. Radcliffe, D. E., D. E. Brune, D. J. Drohmerhausen, and H. D. Gunther. 1994. Dairy loafing areas as sources of nitrate in wells. 307-313 pp. IN: Environmentally Sound Agriculture, Proceedings of the Second Conference. 20-24 July 1994. American Society of Agricultural Engineers. St. Joseph, MI. Ranjan, R. S., and T. Karthigesu. 1995. Evaluation of an electromagnetic method for detecting lateral seepage around manure storage lagoons. ASAE Paper 952440. ASAE, St. Joseph, MI. Rhoades, J. D., P. A. Raats, and R. J. Prather. 1976. Effects of liquid-phase electrical conductivity, water content, and surface conductivity on bulk soil electrical conductivity. Soil Sci. Soc. Am. J. 40:651-655. Seay, B. D. 1957. Soil survey of Cortland County, New York. USDA-Soil Conservation Service and Cornell University Agricultural Experiment. Government Printing Office, Washington DC. Siegrist, R. L. and D. L. Hargett. 1989. Application of surface geophysics for location of buried hazardous waste. Water Management and Research 7:325-335. Stierman, D. L. and L. C. Ruedisili. 1988. Integrating geophysical and hydrogeological data: An efficient approach to remedial investigations of contaminated ground water. 43-57 pp. IN: Collins, A. G. and A. J. Johnson (eds.) Ground water contamination field methods. ASTM STP 963. American Society for Testing Materials, Philadelphia. Swell, J. I., J. A. Mulling and H. O. Vaigneur. 1975. Dairy lagoon systems and groundwater quality. 286-288 pp. IN: Proceeding of the Third International Symposium on Livestock Wastes, American Society of Agricultural Engineers, St. Joseph, Michigan.
13
422520 422540 422560 422580 422600
Easting
4742800
4742820
4742840
4742860
4742880
4742900
4742920N
ort
hin
g
422520 422540 422560 422580 422600
Easting
048121620242832364044485256606468
VERTICAL DIPOLE ORIENTATIONHORIZONTAL DIPOLE ORIENTATION
mS/m
AREA NOT SURVEYED
AREA NOT SURVEYED
AREA NOT SURVEYED
AREA NOT SURVEYED
MANURE PIT
MANURE PIT
Figure 3. Plots of ECa collected at Onondaga County Site #1.
422120 422140 422160 422180 422200 422220
4740160
4740180
4740200
4740220
4740240
No
rth
ing
422120 422140 422160 422180 422200 422220
Easting
048121620242832364044485256606468
VERTICAL DIPOLE ORIENTATIONHORIZONTAL DIPOLE ORIENTATIONmS/m
MANURE PIT
MANURE PIT
AREA NOTSURVEYED
AREA NOTSURVEYED
Figure 4. Plots of ECa collected at Onondaga County Site #2.
14
4742680
4742700
4742720
4742740
4742760
4742780
No
rth
ing
369940 369960 369980 370000 370020 370040 370060 370080
Easting
4742680
4742700
4742720
4742740
4742760
4742780
No
rth
ing
048121620242832364044485256606468
mS/m
HORIZONTAL DIPOLE ORIENTATION
VERTICAL DIPOLE ORIENTATION
AREA NOT SURVEYED
AREA NOT SURVEYED
MANURE PIT
MANURE PIT
Figure 5. Plots of ECa collected at Cayuga County Site #1 with the EM31 meter. Area enclosed by segmented white line was surveyed with the EM34-3 meter (see Figure 6).
15
369920 369930 369940 369950 369960 369970 369980
Easting
4742670
4742680
4742690
4742700
4742710
4742720
4742730
4742740
4742750
4742760
4742770
4742780
No
rth
ing
048121620242832364044485256606468
mS/m
Figure 6. Plot of ECa collected at Cayuga County Site #1 with the EM34-3 meter operated with a 20-m intercoil spacing and in the vertical dipole orientation.
371000 371050 371100 371150 371200
Easting
4731750
4731800
4731850
4731900
4731950
No
rth
ing
0
4
8
12
16
20
24
28
32
36
40
44
48
52
56
60
64
68
mS/mM
AN
UR
E P
IT
MANURE PIT
BA
RN
BA
RN
AREA NOTSURVEYED
Figure 7. Plots of ECa collected at Cayuga County Site #2 with the EM31 meter.
16
355300 355320 355340 355360 355380 355400
Easting
4746860
4746880
4746900
4746920N
ort
hin
g
355240 355260 355280 355300 355320 355340 355360 355380 355400 355420
Easting
4745740
4745760
4745780
4745800
4745820
4745840
4745860
4745880
No
rth
ing
048121620242832364044485256606468
mS/m
SENECA SITE #1
SENECA SITE #2
WASTE PIT
WASTE PIT
AREA NOTSURVEYED
AREA NOT SURVEYED
Figure 8 Plots of ECa collected at Seneca County Site #1(upper plot) and Site #2 (lower plot) with the EM31
meter.
17
408060 408080 408100 408120 408140 408160 408180 408200 408220
Easting
4722460
4722480
4722500
4722520
4722540
4722560
4722580
4722600
No
rth
ing
048121620242832364044485256606468
mS/m
MANURE PIT
AREA NOTSURVEYED
AREA NOTSURVEYED
Figure 9. Plots of ECa collected at Cortland County Site #1with the EM31 meter.
18
421360 421380 421400 421420 421440
Easting
4733340
4733360
4733380
4733400
4733420
4733440
4733460
No
rth
ing
-702610141822263034384246505458626670
mS/m
WASTE PIT
Figure 10. Plots of ECa collected at Cortland County Site #2 with the EM31 meter.