Embed Size (px)
Citation preview
University of Stuttgart
aaAnwendungssoftware
ssA Statistics Propagation
Approachto Enable Cost-Based
Optimizationof Statement SequencesTobias Kraft, Holger Schwarz, Bernhard
Mitschang
Institute of Parallel and Distributed SystemsUniversity of Stuttgart
Un
iver
sity
of
Stu
ttg
art
aaAnwendungssoftware
ss
22
OverviewOverview
•Motivation•Cost Estimation Approach•Histogram Propagation•Related Work•Experiments•Conclusion & Future Work

Un
iver
sity
of
Stu
ttg
art
aaAnwendungssoftware
ss
33
MotivationThe Case for Optimization
MotivationThe Case for Optimization
• Many of today’s applicationsembed query generators.
• Some of these generators notonly produce a single query buta sequence of SQL statements(e.g. MicroStrategy DSS tools).
• Rewriting these sequences maylead to significant performanceimprovements!
• Development of an optimizer based on rewrite rules and a heuristic priority-based control strategy
Coarse-Grained Optimization (CGO) [VLDB03]
Un
iver
sity
of
Stu
ttg
art
aaAnwendungssoftware
ss
44
MotivationStatement Sequences
MotivationStatement Sequences
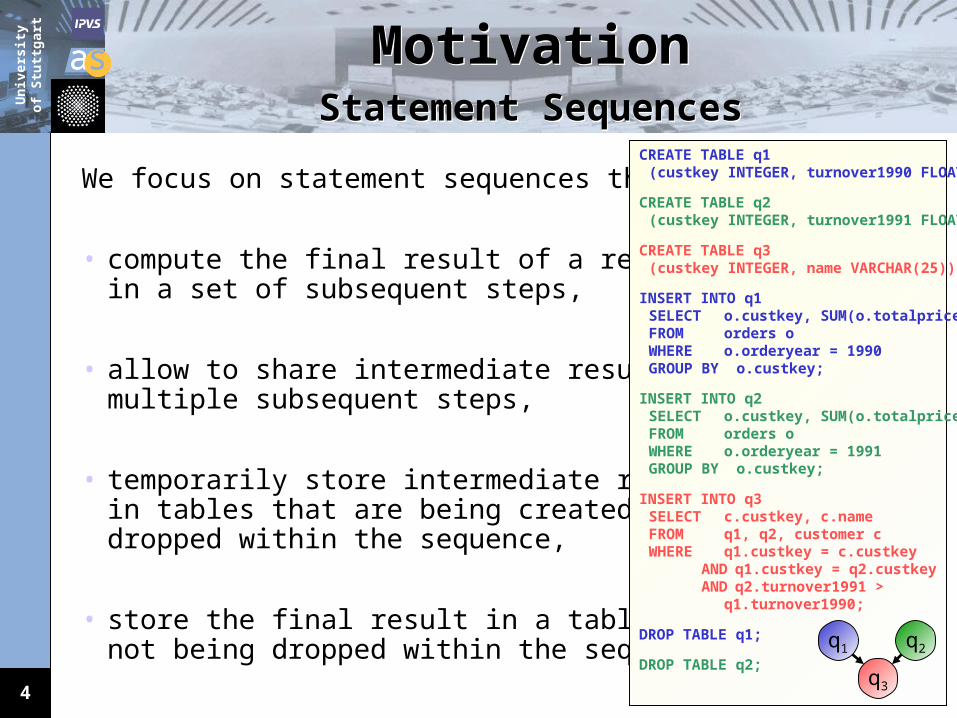
We focus on statement sequences that:
• compute the final result of a requestin a set of subsequent steps,
• allow to share intermediate results bymultiple subsequent steps,
• temporarily store intermediate resultsin tables that are being created anddropped within the sequence,
• store the final result in a table that isnot being dropped within the sequence.
CREATE TABLE q1(custkey INTEGER, turnover1990 FLOAT);
CREATE TABLE q2(custkey INTEGER, turnover1991 FLOAT);
CREATE TABLE q3(custkey INTEGER, name VARCHAR(25));
INSERT INTO q1SELECT o.custkey, SUM(o.totalprice)FROM orders oWHERE o.orderyear = 1990GROUP BY o.custkey;
INSERT INTO q2SELECT o.custkey, SUM(o.totalprice)FROM orders oWHERE o.orderyear = 1991GROUP BY o.custkey;
INSERT INTO q3SELECT c.custkey, c.nameFROM q1, q2, customer cWHERE q1.custkey = c.custkey AND q1.custkey = q2.custkey AND q2.turnover1991 >
q1.turnover1990;
DROP TABLE q1;
DROP TABLE q2;
q1 q2
q3

Un
iver
sity
of
Stu
ttg
art
aaAnwendungssoftware
ss
55
MotivationProblems of the Heuristic Control
Strategy
MotivationProblems of the Heuristic Control
Strategy• In some scenarios a rule application may lead to
deteriorationof performance.
• Different behavior on different platforms and database management systems.
• Alternative sequences of rule applications lead to different results.
Need for a cost-based approach.
Un
iver
sity
of
Stu
ttg
art
aaAnwendungssoftware
ss
66
Cost Estimation ApproachProblems & Solutions
Cost Estimation ApproachProblems & Solutions
• Cost estimates depend on the physical layout of the database and the capabilities and strategies of the DBMS‘s query optimizer.
A cost model on top of the DBMS is no feasible solution.Make use of the cost estimates provided by the DBMS‘s query
optimizer.
• DBMSs only provide cost estimates for statements on existing tables.
Execute CREATE TABLES statements before cost estimation.
• Missing statistics for the created tables causes the DBMS‘s query optimizer to use default values for cardinality and selectivity.
Propagate statistics through the INSERT statements.Make these propagated statistics available to the DBMS‘s
optimizer.

Un
iver
sity
of
Stu
ttg
art
aaAnwendungssoftware
ss
77
Cost Estimation Approach Algorithm of Cost Estimation
Cost Estimation Approach Algorithm of Cost Estimation
Input: A statement sequence S.
Output: A cost estimate for S.
totalcosts = 0
foreach CREATE TABLE statement c in S
Execute c on the underlying database system.
foreach INSERT statement i in S (in the order given by S)
Retrieve a cost estimate for i from the optimizer of the underlying database system.
Add this cost estimate to totalcosts.
Translate i into an algebraic tree.
Retrieve histograms for the base tables from the underlying database system andpropagate them through the algebraic tree to retrieve histograms for the targettable of i.
Store the resulting histograms in the catalog of the underlying database system.
foreach CREATE TABLE statement c in S
Drop the table that has been created by c.
return totalcosts.

Un
iver
sity
of
Stu
ttg
art
aaAnwendungssoftware
ss
88
Cost Estimation Approach Architectural Overview
Cost Estimation Approach Architectural Overview
cost-b
asedC
GO
op
timizer
DBMS execution engineand data management
DBMS query optimizer
CGO ruleset
cost-estimation componentfor statement sequences
histogrampropagation
statement costaggregation
cost-basedcontrol strategy
Statistics API
DDL statementshistogramscost estimatesfor statements
JDBC
sequenceoptimizedsequence

Un
iver
sity
of
Stu
ttg
art
aaAnwendungssoftware
ss
99
Histogram PropagationOverview
Histogram PropagationOverview
• We have adopted techniques from approximate query answering and added some extensions:
interval arithmetic for arithmetic terms, heuristics for grouping and aggregation, unification of comparison operators, normalization of histograms, common subexpressions
• SQL statement sequence algebraic operator trees.
• Everything is a bucket / histogram: NULL values are represented by a special bucket. Constant values (used in arithmetic terms) are
represented by a histogram with a single bucket. Sets of constants (used in IN-predicates) are
represented by a histogram.
X
T1 T2
T3
T4
Un
iver
sity
of
Stu
ttg
art
aaAnwendungssoftware
ss
1010
Histogram PropagationHistograms
Histogram PropagationHistograms
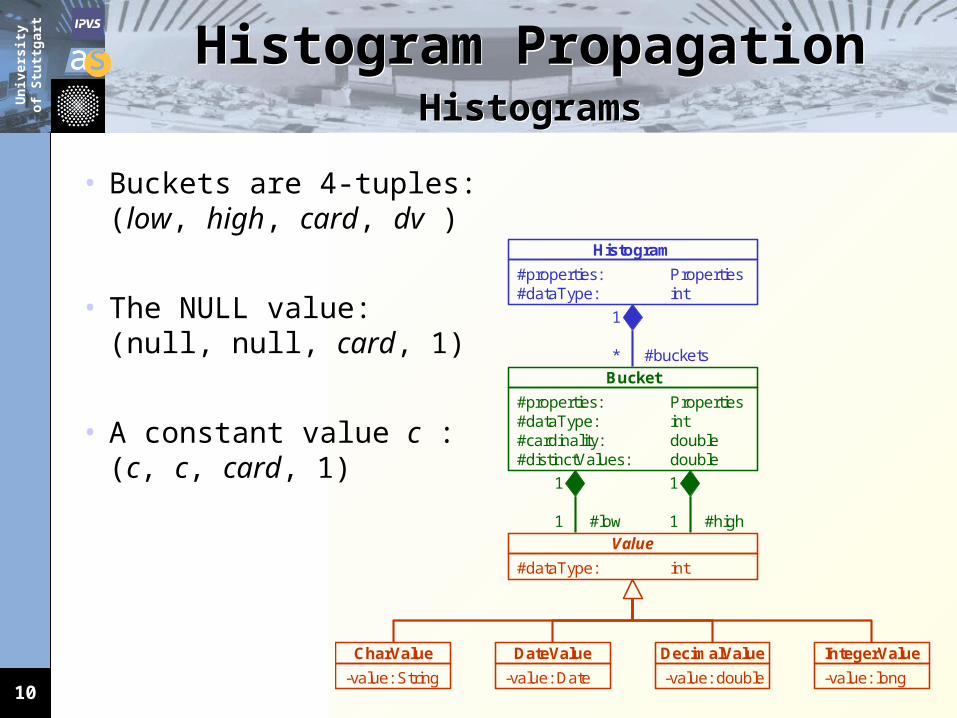
• Buckets are 4-tuples:(low, high, card, dv )
• The NULL value:(null, null, card, 1)
• A constant value c :(c, c, card, 1)
1
* #buckets
1
1 #high
1
1 #low
Histogram
#properties: Properties#dataType: int
Bucket
#properties: Properties#dataType: int#cardinality: double#distinctValues: double
Value
#dataType: int
CharValue
-value: String
DateValue
-value: Date
DecimalValue
-value: double
IntegerValue
-value: long
Un
iver
sity
of
Stu
ttg
art
aaAnwendungssoftware
ss
1111
Histogram PropagationAlgebra and Propagation
Histogram PropagationAlgebra and Propagation
• Operators: projection, selection, cartesian product, union, difference and grouping (including aggregation).
• A join can be represented by a cartesian product followed by a selection that contains the join condition.
• Arithmetic terms (projection / selection) and predicates (selection) are also represented by operator trees.
• Propagation is done by recursively traversing the algebraic operator tree and the arithmetic trees in a post order manner.

Un
iver
sity
of
Stu
ttg
art
aaAnwendungssoftware
ss
1212
Histogram PropagationAlgebra and Propagation
Histogram PropagationAlgebra and Propagation
• Arithmetic Operators: histograms as input a result histogram as output iterate over all bucket combinations compute a result bucket for each bucket
combination
• Comparison Operators: histograms as input selectivity as output some operators also provide modified histograms iterate over all bucket combinations compute a selectivity for each bucket
combination(and adapt the buckets)
A1 A2
A1 A2
A3
A1 A2
A1 A2
A1‘ A2‘
selectivity

Un
iver
sity
of
Stu
ttg
art
aaAnwendungssoftware
ss
1313
Histogram PropagationInterval Arithmetic for Arithmetic
Terms
Histogram PropagationInterval Arithmetic for Arithmetic
Terms• Example of using interval arithmetic for adding two
buckets: BO.low = BI1.low + BI2.low
BO.high = BI1.high + BI2.high
+ =10 20 30 40 500 10 20 30 40 500 0 10 20 30 40 50 60
10 20 30 40 50 60
Serialization
BI1
10 20 30 40 500
BI2
10 20 30 40 500
BO
10 20 30 40 500
+ =
Un
iver
sity
of
Stu
ttg
art
aaAnwendungssoftware
ss
1414
10 20 30 400 50 60 70 80
10
20
30
90 100110
histogram of attribute Ahistogram of attribute A
cardinality
value
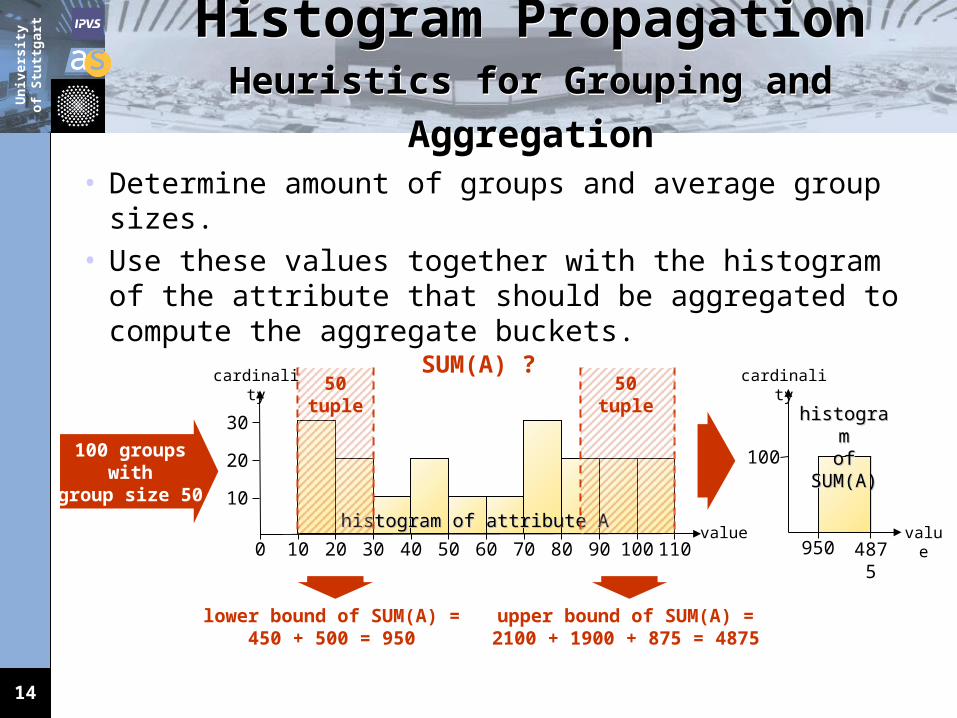
Histogram PropagationHeuristics for Grouping and
Aggregation
Histogram PropagationHeuristics for Grouping and
Aggregation• Determine amount of groups and average group sizes.• Use these values together with the histogram of the
attribute that should be aggregated to compute the aggregate buckets.
lower bound of SUM(A) =450 + 500 = 950
upper bound of SUM(A) =2100 + 1900 + 875 = 4875
100 groupswith
group size 50
50 tuple
50 tuple
SUM(A) ?
950 4875
histograhistogramm
of SUM(A)of SUM(A)100
cardinality
value

Un
iver
sity
of
Stu
ttg
art
aaAnwendungssoftware
ss
1515
• Comparison operators compare histograms.A single operator implementation can be used for different
purposes.No separate join implementation is necessary.
• E.g., the comparison operator ‘=‘ can be used in: a predicate comparing two attributes, a predicate comparing an attribute and a constant, a join condition of an equi-join
cartesian product followed by a selection thatcontains the join-condition as predicate,
an IN predicate comparing an attribute with a set of values join with a table (represented by a histogram) thatcontains the values of the value set.
Histogram PropagationUnification of Comparison Operators
Histogram PropagationUnification of Comparison Operators
CC
C1
…
Cn
Un
iver
sity
of
Stu
ttg
art
aaAnwendungssoftware
ss
1616
Related Workon Histogram Propagation
Related Workon Histogram Propagation
• Papers on Approximate Query Answering: Yannis E. Ioannidis, Viswanath Poosala:
Histogram-Based Approximation of Set-Valued Query-Answers. VLDB 1999
Viswanath Poosala, Venkatesh Ganti, Yannis E. Ioannidis:Approximate Query Answering using Histograms.IEEE Data Eng. Bull. 1999
• Transformation of SQL queries on tables into SQL queries on histograms.
• Join is done by creating two tables under the uniform spread assumption such that each table represents a value distribution which fits to the respective input histogram.
• Only equi-joins, no support for predicates that compare two attributes, no grouping and no support of arithmetic terms.
Un
iver
sity
of
Stu
ttg
art
aaAnwendungssoftware
ss
1717
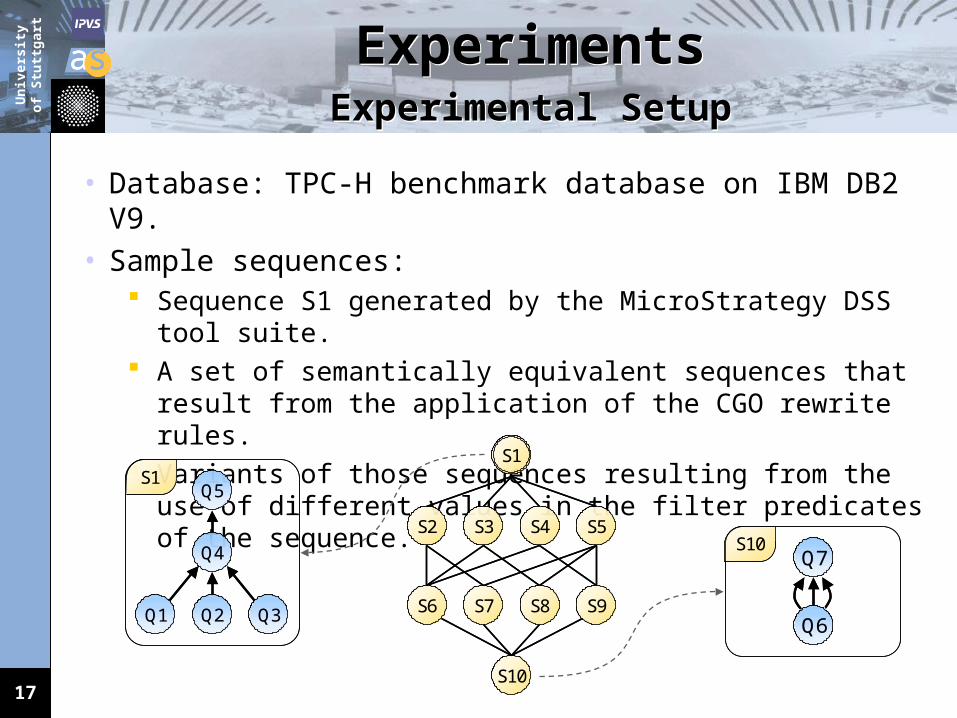
ExperimentsExperimental Setup
ExperimentsExperimental Setup
• Database: TPC-H benchmark database on IBM DB2 V9.• Sample sequences:
Sequence S1 generated by the MicroStrategy DSS tool suite.
A set of semantically equivalent sequences that result from the application of the CGO rewrite rules.
Variants of those sequences resulting from the use of different values in the filter predicates of the sequence.
S1
S2 S3 S4 S5
S6 S7 S8 S9
S10
S1
S2 S3 S4 S5
S6 S7 S8 S9
S10
S1
Q1 Q2 Q3
Q4
Q5S1
Q1 Q2 Q3
Q4
Q5
S10
Q6
Q7S10
Q6
Q7
Un
iver
sity
of
Stu
ttg
art
aaAnwendungssoftware
ss
1818
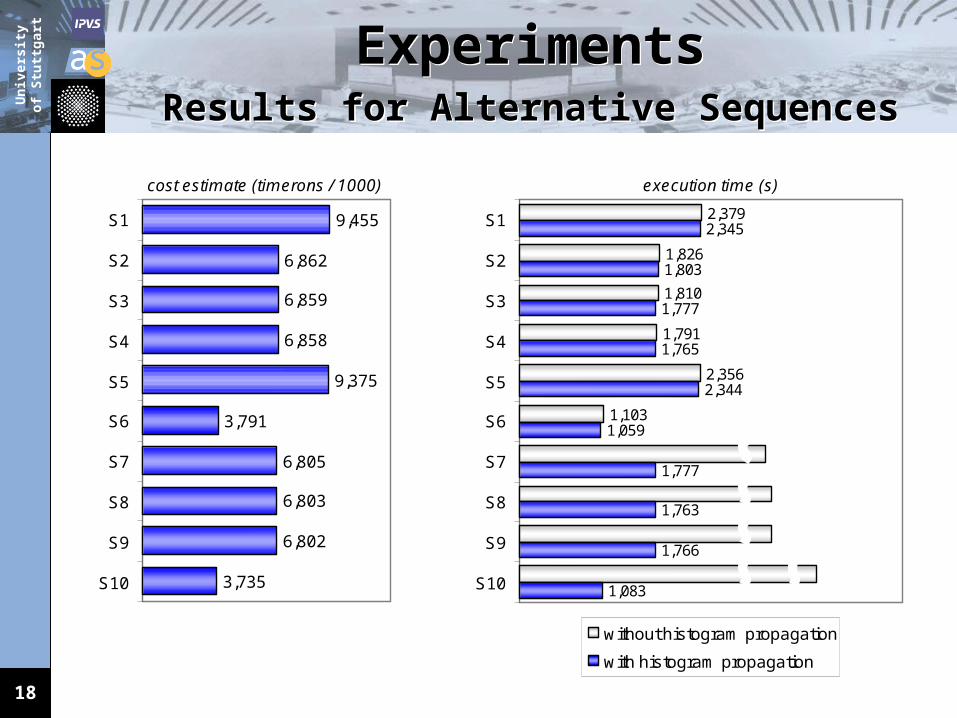
ExperimentsResults for Alternative Sequences
ExperimentsResults for Alternative Sequences
6,859
6,858
9,375
3,791
6,805
6,803
6,802
3,735
9,455
6,862
S1
S2
S3
S4
S5
S6
S7
S8
S9
S10
cost estimate (timerons / 1000)
1,810
1,791
2,356
1,103
2,345
1,803
1,777
1,765
2,344
1,059
1,777
1,763
1,766
1,083
2,379
1,826
S1
S2
S3
S4
S5
S6
S7
S8
S9
S10
execution time (s)
without histogram propagation
with histogram propagation
55,170
16,815
16,887
16,887

Un
iver
sity
of
Stu
ttg
art
aaAnwendungssoftware
ss
1919
ExperimentsResults for Different Selectivities
ExperimentsResults for Different Selectivities
cost estimate (timerons / 1000) for sequence S1
9,400
9,425
9,450
9,475
9,500
100,000 300,000 500,000parameter value
execution time (s) for sequence S1
2,275
2,325
2,375
2,425
2,475
100,000 300,000 500,000parameter value
without histogram propagation with histogram propagation

Un
iver
sity
of
Stu
ttg
art
aaAnwendungssoftware
ss
2020
Conclusion & Future WorkConclusion & Future Work
• Cost estimates for statement sequences are necessary to avoid rule applications that lead to performance deterioration.
• Making use of the cost estimates of the underlying DBMS is a feasible solution.
• Histogram propagation is necessary to get useable cost estimates for statements that access intermediate-result tables and to avoid bad plans.
• Future Work: A cost-based control strategy. Extensive measurements.

Un
iver
sity
of
Stu
ttg
art
aaAnwendungssoftware
ss
2121
Thank you foryour attention!

Un
iver
sity
of
Stu
ttg
art
aaAnwendungssoftware
ss
2222

Un
iver
sity
of
Stu
ttg
art
aaAnwendungssoftware
ss
2323
Cost Estimation Approach Statistics API
Cost Estimation Approach Statistics API
• is an interface that offers uniform DBMS-independent access to DBMS statistics, meta data and optimizer estimates
• provides a flexible histogram format that abstracts from proprietary data structures used in different DBMSs
• implementations exist for IBM DB2, Oracle and MS SQL Server
DB2database
Statistics API
DB2implementation
Oracleimplementation
SQL Serverimplementation
Oracledatabase
SQL Serverdatabase
JDBC

Un
iver
sity
of
Stu
ttg
art
aaAnwendungssoftware
ss
2424
Histogram PropagationCommon Subexpressions
Histogram PropagationCommon Subexpressions
• Identify arithmetic terms that appear multiple times in the different clauses of an SQL query.
• Otherwise, the arithmetic term will be recomputed for each appearance and modifications of histograms may get lost.
INSERT INTO temptable SELECT year(o.o_orderdate), count(*) FROM orders o WHERE year(o.o_orderdate) > 1992 AND
o.o_orderpriority = ‘1-URGENT‘ GROUP BY year(o.o_orderdate)
orders o_orderdate, o_orderpriority
$1 = year(o_orderdate)
$1 > 1992
$1, $2 = count(*)
$1, $2
o_orderpriority = ‘1-URGENT‘
orders o_orderdate, o_orderpriority
$1 = year(o_orderdate)
$1 > 1992
$1, $2 = count(*)
$1, $2
o_orderpriority = ‘1-URGENT‘

Un
iver
sity
of
Stu
ttg
art
aaAnwendungssoftware
ss
2525
Histogram PropagationNormalization of Histograms
Histogram PropagationNormalization of Histograms
• Worst case: The number of buckets in the output histogram is the
product of the number of buckets in the input histograms.
Serializing a histogram may double the number of buckets.
Normalization: prior to the enumeration phase and / or after an output
histogram has been produced, reduces the number of buckets by merging adjacent
buckets, trade-off between complexity / performance and quality.
10 20 30 40 500 0 10 20 30 40 50
10 buckets 4 buckets
Merge