Embed Size (px)
Citation preview
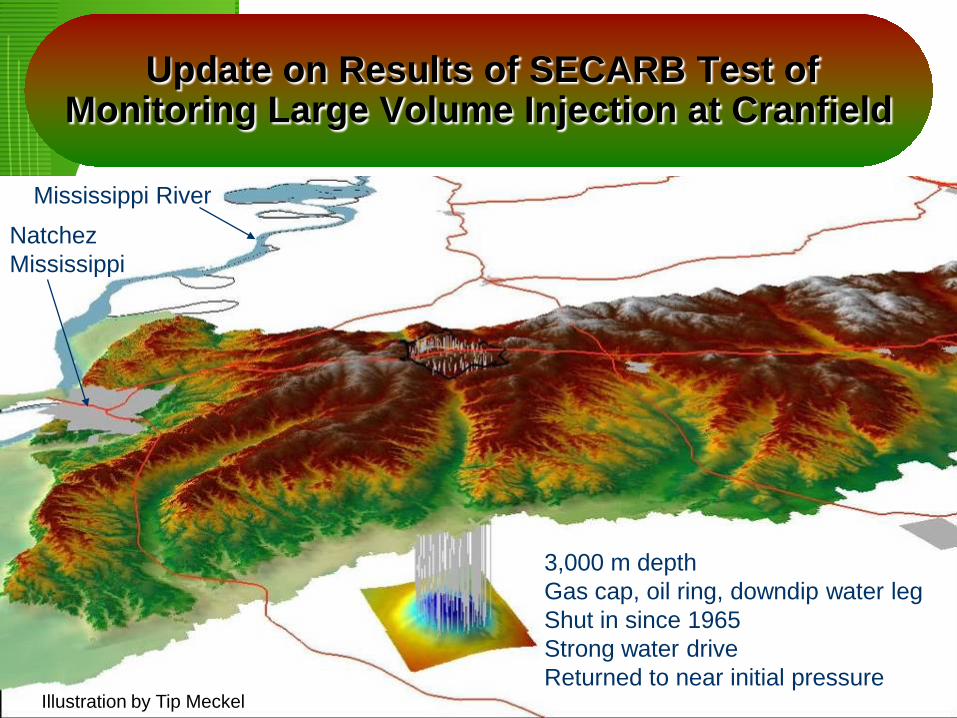
Update on Results of SECARB Test of Monitoring Large Volume Injection at Cranfield
Natchez Mississippi
Mississippi River
3,000 m depth Gas cap, oil ring, downdip water leg Shut in since 1965 Strong water drive Returned to near initial pressure
Illustration by Tip Meckel

Cranfield “Early” Field Test Collaboration
Gulf Coast Carbon Center Industrial Associates
Denbury Onshore LLC
LBNL LLBL USGS ORNL NETL
Schlumberger Carbon Services
QEA BP
U Mississippi Miss State
UTPGE UT DoG
University Tennessee Princeton Stanford
University Edinburgh
Gulf Coast Carbon Center Staff Susan Hovorka Ramon Trevino Tip Meckel Changbing Yang Jiemin Liu Katherine Romanak Rebecca Smyth Sigrid Clift Masoumeh Kordi Stuart Coleman Yihua Cai Hamid Lashgari
BEG staff Tongwei Zhang Jeff Paine Bob Reedy Robert Reed Kitty Millikan
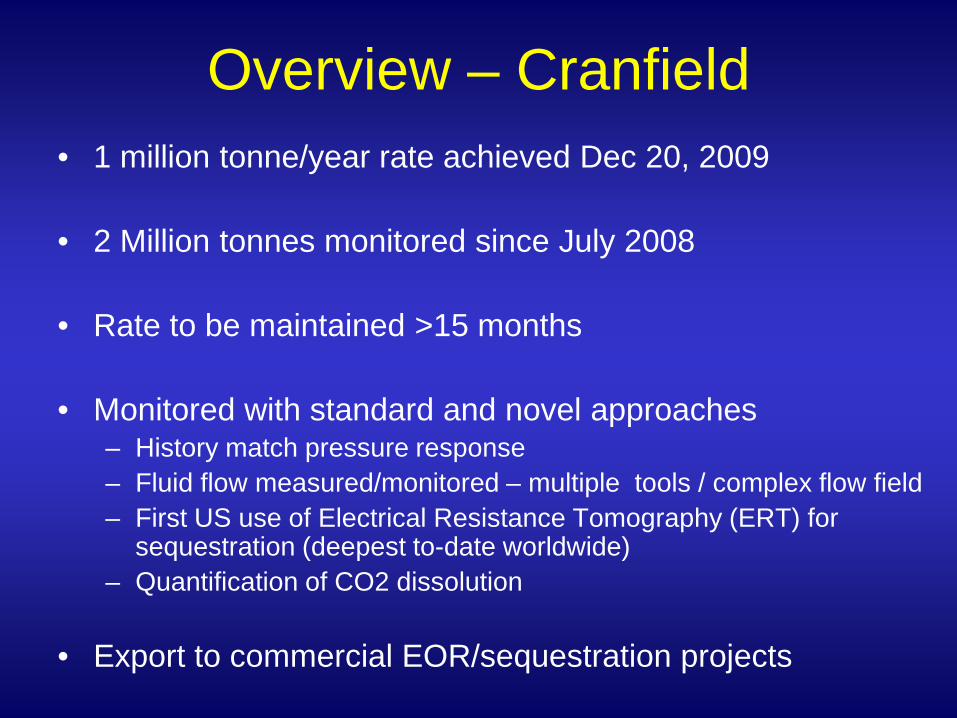
Overview – Cranfield • 1 million tonne/year rate achieved Dec 20, 2009
• 2 Million tonnes monitored since July 2008
• Rate to be maintained >15 months
• Monitored with standard and novel approaches
– History match pressure response – Fluid flow measured/monitored – multiple tools / complex flow field – First US use of Electrical Resistance Tomography (ERT) for
sequestration (deepest to-date worldwide) – Quantification of CO2 dissolution
• Export to commercial EOR/sequestration projects

May 1 million tonnes injected P II + III
Pha
se II
Site
de
velo
pmen
t
Cha
ract
eriz
atio
n Cranfield Progress
2007
Phas
e II
Site
sel
ectio
n
2008 2009
First cored well, brine samples
baseline seismic S
oil g
as b
asel
ine
2006
Phase II Phase III
2010 2011 2012
Pha
se II
I NE
PA
Phase III injection
Phase II injection
1 million tonnes Phase III injection 8/10
End
SE
CA
RB
Ear
ly
December 20, 2009 Achieved 1 million tonnes/year rate
Drill Phase III 3 DAS wells Monitoring
Repeat geophysical monitoring 10/10

Injector
Producer (monitoring point) Observation Well
HiVIT
DAS GMT
Phase II
Psite
Five Study Areas
Pipeline head& Separation facility
5
GIS base Tip Meckel

DAS
A B
3D Denbury - interpretation Tip Meckel BEG
Reservoir Characterization Tu
scal
oosa
Fm
Tuscaloosa D-E reservoir
Oil-water contact Based on: •Well logs and •Side-wall cores
Tuscaloosa confining system
Phase II

Reservoir Heterogeneity from Surface 3D Seismic
• Stratal slicing for facies
• 90-degree phase
• AVF for thickness/fluid
• AVO for fluid/OWC
Denbury 3-D survey interpretation Hongliu Zeng, BEG
Channel
erosion
Channel erosion
Channel erosion
Channel erosion
Point bar
Point bar

Upward fining fluvial sandstone and conglomerates of the lower Tuscaloosa Fm
Jiemin Lu BEG
Confining zone Reservoir

Baseline Cross Well tomogram
Z-Seis & Tom Daley Jonathan Franklin in review at LBNL
F1 F2 F3 West East
112 m

Probabilistic Realization Permeability
Jong-won Choi and J.-P Nicot BEG

First Breakthrough (time) Predictions F2 Well (for each of 10 permeability fields)
Breakthrough time at F2
0
0.1
0.2
0.3
0.4
12/1/09
12/3/09
12/5/09
12/7/09
12/9/09
12/11/09
12/13/09
12/15/09
12/17/09
12/19/09
12/21/09
12/23/09
12/25/09
12/27/09
12/29/09
12/31/09
1/2/10
1/4/10
1/6/10
Date
Gas
sat
urat
ion
Set #1 at Ly14 (12/16/2009)
Set #2 at Ly17(12/20/2009)
Set #3 at Ly17(12/8/2009)
Set #4 at Ly10(12/15/2009)
Set #5 at Ly19(12/29/2009)
Set #6 at Ly10(12/23/2009)
Set #7 at Ly10(12/23/2009)
Set #8 at Ly10(12/7/2009)
Set #9 at Ly7(12/7/2009)
Set #10 at Ly10(12/11/2009)
Jong-won Choi and JP Nicot BEG

Start injection at DAS Dec 1, 2009 175 kg/min step up to 520 kg/min
Bot
tom
hol
e pr
essu
re
Elapsed time
Dec 1
400
bar
340
psi
Injector BHP Observation well BHP
It’s all about pressure

DAS Monitoring Injector CFU 31F1
Obs CFU 31 F2
Obs CFU 31 F3
Above-zone monitoring F1 F2 F3
Injection Zone
Above Zone Monitoring
10,500 feet BSL
Closely spaced well array to examine flow in complex reservoir
68m
112 m Petrel model Tip Meckel

Phase III Research Observation Wells’ Construction
Fiberglass non-conductive casing
Tuscaloosa DE
ERT – 14 & 7 electrodes
Casing-conveyed pressure sensor
100’
U-tube sampler 1/4 “SS
2 7/8” tubing
BHP+ T
Seismic sources/receivers
Distributed temperature and heater loop
BEG, LBNL, LLNL, USGS, ORNL, Sandia Technologies LLC
Cross well array in two wells High injection volumes Far-field monitoring microseismic, P&T, chemistry, surface seismic
200’

Measuring CO2 Distribution in Reservoir
• Well-based methods – Wireline logs in time lapse – RST (Schlumberger) – Temperature
• Cross well methods
– Time – lapse ERT – Time – lapse acoustic (seismic)

Wireline Formation Evaluation (ELAN – RST) CFU 31 – F3
GR Washouts
Resistivity OH Porosity Sigma
RST Porosity
Perm
CO2 Volume
CO2 Saturation
RST 12/12/09
RST 12/15/09
RST 12/31/09
Bob Butch

What happened at the wells?
Obs
erva
tion
wel
l F2
packer
Inje
ctio
n W
ell F
1
Obs
erva
tion
wel
l F3
Dec
1 C
O2
flow
s in
to fo
rmat
ion
packer
Dec 1 pressure changes right away, but no CO2

Day 9
Obs
erva
tion
wel
l F2
packer
Inje
ctio
n W
ell F
1
Obs
erva
tion
wel
l F3
Dec
1 C
O2
flow
s in
to fo
rmat
ion
packer
Dec 9 CO2 detected in top of well interval

Day 13
Obs
erva
tion
wel
l F2
packer
Inje
ctio
n W
ell F
1
O
bser
vatio
n w
ell F
3
Dec
1 C
O2
flow
s in
to fo
rmat
ion
packer
Dec 13 still minor amounts of CO2 detected in top of well interval and maybe some thin zones
Dec 13 CO2 detected in top of well interval and maybe some thin zones

Day 31
wel
l F2
packer
Inje
ctio
n W
ell F
1
wel
l F3
may
inje
ctio
n lo
g la
rge
flow
in
uppe
r par
t
packer
Dec 30 large amounts of CO2 detected in well interval and some thick zones in lower part of formation
Dec 31 large amounts of CO2 detected in well interval upper part of formation

Injector
Direction of CO2 plume
x
x x
x
x x
Cross Well ERT tells us how flow occurred
Charles Carrigan, LLNL
50ft
Obs
erva
tion
wel
l F3
elec
trode
s
Obs
erva
tion
wel
l F2
elec
trode
s
Conductive plume= workover fluids?
Resistive plume = CO2 in reservoir
Second Resistive plume out of section migration

0%
10%
20%
30%
40%
50%
60%
70%
80%
90%
100%
11/29/09 0:00 12/4/09 0:00 12/9/09 0:00 12/14/09 0:00 12/19/09 0:00 12/24/09 0:00 12/29/09 0:00 1/3/10 0:00
SAMPLING TIME
CO
NC
ENTR
ATI
ON
CH4
CO2
High frequency fluid sampling via U-tube
yields data on flow processes
BEG, LBNL, USGS, ORNL, UTDoG, data compiled by Changbing Yang BEG
Breakthrough of of CO2
Additional flow paths – more methane extracted
Double injection rate
Small diameter sampler with N2 drive brings fluids quickly to surface with tracers intact CO2 dissolution into brine liberates dissolved CH4
Originally brine methane saturated

Injector
Producer (monitoring point) Observation Well
HiVIT
P Site
GMT
Phase II
Is it possible to find leakage at surface? P-Site
tests
Pipeline head& Separation facility
5
DAS

1-BG
1-00
4-02
1-01 1-02
1-03
1-04 1-05
2-01
2-02
3-02
3-01
4-01
Trans 1
Trans 2 Trans 3
Trans 4
1950’s pit
road
Assessment of near surface techniques “P Site”
AW
Pit Pad Plants P&A well

Phase III Current Status • Injection since April, 2009 • Injection through 23 wells cumulative
volume of 1,067,339 metric tonnes
• Rates 0.8 to 1 million tonnes/year
• Currently Task 11: Repeat Geophysics – cross well seismic – VSP, AIT, acoustic logging, RST – repeat surface 3-D seismic

Interim Conclusions (Cranfield)
• Phase III 1 million tonne/year rate achieved Dec 20, 2009, 2 Million tonnes monitored since July 2008
• Rate to be maintained >15 months • Monitored with standard and novel approaches
– History match pressure response – Fluid flow measured/monitored with multiple tools in complex
flow field – First US use of Electrical Resistance Tomography (ERT) for
sequestration – Quantification of CO2 dissolution
• Export to commercial EOR/sequestration projects