Embed Size (px)
Citation preview
Urban Stormwater BMP Performance Monitoring
A Guidance Manual for Meeting the National Stormwater BMP Database Requirements April 25, 2002
1
1 Introduction 1.1 Scope Existing guidance is available for assessing the effectiveness of stormwater best management practices (EPA 1997; FHWA 2000). However, few existing documents provide targeted practical assistance in conducting and reporting data from a water quality based monitoring program that results in data that are useful for assessing BMP effectiveness on a broader scale.
This guidance has been developed by integrating experience gleaned from field monitoring activities conducted by members of ASCE’s Urban Water Resource Research Council and through the development of the ASCE/EPA National Stormwater Best Management Practices Database. The manual is intended to help achieve stormwater BMP monitoring project goals through the collection of more useful and representative rainfall, flow, and water quality information. Many of the recommended protocols (particularly those for reporting monitoring, watershed, and design information) are directly related to requirements of the National Stormwater Best Management Practices Database.
This manual is intended to improve the state of the practice by providing a recommended set of protocols and standards for collecting, storing, analyzing, and reporting BMP monitoring data that will lead to better understanding of the function, efficiency, and design of urban stormwater BMPs. This manual provides insight into and guidance for strategies, approaches, and techniques that are appropriate and useful for monitoring BMPs.
This document addresses methods that were in use at the time it was written. As the state of the practice and the design of monitoring equipment progress, new monitoring approaches and techniques, more sensitive devices, and equipment based on new technologies will likely be employed. Although the technology may change somewhat from that described herein, most of the basic flow and water quality monitoring methods discussed in this document have a long history of use and will most likely remain viable even as new and different technologies emerge.
This manual focuses primarily on the collection, reporting, and analysis of water quantity and quality measurements at the heart of quantitative BMP efficiency projects. It does not address, in detail, sediment sampling methods and techniques, biological assessment, monitoring of receiving waters, monitoring of groundwater, streambank erosion, channel instability, channel morphology, or other activities that in many circumstances may be as, or more, useful for measuring and monitoring water quality for assessing BMP efficiency.
Urban Stormwater BMP Performance Monitoring
A Guidance Manual for Meeting the National Stormwater BMP Database Requirements April 25, 2002
2
1.1.1 State of the Practice Many studies have assessed the ability of stormwater treatment BMPs (e.g., wet ponds, grass swales, stormwater wetlands, sand filters, dry detention, etc.) to reduce pollutant concentrations and loadings in stormwater. Although some of these monitoring projects conducted to date have done an excellent job of describing the effectiveness of specific BMPs and BMP systems, there is a lack of standards and protocols for conducting BMP assessment and monitoring work. These problems become readily apparent for persons seeking to summarize the information gathered from a number of individual BMP evaluations. Inconsistent study methods, lack of associated design information, and reporting protocols make wide-scale assessments difficult, if not impossible. (Strecker et al. 2001; Urbonas 1998) For example, individual studies often include the analysis of different constituents and utilize different methods for data collection and analysis, as well as report varying degrees of information on BMP design and flow characteristics. The differences in monitoring strategies and data evaluation alone contribute significantly to the range of BMP “efficiency” that has been reported in literature to date. 1.1.2 The Need for Guidance Municipal separate storm sewer system owners and operators need to identify effective BMPs for improving stormwater runoff water quality. Because of the current state of the practice, however, very little sound scientific data are available for making decisions about which structural and non-structural management practices function most effectively under what conditions; and, within a specific category of BMPs, to what degree design and environmental static and state variables directly affect BMP efficiency. This guidance addresses this need by helping to establish a standard basis for collecting water quality, flow, and precipitation data as part of a BMP monitoring program. The collection, storage, and analysis of this data will ultimately improve BMP selection and design.
1.1.3 National Stormwater Best Management Practices Database The National Stormwater BMP Database (Database) serves two key purposes: (1) to define a standard set of data reporting protocols for use with BMP monitoring efforts; and (2) to assemble and summarize historical and future BMP study data in a standardized format. The software consists of a data entry module for reporting data on new BMP studies and a search engine module to allow users to retrieve data. The Database is a user-friendly, menu-driven software program developed in a run-time version of Microsoft® Access 97 and Access 2000. The software has been distributed on CD-ROM and is now also accessible via the Internet at www.bmpdatabase.org. 1.2 Format and Content of This Document This document is broken down into two main sections following this introduction: Section 2 provides an overview of BMP monitoring. Discussion is provided on the context of BMP monitoring, difficulties in assessing BMP performance, and understanding the
Urban Stormwater BMP Performance Monitoring
A Guidance Manual for Meeting the National Stormwater BMP Database Requirements April 25, 2002
3
relationship between BMP study design and the attainment of monitoring program goals. Useful analysis of data collected from BMP monitoring studies is essential for understanding and comparing BMP monitoring study results. A summary of historical and recommended approaches for data analysis is provided in this section to elucidate the relationship between the details and subtleties of each analysis approach and the assessment of performance. Section 3 discusses the specifics of developing a monitoring program, selecting monitoring methods and equipment, installing and using equipment, implementing sampling approaches and techniques, and reporting information consistent with the National Stormwater Best Management Practices Database. In addition, four appendices have been included in this guidance document. The first appendix describes methods for calculating expected errors in field measurements. The second provides detailed information about the number of samples required to obtain statically significant monitoring data. The third appendix includes charts for estimating the number of samples required to observe a statically significant difference between two populations for a various levels of confidence and power. The final appendix is a table for estimating arithmetic descriptive statistics based on descriptive statistics of log-transformed data.

Urban Stormwater BMP Performance Monitoring
A Guidance Manual for Meeting the National Stormwater BMP Database Requirements April 25, 2002
4
2 BMP Monitoring Overview This section provides an overview of BMP monitoring program context and execution, including a discussion of approaches used for quantifying BMP efficiency. 2.1 Context of BMP Monitoring in the Regulatory Environment BMP monitoring is conducted by researchers, public entities, and private companies for meeting both regulatory and non-regulatory needs. This section briefly discusses some of the regulatory programs that drive BMP monitoring programs. A number of environmental laws exist for implementation of stormwater and BMP monitoring programs including:
• The Clean Water Act (CWA) of 1972:
Section 208 of 1972 CWA requires every state to establish effective BMPs to control nonpoint source pollution. The 1987 Water Quality Act (WQA) added section 402(p) to the CWA, which requires that urban and industrial stormwater be controlled through the National Pollutant Discharge Elimination System (NPDES) permit program.
Section 303(d) of WQA requires the states to list those water bodies that are not attaining water quality standards including designated uses and identification of relative priorities among the impaired water bodies. States must also develop TMDLs (Total Maximum Daily Loads) that quantify the pollutant load or the impairing pollutants that will bring the waterbody back into attainment.
• The Endangered Species Act:
The Endangered Species Act of 1973 protects animal and plant species currently in danger of extinction (endangered) and those that may become endangered in the foreseeable future (threatened). It provides for the conservation of ecosystems upon which threatened and endangered species of fish, wildlife, and plants depend, both through Federal action and by encouraging the establishment of state programs.
• Coastal Zone Act Reauthorization Amendments (CZARA) of 1990:
CZARA was passed to help address nonpoint source pollution in coastal waters. Each state with an approved coastal zone management program must develop and submit to the EPA and National Oceanic and Atmospheric Administration (NOAA) a Coastal Nonpoint Pollution Control Program (CNPCP), which provides for the implementation of the most economically achievable
Urban Stormwater BMP Performance Monitoring
A Guidance Manual for Meeting the National Stormwater BMP Database Requirements April 25, 2002
5
management measures and BMPs to control the addition of pollutants to coastal waters.
CZARA does not specifically require that states monitor implementation of management measures and BMPs. They must, however, provide technical assistance to local governments and the public in the implementation of the management measures and BMPs, which may include assistance to predict and assess the effectiveness of such measures.
CZARA also states that the EPA and NOAA shall provide technical assistance to the states in developing and implementing the CNPCP, including methods to predict and assess the effects of coastal land use management measures on coastal water quality and designated uses:
1. Protection of stream and water body designated use (meet fishable and swimmable goals)
2. Antidegradation policies designated to protect water quality when the water quality already is higher than existing standards
3. Other state, county, and local regulations or ordinances
As regulations and the application and enforcement thereof change over time, details about the above environmental laws and their implications for specific sites and watersheds are best obtained from current EPA, state, county, and local resources. 2.2 BMP Monitoring Goals BMP monitoring projects are initiated to address a broad range of programmatic, management, regulatory, and research goals. Goal attainment is often focused on the achievement of water quality objectives downstream of the BMP. However, there are many other objectives that have been established as part of BMP implementation projects that cannot be measured using a water quality monitoring approach alone. Table 2.1 below describes the relationship between BMP implementation objectives and the ability of water quality monitoring studies to address the attainment of these objectives. Studies directed at addressing the efficiency of BMPs in attaining water quality goals are usually conducted to obtain information to help answer one or more of the following questions:
• What degree of pollution control or effluent quality does the BMP provide under normal conditions?
• How does this efficiency vary from pollutant to pollutant?

Urban Stormwater BMP Performance Monitoring
A Guidance Manual for Meeting the National Stormwater BMP Database Requirements April 25, 2002
6
• How does this normal efficiency vary with large or small storm events?
• How does this normal efficiency vary with rainfall intensity?
• How do design variables affect efficiency?
• How does efficiency vary with different operational and/or maintenance approaches?
• Does efficiency improve, decay, or remain stable over time?
• How does this BMP's efficiency compare with the efficiency of other BMPs?
The ability of a specific BMP monitoring program to answer these questions and ultimately address the desire to measure goal attainment is a vital planning stage component of setting up a meaningful BMP monitoring program.
Table 2.1: Objectives of BMP implementation projects and the ability of comprehensive water quality monitoring studies to provide information useful for
determining performance and effectiveness
Category Goals of BMP Projects Ability to Evaluate Performance and Effectiveness
Hydraulics • Improve flow characteristics upstream and/or downstream
of BMP -
Hydrology • Flood mitigation, improve runoff characteristics (peak shaving) ü
Water Quality
• Reduce downstream pollutant loads and concentrations of pollutants ü
• Improve/minimize downstream temperature impact ü • Achieves desired pollutant concentration in outflow ü • Removal of litter and debris - Toxicity • Reduce acute toxicity of runoff ü • Reduce chronic toxicity of runoff ü Regulatory • Compliance with NPDES permit - • Meet local, state, or federal water quality criteria ü1 Implementation Feasibility
• For non-structural BMPs, ability to function within management and oversight structure
-
Cost • Capital, operation, and maintenance costs - Aesthetic • Improve appearance of site - Maintenance • Operate within maintenance, and repair schedule and
requirements -
• Ability of system to be retrofit, modified or expanded - Longevity • Long-term functionality ü Resources • Improve downstream aquatic environment/erosion control - • Improve wildlife habitat - • Multiple use functionality - Safety, Risk and • Function without significant risk or liability - Liability • Ability to function with minimal environmental risk
downstream -
Public Perception
• Information is available to clarify public understanding of runoff quality, quantity and impacts on receiving waters ü
ü can be evaluated using water quality monitoring as primary source of information ü1 can be evaluated using water quality monitoring as the primary source of information combined with a secondary source of
comparative data - cannot be directly evaluated using water quality monitoring, but in some cases may be supported by work associated with collecting
water quality information (i.e., detailed flow data)
Urban Stormwater BMP Performance Monitoring
A Guidance Manual for Meeting the National Stormwater BMP Database Requirements April 25, 2002
7
2.3 Physical and Chemical Characteristics of Stormwater Runoff In this guidance manual, the term "stormwater" refers to more than just storm-driven surface runoff. Here the term is expanded to cover water and other substances that are transported through stormwater conveyance systems during, after, and between storm events. In addition to the runoff from rainfall or snowmelt, a typical stormwater sample may contain materials that were dumped, leaked, spilled, or otherwise discharged into the conveyance system. The sample may also contain materials that settled out in the system toward the end of previous storms and were flushed out by high flows during the event being sampled. Stormwater also can include dry weather flows such as pavement washing, pavement cutting wash water, or irrigation. Loads from dry weather flows, in some cases, can greatly exceed wet weather loads over the course of a year and must be taken into account. Stormwater quality tends to be extremely variable (EPA 1983; Driscoll et al. 1990). The intensity (volume or mass of precipitation per unit time) of rainfall often varies irregularly and dramatically. These variations in rainfall intensity affect runoff rate, pollutant washoff rate, in-channel flow rate, pollutant transport, sediment deposition and re-suspension, channel scour, and numerous other phenomena that collectively determine the pollutant concentrations, pollutant forms, and stormwater flow rate observed at a given monitoring location at any given moment. In addition, the transitory and unpredictable nature of many pollutant sources and release mechanisms (e.g., spills, leaks, dumping, construction activity, landscape irrigation runoff, vehicle washing runoff), and differences in the time interval between storm events also contribute to inter-storm variability. As a result, pollutant concentrations and other stormwater characteristics at a given location should be expected to fluctuate greatly during a single storm runoff event and from event to event. In addition, the complexity of introducing a structural management practice can greatly affect hydraulics and constituent concentrations in complex ways. For example, flows from detention facilities are often not confined only to the period of wet weather, as drain time can be significant. Numerous studies conducted during the late 1970s and early 1980s show that stormwater runoff from urban and industrial areas are a potentially significant source of pollution (EPA 1983; Driscoll et al. 1990). As a result, federal, state and local regulations have been promulgated to address stormwater quality (see Section 2.1 above). The impacts of hydrologic and hydraulic (physical as opposed to chemical) changes in watersheds are increasingly being recognized as significant contributors to receiving waters not meeting beneficial criteria. These impacts include stream channel changes (erosion, sedimentation, temperature changes) as well as wetland water level fluctuations.

Urban Stormwater BMP Performance Monitoring
A Guidance Manual for Meeting the National Stormwater BMP Database Requirements April 25, 2002
8
2.4 Stormwater Quality Monitoring Challenges Information collected on the efficiency and design of BMPs serves a variety of goals and objectives as discussed in Section 2.2. The principal challenge facing persons implementing BMP monitoring programs is the great temporal and spatial variability of stormwater flows and pollutant concentrations. Stormwater quality at a given location varies greatly both between storms and during a single storm event, and thus a small number of samples are not likely to provide a reliable indication of stormwater quality at a given site or the effect of a given BMP. Therefore, collection of numerous samples is generally needed in order to accurately characterize stormwater quality at a site and BMP efficiency (see Section 3.2.2). Collecting enough stormwater samples to answer with a high level of statistical confidence many of the common questions regarding BMP efficiency is generally expensive and time-consuming. A poorly-designed monitoring program could lead to erroneous conclusions and poor management decisions, resulting in misdirected or wasted resources (e.g., staff time, funds, credibility, and political support). Therefore, before one begins a BMP monitoring program, it is critical to clearly identify and prioritize the goals of the project, determine the type and quality of information needed to attain those goals, and then compare this list of needs to the resources available for monitoring. If the available resources cannot support the scale of monitoring needed to provide the quality of information deemed necessary, then consider the following options to obtain useful results within your resource limitations (e.g., funds, personnel, time): • A phased approach wherein you address only a subset of the overall geographic area,
or only the most important stormwater questions. • Limiting the number of constituents evaluated as an alternative to reducing the
number of samples collected. • Utilizing available data from other locations to support decision-making. The key question should be: "Will the information provided from the monitoring program I am considering (and would be able to implement) significantly improve my understanding of the effectiveness of the BMP being monitored?" If the answer is no, reconsider the monitoring program.

Urban Stormwater BMP Performance Monitoring
A Guidance Manual for Meeting the National Stormwater BMP Database Requirements April 25, 2002
9
2.5 Complexities Specific to BMP Monitoring Monitoring BMPs introduces a number of specific difficulties into the already complex task of monitoring stormwater runoff water quality. In many ways a structural BMP system is best viewed as an environmental unit process with a large number of static and state variables affecting functionality of the process. For example, static variables that can directly affect BMP system function include: • BMP design (e.g., length, width, height, storage volume, outlet design, upstream
bypass, model number, etc.) • Geographical location. • Watershed size. • Percent imperviousness. • Vegetative canopy. • Soil type. • Watershed slopes. • Compaction of soils. State variables that directly affect BMP function may include: • Rainfall intensity. • Flow rate. • Season. • Vegetation. • Upstream non-structural controls. • Inter-event timing. • Settings for control structures such as gates, valves, and pumps. • Maintenance of the BMP.
Urban Stormwater BMP Performance Monitoring
A Guidance Manual for Meeting the National Stormwater BMP Database Requirements April 25, 2002
10
The inconsistent use of language in reporting BMP information can compound the difficult task of assessing physically complex systems. In order to provide a consistent context for discussion of monitoring approaches in this guidance, the following definitions are provided: • Best Management Practice (BMP) - A device, practice, or method for removing,
reducing, retarding, or preventing targeted stormwater runoff constituents, pollutants, and contaminants from reaching receiving waters.
• BMP System - A BMP system includes the BMP and any related bypass or overflow.
For example, the efficiency (see below) can be determined for an offline retention (Wet) Pond either by itself (as a BMP) or for the BMP system (BMP including bypass).
• Performance - measure of how well a BMP meets its goals for stormwater that the
BMP is designed to treat. • Effectiveness - measure of how well a BMP system meets its goals in relation to all
stormwater flows. • Efficiency - measure of how well a BMP or BMP system removes or controls
pollutants. Researchers often want to determine efficiency of BMPs and BMP systems and to elucidate relationships between design and efficiency. Efficiency has typically been quantified by “percent removal”. As is discussed in the following sections, “percent removal” alone is not a valid measure of the functional efficiency of a BMP (Strecker et al. 2001). As a result the definition of “efficiency” in this manual can mean any measure of how well a BMP or BMP system removes or controls pollutants and is not restricted by the historical use of the term referring to “percent removal.” 2.5.1 Considerations for Evaluating BMP Effectiveness Load Versus Water Quality Status Monitoring The choice between monitoring either (a) the status or condition of the water resource or (b) the pollutant load and event mean concentrations discharged to the water resource should be made with care (Coffey and Smolen 1990). Monitoring of loads and event mean concentrations is focused on obtaining quantitative information about the amount of pollutants transported to the receiving water from overland, channel and pipe, tributary, or groundwater flow. Load and concentration monitoring can be used to evaluate pollutant export at a stormwater BMP.
Urban Stormwater BMP Performance Monitoring
A Guidance Manual for Meeting the National Stormwater BMP Database Requirements April 25, 2002
11
Water Quality Status Monitoring Water quality status can be evaluated in a number of ways, including: • Evaluating “designated use” attainment1. • Evaluating Water Quality Standards violations. • Assessing ecological integrity. • Monitoring an indicator parameter. Monitoring water quality status includes measuring a physical attribute, chemical concentration, or biological condition, and may be used to assess baseline conditions, trends, or the impact of treatment on the receiving water. Monitoring water quality status may be the most effective method to evaluate the impact of the management measure implemented, but sensitivity may be low (Coffey and Smolen 1990). When the probability of detecting a trend in water quality status is low, load monitoring may be necessary. When deciding between measuring load or water quality status (i.e., it is not clear whether abatement can be detected in the receiving resource), a pollutant budget may help to make the decision (Coffey and Smolen 1990). The budget should account for mass balance of pollutant input by source, all output, and changes in storage. Sources of error in the budget should also be evaluated (EPA 1993a). Pollutant Load and Event Mean Concentration Monitoring Load monitoring requires considerable effort and should include the protocols that are the primary intent of this document. Because of potentially high variability of discharge and pollutant concentrations in watersheds impacted by both point and non-point sources, collecting accurate and sufficient data from a significant number of storm events and base flows over a range of conditions (e.g., season, land cover) is important. This manual describes several methods for collecting and analyzing meaningful pollutant loading and event concentration data. Most of these methods are also applicable to water quality status monitoring where specific chemical concentrations must be monitored. Monitoring for designated use attainment or standards violations should focus on those parameters or criteria specified in state water quality standards. Where the monitoring objective includes relating improvements in water quality to the pollution control activities, it is important that the parameters monitored are connected to the management
1 See Clean Water Act, Section 303(c)(2)

Urban Stormwater BMP Performance Monitoring
A Guidance Manual for Meeting the National Stormwater BMP Database Requirements April 25, 2002
12
measures implemented. For violations of standards, the choice of variable is specified by the state water quality standard (EPA 1993a). Consideration of Parameters for Monitoring Many studies have been conducted to assess the effectiveness of stormwater treatment BMPs to reduce pollutant concentrations and loads in stormwater runoff. Unfortunately, inconsistent study methods and reporting make assessment and comparison of BMP efficiency studies difficult. The studies often analyze different constituents with varying methods for data collection and analysis. These differences can contribute considerably to the range of BMP effectiveness observed (Strecker 1994). Several protocols for parameter selection have been used in the past. The most widely applied was developed as a part of the Nationwide Urban Runoff Program (NURP). NURP adopted consistent data collection techniques and analytical parameters so that meaningful comparisons of gathered data could be made. NURP adopted the following constituents as “standard pollutants characterizing urban runoff” (EPA 1983): • SSC – Suspended Solids Concentration • BOD – Biochemical Oxygen Demand • COD – Chemical Oxygen Demand • CU – Copper • Pb – Lead • Zn – Zinc • TP – Total Phosphorous • SP – Soluble Phosphorous • TKN – Total Kjeldahl Nitrogen • NO2 + NO3 – Nitrate + Nitrite The following factors were considered for including a parameter in the list of recommended monitoring constituents (Strecker 1994): • The pollutant has been identified as prevalent in typical urban stormwater at
concentrations that could cause water quality impairment.
Urban Stormwater BMP Performance Monitoring
A Guidance Manual for Meeting the National Stormwater BMP Database Requirements April 25, 2002
13
• The analytical test used can be related back to potential water quality impairment. • Sampling methods for the pollutant are straight forward and reliable for a moderately
careful investigator. • Analysis of the pollutant is economical on a widespread basis. • Treatment is a viable option for reducing the load of the pollutant. Similar considerations should go into the planning of water quality constituents and analytical methods to be used in monitoring the effectiveness of stormwater BMPs. The NURP parameters are a starting point and may or may not represent constituents of concern for discharges from specific BMPs. As mentioned previously, there is often a tradeoff between the breadth and depth of a monitoring program given a fixed cost and, as a result, narrowing the list of constituents monitored can dramatically improve the ability to quantify the efficiency of the BMP. Large volumes of data have been collected over the past 20 years on the performance of many structural stormwater BMPs, with most of the data relating to the performance of detention basins, retention ponds, and wetlands. Less data are available on the effectiveness of other types of BMPs (Urbonas 1994). Many of the reported results do not demonstrate a clear relationship between the efficiency of similar BMPs among the sites in which they were investigated. Sufficient parametric data has generally not been reported with the performance data to permit a systematic analysis of the data collected (Urbonas 1994). There are a number of important parameters that need to be measured and reported whenever BMP performance is monitored (Urbonas 1994). A detailed discussion on this subject is provided in Section 3.4 of this manual. 2.6 BMP Types and Implications for Calculation of Efficiency The issues involved in selecting methods for quantifying efficiency, performance, and effectiveness are complex. It would be difficult, at best, to find one method that would cover the data analysis requirements for the widely varied collection of BMP types and designs available. When analyzing efficiency, it is convenient to classify BMPs according to one of the following four distinct categories: • BMPs with well-defined inlets and outlets whose primary treatment depends upon
extended detention storage of stormwater, (e.g., retention (wet) and detention (dry) ponds, wetland basins, underground vaults).
• BMPs with well-defined inlets and outlets that do not depend upon significant storage
of water, (e.g., sand filters, swales, buffers, structural “flow-through” systems).

Urban Stormwater BMP Performance Monitoring
A Guidance Manual for Meeting the National Stormwater BMP Database Requirements April 25, 2002
14
• BMPs that do not have a well-defined inlet and/or outlet (e.g., full retention,
infiltration, porous pavement, grass swales where inflow is overland flow along the length of the swale).
• Widely distributed (scattered) BMPs where studies of efficiency use reference
watersheds to evaluate effectiveness, (e.g., catch basin retrofits, education programs, source control programs).
Any of the above can also include evaluations where the BMP’s efficiency was measured using before and after or paired watershed comparisons of water quality. The difficulty in selecting measures of efficiency stems not only from the desire to compare a wide range of BMPs, but also from the large number of methods currently in use. There is much variation and disagreement in the literature about what measure of efficiency is best applied in specific situations, however it is generally accepted that event mean concentrations and long-term loading provide the best means for observing the effects of the BMP respectively on acute and chronic pollution. It has been suggested that intra-storm monitoring could be used to establish paired inflow/outflow samples during the storm based upon average travel times. However, this method would only be valid if a BMP were functioning as a perfect plug-flow reactor, which is rarely the case. 2.7 Relationship Between Monitoring Study Objectives and Data Analysis In selecting a specific method for quantifying BMP efficiency, it is helpful to look at the objectives of previous studies seeking such a goal. BMP studies are usually conducted to obtain information regarding one or more of the following objectives: • What degree of pollution control does the BMP provide under typical operating
conditions? • How does effectiveness vary from pollutant to pollutant? • How does effectiveness vary with various input concentrations? • How does effectiveness vary with storm characteristics such as rainfall amount,
rainfall density, and antecedent weather conditions? • How do design variables affect performance? • How does effectiveness vary with different operational and/or maintenance
approaches?
Urban Stormwater BMP Performance Monitoring
A Guidance Manual for Meeting the National Stormwater BMP Database Requirements April 25, 2002
15
• Does effectiveness improve, decay, or remain stable over time? • How does the BMP’s efficiency, performance, and effectiveness compare to other
BMPs? • Does the BMP reduce toxicity to acceptable levels? • Does the BMP cause an improvement in or protect downstream biotic communities? • Does the BMP have potential downstream negative impacts? The monitoring efforts implemented most typically seek to answer a small subset of the above questions. This approach often leaves larger questions about the efficiency, performance and effectiveness of the BMP, and the relationship between design and efficiency, unanswered. This document recommends monitoring approaches consistent with protocols established as part of the National Stormwater Best Management Practices Database project and useful for evaluating BMP data such that some or all of the above questions about BMP efficiency can be assessed. 2.8 Physical Layout and Its Effect on Efficiency and Its Measure The estimation of the efficiency of BMPs is often approached in different ways based on the goals of the researcher. A BMP can be evaluated by itself or as part of an overall BMP system. The efficiency of a BMP when bypass or overflow are not considered may be dramatically different than the efficiency of an overall system. Bypasses and overflows can have significant effects on the ability of a BMP to remove constituents and appreciably reduce the efficiency of the system as a whole. Researchers who are interested in comparing the efficiency of an offline wet pond and an offline wetland may not be concerned with the effects of bypass on a receiving water. On the other hand, another researcher who is comparing offline wet ponds with online wet ponds would be very interested in the effects of the bypass. Often in past study reports detailed information about the bypass flows is not available. In some cases, comprehensive inflow and outflow measurements allow for the calculation of a mass balance that can be used to estimate bypass flow volumes. Estimations of efficiency of a BMP system can be based on these mass balance calculations coupled with sampling data. The effect of devices in series is often neglected in the analyses of BMPs. BMPs are often used in conjunction with a variety of upstream controls. For example detention ponds often precede wetlands, and sand filters typically have upstream controls for sediment removal such as a forebay or a structural separator or settling device. Depending on the approach used to quantify BMP efficiency, the effects resulting from upstream controls can have a sizable impact on the level of treatment observed.
Urban Stormwater BMP Performance Monitoring
A Guidance Manual for Meeting the National Stormwater BMP Database Requirements April 25, 2002
16
The efficiency of a BMP system or a BMP can be directly affected by the way in which an operator chooses to physically manage the system. This is the case where parameters of a design can be adjusted (e.g., adjustments to the height of an overflow/bypass weir or gate). These adjustments can vary the efficiency considerably. In order to analyze a BMP or BMP system thoroughly, all static and state variables of the system must be known and documented for each monitoring period. The protocols established for the National Stormwater Best Management Practices Database (Database) provide a framework for reporting the static and state variables thought to most strongly contribute to BMP efficiency and provide flexibility for non-standard situations. 2.9 Relevant Period of Impact The period of analysis used in carrying out a monitoring program is important. The period used should take into account how the parameter of interest varies with time. This allows for observation of relevant changes in the efficiency of the BMP on the time scale in which these changes occur. For example, in a wetland it is often observed that during the growing season effluent quality for nutrients improves. The opposite effect may be observed during the winter months or during any period where decaying litter and plant material may contribute significantly to export of nutrients and, potentially, other contaminants. Therefore, monitoring observations may need to be analyzed differently during different seasons. This variation of performance and more specifically efficiency on a temporal scale is extremely important in understanding how a specific BMP functions. In addition to observing how factors such as climate affect BMP efficiency as a function of time, it is important to relate the monitoring period to the potential impact a given constituent would have on the receiving water. For example, it may not be useful to study the removal of some heavy metals (e.g., mercury) for a short period of record when the negative impacts of such a contaminant are generally expressed over a long time scale (accumulation in sediments and biota). Likewise, some parameters (e.g., temperature, BOD, DO, pH, TSS and metals) may have a significant impact in the near term. Toxicity plays a major role in evaluating the type of monitoring conducted at a site as well as the time period that should be used to analyze efficiency. Specific constituents that are acutely toxic may require a short-term analysis on an “intra-storm” basis. Where dilution is significant and/or a constituent is toxic on a chronic basis, long-term analysis that demonstrates removal of materials on a sum of loads or average EMC basis may be more appropriate. Many contaminants may have both acute and chronic effects in the aquatic environment. These contaminants should be evaluated over both periods of time. Similarly, hydraulic conditions merit both short and long-term examination. Event peak flows are examples of short-term data, while seasonal variations of the hydrologic budget due to the weather patterns are examples of long-term data. Examples of water quality parameters and their relationship to the time scale over which they are most relevant are given in Table 2.2.
Urban Stormwater BMP Performance Monitoring
A Guidance Manual for Meeting the National Stormwater BMP Database Requirements April 25, 2002
17
Table 2.2: Examples of water quality parameters and relevant monitoring period
Time Scale for Analysis Water Quality Parameter Short-term BOD, DO Long-term Organics, Carcinogens Both Short- and Long-term Metals, TSS, Nitrogen,
Phosphorous, Temperature, pH, Pesticides
2.9.1 Concentrations, Loads, and Event Mean Concentrations A variety of tools are available for assessing and quantifying the amount of pollutant conveyed to and from a BMP. Three primary measures are used most commonly: concentrations of stormwater at some point in time, the total load conveyed over a specified duration, or the event mean concentration (EMC). 2.9.1.1 Concentrations Concentrations measured at a point in time can be useful for BMP efficiency evaluation in a number of circumstances. Concentrations resulting from samples collected at specific times during an event allow the generation of a pollutograph (i.e., a plot of the concentration of pollutants as a function of time). The generation of pollutographs facilitates the analysis of intra-event temporal variations in runoff concentration. For example, pollutographs can be used to determine if the “first-flush” phenomenon was observed for a specific event. Detailed concentration data is one of the approaches for assessing concentrations of pollutants that have acutely toxic effects, particularly where runoff from storm events constitutes a significant proportion of downstream flow. Under some circumstances, reduction of peak effluent concentrations may be more important than event mean concentration reduction. The cost of implementing a monitoring program that collects sufficient data to evaluate the temporal variation in runoff and BMP effluent concentration can be high. The trade-off between collecting data from a larger number of events versus collecting detailed concentration data from intra-storm periods often limits the utility of studies that collect detailed concentration data. This type of detailed monitoring is best focused on outflow monitoring rather than inflow and outflow. 2.9.1.2 Loads Loads are typically calculated by the physical or mathematical combination of a number of individual concentration measurements, which have been assigned by some means an associated flow volume. A variety of methods are available for estimation of loads. The method employed is dependent on the sampling and flow measurement techniques used. Sampling approaches include collection of either timed samples, flow weighted samples, or some combination of both. Likewise, flow can be collected continuously,
Urban Stormwater BMP Performance Monitoring
A Guidance Manual for Meeting the National Stormwater BMP Database Requirements April 25, 2002
18
intermittently, or modeled from other hydrologic information such as rain gauge information, or gauging conducted in a nearby watershed. Many BMP monitoring studies focus efforts on water quality sample collection and neglect flow measurement. Accurate flow measurement or well-calibrated flow modeling is essential for loading determination. Loads are often most useful for assessing the impact of a BMP where receiving waters are lakes or estuaries where long-term loadings can cause water quality problems outside of storms. Where the effluent flow rate from a particular BMP is small compared to the flow rate of the receiving water body, potential downstream impairments are typically not dependent on concentrations, but the absolute load of pollutant reaching the receiving water. For example, loads are the central issue in BMP studies that have direct links to receiving water bodies that are regulated under the Total Maximum Daily Load (TMDL) program, particularly where the concern is pollutants deposited in slow moving systems. Dry weather flows can also contribute substantially to long-term loading. In addition, “on-line” BMPs (ponds and possibly filters) that have appreciable dry weather flows passing through them, may have reduced “capacity” for storage of wet weather pollutants. For example, pond performance may also be affected by the amount of water in the pond before the event, and filters may have some of their adsorption capacity consumed by pollutants and other constituents during dry weather flows. 2.9.1.3 Event Mean Concentrations The term event mean concentration (EMC) is a statistical parameter used to represent the flow-proportional average concentration of a given parameter during a storm event. It is defined as the total constituent mass divided by the total runoff volume. The calculation of EMCs from discrete observations is discussed in detail in Section 2.5.3. When combined with flow measurement data, the EMC can be used to estimate the pollutant loading from a given storm. The EMC approach to understanding BMP efficiency is primarily aimed at wet weather flows. Under most circumstances, the EMC provides the most useful means for quantifying the level of pollution resulting from a runoff event. Collection of EMC data has been the primary focus of the National Stormwater Best Management Practices Database Project. 2.9.2 Measures of BMP Efficiency The efficiency of stormwater BMPs (how well a BMP or BMP system removes pollutants or results in acceptable effluent quality) can be evaluated in a number of ways. An understanding of how BMP monitoring data will be analyzed and evaluated is essential to establishing a useful BMP monitoring study. The different methods used to date are explained in this section to illustrate historical approaches and provide context for the method recommended in this manual (Effluent Probability Method), which is

Urban Stormwater BMP Performance Monitoring
A Guidance Manual for Meeting the National Stormwater BMP Database Requirements April 25, 2002
19
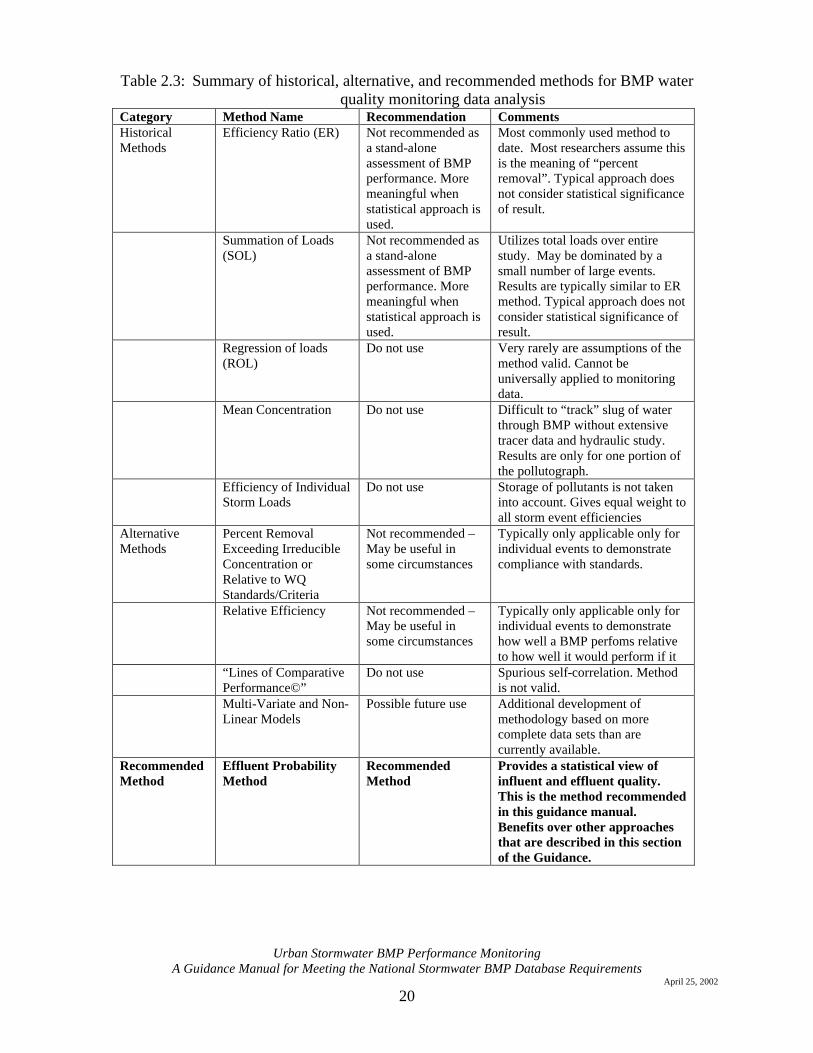
presented at the end of this section. The following table (Table 2.3) summarizes all of the methods examined by this guidance.
Urban Stormwater BMP Performance Monitoring
A Guidance Manual for Meeting the National Stormwater BMP Database Requirements April 25, 2002
20
Table 2.3: Summary of historical, alternative, and recommended methods for BMP water quality monitoring data analysis
Category Method Name Recommendation Comments Historical Methods
Efficiency Ratio (ER) Not recommended as a stand-alone assessment of BMP performance. More meaningful when statistical approach is used.
Most commonly used method to date. Most researchers assume this is the meaning of “percent removal”. Typical approach does not consider statistical significance of result.
Summation of Loads (SOL)
Not recommended as a stand-alone assessment of BMP performance. More meaningful when statistical approach is used.
Utilizes total loads over entire study. May be dominated by a small number of large events. Results are typically similar to ER method. Typical approach does not consider statistical significance of result.
Regression of loads (ROL)
Do not use Very rarely are assumptions of the method valid. Cannot be universally applied to monitoring data.
Mean Concentration Do not use Difficult to “track” slug of water through BMP without extensive tracer data and hydraulic study. Results are only for one portion of the pollutograph.
Efficiency of Individual Storm Loads
Do not use Storage of pollutants is not taken into account. Gives equal weight to all storm event efficiencies
Alternative Methods
Percent Removal Exceeding Irreducible Concentration or Relative to WQ Standards/Criteria
Not recommended – May be useful in some circumstances
Typically only applicable only for individual events to demonstrate compliance with standards.
Relative Efficiency Not recommended – May be useful in some circumstances
Typically only applicable only for individual events to demonstrate how well a BMP perfoms relative to how well it would perform if it
“Lines of Comparative Performance©”
Do not use Spurious self-correlation. Method is not valid.
Multi-Variate and Non-Linear Models
Possible future use Additional development of methodology based on more complete data sets than are currently available.
Recommended Method
Effluent Probability Method
Recommended Method
Provides a statistical view of influent and effluent quality. This is the method recommended in this guidance manual. Benefits over other approaches that are described in this section of the Guidance.
Urban Stormwater BMP Performance Monitoring
A Guidance Manual for Meeting the National Stormwater BMP Database Requirements April 25, 2002
21
2.9.2.1 Historical Approaches A variety of pollutant removal methods have been utilized in BMP monitoring studies to evaluate efficiency. This section describes and gives examples of methods employed by different investigators. Historically, one of six methods has been used by investigators to calculate BMP efficiency: • Efficiency ratio • Summation of loads • Regression of loads • Mean concentration • Efficiency of individual storm loads • Reference watersheds and before/after studies Although use of each of these methods provides a single number that summarizes efficiency of the BMP in removing a particular pollutant, they are not designed to look at removal statistically, and thus, do not provide enough information to determine if the differences in inflow and outflow water quality measures are statistically significant. Efficiency Ratio
Definition The efficiency ratio is defined in terms of the average event mean concentration (EMC) of pollutants over some time period:
EMCinlet averageEMCoutlet average - EMCinlet average
EMCinlet averageEMCoutlet average
1 =−=ER
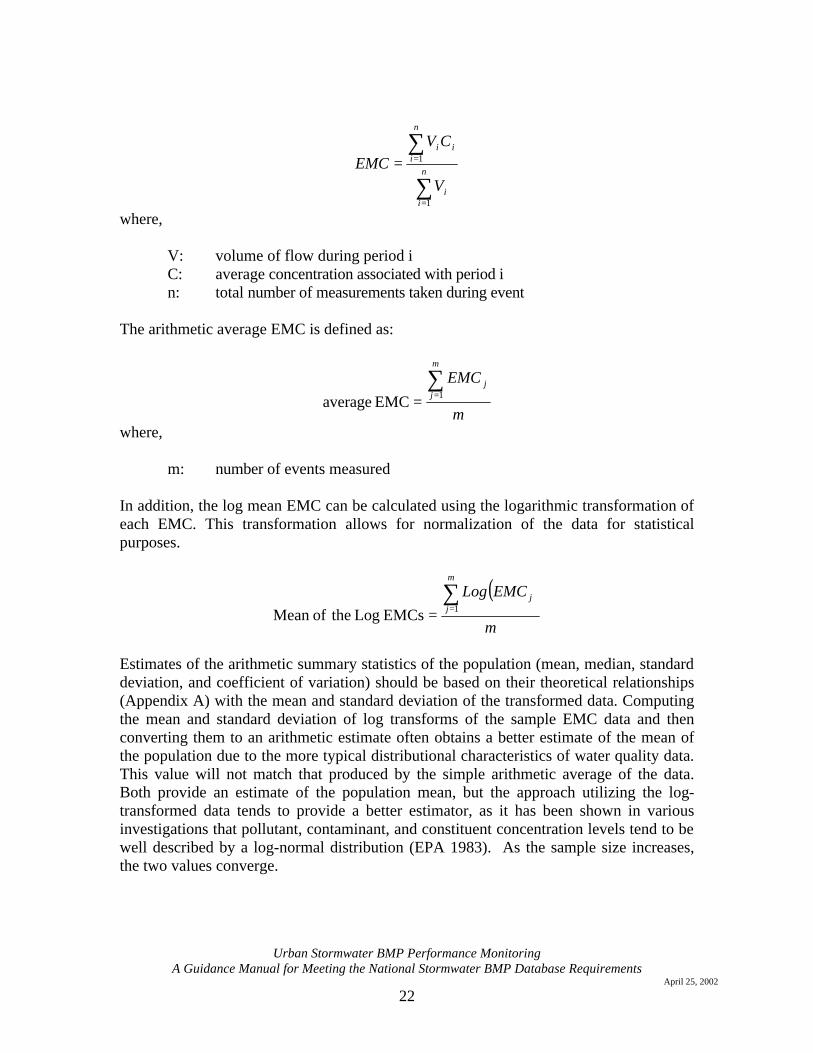
EMCs can be either collected as flow weighted composite samples in the field or calculated from discrete measurements. The EMC for an individual event or set of field measurements, where discrete samples have been collected, is defined as:
Urban Stormwater BMP Performance Monitoring
A Guidance Manual for Meeting the National Stormwater BMP Database Requirements April 25, 2002
22
∑
∑
=
==n
ii
n
iii
V
CVEMC
1
1
where,
V: volume of flow during period i C: average concentration associated with period i n: total number of measurements taken during event
The arithmetic average EMC is defined as:
m
EMCm
jj∑
== 1EMC average
where,
m: number of events measured In addition, the log mean EMC can be calculated using the logarithmic transformation of each EMC. This transformation allows for normalization of the data for statistical purposes.
( )m
EMCLogm
jj∑
== 1EMCs Log theofMean
Estimates of the arithmetic summary statistics of the population (mean, median, standard deviation, and coefficient of variation) should be based on their theoretical relationships (Appendix A) with the mean and standard deviation of the transformed data. Computing the mean and standard deviation of log transforms of the sample EMC data and then converting them to an arithmetic estimate often obtains a better estimate of the mean of the population due to the more typical distributional characteristics of water quality data. This value will not match that produced by the simple arithmetic average of the data. Both provide an estimate of the population mean, but the approach utilizing the log-transformed data tends to provide a better estimator, as it has been shown in various investigations that pollutant, contaminant, and constituent concentration levels tend to be well described by a log-normal distribution (EPA 1983). As the sample size increases, the two values converge.
Urban Stormwater BMP Performance Monitoring
A Guidance Manual for Meeting the National Stormwater BMP Database Requirements April 25, 2002
23
Assumptions This method: • Weights EMCs from all storms equally regardless of relative magnitude of storm.
For example, a high concentration/high volume event has equal weight in the average EMC as a low concentration/low volume event. The logarithmic data transformation approach tends to minimize the difference between the EMC and mass balance calculations.
• Is most useful when loads are directly proportional to storm volume. For work
conducted on nonpoint pollution (i.e., inflows), the EMC has been shown to not vary significantly with storm volume. Accuracy of this method will vary based on the BMP type.
• Minimizes the potential impacts of smaller/”cleaner” storm events on actual
performance calculations. For example, in a storm by storm efficiency approach, a low removal value for such an event is weighted equally to a larger value.
• Allows for the use of data where portions of the inflow or outflow data are missing,
based on the assumption that the inclusion of the missing data points would not significantly impact the calculated average EMC.
Comments • This method is taken directly from non-point pollution studies and does a good job
characterizing inflows to BMPs but fails to take into account some of the complexities of BMP design. For example, some BMPs may not have outflow EMCs that are normally distributed (e.g., media filters and other BMPs that treat to a relatively constant level that is independent of inflow concentrations).
• This method also assumes that if all storms at the site had been monitored, the
average inlet and outlet EMCs would be similar to those that were monitored. • Under all circumstances this method should be supplemented with an appropriate
non-parametric (or if applicable parametric) statistical test indicating if the differences in mean EMCs are statistically significant (it is better to show the actual level of significance found, than just noting if the result was significant, assuming a 0.05 level).
Urban Stormwater BMP Performance Monitoring
A Guidance Manual for Meeting the National Stormwater BMP Database Requirements April 25, 2002
24
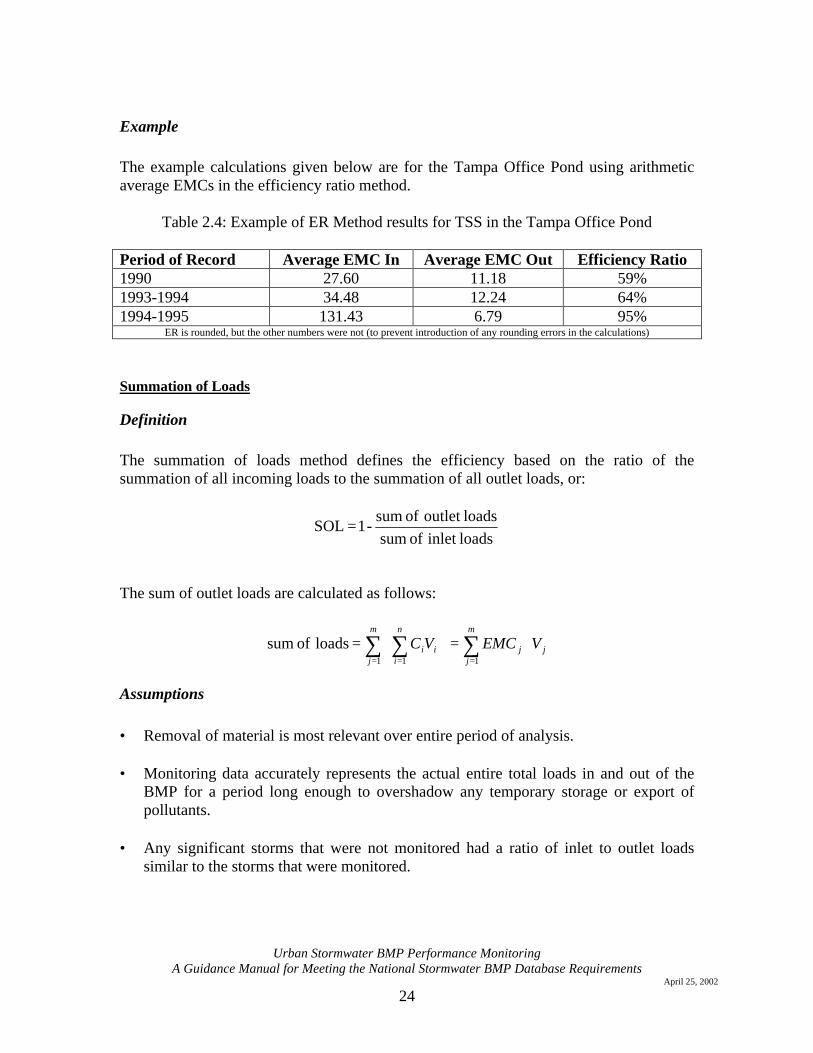
Example The example calculations given below are for the Tampa Office Pond using arithmetic average EMCs in the efficiency ratio method.
Table 2.4: Example of ER Method results for TSS in the Tampa Office Pond Period of Record Average EMC In Average EMC Out Efficiency Ratio 1990 27.60 11.18 59% 1993-1994 34.48 12.24 64% 1994-1995 131.43 6.79 95%
ER is rounded, but the other numbers were not (to prevent introduction of any rounding errors in the calculations)
Summation of Loads
Definition The summation of loads method defines the efficiency based on the ratio of the summation of all incoming loads to the summation of all outlet loads, or:
loadsinlet of sumloadsoutlet of sum
-1 SOL =
The sum of outlet loads are calculated as follows:
j
m
jj
m
j
n
iii VEMCVC ⋅=
= ∑∑ ∑
== = 11 1
loads of sum
Assumptions • Removal of material is most relevant over entire period of analysis. • Monitoring data accurately represents the actual entire total loads in and out of the
BMP for a period long enough to overshadow any temporary storage or export of pollutants.
• Any significant storms that were not monitored had a ratio of inlet to outlet loads
similar to the storms that were monitored.
Urban Stormwater BMP Performance Monitoring
A Guidance Manual for Meeting the National Stormwater BMP Database Requirements April 25, 2002
25
• No materials were exported during dry periods, or if they were, the ratio of inlet to outlet loads during these periods was similar to the ratio of the loads during the monitored storms.
Comments • A small number of large storms typically dominate efficiency. • If toxics are a concern then this method does not account for day-to-day releases,
unless dry weather loads in and out are also accounted for. In many cases long-term dry weather loads can exceed those resulting from wet weather flows.
• Under all circumstances this method should be supplemented with an appropriate
non-parametric (or if applicable parametric) statistical test indicating if the differences in loads are statistically significant (it would be better to show the actual level of significance found, rather than just noting if the result was significant, assuming a 0.05 level).
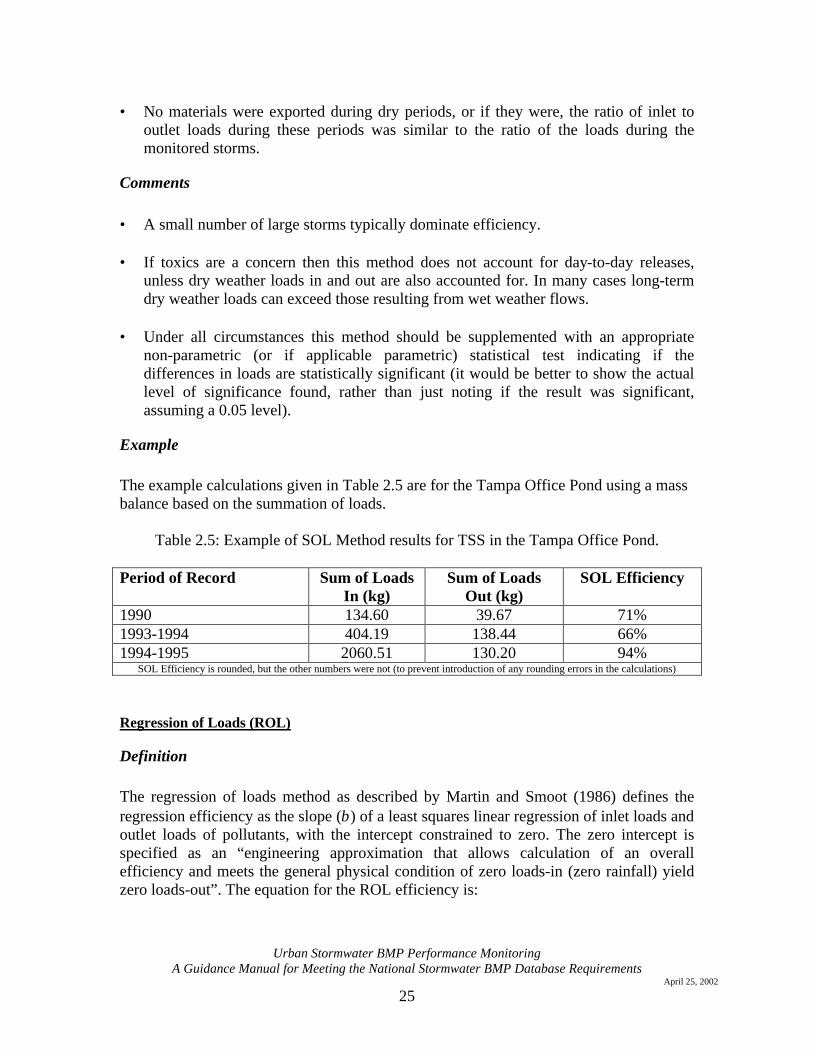
Example The example calculations given in Table 2.5 are for the Tampa Office Pond using a mass balance based on the summation of loads.
Table 2.5: Example of SOL Method results for TSS in the Tampa Office Pond.
Period of Record Sum of Loads In (kg)
Sum of Loads Out (kg)
SOL Efficiency
1990 134.60 39.67 71% 1993-1994 404.19 138.44 66% 1994-1995 2060.51 130.20 94%
SOL Efficiency is rounded, but the other numbers were not (to prevent introduction of any rounding errors in the calculations)
Regression of Loads (ROL)
Definition The regression of loads method as described by Martin and Smoot (1986) defines the regression efficiency as the slope (β) of a least squares linear regression of inlet loads and outlet loads of pollutants, with the intercept constrained to zero. The zero intercept is specified as an “engineering approximation that allows calculation of an overall efficiency and meets the general physical condition of zero loads-in (zero rainfall) yield zero loads-out”. The equation for the ROL efficiency is:

Urban Stormwater BMP Performance Monitoring
A Guidance Manual for Meeting the National Stormwater BMP Database Requirements April 25, 2002
26
in Loadsout Loads
in Loads out Loads −=•= ββ
The percent reduction in loads across the BMP is estimated as:
in Loadsout Loads
11RemovalPercent −=−= β
Due to the nature of stormwater event monitoring, it is rare that all of the assumptions for this method are valid, particularly requirements for regression analysis. The example calculations and plots provided in this section are from one of the better studies available at the time this manual was written, and as can be seen from the ROL plots, the data does not meet the requirements for proper simple linear regression analysis.
Assumptions • Any significant storms that were not monitored had a ratio of inlet to outlet loads
similar to the storms that were monitored. The slope of the regression line would not significantly change with additional data.
• No materials were exported during dry periods, or if they were, the ratio of inlet to
outlet loads during these periods was similar to the ratio of the loads during the monitored storms.
• The data is well represented by a least squares linear regression, that is:
o The data is “evenly” spaced along the x-axis.
o Using an analysis of variance on the regression, the slope coefficient is significantly different from zero (the p value for the coefficient should typically be less than 0.05, for example).
o A check of the residuals shows that the data meets regression requirements.
The residuals should be random (a straight line on probability paper) and the residuals should not form any trend with predicted value or with time (i.e., they form a band of random scatter when plotted).
Urban Stormwater BMP Performance Monitoring
A Guidance Manual for Meeting the National Stormwater BMP Database Requirements April 25, 2002
27
Comments • A few data points often control the slope of the line due to clustering of loads about
the mean storm size. Regressions are best used where data is equally populous through the range to be examined. This is readily observed in the examples that follow (See Figures 2.1 through 2.3).
• The process of constraining the intercept of the regression line to the origin is
questionable and in some cases could significantly misrepresent the data. It may be more useful to apply the Regression of Loads method over some subset of the data without requiring that the intercept be constrained to the origin. The problem with this alternative approach is that a large number of data points are required in order to get a good fit of the data. Often a meaningful regression cannot be made using the data that was collected. This is well illustrated by the very low R2 values in the table below. Forcing the line through the origin, in these cases, provides a regression line even where no useful trend is present.
• There is sufficient evidence that this first order polynomial (straight line) fit is not
appropriate over a large range of loadings. Very small events are much more likely to demonstrate low efficiency where larger events may demonstrate better overall efficiency depending on the design of the BMP.
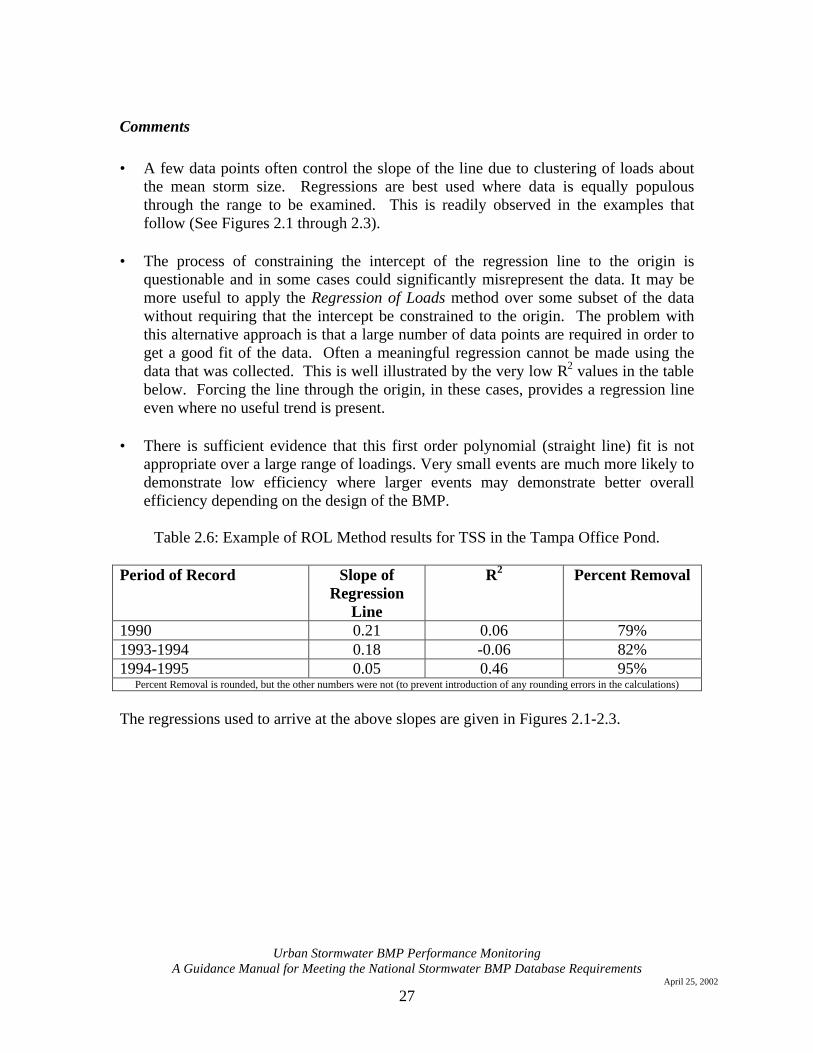
Table 2.6: Example of ROL Method results for TSS in the Tampa Office Pond.
Period of Record Slope of
Regression Line
R2 Percent Removal
1990 0.21 0.06 79% 1993-1994 0.18 -0.06 82% 1994-1995 0.05 0.46 95%
Percent Removal is rounded, but the other numbers were not (to prevent introduction of any rounding errors in the calculations) The regressions used to arrive at the above slopes are given in Figures 2.1-2.3.
Urban Stormwater BMP Performance Monitoring
A Guidance Manual for Meeting the National Stormwater BMP Database Requirements April 25, 2002
28
0 5.0 10.0 15.0 20.0 25.0LOAD IN (KG)
0
1.0
2.0
3.0
4.0
5.0
6.0
7.0
8.0
LOA
D O
UT
(KG
)
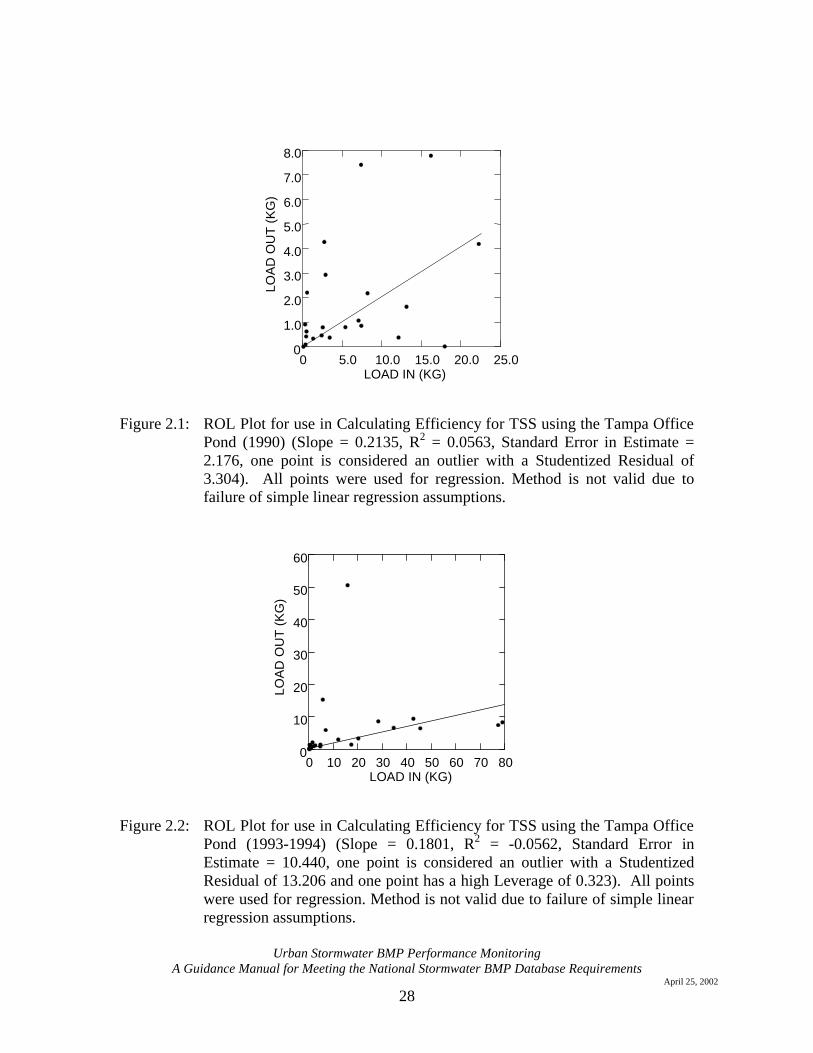
Figure 2.1: ROL Plot for use in Calculating Efficiency for TSS using the Tampa Office
Pond (1990) (Slope = 0.2135, R2 = 0.0563, Standard Error in Estimate = 2.176, one point is considered an outlier with a Studentized Residual of 3.304). All points were used for regression. Method is not valid due to failure of simple linear regression assumptions.
0 10 20 30 40 50 60 70 80LOAD IN (KG)
0
10
20
30
40
50
60
LOA
D O
UT
(K
G)
Figure 2.2: ROL Plot for use in Calculating Efficiency for TSS using the Tampa Office
Pond (1993-1994) (Slope = 0.1801, R2 = -0.0562, Standard Error in Estimate = 10.440, one point is considered an outlier with a Studentized Residual of 13.206 and one point has a high Leverage of 0.323). All points were used for regression. Method is not valid due to failure of simple linear regression assumptions.
Urban Stormwater BMP Performance Monitoring
A Guidance Manual for Meeting the National Stormwater BMP Database Requirements April 25, 2002
29
0 100 200 300 400 500 600 700LOAD IN (KG)
0
10
20
30
40
LOA
D O
UT
(K
G)
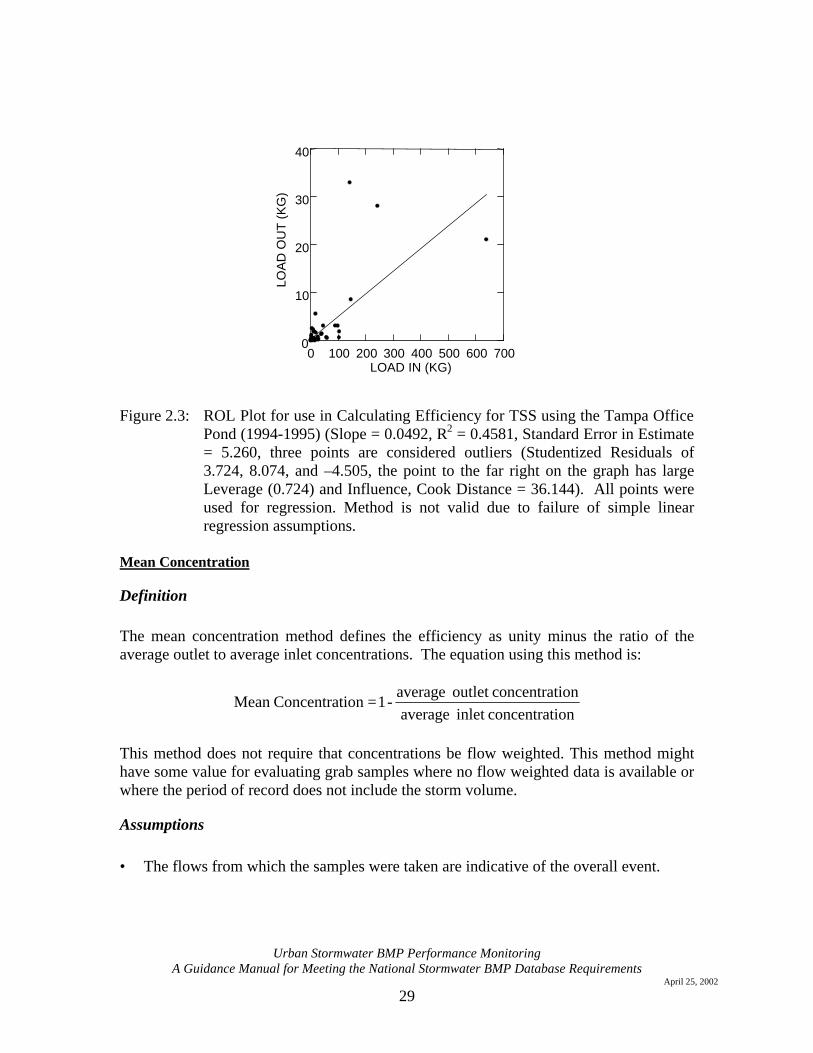
Figure 2.3: ROL Plot for use in Calculating Efficiency for TSS using the Tampa Office
Pond (1994-1995) (Slope = 0.0492, R2 = 0.4581, Standard Error in Estimate = 5.260, three points are considered outliers (Studentized Residuals of 3.724, 8.074, and –4.505, the point to the far right on the graph has large Leverage (0.724) and Influence, Cook Distance = 36.144). All points were used for regression. Method is not valid due to failure of simple linear regression assumptions.
Mean Concentration
Definition The mean concentration method defines the efficiency as unity minus the ratio of the average outlet to average inlet concentrations. The equation using this method is:
ionconcentratinlet averageionconcentratoutlet average
-1 ion ConcentratMean =
This method does not require that concentrations be flow weighted. This method might have some value for evaluating grab samples where no flow weighted data is available or where the period of record does not include the storm volume.
Assumptions • The flows from which the samples were taken are indicative of the overall event.
Urban Stormwater BMP Performance Monitoring
A Guidance Manual for Meeting the National Stormwater BMP Database Requirements April 25, 2002
30
Comments • This method might be useful for calculating BMP’s effectiveness in reducing acute
toxicity immediately downstream of the BMP. This is due to the fact that acute toxicity is measured as a threshold concentration value of a specific constituent in the effluent at or near the point of discharge.
• This methods weights individual samples equally. Biases could occur due to
variations in sampling protocols or sporadic sampling (i.e., collecting many samples close in time and others less frequently). The sample collection program specifics are not accounted for in the method and estimated efficiencies are often not comparable between studies.
• There is appreciable lag time for most BMPs between when a slug of water enters a
BMP and when the slug leaves the BMP. Unless this lag time is estimated (e.g., through tracer studies) results from this approach can be quite inaccurate. Results of this method may be particularly difficult to interpret where lag time is ignored or not aggressively documented.
• This method does not account for storage capacity. Typically BMPs will have an
equal or lesser volume of outflow than of inflow. On a mass basis this affects removal, since volume (or flow) is used with concentration to determine mass for a storm event,
ionconcentratinlet averageionconcentratoutlet average
-1 C
-1 out ≥inin
out
VCV
where,
Cin: Concentration In Cout: Concentration Out Vin: Volume In Vout: Volume Out
In this respect, it is often more conservative (i.e., lower removal efficiency stated) to use a concentration rather than mass-based removal approach.
Efficiency of Individual Storm Loads
Definition The Efficiency of Individual Storm Loads (ISL) method calculates a BMP’s efficiency for each storm event based on the loads in and the loads out. The mean value of these

Urban Stormwater BMP Performance Monitoring
A Guidance Manual for Meeting the National Stormwater BMP Database Requirements April 25, 2002
31
individual efficiencies can be taken as the overall efficiency of the BMP. The efficiency of the BMP for a single storm is given by:
in
out
LoadLoad
−= 1 Efficiency Storm
The average efficiency for all monitored storms is:
m
m
∑== 1j
jEfficiency StormEfficiency Average
where,
m: number of storms
Assumptions • Storm size or other storm factors do not play central roles in the computation of
average efficiency of a BMP. • Storage and later release of constituents from one storm to the next is negligible. • The selection of storms monitored does not significantly skew the performance
calculation.
Comments • The weight of all storms is equal. Large storms do not dominate the efficiency in this
scenario. The efficiency is viewed as an average performance regardless of storm size.
• Some data points cannot be used due to the fact that there is not a corresponding
measurement at either the inflow or the outflow for a particular storm, and thus efficiency cannot always be calculated on a storm-by-storm basis. This is not true for the ER method, however it is a limitation of the Summation of Load Method.
• Storm by storm analysis neglects the fact that the outflow being measured may have a
limited relationship to inflow in BMPs that have a permanent pool. For example, if a permanent pool is sized to store a volume equal to the average storm, about 60 to 70 percent of storms would be less than this volume [from studies conducted using SYNOP (EPA 1989)].

Urban Stormwater BMP Performance Monitoring
A Guidance Manual for Meeting the National Stormwater BMP Database Requirements April 25, 2002
32
Table 2.7: Example of Individual Storm Loads Method results for TSS in the Tampa
Office Pond.
Period of Record Efficiency 1990 29% 1993-1994 -2% 1994-1995 89%
Summary and Comparison of Historical Methods The table below shows the results of the various historical methods shown above for calculating efficiency for the Tampa Office Pond. The four methods demonstrated (mean concentration method was not applicable to data available from the Tampa Office Pond study) vary widely in their estimates of percent removal depending on the assumptions of each method as discussed above.
Table 2.8: Comparison of BMP efficiency methods.
Method Design Efficiency
Ratio (ER) Summation
of Loads (SOL)
Regression of Loads (ROL)
Efficiency of Individual Storms
1990 59% 71% 79% 29% 1993-1994 64% 66% 82% -2% 1994-1995 95% 94% 95% 89% 2.9.2.2 Other Methods and Techniques “Irreducible Concentration” and “Achievable Efficiency” As treatment occurs and pollutants in stormwater become less concentrated, they become increasingly hard to remove. There appears to be a practical limit to the effluent quality that any BMP can be observed to achieve for the stormwater it treats. This limit is dictated by the chemical and physical nature of the pollutant of concern, the treatment mechanisms and processes within the BMP, and the sensitivity of laboratory analysis techniques to measure the pollutant. This concept of “irreducible concentration” has significant implications for how BMP efficiency estimates are interpreted. However, it is possible to get concentrations as low as desired, but in most cases achieving extremely low effluent concentrations may not be practical (i.e., would require treatment trains or exotic methods). For example, colloids are typically viewed as “never” being able to be removed in a pond (settling is the primary mechanism for treatment in ponds), despite the fact that they could be further removed through chemical addition. The term “irreducible concentration” (C*) has been used in stormwater literature (Schueler 2000) to represent the lowest effluent concentration for a given parameter that
Urban Stormwater BMP Performance Monitoring
A Guidance Manual for Meeting the National Stormwater BMP Database Requirements April 25, 2002
33
can be achieved by a specific type of stormwater management practice. Schueler examined the effluent concentrations achieved by stormwater management practices from published studies for several parameters. From this research, the following estimates of “irreducible concentrations” for TSS, Total Phosphorous, Total Nitrogen, Nitrate-Nitrogen, and TKN for all stormwater management practices were proposed:
Table 2.9: “Irreducible concentrations” as reported by Scheuler, 2000.
Contaminant Irreducible Concentration TSS 20 to 40 mg/L Total Phosphorous 0.15 to 0.2 mg/L Total Nitrogen 1.9 mg/L Nitrate-Nitrogen 0.7 mg/L TKN 1.2 mg/L
Recent research (ASCE 2000) indicates that achievable effluent concentrations vary appreciably between BMP types. For example, in many cases, well-designed sand filters can achieve lower effluent concentrations of TSS than well-designed detention facilities or grassed swales. However, sand filters have issues with long-term maintenance of flow treatment volumes. The typical approach to reporting the ability of a BMP to remove pollutants from stormwater entails comparing the amount of pollutant removed by the BMP to the total quantity of that pollutant. The concept of irreducible concentration, however, suggests that in some cases it may be more useful to report the efficiency of the BMP relative to some achievable level of treatment (i.e. express efficiency as the ability of the BMP to remove the fraction of pollutant which is able to be removed by a particular practice.) The following example illustrates this approach. Suppose that two similar BMPs have been monitored and generated the following results for TSS:
Table 2.10: Example TSS results for typical ER Method
Percent TSS Removal Using Absolute Scale BMP A BMP B
Influent Concentration 200 mg/L 60 mg/L Effluent Concentration 100 mg/L 30 mg/L
Efficiency Ratio 50% 50 % Clearly, the effluent from BMP B is higher quality than that from BMP A, however comparing percent removals between BMPs alone would indicate that both BMPs have an equal efficiency. Methods have been suggested for quantifying the dependence of BMP efficiency on influent concentration. The following section presents one such method advanced by Minton (1998).
Urban Stormwater BMP Performance Monitoring
A Guidance Manual for Meeting the National Stormwater BMP Database Requirements April 25, 2002
34
In order to account for the dependence of BMP efficiency on influent concentration, Minton (1998) suggests a method of evaluating BMP efficiency that would recognize the relationship between influent concentration and efficiency. The relationship is summarized as follows:
Achievable Efficiency = (Cinfluent – Climit)/ Cinfluent
where,
Cinfluent : Influent Concentration of Pollutant; and Climit : The lower attainable limit concentration of the BMP (e.g., “irreducible
concentration” or value obtained from previous monitoring of effluent quality)
For example, if a BMP had a lower treatment limit of TSS at 20mg/L concentration, then at an influent TSS concentration of 100 mg/L, it would be assigned an equivalent performance of 80%, while at an influent TSS concentration of 50 mg/L the equivalent performance would be 60%. This method relies on the ability to determine the lower attainable limit concentration, which is analogous to the “irreducible concentration” for a specific BMP, however effluent quality is best described not as a single value, but from a statistical point of view (See the Effluent Probability Method). The Achievable Efficiency may be useful in better understanding the results of the ER method in cases where the influent concentration is lower than is typically observed. Alternately, a single factor (dubbed the Relative Efficiency here) can be used to report how well a BMP is functioning during some period relative to what that BMP is theoretically or empirically able to achieve (as defined by the Achievable Efficiency). As shown below, the Relative Efficiency can be found by dividing the Efficiency Ratio by the Achievable Efficiency, thus yielding an estimate of how well the BMP performed relative to what is “achievable”.
Urban Stormwater BMP Performance Monitoring
A Guidance Manual for Meeting the National Stormwater BMP Database Requirements April 25, 2002
35
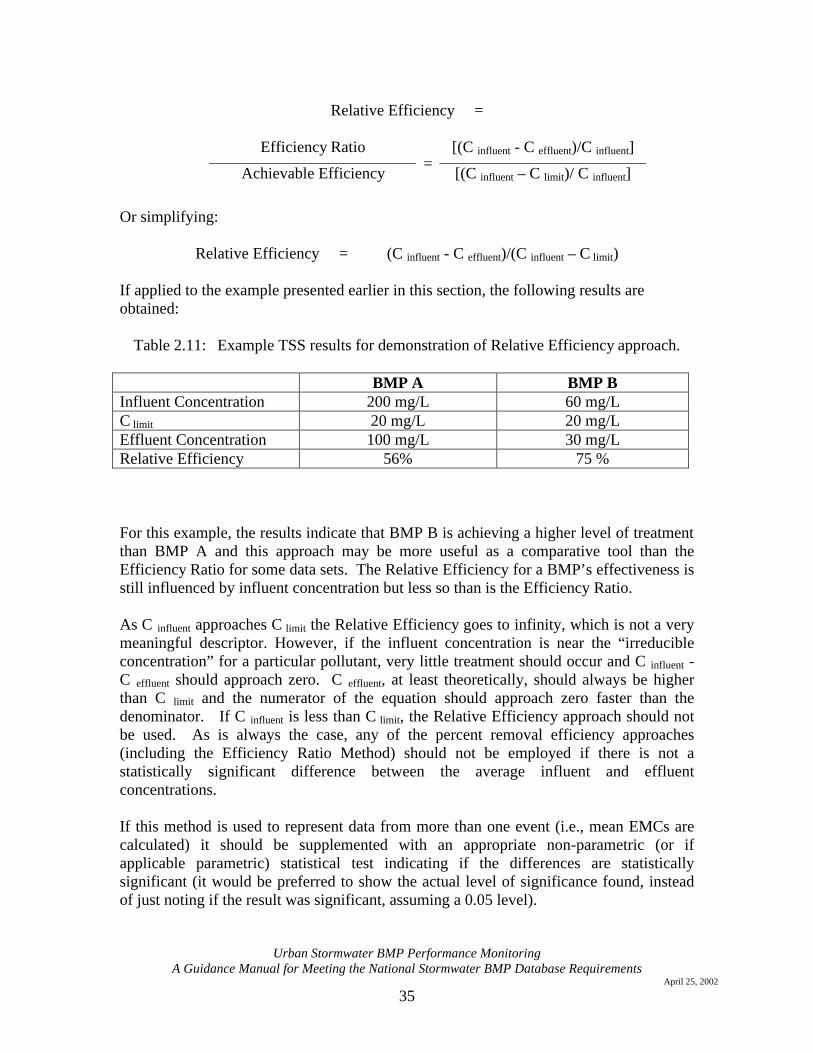
Relative Efficiency =
Efficiency Ratio [(C influent - C effluent)/C influent]
Achievable Efficiency =
[(C influent – C limit)/ C influent]
Or simplifying:
Relative Efficiency = (C influent - C effluent)/(C influent – C limit) If applied to the example presented earlier in this section, the following results are obtained:
Table 2.11: Example TSS results for demonstration of Relative Efficiency approach.
BMP A BMP B Influent Concentration 200 mg/L 60 mg/L C limit 20 mg/L 20 mg/L Effluent Concentration 100 mg/L 30 mg/L Relative Efficiency 56% 75 % For this example, the results indicate that BMP B is achieving a higher level of treatment than BMP A and this approach may be more useful as a comparative tool than the Efficiency Ratio for some data sets. The Relative Efficiency for a BMP’s effectiveness is still influenced by influent concentration but less so than is the Efficiency Ratio. As C influent approaches C limit the Relative Efficiency goes to infinity, which is not a very meaningful descriptor. However, if the influent concentration is near the “irreducible concentration” for a particular pollutant, very little treatment should occur and C influent - C effluent should approach zero. C effluent, at least theoretically, should always be higher than C limit and the numerator of the equation should approach zero faster than the denominator. If C influent is less than C limit, the Relative Efficiency approach should not be used. As is always the case, any of the percent removal efficiency approaches (including the Efficiency Ratio Method) should not be employed if there is not a statistically significant difference between the average influent and effluent concentrations. If this method is used to represent data from more than one event (i.e., mean EMCs are calculated) it should be supplemented with an appropriate non-parametric (or if applicable parametric) statistical test indicating if the differences are statistically significant (it would be preferred to show the actual level of significance found, instead of just noting if the result was significant, assuming a 0.05 level).
Urban Stormwater BMP Performance Monitoring
A Guidance Manual for Meeting the National Stormwater BMP Database Requirements April 25, 2002
36
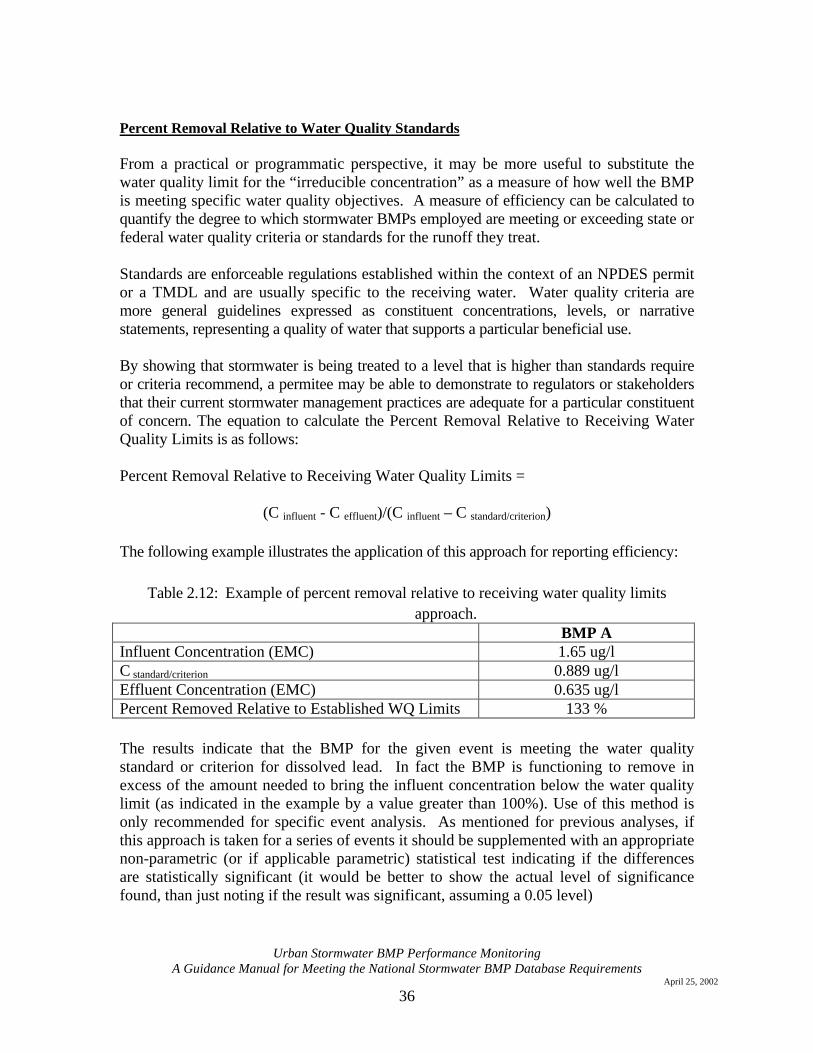
Percent Removal Relative to Water Quality Standards From a practical or programmatic perspective, it may be more useful to substitute the water quality limit for the “irreducible concentration” as a measure of how well the BMP is meeting specific water quality objectives. A measure of efficiency can be calculated to quantify the degree to which stormwater BMPs employed are meeting or exceeding state or federal water quality criteria or standards for the runoff they treat. Standards are enforceable regulations established within the context of an NPDES permit or a TMDL and are usually specific to the receiving water. Water quality criteria are more general guidelines expressed as constituent concentrations, levels, or narrative statements, representing a quality of water that supports a particular beneficial use. By showing that stormwater is being treated to a level that is higher than standards require or criteria recommend, a permitee may be able to demonstrate to regulators or stakeholders that their current stormwater management practices are adequate for a particular constituent of concern. The equation to calculate the Percent Removal Relative to Receiving Water Quality Limits is as follows: Percent Removal Relative to Receiving Water Quality Limits =
(C influent - C effluent)/(C influent – C standard/criterion) The following example illustrates the application of this approach for reporting efficiency:
Table 2.12: Example of percent removal relative to receiving water quality limits approach.
BMP A Influent Concentration (EMC) 1.65 ug/l C standard/criterion 0.889 ug/l Effluent Concentration (EMC) 0.635 ug/l Percent Removed Relative to Established WQ Limits 133 % The results indicate that the BMP for the given event is meeting the water quality standard or criterion for dissolved lead. In fact the BMP is functioning to remove in excess of the amount needed to bring the influent concentration below the water quality limit (as indicated in the example by a value greater than 100%). Use of this method is only recommended for specific event analysis. As mentioned for previous analyses, if this approach is taken for a series of events it should be supplemented with an appropriate non-parametric (or if applicable parametric) statistical test indicating if the differences are statistically significant (it would be better to show the actual level of significance found, than just noting if the result was significant, assuming a 0.05 level)

Urban Stormwater BMP Performance Monitoring
A Guidance Manual for Meeting the National Stormwater BMP Database Requirements April 25, 2002
37
“Lines of Comparative Performance©” For many stormwater treatment BMPs, the efficiency of the BMP decreases as a function of the influent concentration. Methods have been recommended that integrate this concept into efficiency evaluations. The “Lines of Comparative Performance©” (Minton 1999) is one such method. In this method, plots of percent removal as a function of the influent concentration for each storm are generated for each pollutant monitored. The results of these plots are overlain on plots of data collected from studies of similar BMPs within a region. “Lines of Comparative Performance©” are generated for the data from similar BMPs based on best professional judgment by examining the likely “irreducible concentration” for a particular pollutant, the detection limit for that pollutant, and knowledge of expected maximum achievable efficiency for a BMP type. This method has primarily been suggested as an approach to evaluate the efficiency of innovative and “unapproved” stormwater technologies. “To be accepted, the performance data points of an unapproved treatment technology must fall above and to the left of the ‘Line of Comparative Performance©’.” This approach has several major problems. The most significant flaw is the use of “spurious” self-correlation. Plots such as those shown in Figures 2.4 through 2.6 can be generated using random, normally distributed influent and effluent concentrations as seen below in Figure 2.7. As such, it is strongly recommended that this approach not be employed in BMP monitoring evaluation studies. This approach may lead to overly complicated analysis methodologies without providing additional useable information on BMP functionality. Figures 2.4-2.6 below show work conducted by Minton in the development of the Achievable Efficiency approach.
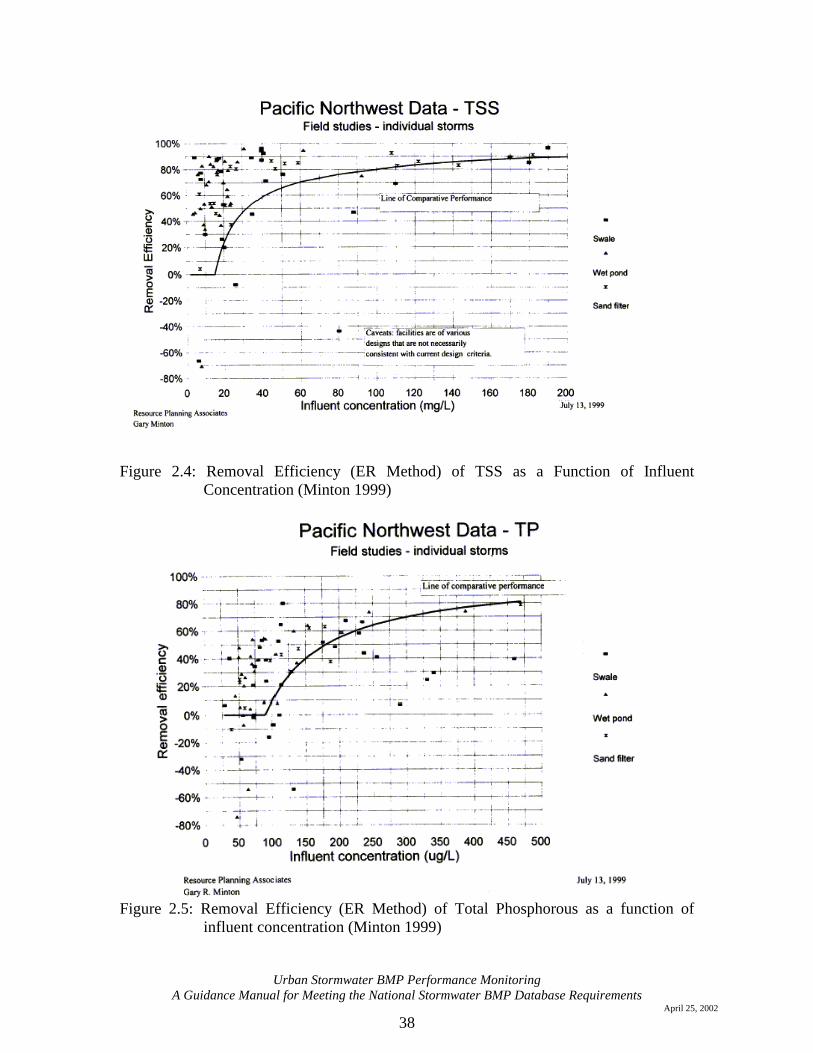
Urban Stormwater BMP Performance Monitoring
A Guidance Manual for Meeting the National Stormwater BMP Database Requirements April 25, 2002
38
Figure 2.4: Removal Efficiency (ER Method) of TSS as a Function of Influent
Concentration (Minton 1999)
Figure 2.5: Removal Efficiency (ER Method) of Total Phosphorous as a function of
influent concentration (Minton 1999)
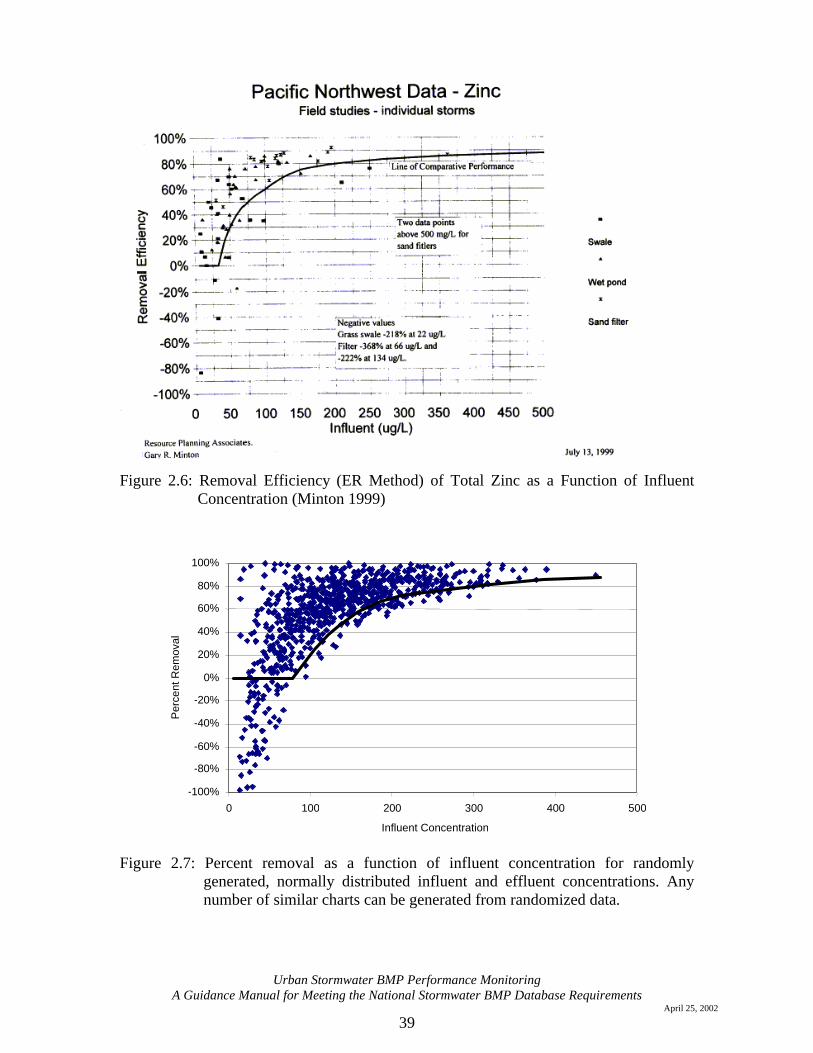
Urban Stormwater BMP Performance Monitoring
A Guidance Manual for Meeting the National Stormwater BMP Database Requirements April 25, 2002
39
Figure 2.6: Removal Efficiency (ER Method) of Total Zinc as a Function of Influent
Concentration (Minton 1999)
-100% -80% -60% -40% -20%
0% 20% 40% 60% 80%
100%
0 100 200 300 400 500 Influent Concentration
Per
cent
Rem
oval
Figure 2.7: Percent removal as a function of influent concentration for randomly
generated, normally distributed influent and effluent concentrations. Any number of similar charts can be generated from randomized data.
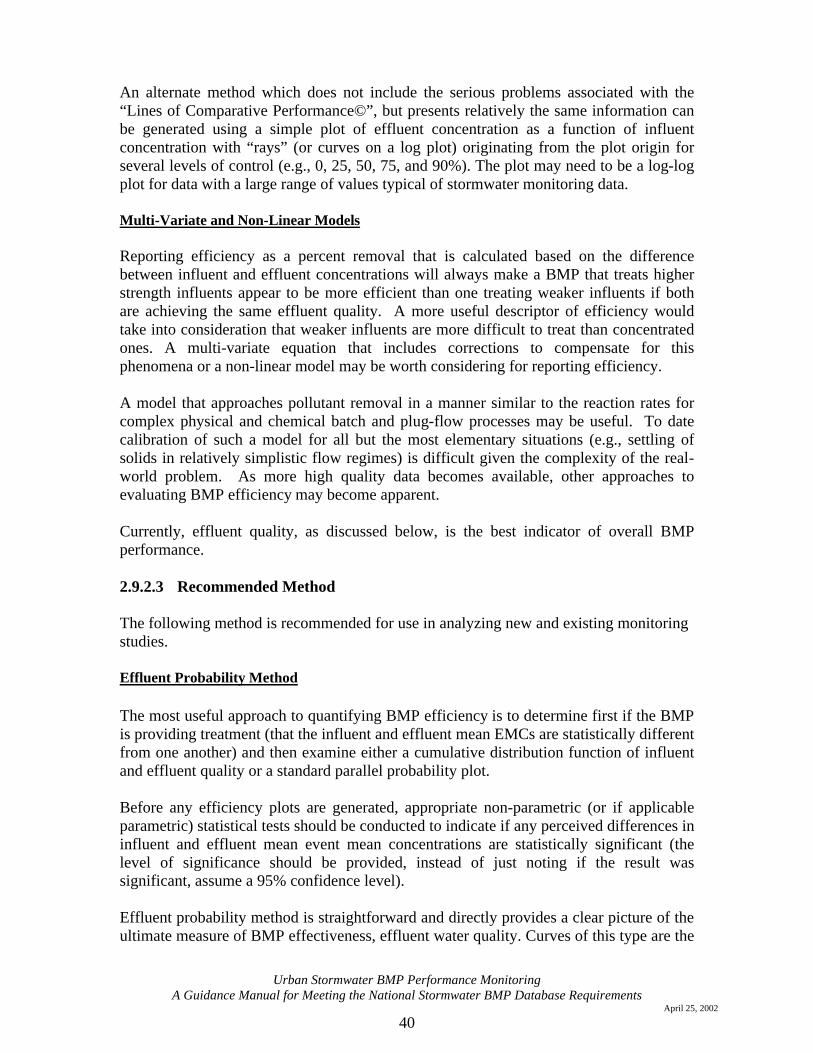
Urban Stormwater BMP Performance Monitoring
A Guidance Manual for Meeting the National Stormwater BMP Database Requirements April 25, 2002
40
An alternate method which does not include the serious problems associated with the “Lines of Comparative Performance©”, but presents relatively the same information can be generated using a simple plot of effluent concentration as a function of influent concentration with “rays” (or curves on a log plot) originating from the plot origin for several levels of control (e.g., 0, 25, 50, 75, and 90%). The plot may need to be a log-log plot for data with a large range of values typical of stormwater monitoring data. Multi-Variate and Non-Linear Models Reporting efficiency as a percent removal that is calculated based on the difference between influent and effluent concentrations will always make a BMP that treats higher strength influents appear to be more efficient than one treating weaker influents if both are achieving the same effluent quality. A more useful descriptor of efficiency would take into consideration that weaker influents are more difficult to treat than concentrated ones. A multi-variate equation that includes corrections to compensate for this phenomena or a non-linear model may be worth considering for reporting efficiency. A model that approaches pollutant removal in a manner similar to the reaction rates for complex physical and chemical batch and plug-flow processes may be useful. To date calibration of such a model for all but the most elementary situations (e.g., settling of solids in relatively simplistic flow regimes) is difficult given the complexity of the real-world problem. As more high quality data becomes available, other approaches to evaluating BMP efficiency may become apparent. Currently, effluent quality, as discussed below, is the best indicator of overall BMP performance. 2.9.2.3 Recommended Method The following method is recommended for use in analyzing new and existing monitoring studies. Effluent Probability Method The most useful approach to quantifying BMP efficiency is to determine first if the BMP is providing treatment (that the influent and effluent mean EMCs are statistically different from one another) and then examine either a cumulative distribution function of influent and effluent quality or a standard parallel probability plot. Before any efficiency plots are generated, appropriate non-parametric (or if applicable parametric) statistical tests should be conducted to indicate if any perceived differences in influent and effluent mean event mean concentrations are statistically significant (the level of significance should be provided, instead of just noting if the result was significant, assume a 95% confidence level). Effluent probability method is straightforward and directly provides a clear picture of the ultimate measure of BMP effectiveness, effluent water quality. Curves of this type are the
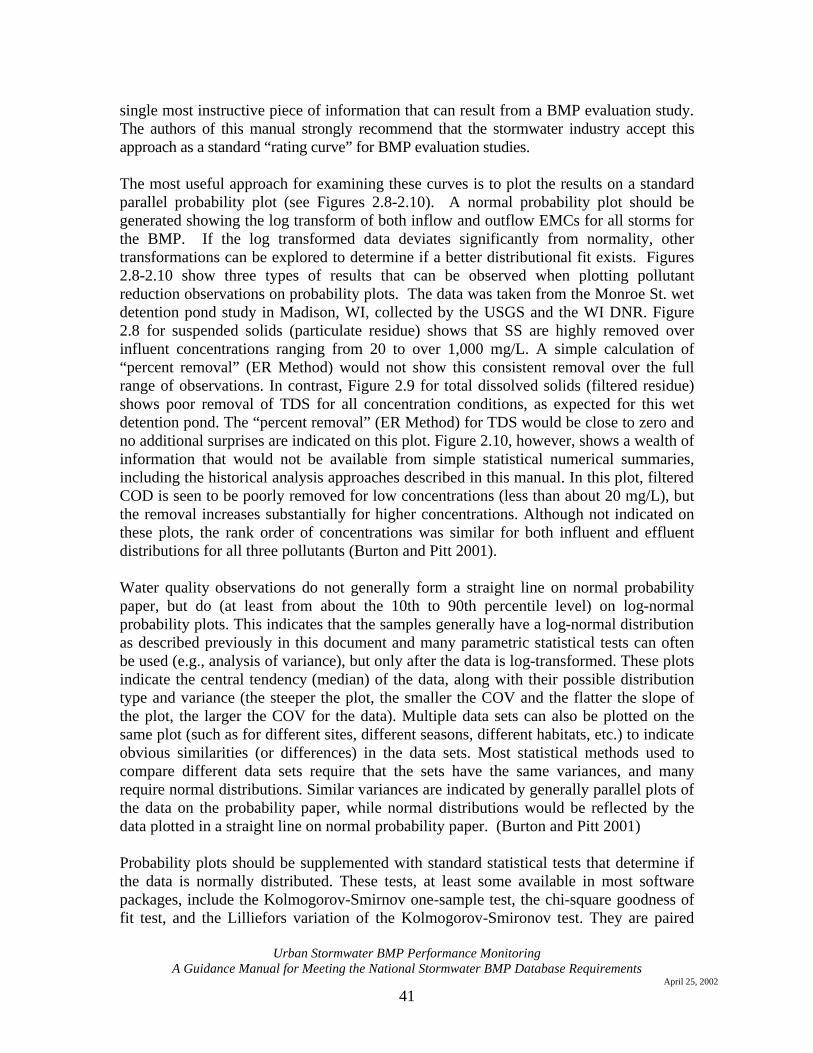
Urban Stormwater BMP Performance Monitoring
A Guidance Manual for Meeting the National Stormwater BMP Database Requirements April 25, 2002
41
single most instructive piece of information that can result from a BMP evaluation study. The authors of this manual strongly recommend that the stormwater industry accept this approach as a standard “rating curve” for BMP evaluation studies. The most useful approach for examining these curves is to plot the results on a standard parallel probability plot (see Figures 2.8-2.10). A normal probability plot should be generated showing the log transform of both inflow and outflow EMCs for all storms for the BMP. If the log transformed data deviates significantly from normality, other transformations can be explored to determine if a better distributional fit exists. Figures 2.8-2.10 show three types of results that can be observed when plotting pollutant reduction observations on probability plots. The data was taken from the Monroe St. wet detention pond study in Madison, WI, collected by the USGS and the WI DNR. Figure 2.8 for suspended solids (particulate residue) shows that SS are highly removed over influent concentrations ranging from 20 to over 1,000 mg/L. A simple calculation of “percent removal” (ER Method) would not show this consistent removal over the full range of observations. In contrast, Figure 2.9 for total dissolved solids (filtered residue) shows poor removal of TDS for all concentration conditions, as expected for this wet detention pond. The “percent removal” (ER Method) for TDS would be close to zero and no additional surprises are indicated on this plot. Figure 2.10, however, shows a wealth of information that would not be available from simple statistical numerical summaries, including the historical analysis approaches described in this manual. In this plot, filtered COD is seen to be poorly removed for low concentrations (less than about 20 mg/L), but the removal increases substantially for higher concentrations. Although not indicated on these plots, the rank order of concentrations was similar for both influent and effluent distributions for all three pollutants (Burton and Pitt 2001). Water quality observations do not generally form a straight line on normal probability paper, but do (at least from about the 10th to 90th percentile level) on log-normal probability plots. This indicates that the samples generally have a log-normal distribution as described previously in this document and many parametric statistical tests can often be used (e.g., analysis of variance), but only after the data is log-transformed. These plots indicate the central tendency (median) of the data, along with their possible distribution type and variance (the steeper the plot, the smaller the COV and the flatter the slope of the plot, the larger the COV for the data). Multiple data sets can also be plotted on the same plot (such as for different sites, different seasons, different habitats, etc.) to indicate obvious similarities (or differences) in the data sets. Most statistical methods used to compare different data sets require that the sets have the same variances, and many require normal distributions. Similar variances are indicated by generally parallel plots of the data on the probability paper, while normal distributions would be reflected by the data plotted in a straight line on normal probability paper. (Burton and Pitt 2001) Probability plots should be supplemented with standard statistical tests that determine if the data is normally distributed. These tests, at least some available in most software packages, include the Kolmogorov-Smirnov one-sample test, the chi-square goodness of fit test, and the Lilliefors variation of the Kolmogorov-Smironov test. They are paired
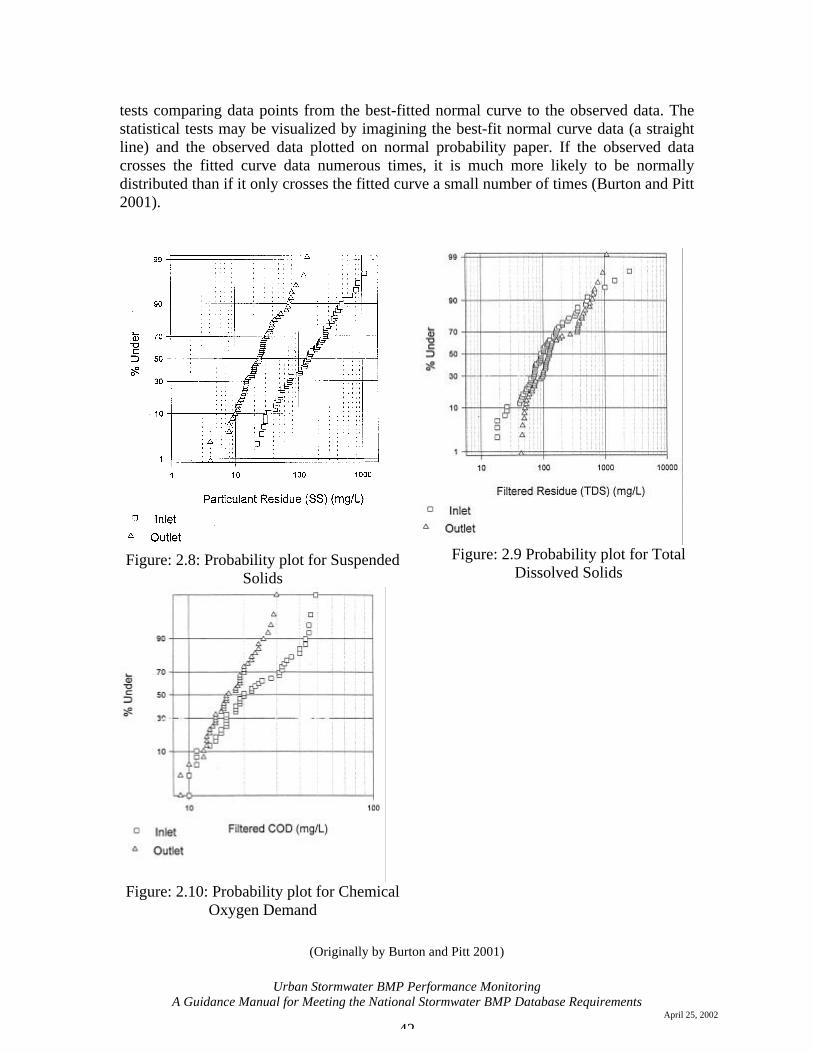
Urban Stormwater BMP Performance Monitoring
A Guidance Manual for Meeting the National Stormwater BMP Database Requirements April 25, 2002
42
tests comparing data points from the best-fitted normal curve to the observed data. The statistical tests may be visualized by imagining the best-fit normal curve data (a straight line) and the observed data plotted on normal probability paper. If the observed data crosses the fitted curve data numerous times, it is much more likely to be normally distributed than if it only crosses the fitted curve a small number of times (Burton and Pitt 2001).
Figure: 2.8: Probability plot for Suspended
Solids
Figure: 2.9 Probability plot for Total
Dissolved Solids
Figure: 2.10: Probability plot for Chemical
Oxygen Demand
(Originally by Burton and Pitt 2001)
Urban Stormwater BMP Performance Monitoring
A Guidance Manual for Meeting the National Stormwater BMP Database Requirements April 25, 2002
43
2.9.2.4 Reference Watershed Methods Many BMPs do not allow for comparison between inlet and outlet water quality parameters. In addition, it is often difficult or costly, where there are many BMPs being installed in a watershed (e.g., retrofit of all catch basins), to monitor a large number of specific locations. A reference watershed is often used to evaluate the effectiveness of a given BMP or multiple BMPs of the same type. The database allows for a watershed and all associated data to be identified for use as a reference watershed. One of the primary reasons for using a reference watershed is that for some BMPs there is no clearly defined inlet or outlet point at which to monitor water quality. Such is the case with many non-structural BMPs, porous pavements, and infiltration practices. The difficulty in determining the effectiveness of a BMP using a reference watershed approach stems from the large number of variables typically involved. When setting up a BMP monitoring study, it is advantageous to keep the watershed characteristics of the reference watershed and the test watershed as similar as possible. Unfortunately, finding two watersheds that are similar is often quite difficult, and the usefulness of the data can be compromised as a result. In order to determine the effectiveness of a BMP based on a reference watershed, an accurate accounting of the variations between the watersheds, and operational and environmental conditions is needed. The Database explicitly stores some of the key parameters required for normalization of watershed and environmental conditions. The most obvious parameter used to normalize watershed characteristics is area. If the ratio of land uses and activities within each watershed is identical in both watersheds then the watershed area can be scaled linearly. The loads found at each downstream monitoring station for each event can be scaled linearly with area as well. Difficulty arises when land use in the reference watershed is not found in the same ratio. In this case, either the effects of land use must be ignored or a portion of the load found for each event must be allocated to a land use and then scaled linearly as a function of the area covered by that land use. In many cases, the differences in land use can be ignored, (e.g., between parking lots with relatively small, but different unpaved areas). The effect of the total impervious area is relevant and should always be reported in monitoring studies. The ratio of the total impervious areas can be used to scale event loads. Scaling the loads based on impervious areas would be best used where the majority of pollutants are from runoff from the impervious areas (e.g., parking lots), or the contaminant of interest results primarily from deposition on impervious surfaces, (e.g., TSS in a highly urban area). Methods that attempt to determine BMP performance from poorly matched watersheds yield poor results at best. As the characteristics of the two watersheds diverge, the effect of the BMP is masked by the large number of variables in the system; the noise in the data becomes greater than the signal. The analysis of BMPs utilizing reference watersheds also requires incorporation of operational details of the system, (e.g., frequency of street sweeping, type of device used, device setup). Monitoring studies should always provide the frequency, extent, and other
Urban Stormwater BMP Performance Monitoring
A Guidance Manual for Meeting the National Stormwater BMP Database Requirements April 25, 2002
44
operational parameters for nonstructural BMPs. If the BMP is an alteration of the frequency of a certain practice, the system can be viewed in two ways, (1) as a control/test system, or (2) as a series of data aimed at quantifying the continuous effect of increasing or decreasing BMP frequency. In the first case, the BMP can be analyzed in a manner similar to other BMPs with reference watersheds. In the second case, the loads realized at the monitoring stations need to be correlated with the frequency using some model for the effectiveness of the practice per occurrence. 2.9.3 BMPs and BMP Systems Overflow and bypassing of treatment BMPs affect the long-term performance of the pollution control measure. Many types of BMP structures, such as detention or filtration basins, are designed to treat specific volumes of stormwater runoff. Runoff volumes (or flows) exceeding the designed storage volume or maximum flow rate are bypassed untreated or partially treated. In order to accurately assess the long-term efficiency of the BMP system, the bypass flow needs to be taken into consideration. Ideally, a third flow monitor should be installed to measure by-passed flow directly (Oswald and Mattison 1994). If monitoring data is not cost effective or physically difficult to collect, estimates of bypass can be made using inflow / outflow water balance calculations or modeled from local rainfall data, watershed hydrology, and BMP system hydraulics. The volume treated by a BMP for each event can be compared to a measured or modeled runoff volume yielding the volume of bypass. Estimates of BMP system efficiency should always be calculated for the entire BMP system (in addition to the BMP). Mass balance checks should be performed in all cases to help verify monitoring data and/or modeled flow rates.