Embed Size (px)
Citation preview
Use of SOC data by ICAP-Ethiopia for quality
improvement
Tsigereda Gadisa MD,MPH M&E Director, ICAP-Ethiopia
July, 2010
Using data for program improvement
Three key interlinked factors affecting data use1.Effective Reports compilation; relevance, validity,
completeness, timeliness, simplicity & big picture demonstration
2.Skilled Managers; result oriented, curios and good data use aptitude and committed in building result orient management culture
3.Organizational culture for evidence based learning and improvement; setting simple but informative performance measures & creating regular forum to follow though the results
Results Oriented Culture • Reward and recognize
• Encourage learning
• Seek involvement
• Use data routinely
• Lead improvement efforts
• Take responsibility
• Stimulate positive action
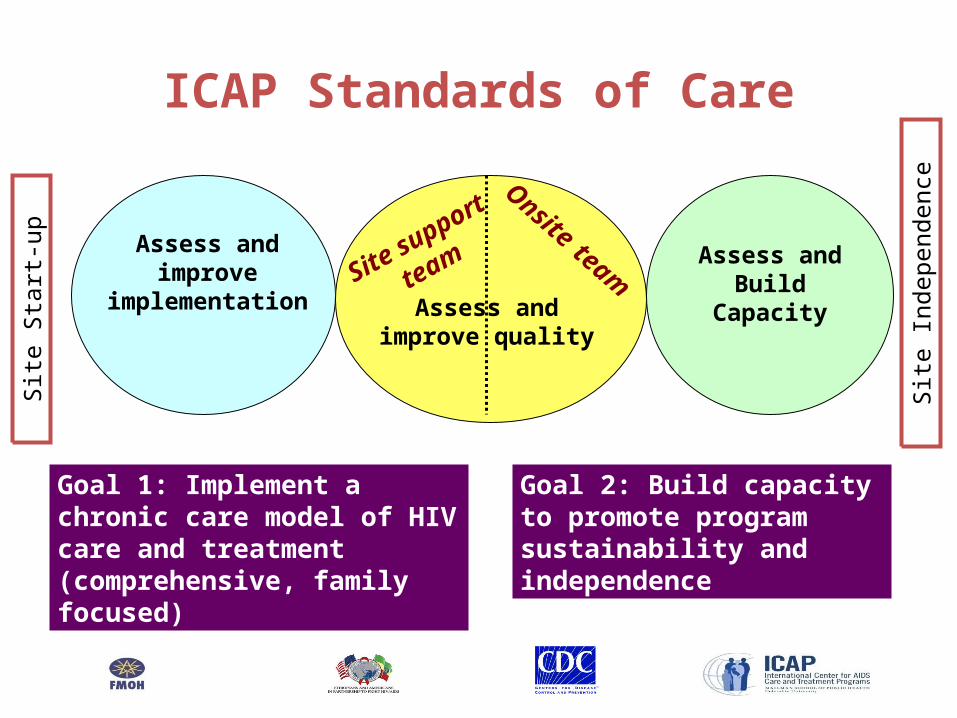
Site
Sta
rt-u
p Assess and improve implementation Site
support
team
Onsite teamAssess and
improve quality
Assess and Build
Capacity
Site
Ind
epen
denc
e
Goal 1: Implement a chronic care model of HIV care and treatment (comprehensive, family focused)
Goal 2: Build capacity to promote program sustainability and independence
ICAP Standards of Care
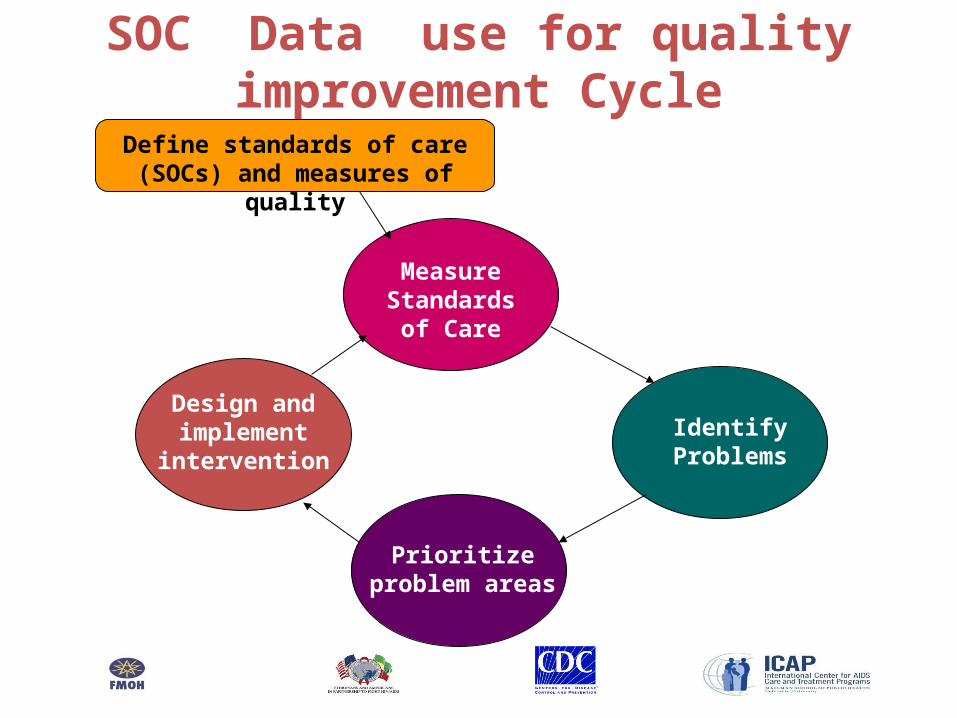
Define standards of care (SOCs) and measures of quality
Measure Standards of
Care
Identify Problems
Prioritize problem areas
Design and implement
intervention
SOC Data use for quality improvement Cycle
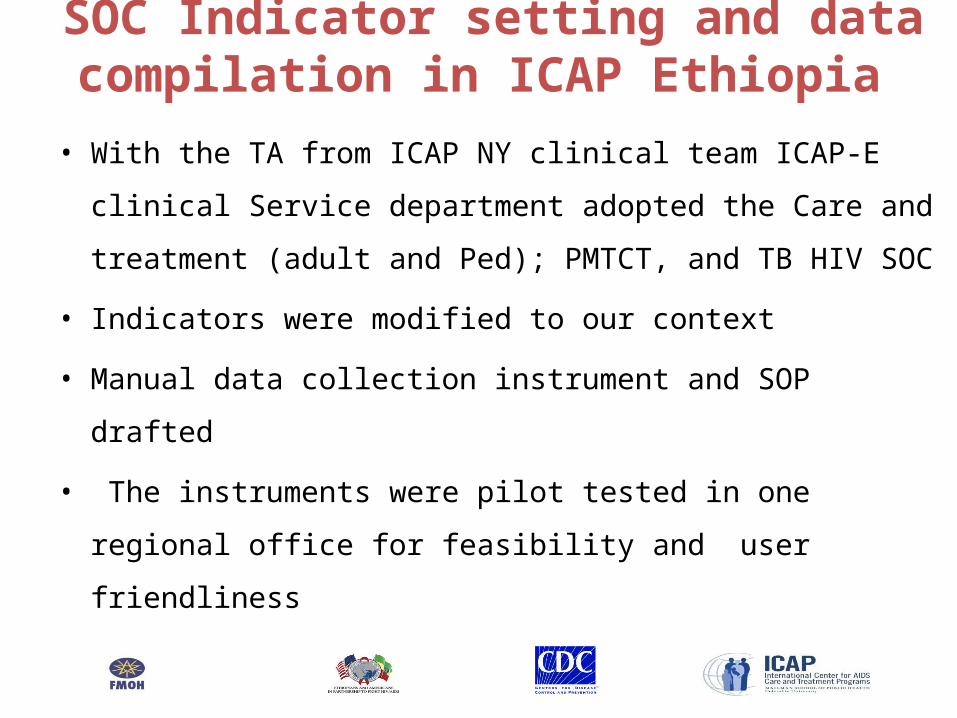
SOC Indicator setting and data compilation in ICAP Ethiopia
• With the TA from ICAP NY clinical team ICAP-E
clinical Service department adopted the Care and
treatment (adult and Ped); PMTCT, and TB HIV SOC
• Indicators were modified to our context
• Manual data collection instrument and SOP drafted
• The instruments were pilot tested in one regional
office for feasibility and user friendliness
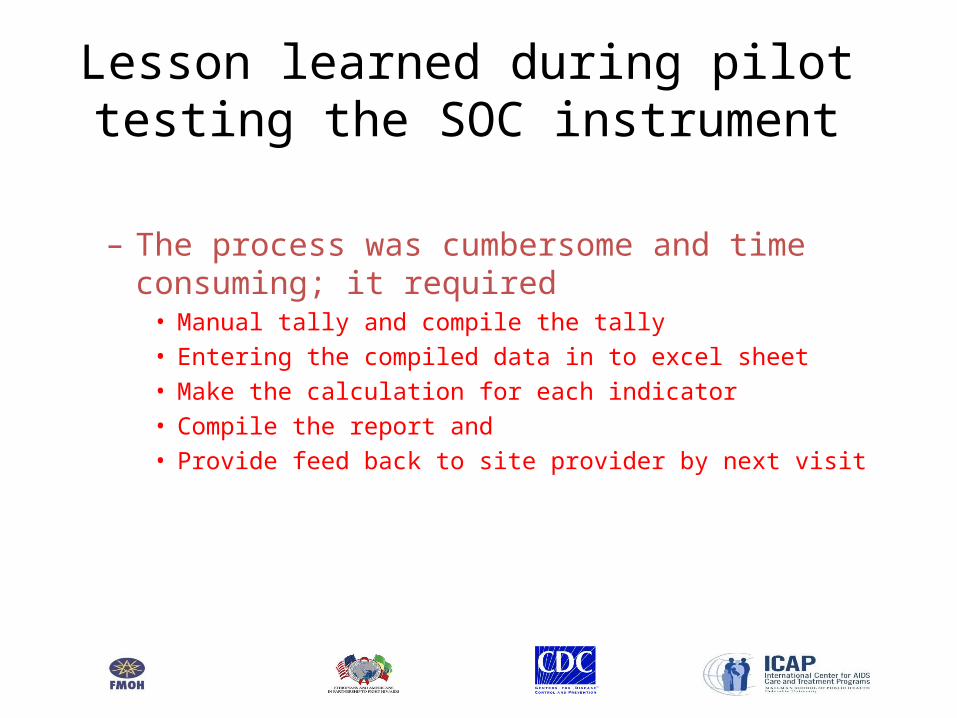
Lesson learned during pilot testing the SOC instrument
– The process was cumbersome and time consuming; it required
• Manual tally and compile the tally• Entering the compiled data in to excel sheet• Make the calculation for each indicator• Compile the report and• Provide feed back to site provider by next visit
Action taken to make the instrument user friendly and provide immediate
feed back– Clinical service and M&E department discussed
to automate SOC data collection instrument
– SOC database developed for the five SOC instrument in use (adult C&T, Ped C&T, HEI, PMTCT and TB HIV)
Major objectives of SOC database
• Reduce work load on the site support team in data compilation
• Facilitate the data capturing and analysis– No manual tallying
• Facilitate instant feedback to the site staff on strength and areas for improvement
• Facilitate easily follow up of action points
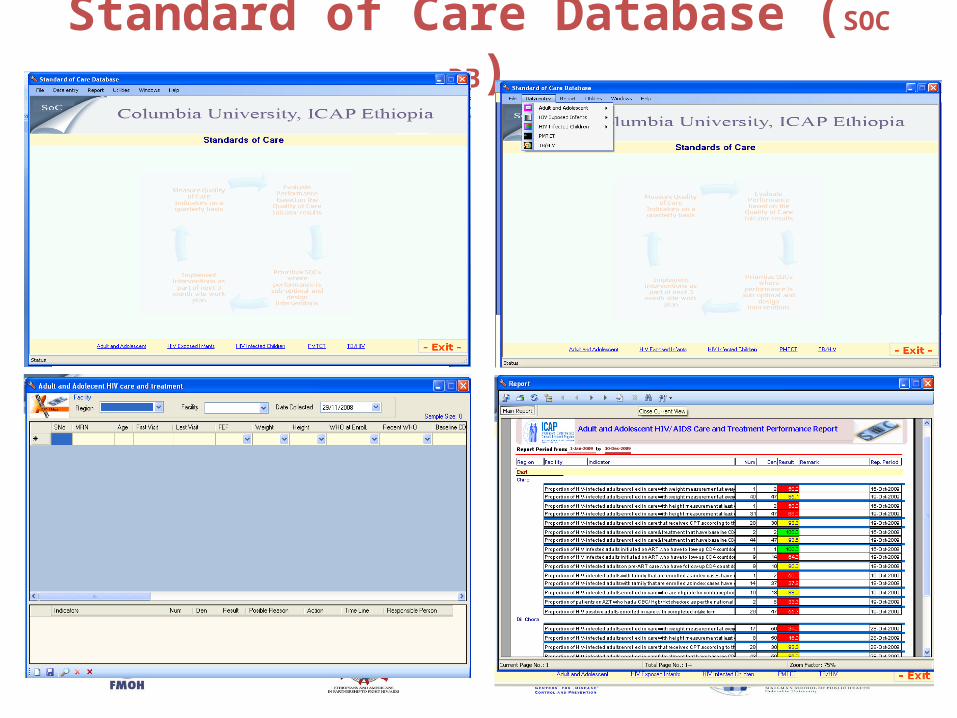
Standard of Care Database (SOC
DB)
Measure Standards of
Care
Routine Report
Data quality
SOC
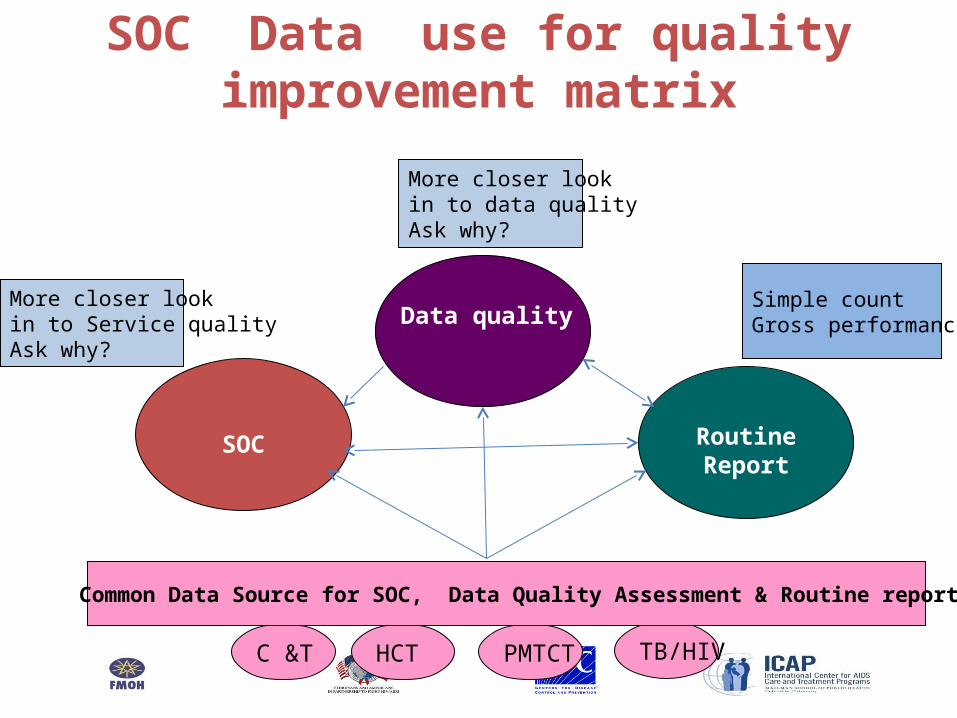
SOC Data use for quality improvement matrix
PMTCTC &T HCT TB/HIV
Simple countGross performance
More closer look in to Service qualityAsk why?
More closer look in to data qualityAsk why?
Common Data Source for SOC, Data Quality Assessment & Routine report
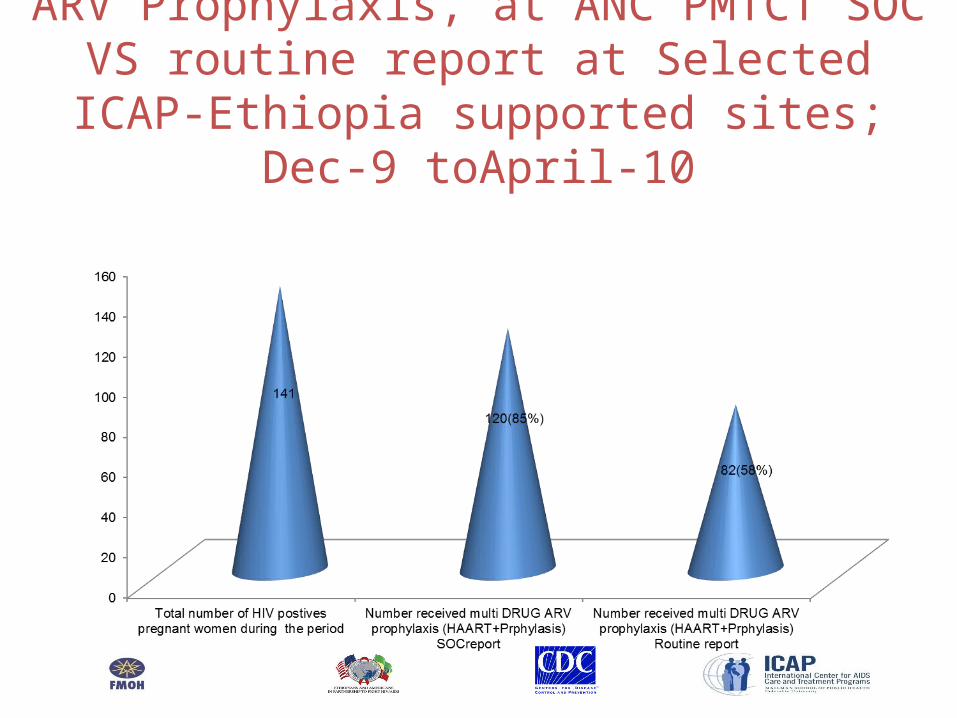
ARV Prophylaxis, at ANC PMTCT SOC VS routine report at Selected ICAP-Ethiopia
supported sites; Dec-9 toApril-10
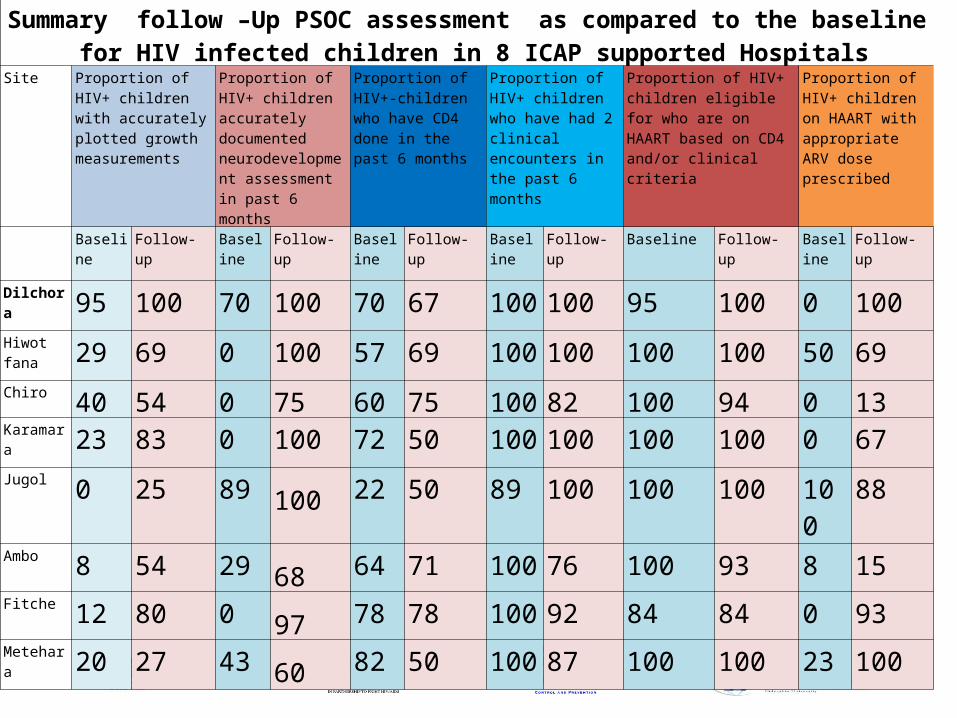
Summary follow –Up PSOC assessment as compared to the baseline for HIV infected children in 8 ICAP supported Hospitals
Site Proportion of HIV+ children with accurately plotted growth measurements
Proportion of HIV+ children accurately documented neurodevelopment assessment in past 6 months
Proportion of HIV+-children who have CD4 done in the past 6 months
Proportion of HIV+ children who have had 2 clinical encounters in the past 6 months
Proportion of HIV+ children eligible for who are on HAART based on CD4 and/or clinical criteria
Proportion of HIV+ children on HAART with appropriate ARV dose prescribed
Baseline Follow-up Baseline
Follow-up Baseline
Follow-up Baseline Follow-up Baseline Follow-up Baseline
Follow-up
Dilchora 95 100 70 100 70 67 100 100 95 100 0 100Hiwot fana 29 69 0 100 57 69 100 100 100 100 50 69Chiro 40 54 0 75 60 75 100 82 100 94 0 13Karamara 23 83 0 100 72 50 100 100 100 100 0 67Jugol 0 25 89 100 22 50 89 100 100 100 100 88
Ambo 8 54 29 68 64 71 100 76 100 93 8 15Fitche 12 80 0 97 78 78 100 92 84 84 0 93Metehara 20 27 43 60 82 50 100 87 100 100 23 100
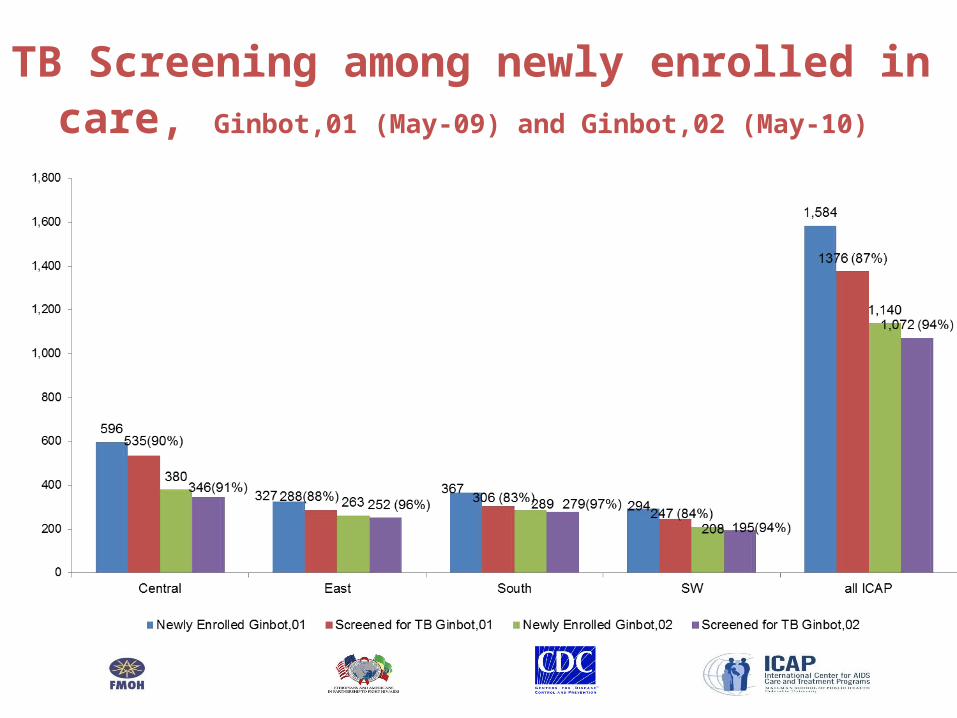
TB Screening among newly enrolled in care, Ginbot,01 (May-09) and Ginbot,02 (May-10)
Added advantage of SOC data as measure of quality of Services
• Provide an in-depth look in to a program by looking in two the practice (not aggregate)
• Facilitate live discussion between the site support team and site level providers on the identified success or problem areas & draw action points
• Guide the site support team to prioritize and focus areas for intense mentoring
Added advantage of SOC data as measure of quality of
Services • Captures key quality indicators not
included in routine report (eg. Follow up CD4 for Pre-ART Pt;
• Compliment CQI effort by breaching the gap created due to timing of routine report compilation (ARV prophylaxis at ANC)
Future Direction• Expand the SOC assessment to capture
soft but important quality indicators in all technical areas we support and automate them
• Fully integrate the priory SOCs as part of routine SOC
• Enhanced use of SOC data for CQI
• Build the capacity of site providers to complete, interpret and act on SOC data

Thank You †መሰግናለሁ
Amesegnalehu