Embed Size (px)
Citation preview

© 2016 The Author(s)Published by S. Karger AG, Basel
Original Research Article
Dement Geriatr Cogn Disord Extra 2016;6:313–329
Using the Disease State Fingerprint Toolfor Differential Diagnosis of Frontotemporal Dementia and Alzheimer’s Disease
Miguel Ángel Muñoz-Ruiz a Anette Hall a Jussi Mattila d Juha Koikkalainen d Sanna-Kaisa Herukka a, b Minna Husso c Tuomo Hänninen b Ritva Vanninen c Yawu Liu a, c Merja Hallikainen a Jyrki Lötjönen d Anne M. Remes a, b Irina Alafuzoff e, f Hilkka Soininen a, b Päivi Hartikainen a, b
a Neurology, Institute of Clinical Medicine, University of Eastern Finland, and Departments of b Neurology and c Radiology, Kuopio University Hospital, Kuopio , and d VTT Technical Research Centre of Finland, Tampere , Finland; e Department of Immunology, Genetics and Pathology, Uppsala University, and f Rudbeck Laboratory, Department of Clinical/Surgical Pathology, Uppsala University Hospital, Uppsala , Sweden
Key Words Alzheimer’s disease · Frontotemporal dementia · Computer-assisted diagnosis · Magnetic resonance imaging · Neuropsychology · Single-photon emission tomography
Abstract Background: Disease State Index (DSI) and its visualization, Disease State Fingerprint (DSF), form a computer-assisted clinical decision making tool that combines patient data and com-pares them with cases with known outcomes. Aims: To investigate the ability of the DSI to diagnose frontotemporal dementia (FTD) and Alzheimer’s disease (AD). Methods: The study cohort consisted of 38 patients with FTD, 57 with AD and 22 controls. Autopsy verification of FTD with TDP-43 positive pathology was available for 14 and AD pathology for 12 cases. We utilized data from neuropsychological tests, volumetric magnetic resonance imaging, single-photon emission tomography, cerebrospinal fluid biomarkers and the APOE genotype. The DSI classification results were calculated with a combination of leave-one-out cross-validation and bootstrapping. A DSF visualization of a FTD patient is presented as an example. Results: The DSI distinguishes controls from FTD (area under the receiver-operator curve, AUC = 0.99) and AD (AUC = 1.00) very well and achieves a good differential diagnosis between AD and FTD (AUC = 0.89). In subsamples of autopsy-confirmed cases (AUC = 0.97) and clinically di-
Published online: July 22, 2016
E X T R A
Päivi Hartikainen, MD, PhD Docent, Department of Neurology University of Eastern Finland, Kuopio University Hospital PO Box 1627, FI–70211 Kuopio (Finland) E-Mail paivi.hartikainen @ kuh.fi
www.karger.com/dee
DOI: 10.1159/000447122
This article is licensed under the Creative Commons Attribution-NonCommercial-NoDerivatives 4.0 Interna-tional License (CC BY-NC-ND) (http://www.karger.com/Services/OpenAccessLicense). Usage and distribu-tion for commercial purposes as well as any distribution of modified material requires written permission.
M.Á.M.-R., A.H., H.S. and P.H. contributed equally to this work.
Dow
nloa
ded
by:
Upp
sala
Uni
vers
itets
bibl
.
13
0.23
8.17
1.17
2 -
11/1
/201
6 11
:28:
15 A
M

314Dement Geriatr Cogn Disord Extra 2016;6:313–329
DOI: 10.1159/000447122
E X T R A
Muñoz-Ruiz et al.: Using the Disease State Fingerprint Tool for Differential Diagnosis of Frontotemporal Dementia and Alzheimer’s Disease
www.karger.com/dee© 2016 The Author(s). Published by S. Karger AG, Basel
agnosed cases (AUC = 0.94), differential diagnosis of AD and FTD performs very well. Conclu-sions: DSI is a promising computer-assisted biomarker approach for aiding in the diagnostic process of dementing diseases. Here, DSI separates controls from dementia and differentiates between AD and FTD. © 2016 The Author(s)
Published by S. Karger AG, Basel
Introduction
The number of elderly people with neurodegenerative disorders is increasing globally and poses a major challenge to health-care systems all around the world. A specific diagnosis of a memory disorder is required before one should initiate some of the more advanced treatment options for a neurodegenerative condition. This need is reflected in the search for new and relevant biomarkers of dementias [1, 2] . In addition, the clinical diagnostic criteria for memory disorders have been revised. The most recent diagnostic criteria for frontotem-poral dementia (FTD) [3] follow the criteria proposed by Neary et al. [4] and in Alzheimer’s disease (AD), the criteria devised by McKhann et al. [5] have recently been updated [1, 6–8] . New biomarkers are now being incorporated into these criteria to be combined with clinical parameters [1, 7, 8] in attempts to increase the accuracy of the diagnosis of memory disorder. It is also believed that new technologies may assist in encapsulating all clinical and biomarker data to help in the assessment of the state of the disease.
Disease State Index (DSI) and Disease State Fingerprint (DSF) [9, 10] form a decision support system, first developed for the PredictAD diagnostic tool, to help clinicians in estab-lishing the prognosis for patients with mild cognitive impairment (MCI) or to assist in the diagnosis between different dementia cases [11–13] . DSI functions as a classifier, measuring the similarity of the patient’s data to that collected from populations with known diagnoses, i.e. it calculates index values for the diagnosis which most closely resemble that of the patient. The DSF is a way of visualizing the DSI results obtained from that individual patient. The DSI has previously been validated in separating controls from AD and predicting MCI progression, and it has also been applied in making a differential diagnosis of FTD [9, 14, 15] .
In our previous study [16] , we analyzed patients with a clinical diagnosis of AD or FTD by utilizing common clinical short tests such as the Mini-Mental State Examination (MMSE), imaging biomarkers from magnetic resonance imaging (MRI) methods, cerebrospinal fluid (CSF) biomarkers and the apolipoprotein E (APOE) genotype. In the present study, we have expanded this set by broadening the indices to include a variety of clinical symptoms from patient files as well as incorporating a wide battery of neuropsychological tests, MRI volu-metry analysis and single-photon emission tomography (SPECT) imaging. Here, our aim was to evaluate the performance of the DSI method in the diagnostic process, when all available diagnostic markers were combined and also by testing how well it dealt with a comprehensive number of autopsy confirmed cases, which are essential for the definitive diagnosis of FTD and AD. This is the first study where autopsy-validated cases of FTD and AD have been examined to assess the validity of the diagnostic reliability of the DSI.
Materials and Methods
Subjects A total of 117 subjects were included in this study. All subjects were examined in the
Kuopio University Hospital. The demographic and clinical data are shown in tables 1 and 2 .
Dow
nloa
ded
by:
Upp
sala
Uni
vers
itets
bibl
.
13
0.23
8.17
1.17
2 -
11/1
/201
6 11
:28:
15 A
M

315Dement Geriatr Cogn Disord Extra 2016;6:313–329
DOI: 10.1159/000447122
E X T R A
Muñoz-Ruiz et al.: Using the Disease State Fingerprint Tool for Differential Diagnosis of Frontotemporal Dementia and Alzheimer’s Disease
www.karger.com/dee© 2016 The Author(s). Published by S. Karger AG, Basel
Table 1. Demographic and clinical data of study groups
Controls AD FTD p value
Subjects 22 57 38Gender 0.598a
Female 14 31 20Male 8 26 18
Age, years 71 ± 4 (65 – 79) 70 ± 8 (50 – 83) 65 ± 9 (45 – 80) 0.02b
Education, years 10 ± 4 (4 – 16) 7 ± 3 (2 – 22) 8 ± 4 (4 – 20) 0.01c
APOE2/3 2 2 3 0.00d
2/4 0 0 03/3 15 12 233/4 3 27 54/4 1 15 0
APOE ε4 carrierNon-carrier 81% 25% 84%Carrier 19% 75% 16%
CSF T-Tau, pg/ml n.a. 555 ± 342 (138 – 1542) 321 ± 203 (90 – 835) 0.00b
CSF P-Tau, pg/ml n.a. 77 ± 35 (29 – 168) 50 ± 30 (14 – 147) 0.01b
CSF Aβ42, pg/ml n.a. 526 ± 176 (125 – 955) 677 ± 230 (246 – 1,101) 0.02b
Right hippocampus 2,154 ± 262 1,557 ± 398 1,862 ± 350 0.00b
Left hippocampus 2,147 ± 243 1,555 ± 404 1,786 ± 395 0.00b
n.a. = Not available. Results are presented as number, mean ± standard deviation (range), or as stated. The AD group includes AD autopsy cases and AD clinical cases; the FTD group includes FTD autopsy cases and FTD clinical cases. a Pearson χ2 test; b one-way ANOVA; c Kruskal-Wallis test; d Fisher’s exact test.
Table 2. Demographic and clinical data of study groups
AD clinical AD autopsy FTD clinical FTD autopsy
Subjects 45 12 24 14Gender
Female 21 10 8 12Male 24 2* 16 2*
Age, years 71 ± 8 (50 – 83) 68 ± 7 (58 – 77) 65 ± 10 (45 – 80) 64 ± 9 (47 – 75)Education, years 7 ± 3 (2 – 22) 7 ± 2 (4 – 10) 8 ± 4 (4 – 20) 8 ± 5 (4 – 18)APOE
2/3 2 0 0 32/4 0 0 0 03/3 11 1 13 103/4 20 7 5 04/4 12 3 0 0*
APOE ε4 carrierNon-carrier 29% 9% 72% 100%Carrier 71% 91% 28% 0%
CSF T-Tau, pg/ml 540 ± 346 (138 – 1,542) 603 ± 341 (187 – 1,159) 367 ± 250 (90 – 835) 253 ± 64 (167 – 369)CSF P-Tau, pg/ml 78 ± 37 (29 – 168) 71 ± 29 (32 – 114) 60 ± 35 (16 – 147) 38 ± 12* (14 – 65)CSF Aβ42, pg/ml 523 ± 181 (125 – 955) 537 ± 168 (230 – 783) 653 ± 237 (321 – 989) 712 ± 225 (246 – 1,101)Right hippocampus 1,507 ± 402 1,661 ± 388 1,956 ± 347 1,687 ± 301Left hippocampus 1,506 ± 420 1,658 ± 367 1,963 ± 323 1,454 ± 296*
Results are presented as number, mean ± standard deviation (range) or as stated. * p < 0.05 comparing autopsy- and non-autopsy-confirmed cases.
Dow
nloa
ded
by:
Upp
sala
Uni
vers
itets
bibl
.
13
0.23
8.17
1.17
2 -
11/1
/201
6 11
:28:
15 A
M

316Dement Geriatr Cogn Disord Extra 2016;6:313–329
DOI: 10.1159/000447122
E X T R A
Muñoz-Ruiz et al.: Using the Disease State Fingerprint Tool for Differential Diagnosis of Frontotemporal Dementia and Alzheimer’s Disease
www.karger.com/dee© 2016 The Author(s). Published by S. Karger AG, Basel
Twenty-two controls were included. These subjects were healthy individuals with no histories of neurological or psychiatric illnesses.
There were 38 cases who either fulfilled the clinical diagnostic criteria for FTD [4] (n = 24) or showed TDP-43 pathology confirmation of the FTD diagnosis at autopsy (n = 14) including 5 cases tested positive for the C9ORF72 repeat expansion. Blood from 12 FTD cases was available for genetic testing, but only 5 above-mentioned cases were positive for the C9ORF72 repeat expansion [17]. Four of C9ORF72 negative samples were with clinical FTD diagnosis. These patients also had technically valid brain images after quality control.
There were 57 patients who either fulfilled the diagnostic criteria for AD (n = 45) according to the Diagnostic and Statistical Manual of Mental Disorders (DSM-IV) [18] or had AD pathology (n = 12) confirmed at autopsy. Blood from only 3 AD patients was available for C9ORF72 repeat expansion testing with negative results, and all those cases were also patho-logically confirmed AD cases.
AD and FTD Subgroups Autopsy From the AD and FTD groups, there were 12 cases with AD pathology and 14 FTD cases
with a TDP-43 pathology confirmation of the diagnosis. Two clinically diagnosed FTD patients without autopsy results, but who had tested positive for the C9ORF72 repeat expansion, fulfilled the definite molecular-based FTD diagnosis and were also included in this group. Three autopsy cases showed TDP 43-positive staining, and 3 cases showed AD pathology, and they were also positive for C9ORF72 repeat expansion. It should be noted that the autopsy-confirmed diagnosis could be different from the original clinical diagnosis at the time when the subjects participated in the study. From the 14 autopsy-confirmed FTD cases, 8 had a clinical FTD diagnosis, 5 had AD diagnosis and 1 had been assessed as suffering from some other disorder. From the 12 autopsy-confirmed AD cases, 8 had a clinical FTD diagnosis, 3 had an AD diagnosis and 1 had been classified as a control.
Clinical In addition, we also tested the remaining clinically diagnosed AD and FTD patients for
whom there was no autopsy confirmation as separate groups as a way of examining the differ-ences between clinical and autopsy-confirmed diagnoses. All the subjects or their next-of-kin provided written informed consent for participation when entering the study according to the Declaration of Helsinki. The study was approved by the Ethics Committee of the Northern Savonia Hospital district.
MRI Acquisition All MRI images were acquired with one of three different 1.5-tesla scanners (two Siemens
Magnetom Visions, one Siemens Magnetom Avanto, all Siemens Medical Systems, Erlangen, Germany) in the Department of Clinical Radiology, Kuopio University Hospital. In all cases, MRI images were obtained using a T1-weighted 3D MPRAGE sequence. Detailed information of the imaging sequences has been described previously [19] .
Analysis of regional MRI volumes was performed using manual outlining of the regions of interest as described previously [20] . The regions of interest were frontal lobe, temporal lobe and hippocampus.
SPECT Acquisition Regional cerebral blood flow ratios referred to the cerebellum were obtained by 99m Tc-
HMPAO as described previously [21, 22] . The regions of interest were frontal cortex, temporal region, parietal cortex, occipital and basal ganglia, and amygdala-hippocampus.
Dow
nloa
ded
by:
Upp
sala
Uni
vers
itets
bibl
.
13
0.23
8.17
1.17
2 -
11/1
/201
6 11
:28:
15 A
M
317Dement Geriatr Cogn Disord Extra 2016;6:313–329
DOI: 10.1159/000447122
E X T R A
Muñoz-Ruiz et al.: Using the Disease State Fingerprint Tool for Differential Diagnosis of Frontotemporal Dementia and Alzheimer’s Disease
www.karger.com/dee© 2016 The Author(s). Published by S. Karger AG, Basel
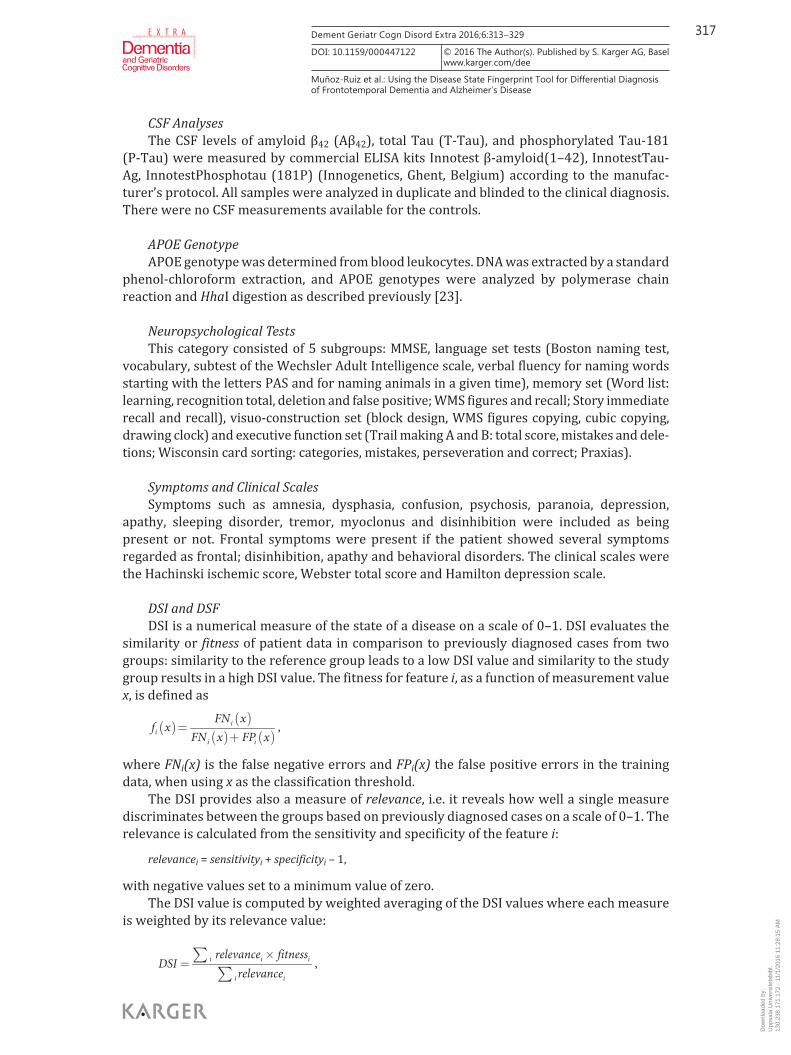
CSF Analyses The CSF levels of amyloid β 42 (Aβ 42 ), total Tau (T-Tau), and phosphorylated Tau-181
(P-Tau) were measured by commercial ELISA kits Innotest β-amyloid(1–42), InnotestTau-Ag, InnotestPhosphotau (181P) (Innogenetics, Ghent, Belgium) according to the manufac-turer’s protocol. All samples were analyzed in duplicate and blinded to the clinical diagnosis. There were no CSF measurements available for the controls.
APOE Genotype APOE genotype was determined from blood leukocytes. DNA was extracted by a standard
phenol-chloroform extraction, and APOE genotypes were analyzed by polymerase chain reaction and Hha I digestion as described previously [23] .
Neuropsychological Tests This category consisted of 5 subgroups: MMSE, language set tests (Boston naming test,
vocabulary, subtest of the Wechsler Adult Intelligence scale, verbal fluency for naming words starting with the letters PAS and for naming animals in a given time), memory set (Word list: learning, recognition total, deletion and false positive; WMS figures and recall; Story immediate recall and recall), visuo-construction set (block design, WMS figures copying, cubic copying, drawing clock) and executive function set (Trail making A and B: total score, mistakes and dele-tions; Wisconsin card sorting: categories, mistakes, perseveration and correct; Praxias).
Symptoms and Clinical Scales Symptoms such as amnesia, dysphasia, confusion, psychosis, paranoia, depression,
apathy, sleeping disorder, tremor, myoclonus and disinhibition were included as being present or not. Frontal symptoms were present if the patient showed several symptoms regarded as frontal; disinhibition, apathy and behavioral disorders. The clinical scales were the Hachinski ischemic score, Webster total score and Hamilton depression scale.
DSI and DSF DSI is a numerical measure of the state of a disease on a scale of 0–1. DSI evaluates the
similarity or fitness of patient data in comparison to previously diagnosed cases from two groups: similarity to the reference group leads to a low DSI value and similarity to the study group results in a high DSI value. The fitness for feature i , as a function of measurement value x , is defined as
,ii
i i
FN xf x
FN x FP x
where FN i (x) is the false negative errors and FP i (x) the false positive errors in the training data, when using x as the classification threshold.
The DSI provides also a measure of relevance , i.e. it reveals how well a single measure discriminates between the groups based on previously diagnosed cases on a scale of 0–1. The relevance is calculated from the sensitivity and specificity of the feature i :
relevance i = sensitivity i + specificity i – 1,
with negative values set to a minimum value of zero. The DSI value is computed by weighted averaging of the DSI values where each measure
is weighted by its relevance value:
,i i i
i i
relevance fitnessDSI
relevance
Dow
nloa
ded
by:
Upp
sala
Uni
vers
itets
bibl
.
13
0.23
8.17
1.17
2 -
11/1
/201
6 11
:28:
15 A
M

318Dement Geriatr Cogn Disord Extra 2016;6:313–329
DOI: 10.1159/000447122
E X T R A
Muñoz-Ruiz et al.: Using the Disease State Fingerprint Tool for Differential Diagnosis of Frontotemporal Dementia and Alzheimer’s Disease
www.karger.com/dee© 2016 The Author(s). Published by S. Karger AG, Basel
where i runs over the set of features available. The features are combined into composite DSI values for feature groups, and then the process is repeated recursively until an overall DSI is obtained [9] .
DSF is a graphical counterpart of DSI and works as a visualization technique that combines all the data available from the patient and compares them with the data collected from both disease-positive and control groups. A detailed description and derivation of the functions utilized in DSI and DSF have been published in our previous article [9] .
Analysis Before the DSI analysis, we excluded measurements that did not display a statistically
significant difference between the diagnostic groups. We used the Matlab rank sum function, which calculates the Wilcoxon rank sum test (equivalent to Mann-Whitney U test) to test if the medians for the distributions are equal. The measurements with p > 0.05 were omitted from the final analysis. This was necessary because the small sample sizes in the AD and FTD subgroups would add too much random fluctuations with no true predictive value, which the DSI itself is not able to recognize, as it was originally designed for larger sets of training data. As the DSI specifically examines the distributions of data, the rank sum test is the most suitable test in this regard.
The DSI classification results were calculated with a combination of leave-one-out cross-validation and bootstrapping. Each case was compared with a bootstrapped random set of all the other diagnosed cases. From each training set with N cases, N random samples were chosen with replacement, so that any particular case may appear several times in the training set. The means and standard deviations were then calculated by repeating the process 100 times for each tested case.
The classification performance for the DSI was measured with AUC (area under the receiver-operator curve), correct classification accuracy, sensitivity and specificity. DSI prob-ability distribution curves were obtained for each group comparison. A DSF visualization of a selected FTD case is presented, where the AD and FTD groups were used as training data in the model.
Results
Clinical Data The demographic and clinical data for controls, as well as FTD and AD patients, are shown
in table 1 . The FTD group was younger than the AD and control groups. In terms of years of education, there were significant differences between the groups, and the AD group displayed the lowest average number of years of education. The groups also differed in terms of APOE ε4 genotype; 75% of AD patients were carriers of one or two e4 alleles, while only 16% of FTD patients were APOE ε4 carriers. AD patients had higher levels for T-Tau and P-Tau and lower Aβ 42 levels compared to FTD patients. Table 2 compares the autopsy-confirmed AD and FTD cases with those with only a clinical diagnosis. There was a significant difference in the gender distribution for both AD and FTD, as the autopsied cases were mostly female. The APOE genotype distribution also differed significantly for FTD, with none of the autopsied cases having the APOE ε4 allele. There were also significant differences between the FTD autopsy and clinical groups in the values of CSF P-Tau and the left hippocampus.
DSI Analysis Table 3 shows mean values and standard deviations for AUC, correct classification
accuracy, sensitivity and specificity for the classification based on the DSI. The AUC values for
Dow
nloa
ded
by:
Upp
sala
Uni
vers
itets
bibl
.
13
0.23
8.17
1.17
2 -
11/1
/201
6 11
:28:
15 A
M

319Dement Geriatr Cogn Disord Extra 2016;6:313–329
DOI: 10.1159/000447122
E X T R A
Muñoz-Ruiz et al.: Using the Disease State Fingerprint Tool for Differential Diagnosis of Frontotemporal Dementia and Alzheimer’s Disease
www.karger.com/dee© 2016 The Author(s). Published by S. Karger AG, Basel
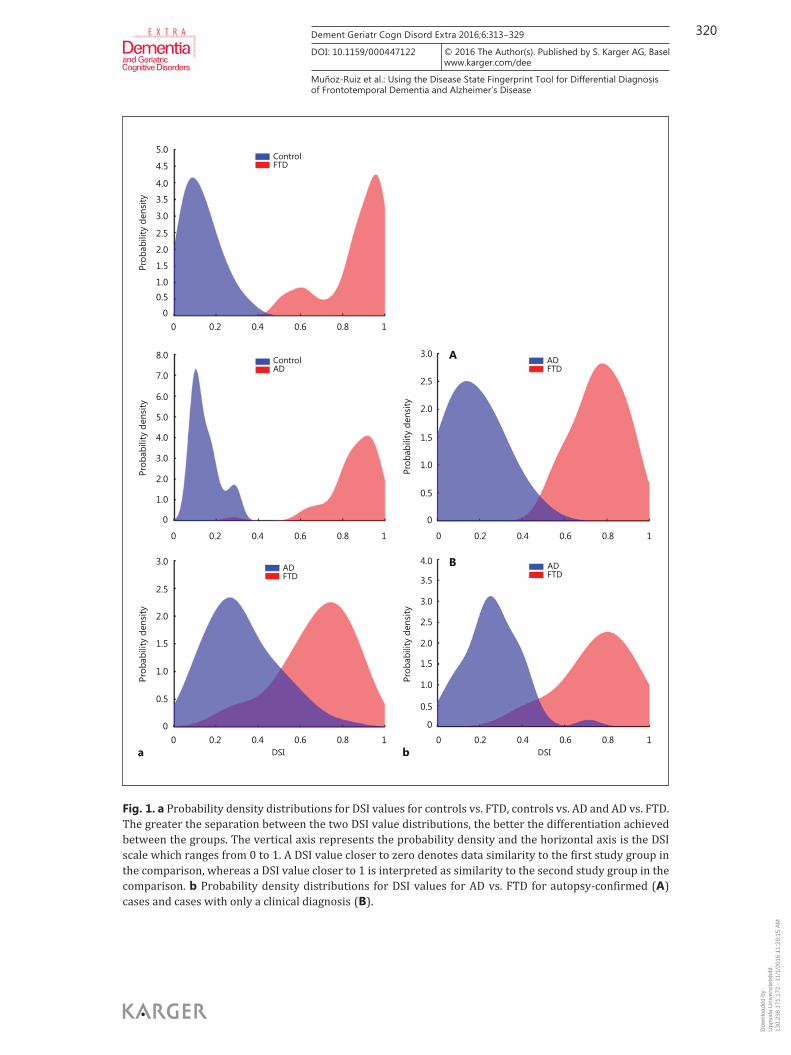
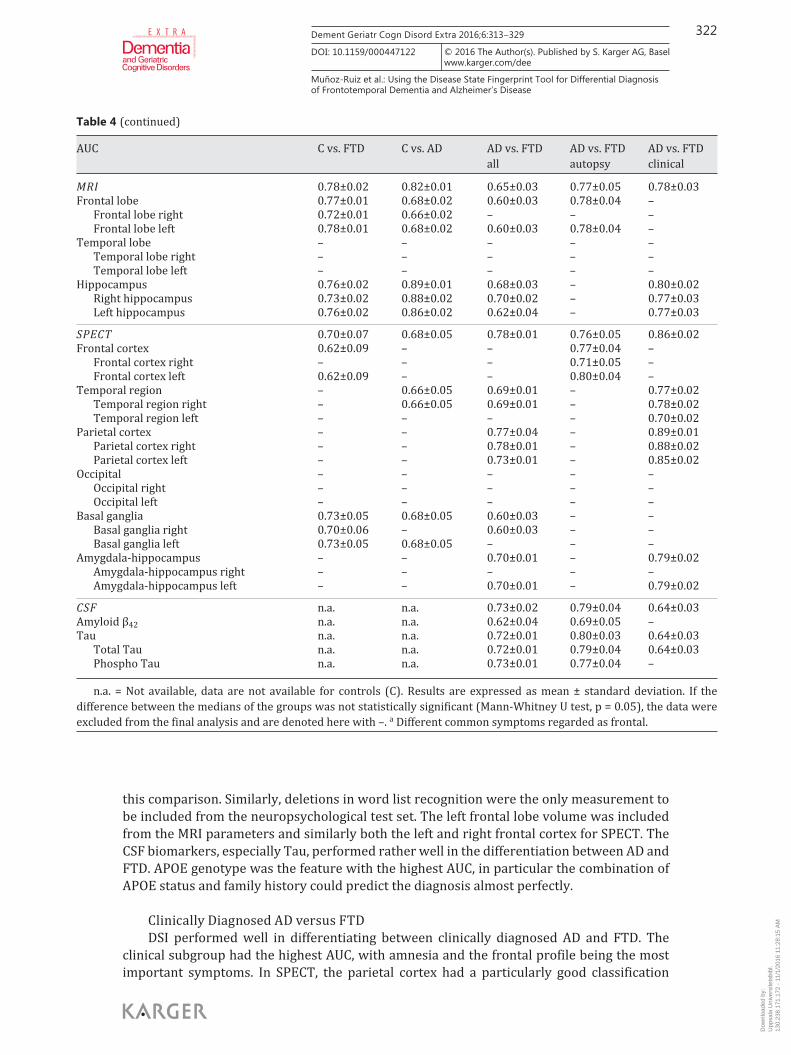
each included measurement are depicted in table 4 . Probability density distributions of the DSI values are presented in figure 1 a for the comparisons between controls, AD and FTD, and in figure 1 b for the AD and FTD subgroups.
Controls versus FTD DSI achieved a high classification performance in differentiating controls from FTD.
Figure 1 a shows no overlap between the distributions of controls and FTD cases. The most important measurements were the collection of symptoms from clinical data with apathy and a frontal profile of the symptoms exhibiting the highest AUC values. The whole neuropsycho-logical test group had also very high AUCs when differentiating between control and FTD groups. In MRI, frontal lobe and hippocampus displayed a good classification value, and in SPECT, the basal ganglia and frontal cortex were included in the analysis. APOE genetic tests were not included in the final analysis due to their low significance, and CSF was not available for controls.
Controls versus AD The DSI was very efficient in differentiating controls from AD. In figure 1 a, there is a clear
separation between the distributions. The features with the highest AUCs were clinical data collection, especially amnesia and apathy, as well as the neuropsychological test set. The hippocampal areas from MRI also performed rather well. SPECT did not achieve a high AUC value in separating controls from AD.
AD versus FTD DSI achieved a reasonably good accuracy in differentiating between AD and FTD. In figure
1 a, there is some overlap between the DSI distributions of AD and FTD. Clinical data, followed by APOE and SPECT, performed best at differentiating between the two diseases. Amnesia was the symptom with the highest AUC, and the memory subgroup had the highest AUC of the neuropsychological group. In the SPECT results, the most important area was the parietal cortex followed by the temporal region, and in MRI, the hippocampal area discriminated best between the groups. With respect to the CSF-related parameters, Tau was a better classifier than amyloid.
Autopsy-Confirmed AD versus FTD DSI achieved a good performance in separating between autopsy-confirmed AD and FTD.
Disinhibition was the only clinical symptom with a high enough significance to be included in
Table 3. The classification results for the DSI calculated by using bootstrapping for each case separately, excluding the case being tested from the randomized training sets
C vs. FTD C vs. AD AD vs. FTD all AD vs. FTD autopsy
AD vs. FTD clinical
AUC 0.99 ± 0.01 1.00 ± 0.00 0.89 ± 0.01 0.97 ± 0.02 0.94 ± 0.02Accuracy 0.95 ± 0.02 0.98 ± 0.01 0.83 ± 0.02 0.91 ± 0.04 0.89 ± 0.03Sensitivity 0.92 ± 0.03 0.98 ± 0.01 0.81 ± 0.03 0.92 ± 0.05 0.81 ± 0.05Specificity 0.99 ± 0.02 1.00 ± 0.01 0.83 ± 0.03 0.90 ± 0.06 0.93 ± 0.03
The means and standard deviations are calculated from each round of bootstrapping (n = 100) for all tested cases. DSI classification results calculated with bootstrapping. Values are expressed as mean ± standard deviation.
Dow
nloa
ded
by:
Upp
sala
Uni
vers
itets
bibl
.
13
0.23
8.17
1.17
2 -
11/1
/201
6 11
:28:
15 A
M
320Dement Geriatr Cogn Disord Extra 2016;6:313–329
DOI: 10.1159/000447122
E X T R A
Muñoz-Ruiz et al.: Using the Disease State Fingerprint Tool for Differential Diagnosis of Frontotemporal Dementia and Alzheimer’s Disease
www.karger.com/dee© 2016 The Author(s). Published by S. Karger AG, Basel
5.0
4.5
4.0
3.5
3.0
2.5
2.0
1.5
1.00.5
00 0.2 0.4 0.6 0.8 1
0 0.2 0.4 0.6 0.8 1 0 0.2 0.4 0.6 0.8 1
0 0.2 0.4 0.6 0.8 10 0.2 0.4 0.6 0.8 1
Prob
abili
ty d
ensi
ty
8.0
7.0
6.0
5.0
1.0
2.0
3.0
4.0
0
Prob
abili
ty d
ensi
ty
3.0
2.5
2.0
1.5
1.0
0.5
0
Prob
abili
ty d
ensi
ty
3.0
2.5
2.0
1.5
1.0
0.5
0
Prob
abili
ty d
ensi
ty
4.0
3.5
3.0
2.5
2.0
1.5
1.0
0.5
0
Prob
abili
ty d
ensi
ty
ControlFTD
ControlAD
ADFTD
ADFTD
ADFTD
DSI DSIa b
A
B
Fig. 1. a Probability density distributions for DSI values for controls vs. FTD, controls vs. AD and AD vs. FTD. The greater the separation between the two DSI value distributions, the better the differentiation achieved between the groups. The vertical axis represents the probability density and the horizontal axis is the DSI scale which ranges from 0 to 1. A DSI value closer to zero denotes data similarity to the first study group in the comparison, whereas a DSI value closer to 1 is interpreted as similarity to the second study group in the comparison. b Probability density distributions for DSI values for AD vs. FTD for autopsy-confirmed ( A ) cases and cases with only a clinical diagnosis ( B ).
Dow
nloa
ded
by:
Upp
sala
Uni
vers
itets
bibl
.
13
0.23
8.17
1.17
2 -
11/1
/201
6 11
:28:
15 A
M

321Dement Geriatr Cogn Disord Extra 2016;6:313–329
DOI: 10.1159/000447122
E X T R A
Muñoz-Ruiz et al.: Using the Disease State Fingerprint Tool for Differential Diagnosis of Frontotemporal Dementia and Alzheimer’s Disease
www.karger.com/dee© 2016 The Author(s). Published by S. Karger AG, Basel
AUC C vs. FTD C vs. AD AD vs. FTDall
AD vs. FTDautopsy
AD vs. FTDclinical
Total 0.99±0.01 1.00±0.00 0.89±0.01 0.97±0.02 0.94±0.02
Clinical 0.98±0.01 0.99±0.00 0.82±0.01 0.70±0.09 0.90±0.02Symptom 0.96±0.02 0.99±0.00 0.85±0.01 0.70±0.09 0.89±0.02
Amnesia – 0.90±0.02 0.81±0.02 – 0.83±0.03Dysphasia 0.66±0.06 – 0.63±0.04 – 0.62±0.05Confusion 0.58±0.06 – – – –Psychosis – – – – –Paranoia – – – – –Depression 0.69±0.05 0.68±0.05 – – –Apathy 0.80±0.04 0.81±0.03 – – –Sleeping disorder – – – – –Frontal profilea 0.78±0.04 0.58±0.07 0.67±0.03 – 0.74±0.04Tremor 0.63±0.07 0.59±0.07 – – –Myoclonus – – – – 0.53±0.07Disinhibition 0.69±0.05 – – 0.70±0.09 –
Hachinski ischemic score n.a. n.a. – – –Webster total score n.a. n.a. 0.64±0.02 – 0.74±0.02Hamilton depression scale n.a. n.a. – – 0.72±0.04
Neuropsychological 0.95±0.01 0.96±0.01 0.73±0.02 0.80±0.04 0.82±0.03MMSE 0.86±0.02 0.95±0.01 – – –Language 0.88±0.02 0.95±0.02 0.63±0.02 – –
Boston naming test 0.80±0.02 0.80±0.02 – – –Vocabulary 0.86±0.03 0.94±0.02 – – –Verbal fluency PAS n.a. n.a. 0.63±0.02 – –Verbal fluency animals n.a. n.a. – – –
Memory 0.95±0.01 0.98±0.00 0.68±0.02 0.80±0.04 0.77±0.02Word list learning 0.93±0.03 0.95±0.03 – – –WMS figures 0.90±0.02 0.91±0.02 – – –Story immediate recall n.a. n.a. – – –Word list recognition 0.92±0.02 0.88±0.03 – – 0.67±0.02Word list recognition deletion n.a. n.a. 0.61±0.03 0.80±0.04 –Word list recognition false positive n.a. n.a. 0.65±0.02 – 0.71±0.02WMS figures recall 0.92±0.02 0.97±0.01 0.62±0.03 – –Story recall n.a. n.a. 0.60±0.02 – –
Visuo-construction 0.96±0.01 0.93±0.01 – – –Block design 0.91±0.02 0.90±0.02 – – –WMS figures copying 0.91±0.02 0.87±0.02 – – –Cubic copying 0.80±0.03 0.79±0.03 – – –Drawing clock 0.91±0.02 0.85±0.02 – – –
Executive function 0.92±0.01 0.97±0.01 0.64±0.01 – 0.70±0.03Trail making A 0.90±0.02 0.91±0.02 – – –Trail making A mistakes 0.67±0.07 0.61±0.07 – – –Trail making A deletions 0.65±0.07 0.68±0.06 – – –Trail making B 0.89±0.02 0.92±0.02 – – –Trail making B mistakes 0.85±0.03 0.80±0.03 – – –Trail making B deletions 0.84±0.03 0.88±0.02 – – –Wisconsin card sorting categories 0.80±0.03 0.88±0.03 – – –Wisconsin card sorting mistakes 0.68±0.03 0.75±0.03 – – 0.63±0.06Wisconsin card sorting perseveration 0.82±0.03 0.78±0.03 – – –Wisconsin card sorting right 0.82±0.02 0.88±0.02 – – –Praxias n.a. n.a. 0.64±0.01 – 0.69±0.02
Genetic – 0.76±0.02 0.79±0.01 0.99±0.00 0.72±0.03APOE 4 alleles – 0.76±0.02 0.79±0.03 0.93±0.01 0.72±0.03Dementia in family n.a. n.a. 0.64±0.03 0.86±0.01 –APOE genotype – 0.76±0.02 0.79±0.02 0.93±0.01 0.72±0.03
Table 4. The AUC values (mean ± standard deviation) for each measure and their combinations
Dow
nloa
ded
by:
Upp
sala
Uni
vers
itets
bibl
.
13
0.23
8.17
1.17
2 -
11/1
/201
6 11
:28:
15 A
M
322Dement Geriatr Cogn Disord Extra 2016;6:313–329
DOI: 10.1159/000447122
E X T R A
Muñoz-Ruiz et al.: Using the Disease State Fingerprint Tool for Differential Diagnosis of Frontotemporal Dementia and Alzheimer’s Disease
www.karger.com/dee© 2016 The Author(s). Published by S. Karger AG, Basel
this comparison. Similarly, deletions in word list recognition were the only measurement to be included from the neuropsychological test set. The left frontal lobe volume was included from the MRI parameters and similarly both the left and right frontal cortex for SPECT. The CSF biomarkers, especially Tau, performed rather well in the differentiation between AD and FTD. APOE genotype was the feature with the highest AUC, in particular the combination of APOE status and family history could predict the diagnosis almost perfectly.
Clinically Diagnosed AD versus FTD DSI performed well in differentiating between clinically diagnosed AD and FTD. The
clinical subgroup had the highest AUC, with amnesia and the frontal profile being the most important symptoms. In SPECT, the parietal cortex had a particularly good classification
Table 4 (continued)
AUC C vs. FTD C vs. AD AD vs. FTDall
AD vs. FTDautopsy
AD vs. FTDclinical
MRI 0.78±0.02 0.82±0.01 0.65±0.03 0.77±0.05 0.78±0.03Frontal lobe 0.77±0.01 0.68±0.02 0.60±0.03 0.78±0.04 –
Frontal lobe right 0.72±0.01 0.66±0.02 – – –Frontal lobe left 0.78±0.01 0.68±0.02 0.60±0.03 0.78±0.04 –
Temporal lobe – – – – –Temporal lobe right – – – – –Temporal lobe left – – – – –
Hippocampus 0.76±0.02 0.89±0.01 0.68±0.03 – 0.80±0.02Right hippocampus 0.73±0.02 0.88±0.02 0.70±0.02 – 0.77±0.03Left hippocampus 0.76±0.02 0.86±0.02 0.62±0.04 – 0.77±0.03
SPECT 0.70±0.07 0.68±0.05 0.78±0.01 0.76±0.05 0.86±0.02Frontal cortex 0.62±0.09 – – 0.77±0.04 –
Frontal cortex right – – – 0.71±0.05 –Frontal cortex left 0.62±0.09 – – 0.80±0.04 –
Temporal region – 0.66±0.05 0.69±0.01 – 0.77±0.02Temporal region right – 0.66±0.05 0.69±0.01 – 0.78±0.02Temporal region left – – – – 0.70±0.02
Parietal cortex – – 0.77±0.04 – 0.89±0.01Parietal cortex right – – 0.78±0.01 – 0.88±0.02Parietal cortex left – – 0.73±0.01 – 0.85±0.02
Occipital – – – – –Occipital right – – – – –Occipital left – – – – –
Basal ganglia 0.73±0.05 0.68±0.05 0.60±0.03 – –Basal ganglia right 0.70±0.06 – 0.60±0.03 – –Basal ganglia left 0.73±0.05 0.68±0.05 – – –
Amygdala-hippocampus – – 0.70±0.01 – 0.79±0.02Amygdala-hippocampus right – – – – –Amygdala-hippocampus left – – 0.70±0.01 – 0.79±0.02
CSF n.a. n.a. 0. 73±0.02 0.79±0.04 0.64±0.03Amyloid β42 n.a. n.a. 0.62±0.04 0.69±0.05 –Tau n.a. n.a. 0.72±0.01 0.80±0.03 0.64±0.03
Total Tau n.a. n.a. 0.72±0.01 0.79±0.04 0.64±0.03Phospho Tau n.a. n.a. 0.73±0.01 0.77±0.04 –
n.a. = Not available, data are not available for controls (C). Results are expressed as mean ± standard deviation. If the difference between the medians of the groups was not statistically significant (Mann-Whitney U test, p = 0.05), the data were excluded from the final analysis and are denoted here with –. a Different common symptoms regarded as frontal.
Dow
nloa
ded
by:
Upp
sala
Uni
vers
itets
bibl
.
13
0.23
8.17
1.17
2 -
11/1
/201
6 11
:28:
15 A
M

323Dement Geriatr Cogn Disord Extra 2016;6:313–329
DOI: 10.1159/000447122
E X T R A
Muñoz-Ruiz et al.: Using the Disease State Fingerprint Tool for Differential Diagnosis of Frontotemporal Dementia and Alzheimer’s Disease
www.karger.com/dee© 2016 The Author(s). Published by S. Karger AG, Basel
ability. The hippocampal measurements were the only region extracted from the MRI data able to differentiate between the groups. Only a few tests from the memory and executive function subgroups were significant enough to be included from the neuropsychologicaltest set.
DSF Case Example In order to demonstrate the utilization of the DSF for decision support in the differential
diagnosis of AD and FTD, we selected a patient with an FTD diagnosis and compared her data with those from all other AD and FTD cases.
Figure 2 represents the DSF visualization for a 65-year-old female diagnosed with FTD who was positive for the C9ORF72 repeat expansion. The onset of the dementing illness occurred at the age of 63 years. The patient had 18 years of education. MMSE was 29. The patient suffered from frontal symptoms but not from amnesia or dysphasia, and her motor
Fig. 2. DSF for a single FTD case compared to AD vs. FTD. Box size indicates the relevance of the measure in separating between the two different diagnoses, and the color (DSI) shows which diag-nosis the patient’s data resemble the most. Red indicates similarity to FTD cases, blue to AD, and white shows that the value is equally typical for both diagnoses. The DSI values are also shown nu-merically. All the measurements are ordered in a hierarchical tree-like presentation according to rel-evance, from the highest rele-vance at the top to the lowest rel-evance at the bottom. If the relevance (weight of each param-eter differentiating AD from FTD) is low, then even high DSI values (similarity of the parameter to AD or FTD groups) do not exert a ma-jor impact on decision making.
Dow
nloa
ded
by:
Upp
sala
Uni
vers
itets
bibl
.
13
0.23
8.17
1.17
2 -
11/1
/201
6 11
:28:
15 A
M

324Dement Geriatr Cogn Disord Extra 2016;6:313–329
DOI: 10.1159/000447122
E X T R A
Muñoz-Ruiz et al.: Using the Disease State Fingerprint Tool for Differential Diagnosis of Frontotemporal Dementia and Alzheimer’s Disease
www.karger.com/dee© 2016 The Author(s). Published by S. Karger AG, Basel
Webster score was 9. The SPECT displayed large anterior perfusion defects bifrontally and bitemporally with extension to the right parietal cortex. The patient had an average Aβ 42 concentration value, while T-Tau and P-Tau levels were exceptionally low. The patient showed higher than average scores in the executive function, memory and language tests. The APOE genotype was 3/3, and there was a history of dementia in the family. The MRI scan revealed atrophy in both the hippocampus and frontal lobes. The total DSI for this case was 0.76 in the comparison between AD and FTD, indicating that the initial FTD diagnosis was strongly supported by the patient’s similarity to other FTD cases.
Discussion
The DSI method and its DSF visualization are machine learning tools developed to improve clinical decision making in hospitals. The DSI can combine a variety of different and diverse diagnostic markers and present them in a visible form that is easy to understand by the clinician struggling to make a diagnosis.
This study included data from both clinically diagnosed and autopsy-confirmed AD and FTD cases. Autopsy data, whenever available, are invaluable in the validation of the perfor-mance of biomarkers attempting to differentiate between AD and FTD, as clinical diagnoses do not invariably correspond to the neuropathological diagnoses [24, 25] . According to those pathological reviews, the clinical diagnostic accuracy has been reported to be from 65 to 96% for AD using revised research criteria and newly developed biomarkers as MRI, PET, CSF and genetic markers, and the specificity was 23–88% in the comparisons with other dementias. Thus, neuropathological standardized assessments of dementing disorders can highly improve diagnostic classifications and add information about common co-pathologies of dementias [26] .
DSI Analysis Disease Groups versus Controls The DSI analysis showed a high AUC in the comparison between controls and both
dementia groups, with amnesia and frontal behavior symptoms being most important clinical features. Amnesia is a hallmark of AD, whereas frontal behavior symptoms such as compul-sions, stereotypies, impaired control of emotions and social difficulties are typical FTD features. Nonetheless, while amnesia usually presents as an initial symptom for AD, it also can occur later in FTD [27] . Apathy and disinhibition are believed to be more frequent in FTD than in AD [28, 29] . The presence of depression was relevant in the differentiation of controls from both patient groups, as it is a common finding in both AD and FTD [28] . Structural imaging in MCI, AD and FTD has been conducted for years in an attempt to identify disease specific regional markers such as cortical thickness or volumetry of brain areas with several MRI tech-niques [30–33] . In our previous studies using automatic MRI analysis of hippocampal volumes, we could differentiate accurately both diseases from controls based on the degree of hippo-campal atrophy [19] . Here, we used the volumetric measurements of major brain regions, and found that frontal and hippocampal regions were the best areas in differentiating disease groups from controls as these regions typically degenerate in both AD and FTD [34, 35] .
DSI Classification of FTD and AD Usually, the core clinical features and imaging parameters quantifying the disease process
by MRI, SPECT or PET do not provide a clear differentiation between AD and FTD in clinical use [1, 6] . Here, for the clinically diagnosed AD and FTD patients, the DSI classified amnesia and frontal profile as the most important symptoms, but only disinhibition was found to be a
Dow
nloa
ded
by:
Upp
sala
Uni
vers
itets
bibl
.
13
0.23
8.17
1.17
2 -
11/1
/201
6 11
:28:
15 A
M

325Dement Geriatr Cogn Disord Extra 2016;6:313–329
DOI: 10.1159/000447122
E X T R A
Muñoz-Ruiz et al.: Using the Disease State Fingerprint Tool for Differential Diagnosis of Frontotemporal Dementia and Alzheimer’s Disease
www.karger.com/dee© 2016 The Author(s). Published by S. Karger AG, Basel
significant symptom in separating autopsy-confirmed AD from FTD. Although the symptoms’ record is the most relevant category, it is important to state that the simplicity of the recording of the symptomatology, i.e. amnesia and frontal symptoms, may mask the differences in the memory profile [36] and behavioral conduct [29] . Neuropsychological tests were only partially useful in DSI analysis, and the MMSE was a poor classifier of AD and FTD. Previous studies also confirm that MMSE should be regarded solely as a screening test for a memory disorder [37] .
The hippocampal MRI volumetry was only of minor importance in the AD and FTD comparisons as both diseases affect hippocampal structures. SPECT with hypoperfusion was useful in differentiating between FTD and AD; however, there was some disagreement between the autopsy cases and the overall results. The frontal cortex MRI measure was highly predictive of autopsy AD and FTD, but it was excluded in the analysis of all AD and FTD cases which included mostly clinical patients, due to its low significance. Similarly, the parietal cortex and temporal region are relevant to all AD and FTD, but not autopsy cases. Previous studies have demonstrated that hypoperfusion occurs in AD patients in the parietal cortex [38] and also in the frontal and temporal regions [39] , although AD guidelines [7] do not recommend the use of SPECT as a front-line test but instead state that it may be a supple-mentary examination. On the other hand, in the FTD guidelines [3, 4] , SPECT is included as a supportive feature, since anterior or temporal hypoperfusion can be present.
The APOE genotype was useful as an additional biomarker available from clinical practice diagnostics, and it was relevant in the DSI analysis. The profile of APOE genetics in the study groups was in line with previous reports as the percentage of APOE ε4 carriers was 19% among controls, 16% in FTD and 75% in AD [40, 41] . When differentiating between the autopsy groups, 0% of FTD and 91% of AD cases were APOE ε4 carriers, making the comparison highly predictive for a correct diagnosis. In future studies, it would be advisable to include other gene biomarkers such as C9ORF72 in the DSI analysis, as it has been shown to be present in up to 22% of sporadic FTD cases and 30–50% familial FTD cases in Finland [42] . In this cohort, we had only a few samples available for C9ORF72 gene testing. Profiles associated with C9ORF72 have been found in imaging studies of FTD [42] , and APOE ε4 has been asso-ciated with pronounced hippocampal atrophy in AD [43] and frontal cortex (orbitofrontal) atrophy found in the behavioral variant of FTD [43, 44] .
The relevance of the CSF biomarkers was good in the differentiation between AD and FTD, supporting the use of CSF as a frontline feature. P-Tau and T-Tau achieved a higher rele-vance than Aβ 42 , while T-Tau and P-Tau were of equal importance. This is as expected since AD has predominantly a recognizable profile [45] , while there is no specific profile for FTD [46] . It has been reported that P-Tau is more effective than T-Tau [45] , but in the present study, both performed rather similarly.
The DSF Case Example The DSF visualizations of the comparisons for a single FTD patient shown in figure 2 illus-
trate the advantages of this technique in clinical decision making. We wanted to ascertain which disease profile this case would resemble according to the information from the other AD and FTD cases. The order of categories, i.e. clinical, SPECT, CSF, neuropsychological, genetic and MRI, is determined by their relevance, from highest to lowest. Overall, the Finger-print was clearly indicative of an FTD diagnosis. Clinical features and symptoms pointed towards FTD; SPECT was typical for an FTD patient, and only the temporal region, which is not of high relevance, was inconclusive in the Fingerprint. The patient had very low CSF Tau values, again indicating FTD. The far less relevant Aβ 42 concentration did not resemble either diagnosis. The neuropsychological test set was inconclusive with very low AD-indicating index values for executive function and language, but also a high memory index pointing to
Dow
nloa
ded
by:
Upp
sala
Uni
vers
itets
bibl
.
13
0.23
8.17
1.17
2 -
11/1
/201
6 11
:28:
15 A
M

326Dement Geriatr Cogn Disord Extra 2016;6:313–329
DOI: 10.1159/000447122
E X T R A
Muñoz-Ruiz et al.: Using the Disease State Fingerprint Tool for Differential Diagnosis of Frontotemporal Dementia and Alzheimer’s Disease
www.karger.com/dee© 2016 The Author(s). Published by S. Karger AG, Basel
FTD. As was previously mentioned in the results, the patient was very well educated and achieved higher than average scores in most of the cognitive tests. Therefore, while most FTD patients fare poorly in the executive function and language tests, this patient might have preserved sufficient cognitive capacity to overcome these challenges. The APOE status of the patient, 3/3, was suggestive of FTD and very relevant in this comparison, as most AD patients in this cohort have at least one APOE4 allele. Finally, the MRI was inconclusive, with hippo-campal atrophy typical for AD and frontal lobe atrophy pointing to FTD. Reviewing all of the patient data and comparing them with the Fingerprint, it was evident that the initial diagnosis of FTD seemed to be correct. This case is a good example of real clinical practice, where the symptomatology can be mixed, and the use of biomarkers like CSF, and imaging and genetics can assist in reaching the correct diagnosis between AD and FTD.
Comparison between Clinical and Autopsy-Confirmed Diagnosis There were substantial differences found between autopsy-confirmed and clinically
diagnosed dementia cases in this study as occurs in most clinical studies. This is partly because knowledge of the APOE genotype or CSF biomarker data was not available at the time when the original clinical diagnosis was made. Dementia studies with large amounts of autopsies are rare. Furthermore, the relevance of autopsy profiles of dementias, especially in cases with frontotemporal lobar degeneration, has increased in recent years [47, 48] . Here we had autopsy information only of FTD cases with TDP-43 pathology, and this represents only one major pathological entity of the many FTLD pathologies [49] .
The APOE genotype and T-Tau concentration in CSF were useful in both autopsy and clinical subgroup analyses. Both subgroups are better at predicting AD and FTD separately than together. This is influenced by the fact that only 8 out of 14 FTD and 3 of the AD autopsy-confirmed cases had initially the same clinical diagnosis, while 5 autopsy-confirmed FTD cases had been initially diagnosed as AD and 8 AD cases as FTD. The clinical DSI model places an emphasis on symptoms as they probably strongly influence the diagnosis, while the autopsy model mostly excludes them as it is built from cases with different clinical diagnoses. There is not enough data in the subgroups to improve the performance of the DSI. Despite the differences, the combination of clinically diagnosed and autopsy-confirmed cases is more likely to provide a holistic view of the disease, taking into account both the best knowledge of the clinician and the biological basis of the disease.
Limitations of the Study The study groups were not perfectly matched in terms of age and education. FTD patients
were better educated than AD patients, which could influence the results obtained for FTD and AD populations [50] . The brain pathology was limited in FTD cases to TDP-43 pathology, although there are also other major pathologies in addition to tau which are within the FTD disease spectrum. All data categories were not available for all groups, e.g. CSF was not collected from control subjects, and several patients had missing data from some measure-ments. However, this is not a problem for the DSI, as the model is created separately for each patient, and therefore missing data do not affect the outcome.
In future studies, we will compare the performance of manual volumetry analysis and morphometric methods, which have been proven to differentiate between AD and FTD [19] with good accuracy in certain brain regions. Our autopsy sample is small but improves the profile of biomarkers; therefore, similar studies in a larger cohort are warranted. In this study, we used a wide battery of neuropsychological tests but also a binary (yes/no) scale for assessing the presence of certain symptoms; in future studies, validated questionnaires to assess the symptoms are worth investigating.
Dow
nloa
ded
by:
Upp
sala
Uni
vers
itets
bibl
.
13
0.23
8.17
1.17
2 -
11/1
/201
6 11
:28:
15 A
M

327Dement Geriatr Cogn Disord Extra 2016;6:313–329
DOI: 10.1159/000447122
E X T R A
Muñoz-Ruiz et al.: Using the Disease State Fingerprint Tool for Differential Diagnosis of Frontotemporal Dementia and Alzheimer’s Disease
www.karger.com/dee© 2016 The Author(s). Published by S. Karger AG, Basel
Conclusion
The results show that the computer-assisted decision making tool DSI can differentiate normal status from dementing disease and here FTD from AD, making it a useful tool in the diagnosis of dementia in clinical practice. The results also indicate that by using DSI, the implementation of all possible biomarkers as clinical tests and MRI, SPECT and a full-scale battery of neuropsychological tests may be useful in the differential diagnosis between AD and FTD. The DSI can help verify a dementia diagnosis, especially when autopsy-confirmed or genetically verified cases are included in the training group.
Acknowledgments
This project has received funding from the European Union’s Seventh Framework Programme for research, technological development and demonstration under Grant agree-m e nts No.: 611005 from Patient Data to Clinical Diagnosis in Neurodegenerative Diseases: Predict ND, and FP7-ICT-2011-9-601055 Virtual Physiologic Human Dementia Research Enabled by IT, VPH-DARE @ IT, and Health Research Council of Academy of Finland (H.S.), EVO grant from Kuopio University Hospital (H.S., M.A.M.-R.) and Strategic funding for UEF-BRAIN from University of Eastern Finland (A.H., R.V., H.S.).
Disclosure Statement
The funders had no role in study design, data collection and analysis, decision to publish, or preparation of the manuscript.
J.M., J.K. and J.L. report that VTT Technical Research Centre of Finland owns the patents (U.S. Patent No. 7,840,510, inventors: J.K., J.L; PCT/FI2010/050545, pending, inventors: J.M., J.L,. J.K.) that cover some parts of the methods presented in the paper.
References
1 Sperling RA, Aisen PS, Beckett LA, Bennett DA, Craft S, Fagan AM, Iwatsubo T, Jack CR Jr, Kaye J, Montine TJ, Park DC, Reiman EM, Rowe CC, Siemers E, Stern Y, Yaffe K, Carrillo MC, Thies B, Morrison-Bogorad M, Wagster MV, Phelps CH: Toward defining the preclinical stages of Alzheimer’s disease: recommendations from the National Institute on Aging-Alzheimer’s Association workgroups on diagnostic guidelines for Alzheimer’s disease. Alzheimers Dement 2011; 7: 280–292.
2 Albert MS, DeKosky ST, Dickson D, Dubois B, Feldman HH, Fox NC, Gamst A, Holtzman DM, Jagust WJ, Petersen RC, Snyder PJ, Carrillo MC, Thies B, Phelps CH: The diagnosis of mild cognitive impairment due to Alzheimer’s disease: recommendations from the National Institute on Aging-Alzheimer’s Association workgroups on diag-nostic guidelines for Alzheimer’s disease. Alzheimers Dement 2011; 7: 270–279.
3 Rascovsky K, Hodges JR, Knopman D, Mendez MF, Kramer JH, Neuhaus J, van Swieten JC, Seelaar H, Dopper EG, Onyike CU, Hillis AE, Josephs KA, Boeve BF, Kertesz A, Seeley WW, Rankin KP, Johnson JK, Gorno-Tempini ML, Rosen H, Prioleau-Latham CE, Lee A, Kipps CM, Lillo P, Piguet O, Rohrer JD, Rossor MN, Warren JD, Fox NC, Galasko D, Salmon DP, Black SE, Mesulam M, Weintraub S, Dickerson BC, Diehl-Schmid J, Pasquier F, Derame-court V, Lebert F, Pijnenburg Y, Chow TW, Manes F, Grafman J, Cappa SF, Freedman M, Grossman M, Miller BL: Sensitivity of revised diagnostic criteria for the behavioural variant of frontotemporal dementia. Brain 2011; 134: 2456–2477.
4 Neary D, Snowden JS, Gustafson L, Passant U, Stuss D, Black S, Freedman M, Kertesz A, Robert PH, Albert M, Boone K, Miller BL, Cummings J, Benson DF: Frontotemporal lobar degeneration: a consensus on clinical diag-nostic criteria. Neurology 1998; 51: 1546–1554.
5 McKhann G, Drachman D, Folstein M, Katzman R, Price D, Stadlan EM: Clinical diagnosis of Alzheimer’s disease: report of the NINCDS-ADRDA Work Group under the auspices of Department of Health and Human Services Task Force on Alzheimer’s Disease. Neurology 1984; 34: 939–944.
Dow
nloa
ded
by:
Upp
sala
Uni
vers
itets
bibl
.
13
0.23
8.17
1.17
2 -
11/1
/201
6 11
:28:
15 A
M

328Dement Geriatr Cogn Disord Extra 2016;6:313–329
DOI: 10.1159/000447122
E X T R A
Muñoz-Ruiz et al.: Using the Disease State Fingerprint Tool for Differential Diagnosis of Frontotemporal Dementia and Alzheimer’s Disease
www.karger.com/dee© 2016 The Author(s). Published by S. Karger AG, Basel
6 McKhann GM, Knopman DS, Chertkow H, Hyman BT, Jack CR Jr, Kawas CH, Klunk WE, Koroshetz WJ, Manly JJ, Mayeux R, Mohs RC, Morris JC, Rossor MN, Scheltens P, Carrillo MC, Thies B, Weintraub S, Phelps CH: The diag-nosis of dementia due to Alzheimer’s disease: recommendations from the National Institute on Aging-Alzheimer’s Association workgroups on diagnostic guidelines for Alzheimer’s disease. Alzheimers Dement 2011; 7: 263–269.
7 Dubois B, Feldman HH, Jacova C, Dekosky ST, Barberger-Gateau P, Cummings J, Delacourte A, Galasko D, Gauthier S, Jicha G, Meguro K, O’brien J, Pasquier F, Robert P, Rossor M, Salloway S, Stern Y, Visser PJ, Scheltens P: Research criteria for the diagnosis of Alzheimer’s disease: revising the NINCDS-ADRDA criteria. Lancet Neurol 2007; 6: 734–746.
8 Dubois B, Feldman HH, Jacova C, Hampel H, Molinuevo JL, Blennow K, DeKosky ST, Gauthier S, Selkoe D, Bateman R, Cappa S, Crutch S, Engelborghs S, Frisoni GB, Fox NC, Galasko D, Habert MO, Jicha GA, Nordberg A, Pasquier F, Rabinovici G, Robert P, Rowe C, Salloway S, Sarazin M, Epelbaum S, de Souza LC, Vellas B, Visser PJ, Schneider L, Stern Y, Scheltens P, Cummings JL: Advancing research diagnostic criteria for Alzheimer’s disease: the IWG-2 criteria. Lancet Neurol 2014; 13: 614–629.
9 Mattila J, Koikkalainen J, Virkki A, Simonsen A, van Gils M, Waldemar G, Soininen H, Lotjonen J, Alzheimer’s Disease Neuroimaging Initiative: A disease state fingerprint for evaluation of Alzheimer’s disease. J Alzheimers Dis 2011; 27: 163–176.
10 Mattila J, Koikkalainen J, Virkki A, van Gils M, Lotjonen J, Alzheimer’s Disease Neuroimaging Initiative: Design and application of a generic clinical decision support system for multiscale data. IEEE Trans Biomed Eng 2012; 59: 234–240.
11 Simonsen AH, Mattila J, Hejl AM, Frederiksen KS, Herukka SK, Hallikainen M, van Gils M, Lotjonen J, Soininen H, Waldemar G: Application of the PredictAD software tool to predict progression in patients with mild cognitive impairment. Dement Geriatr Cogn Disord 2012; 34: 344–350.
12 Simonsen AH, Mattila J, Hejl AM, Garde E, van Gils M, Thomsen C, Lotjonen J, Soininen H, Waldemar G: Appli-cation of the PredictAD decision support tool to a Danish cohort of patients with Alzheimer’s disease and other dementias. Dement Geriatr Cogn Disord 2013; 37: 207–213.
13 Liu Y, Mattila J, Ruiz MA, Paajanen T, Koikkalainen J, van Gils M, Herukka SK, Waldemar G, Lotjonen J, Soininen H, Alzheimer’s Disease Neuroimaging Initiative: Predicting AD conversion: comparison between prodromal AD guidelines and computer assisted PredictAD tool. PLoS One 2013; 8:e55246.
14 Hall A, Mattila J, Koikkalainen J, Lotjonen J, Wolz R, Scheltens P, Frisoni G, Tsolaki M, Nobili F, Freund-Levi Y, Minthon L, Frolich L, Hampel H, Visser PJ, Soininen H: Predicting progression from cognitive impairment to Alzheimer’s disease with the Disease State Index. Curr Alzheimer Res 2015; 12: 69–79.
15 Hall A, Munoz-Ruiz M, Mattila J, Koikkalainen J, Tsolaki M, Mecocci P, Kloszewska I, Vellas B, Lovestone S, Visser PJ, Lotjonen J, Soininen H, Alzheimer Disease Neuroimaging Initiative, AddNeuroMed consortium, DESCRIPA and Kuopio L-MCI: Generalizability of the disease state index prediction model for identifying patients progressing from mild cognitive impairment to Alzheimer’s disease. J Alzheimers Dis 2015; 44: 79–92.
16 Munoz-Ruiz MA, Hartikainen P, Hall A, Mattila J, Koikkalainen J, Herukka SK, Julkunen V, Vanninen R, Liu Y, Lotjonen J, Soininen H: Disease state fingerprint in frontotemporal degeneration with reference to Alzheimer’s disease and mild cognitive impairment. J Alzheimers Dis 2013; 35: 727–739.
17 DeJesus-Hernandez M, Mackenzie IR, Boeve BF, Boxer AL, Baker M, Rutherford NJ, Nicholson AM, Finch NA, Flynn H, Adamson J, Kouri N, Wojtas A, Sengdy P, Hsiung GY, Karydas A, Seeley WW, Josephs KA, Coppola G, Geschwind DH, Wszolek ZK, Feldman H, Knopman DS, Petersen RC, Miller BL, Dickson DW, Boylan KB, Graff-Radford NR, Rademakers R: Expanded GGGGCC hexanucleotide repeat in noncoding region of C9ORF72 causes chromosome 9p-linked FTD and ALS. Neuron 2011; 72: 245–256.
18 American Psychiatric Association: Diagnostic and Statistical Manual of Mental Disorders, ed 4. Washington, American Psychiatric Association, 1994.
19 Munoz-Ruiz MA, Hartikainen P, Koikkalainen J, Wolz R, Julkunen V, Niskanen E, Herukka SK, Kivipelto M, Vanninen R, Rueckert D, Liu Y, Lotjonen J, Soininen H: Structural MRI in frontotemporal dementia: compar-isons between hippocampal volumetry, tensor-based morphometry and voxel-based morphometry. PLoS One 2012; 7:e52531.
20 Laakso MP, Frisoni GB, Kononen M, Mikkonen M, Beltramello A, Geroldi C, Bianchetti A, Trabucchi M, Soininen H, Aronen HJ: Hippocampus and entorhinal cortex in frontotemporal dementia and Alzheimer’s disease: a morphometric MRI study. Biol Psychiatry 2000; 47: 1056–1063.
21 Lehtovirta M, Kuikka J, Helisalmi S, Hartikainen P, Mannermaa A, Ryynanen M, Riekkinen PS, Soininen H: Longitudinal SPECT study in Alzheimer’s disease: relation to apolipoprotein E polymorphism. J Neurol Neurosurg Psychiatry 1998; 64: 742–746.
22 Lehtovirta M, Soininen H, Laakso MP, Partanen K, Helisalmi S, Mannermaa A, Ryynanen M, Kuikka J, Harti-kainen P, Riekkinen PJ Sr: SPECT and MRI analysis in Alzheimer’s disease: relation to apolipoprotein E epsilon 4 allele. J Neurol Neurosurg Psychiatry 1996; 60: 644–649.
23 Tsukamoto K, Watanabe T, Matsushima T, Kinoshita M, Kato H, Hashimoto Y, Kurokawa K, Teramoto T: Deter-mination by PCR-RFLP of apo E genotype in a Japanese population. J Lab Clin Med 1993; 121: 598–602.
24 Brunnstrom H, Englund E: Clinicopathological concordance in dementia diagnostics. Am J Geriatr Psychiatry 2009; 17: 664–670.
25 Jellinger KA: Clinicopathological analysis of dementia disorders in the elderly – an update. J Alzheimers Dis 2006; 9: 61–70.
Dow
nloa
ded
by:
Upp
sala
Uni
vers
itets
bibl
.
13
0.23
8.17
1.17
2 -
11/1
/201
6 11
:28:
15 A
M

329Dement Geriatr Cogn Disord Extra 2016;6:313–329
DOI: 10.1159/000447122
E X T R A
Muñoz-Ruiz et al.: Using the Disease State Fingerprint Tool for Differential Diagnosis of Frontotemporal Dementia and Alzheimer’s Disease
www.karger.com/dee© 2016 The Author(s). Published by S. Karger AG, Basel
26 Jellinger KA: Criteria for the neuropathological diagnosis of dementing disorders: routes out of the swamp? Acta Neuropathol 2009; 117: 101–110.
27 Graham A, Davies R, Xuereb J, Halliday G, Kril J, Creasey H, Graham K, Hodges J: Pathologically proven fronto-temporal dementia presenting with severe amnesia. Brain 2005; 128: 597–605.
28 Leger GC, Banks SJ: Neuropsychiatric symptom profile differs based on pathology in patients with clinically diagnosed behavioral variant frontotemporal dementia. Dement Geriatr Cogn Disord 2013; 37: 104–112.
29 Bathgate D, Snowden JS, Varma A, Blackshaw A, Neary D: Behaviour in frontotemporal dementia, Alzheimer’s disease and vascular dementia. Acta Neurol Scand 2001; 103: 367–378.
30 Wolz R, Julkunen V, Koikkalainen J, Niskanen E, Zhang DP, Rueckert D, Soininen H, Lotjonen J, Alzheimer’s Disease Neuroimaging Initiative: multi-method analysis of MRI images in early diagnostics of Alzheimer’s disease. PLoS One 2011; 6:e25446.
31 Hartikainen P, Rasanen J, Julkunen V, Niskanen E, Hallikainen M, Kivipelto M, Vanninen R, Remes AM, Soininen H: Cortical thickness in frontotemporal dementia, mild cognitive impairment, and Alzheimer’s disease. J Alzheimers Dis 2012; 30: 857–874.
32 Julkunen V, Niskanen E, Koikkalainen J, Herukka SK, Pihlajamaki M, Hallikainen M, Kivipelto M, Muehlboeck S, Evans AC, Vanninen R, Hilkka S: Differences in cortical thickness in healthy controls, subjects with mild cognitive impairment, and Alzheimer’s disease patients: a longitudinal study. J Alzheimers Dis 2010; 21: 1141–1151.
33 Julkunen V, Niskanen E, Muehlboeck S, Pihlajamaki M, Kononen M, Hallikainen M, Kivipelto M, Tervo S, Vanninen R, Evans A, Soininen H: Cortical thickness analysis to detect progressive mild cognitive impairment: a reference to Alzheimer’s disease. Dement Geriatr Cogn Disord 2009; 28: 404–412.
34 Julkunen V, Niskanen E, Koikkalainen J, Herukka SK, Pihlajamaki M, Hallikainen M, Kivipelto M, Muehlboeck S, Evans AC, Vanninen R, Hilkka S: Differences in cortical thickness in healthy controls, subjects with mild cognitive impairment, and Alzheimer’s disease patients: a longitudinal study. J Alzheimers Dis 2010; 21: 1141–1151.
35 van de Pol LA, Hensel A, van der Flier WM, Visser PJ, Pijnenburg YA, Barkhof F, Gertz HJ, Scheltens P: Hippo-campal atrophy on MRI in frontotemporal lobar degeneration and Alzheimer’s disease. J Neurol Neurosurg Psychiatry 2006; 77: 439–442.
36 Bertoux M, de Souza LC, Corlier F, Lamari F, Bottlaender M, Dubois B, Sarazin M: Two distinct amnesic profiles in behavioral variant frontotemporal dementia. Biol Psychiatry 2014; 75: 582–588.
37 Kertesz A: Pick Complex: an integrative approach to frontotemporal dementia: primary progressive aphasia, corticobasal degeneration, and progressive supranuclear palsy. Neurologist 2003; 9: 311–317.
38 Charpentier P, Lavenu I, Defebvre L, Duhamel A, Lecouffe P, Pasquier F, Steinling M: Alzheimer’s disease and frontotemporal dementia are differentiated by discriminant analysis applied to 99m Tc HmPAO SPECT data. J Neurol Neurosurg Psychiatry 2000; 69: 661–663.
39 McNeill R, Sare GM, Manoharan M, Testa HJ, Mann DM, Neary D, Snowden JS, Varma AR: Accuracy of single-photon emission computed tomography in differentiating frontotemporal dementia from Alzheimer’s disease. J Neurol Neurosurg Psychiatry 2007; 78: 350–355.
40 Bernardi L, Maletta RG, Tomaino C, Smirne N, Di Natale M, Perri M, Longo T, Colao R, Curcio SA, Puccio G, Mira-belli M, Kawarai T, Rogaeva E, St George Hyslop PH, Passarino G, De Benedictis G, Bruni AC: The effects of APOE and tau gene variability on risk of frontotemporal dementia. Neurobiol Aging 2006; 27: 702–709.
41 Engelborghs S, Dermaut B, Goeman J, Saerens J, Marien P, Pickut BA, Van den Broeck M, Serneels S, Cruts M, Van Broeckhoven C, De Deyn PP: Prospective Belgian study of neurodegenerative and vascular dementia: APOE genotype effects. J Neurol Neurosurg Psychiatry 2003; 74: 1148–1151.
42 Cooper-Knock J, Shaw PJ, Kirby J: The widening spectrum of C9ORF72-related disease; genotype/phenotype correlations and potential modifiers of clinical phenotype. Acta Neuropathol 2014; 127: 333–345.
43 Agosta F, Vossel KA, Miller BL, Migliaccio R, Bonasera SJ, Filippi M, Boxer AL, Karydas A, Possin KL, Gorno-Tempini ML: Apolipoprotein E epsilon4 is associated with disease-specific effects on brain atrophy in Alzheimer’s disease and frontotemporal dementia. Proc Natl Acad Sci USA 2009; 106: 2018–2022.
44 Pievani M, Galluzzi S, Thompson PM, Rasser PE, Bonetti M, Frisoni GB: APOE4 is associated with greater atrophy of the hippocampal formation in Alzheimer’s disease. Neuroimage 2011; 55: 909–919.
45 Schoonenboom NS, Reesink FE, Verwey NA, Kester MI, Teunissen CE, van de Ven PM, Pijnenburg YA, Blanken-stein MA, Rozemuller AJ, Scheltens P, van der Flier WM: Cerebrospinal fluid markers for differential dementia diagnosis in a large memory clinic cohort. Neurology 2012; 78: 47–54.
46 Chow TW, Alobaidy AA: Incorporating new diagnostic schemas, genetics, and proteinopathy into the evalu-ation of frontotemporal degeneration. Continuum (Minneap Minn) 2013; 19: 438–456.
47 Pikkarainen M, Hartikainen P, Alafuzoff I: Neuropathologic features of frontotemporal lobar degeneration with ubiquitin-positive inclusions visualized with ubiquitin-binding protein p62 immunohistochemistry. J Neuropathol Exp Neurol 2008; 67: 280–298.
48 Hartikainen PH, Pikkarainen M, Hanninen T, Soininen H, Alafuzoff I: Unusual clinical presentation and neuro-pathology in two subjects with fused-in sarcoma (FUS) positive inclusions. Neuropathology 2012; 32: 60–68.
49 Riedl L, Mackenzie IR, Forstl H, Kurz A, Diehl-Schmid J: Frontotemporal lobar degeneration: current perspec-tives. Neuropsychiatr Dis Treat 2014; 10: 297–310.
50 Borroni B, Alberici A, Agosti C, Premi E, Padovani A: Education plays a different role in frontotemporal dementia and Alzheimer’s disease. Int J Geriatr Psychiatry 2008; 23: 796–800.
Dow
nloa
ded
by:
Upp
sala
Uni
vers
itets
bibl
.
13
0.23
8.17
1.17
2 -
11/1
/201
6 11
:28:
15 A
M