Embed Size (px)
Citation preview

Utility of Ground-penetrating Radar in Imaging of Limestone Reservoir Analogs 43
Utility of Ground-penetrating Radar in Near-surface,High-resolution Imaging of Lansing-Kansas City (Pennsylvanian)
Limestone Reservoir Analogs
Alex Martinez1, Joseph M. Kruger2, and Evan K. Franseen1
1Kansas Geological Survey, 1930 Constant Ave., Lawrence, KS 660472Idaho State University, Department of Geology, Pocatello, ID 83209-8072
AbstractHigh-resolution ground-penetrating radar (GPR) is a subsurface imaging tool that can extend results
gained from studies of reservoir-analog outcrops and add detailed information about reservoir analogsthat is unavailable from either seismic data or well control alone. Integration of GPR-reflectioninformation and outcrop photomosaics allowed detailed study of subtle changes in lithology and beddingsurfaces by comparing lateral and vertical changes in GPR-reflection character with outcrop features.Outcrops are valuable for confirming interpretations of reflections and providing velocity informationfor the GPR data. Outcrops of two Lansing-Kansas City Group limestone units, the Captain CreekLimestone and the Plattsburg Limestone, were used as test sites to determine the vertical imagingresolution, penetration depth, and reflection character of high-frequency (500 MHz) GPR in interbeddedcarbonate and shale units, where the carbonate units contained thin interbeds of shale. Features as smallas 0.1–0.2 m (0.3–0.7 ft)—including major architectural elements (such as major and minor boundingsurfaces) and internal features (such as fractures, internal bedding, and crossbedding)—were success-fully imaged and confirmed by outcrop data. Variations in GPR-reflection character between geologicunits allowed recognition of argillaceous limestone units in the subsurface. Although shale and soil atthe surface generally impeded GPR signal penetration, thin shale layers and shale at bounding surfacesactually enhanced reflectivity and aided in interpretation. Our results indicate that GPR can be success-fully used as an aid in outcrop studies to provide quantitative data for use in reservoir modeling.
Pennsylvanian, cyclothemic, carbonate strata that cropout in northeastern Kansas are direct analogs for stratalunits that are petroleum reservoirs in central and westernKansas. Although the reservoirs have been successfullyproduced for many years, they still contain significantaccumulations of hydrocarbons. New methods are beingsought to identify thinner zones and better understandreservoir architecture at increasingly finer scales. Many ofthe reservoirs have multiple pay zones within the complexreservoir heterogeneity that are affected by poorly under-stood facies changes, stratal geometries, diagenesis, andinterbedded shales and sandstones that provide seals toreservoir facies (Newell et al., 1987).
Outcrop studies of reservoir analogs can provideimportant insights into complex reservoir architecture.Increasingly, outcrop studies of Pennsylvanian strata inKansas integrate modern concepts of sequence stratigra-phy (e.g., Watney et al., 1989; Feldman and Franseen,1991) with other methods, such as high-resolution seismicdata (Miller et al., 1995; Franseen et al., 1995), in order tobetter understand geometries, facies patterns, and diage-netic trends, not only at the cyclothem scale, but also ofstrata within individual cyclothems. Such studies, focusing
on higher resolution, can aid in better understandingreservoir architecture and controls, especially in smaller-scale reservoirs where general patterns of stratal geom-etries, thicknesses, and diagenetic trends, which do notcorrelate with structure, are important in controllingreservoir development (e.g., Brown, 1963; Watney, 1980).
Seismic-reflection data provide general informationabout subsurface structures and usually image featuresgreater than 10–15 m (33–49 ft) in thickness. Well data, onthe other hand, provide very detailed information about thearea immediately around the well. Outcrop-analog studiesare an important facet of reservoir studies because theybridge the gap in resolution between seismic and wellinformation and allow detection of small-scale lateralvariations of detailed stratigraphic architecture, which canaffect oil recovery and may be missed by using onlyseismic or well data.
Ground-penetrating radar (GPR) is a near-surface, non-intrusive geophysical technique similar to seismic reflec-tion that images the subsurface at a much higher resolution(Pratt and Miall, 1993; Gawthorpe et al., 1993; Liner andLiner, 1995; Beres et al., 1995; Bridge et al., 1995; Jol etal., 1996; Martinez et al., 1996). In addition to the high-

44 Martinez et al.
resolution imaging, GPR is a potentially useful method inoutcrop studies because it can provide stratal informationin poorly exposed areas and three-dimensional stratalcharacteristics beyond the outcrop face (e.g., Beaty et al.,1997). Because GPR profiles are usually gathered ascommon offset data, minimal digital-signal processing isinvolved when compared to shallow seismic-reflectionmethods. Data collection is rapid and non-invasive,allowing profiles to be collected easily and quicklywithout altering a study site. The digital data collected areeasily manageable on computer workstations with soft-ware developed for the petroleum industry to interpretseismic data. Collection of multiple profiles or three-dimensional grids of GPR data at study sites allowsoutcrop studies to be extended into the third-dimension,sometimes greatly enhancing understanding of strati-graphic architecture (Beaty et al., 1997). Grids of GPRdata can also be used to supplement and connect discretecore information.
Typical GPR frequencies for stratigraphic studies rangefrom 10 to 100 MHz, resulting in vertical imaging resolu-tions of 1.5–1.0 m (4.9–3.3 ft) (Beres et al., 1995; Bridgeet al., 1995; Dominic et al., 1995). Although such resolu-tion is sufficient for targets that are relatively large orlaterally extensive, it may be insufficient for imagingdetailed stratigraphy needed for some reservoir studies.Use of higher-frequency antennas (e.g., greater than 200MHz) increases resolution enough to image fine-scalestratigraphic variations, but penetration depths decreasedue to signal attenuation, which increases with frequency(Davis and Annan, 1989).
The purpose of our study was to determine the useful-ness and limitations of GPR as an additional tool incharacterizing Pennsylvanian, carbonate, reservoir-analogoutcrops at a high resolution. To date, only a few studieshave examined the usefulness of GPR as a stratigraphictool in carbonate strata (Pratt and Miall, 1993; Liner andLiner, 1995). These studies focused on thick, relativelyhomogeneous carbonate packages. Our study differs in thatwe imaged interbedded carbonate and shale strata (0.2–5m; 0.7–16.4 ft), and the carbonate beds variously con-tained thin (less than 0.01 m; 0.03 ft) shale layers.
The study outcrops were divided into several differentunits based upon GPR reflections and stratigraphy. Theinterpreted data show excellent correlation betweenstratigraphic surfaces seen on the outcrop face and thoseimaged via high-frequency GPR. In this study GPRimaged subsurface features as thin as 0.1–0.2 m (0.3–0.7ft). However, data quality was severely diminished insome areas by significant signal attenuation, which wascaused by either shales or clay-rich soils at the surface.The results of our study indicate that GPR is a usefulmethod for imaging and adding to outcrop studies ofcarbonate-reservoir analogs. Our study also providesinformation on the limitations of GPR in the study ofcyclic strata composed of interbedded carbonate andsiliciclastic strata and gives direction for future studies.
GPR Data Acquisition and Processing
General Methods
GPR acquisition, processing, and display are verysimilar to the methods used in seismic reflection. How-ever, GPR has much higher resolution and is sensitive tochanges in electromagnetic, rather than acoustic, proper-ties. GPR reflections are caused by electromagnetic wavesencountering media that have different electrical proper-ties—namely, boundaries consisting of dielectric-constantcontrasts. Reflection strength is approximately propor-tional to the difference of the dielectric constants at theboundary (Davis and Annan, 1989). Values for dielectricconstants range from 1 for air, 4 to 8 for limestone, 5 to 13for shale, 5 to 40 for clay, and 81 for water (Daniels, 1996;Davis and Annan, 1989; Schon, 1996). Dielectric-constantvalues affect the velocity of electromagnetic wavesthrough a material. One-way velocities for the followingmaterials are 0.3 m (1 ft)/nanosecond (ns) for air, 0.11–0.15 m (0.36–0.49 ft)/ns for limestone, 0.08–0.13 m (0.26–0.43 ft)/ns for shale, 0.05–0.13 m (0.16–0.43 ft)/ns forclay, and 0.03 m (0.09 ft)/ns for water. Antenna frequen-cies typically range from 10 to 1,000 MHz. Verticalresolution varies from 1 to 1.5 m (3.3–4.9 ft) for low-frequency antennas (10–100 MHz) to 0.02 to 0.3 m (0.06–0.98 ft) for higher-frequency antennas (500–1,000 MHz)for most materials (Davis and Annan, 1989). Thesereported velocities were used as a basis for elevationcorrections and interpretation in this study and wereverified by comparison of reflection times with unitthicknesses on the outcrop.
GPR data are typically shown as common offsetprofiles with trace-amplitude variations representingdifferences in reflectivity. The vertical scale of a profileshows two-way travel-time, usually in nanoseconds(ns = 1 × 10⁻⁹ s), and the lateral scale is distance (tracespacing × number of traces) along the profile.
Acquisition Parameters and Data Processing
Two study sites were chosen, based on the quality ofexposure, ease of access, availability of geologic data fromprevious studies, and relevance of the facies and stratalgeometries to reservoirs in Kansas. Site preparationincluded clearing the antenna path of obstructions,flagging the stations, collecting relative elevation informa-tion, and creating photomosaics of the outcrops forcomparison with GPR data. The removal of material suchas small rocks and grass from the antenna pathwayenhanced antenna coupling with the ground and reducedspurious diffractions. It also allowed relatively consistentlateral antenna movement, ensuring even trace spacing. Inorder to retain the same antenna pathway for each of theprofiles collected and to allow for the comparison of GPRdata with the outcrop, stations were flagged at 1.5- or3.1-m (4.9- or 10.2-ft) intervals. The antenna pathways
Utility of Ground-penetrating Radar in Imaging of Limestone Reservoir Analogs 45
Download from GPR Unit
Reformat to SEGY
Import Into Seismic Unix (SU)
Apply Front-end Mute
Apply Bandpass and f-k Filters
Perform Trace Balancing and AGC
Apply Elevation Corrections
Import Into Workstation For Interpretation
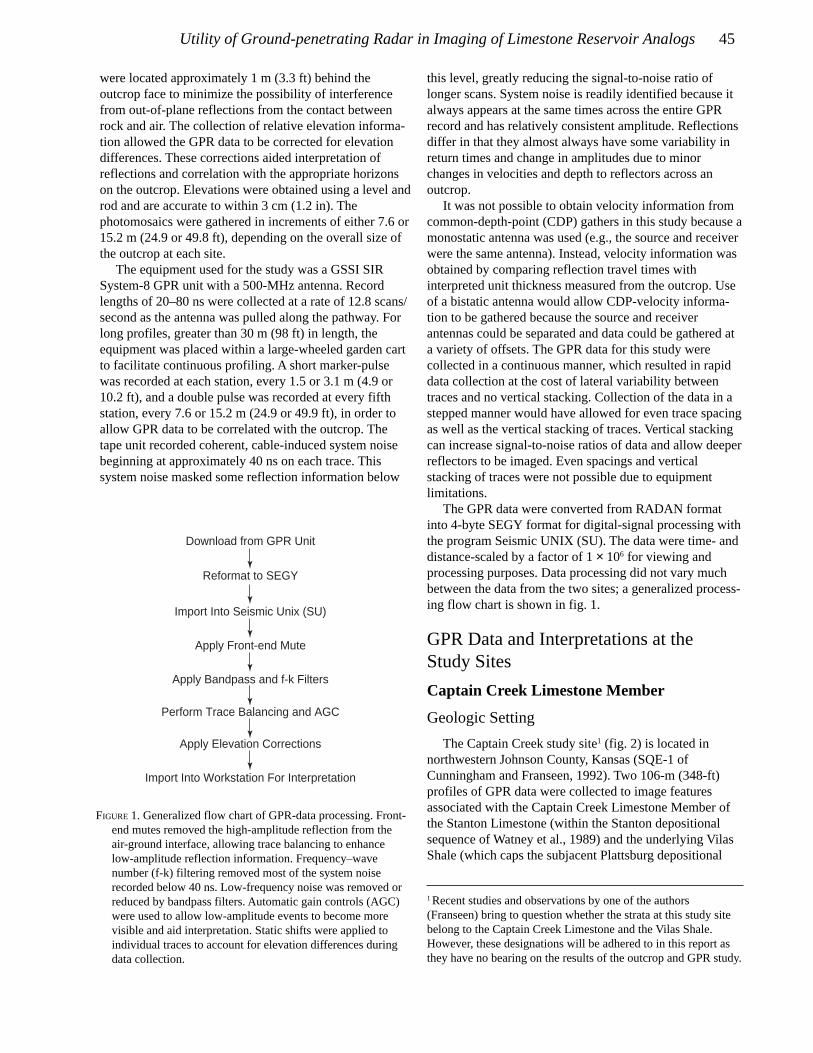
FIGURE 1. Generalized flow chart of GPR-data processing. Front-end mutes removed the high-amplitude reflection from theair-ground interface, allowing trace balancing to enhancelow-amplitude reflection information. Frequency–wavenumber (f-k) filtering removed most of the system noiserecorded below 40 ns. Low-frequency noise was removed orreduced by bandpass filters. Automatic gain controls (AGC)were used to allow low-amplitude events to become morevisible and aid interpretation. Static shifts were applied toindividual traces to account for elevation differences duringdata collection.
were located approximately 1 m (3.3 ft) behind theoutcrop face to minimize the possibility of interferencefrom out-of-plane reflections from the contact betweenrock and air. The collection of relative elevation informa-tion allowed the GPR data to be corrected for elevationdifferences. These corrections aided interpretation ofreflections and correlation with the appropriate horizonson the outcrop. Elevations were obtained using a level androd and are accurate to within 3 cm (1.2 in). Thephotomosaics were gathered in increments of either 7.6 or15.2 m (24.9 or 49.8 ft), depending on the overall size ofthe outcrop at each site.
The equipment used for the study was a GSSI SIRSystem-8 GPR unit with a 500-MHz antenna. Recordlengths of 20–80 ns were collected at a rate of 12.8 scans/second as the antenna was pulled along the pathway. Forlong profiles, greater than 30 m (98 ft) in length, theequipment was placed within a large-wheeled garden cartto facilitate continuous profiling. A short marker-pulsewas recorded at each station, every 1.5 or 3.1 m (4.9 or10.2 ft), and a double pulse was recorded at every fifthstation, every 7.6 or 15.2 m (24.9 or 49.9 ft), in order toallow GPR data to be correlated with the outcrop. Thetape unit recorded coherent, cable-induced system noisebeginning at approximately 40 ns on each trace. Thissystem noise masked some reflection information below
this level, greatly reducing the signal-to-noise ratio oflonger scans. System noise is readily identified because italways appears at the same times across the entire GPRrecord and has relatively consistent amplitude. Reflectionsdiffer in that they almost always have some variability inreturn times and change in amplitudes due to minorchanges in velocities and depth to reflectors across anoutcrop.
It was not possible to obtain velocity information fromcommon-depth-point (CDP) gathers in this study because amonostatic antenna was used (e.g., the source and receiverwere the same antenna). Instead, velocity information wasobtained by comparing reflection travel times withinterpreted unit thickness measured from the outcrop. Useof a bistatic antenna would allow CDP-velocity informa-tion to be gathered because the source and receiverantennas could be separated and data could be gathered ata variety of offsets. The GPR data for this study werecollected in a continuous manner, which resulted in rapiddata collection at the cost of lateral variability betweentraces and no vertical stacking. Collection of the data in astepped manner would have allowed for even trace spacingas well as the vertical stacking of traces. Vertical stackingcan increase signal-to-noise ratios of data and allow deeperreflectors to be imaged. Even spacings and verticalstacking of traces were not possible due to equipmentlimitations.
The GPR data were converted from RADAN formatinto 4-byte SEGY format for digital-signal processing withthe program Seismic UNIX (SU). The data were time- anddistance-scaled by a factor of 1 × 10⁶ for viewing andprocessing purposes. Data processing did not vary muchbetween the data from the two sites; a generalized process-ing flow chart is shown in fig. 1.
GPR Data and Interpretations at theStudy Sites
Captain Creek Limestone Member
Geologic Setting
The Captain Creek study site1 (fig. 2) is located innorthwestern Johnson County, Kansas (SQE-1 ofCunningham and Franseen, 1992). Two 106-m (348-ft)profiles of GPR data were collected to image featuresassociated with the Captain Creek Limestone Member ofthe Stanton Limestone (within the Stanton depositionalsequence of Watney et al., 1989) and the underlying VilasShale (which caps the subjacent Plattsburg depositional
1 Recent studies and observations by one of the authors(Franseen) bring to question whether the strata at this study sitebelong to the Captain Creek Limestone and the Vilas Shale.However, these designations will be adhered to in this report asthey have no bearing on the results of the outcrop and GPR study.
46 Martinez et al.
sequence of Watney et al., 1989) (fig. 3). The site waschosen to determine the capabilities of GPR to image (1)the erosional contact between the Captain Creek and VilasShale; (2) the contact between the lower and upper CaptainCreek submembers; and (3) internal bedding geometriesand truncations in the lower and upper Captain Creeksubmembers.
The Vilas Shale is a gray mudstone, silty or sandyshale, or fine-grained sandstone containing mica andcarbonized plant fragments (Cunningham and Franseen,
KansasCity
Pleasanton
Lansing
Douglas
Shawnee
Wabaunsee
Virg
ilian
Mis
sour
ian
Upp
er P
enns
ylva
nian
GroupFormation
Howard Ls.
Topeka Ls.
Lecompton Ls.
Stanton Ls.Vilas Sh.
Plattsburg Ls.
Wyandotte Ls.
Iola Ls.
Drum Ls.
Dennis Ls.
Swope Ls.Hertha Ls.
Mound Valley ls.
Cherryvale Sh.
Oread Ls.
South Bend Ls.Member
Rock Lake Sh.Stoner Ls.Eudora Sh.Captain Creek Ls.
Spring Hill Ls.Hickory Creek Sh.Merriam Ls.Bonner Springs Sh.
Lawrence Fm.
Deer Creek Ls.
Stage Series
. . .... . .... . .... . .... .
. ... .. .. .
.... ..
.
. .. ..... ... ..
. . . .
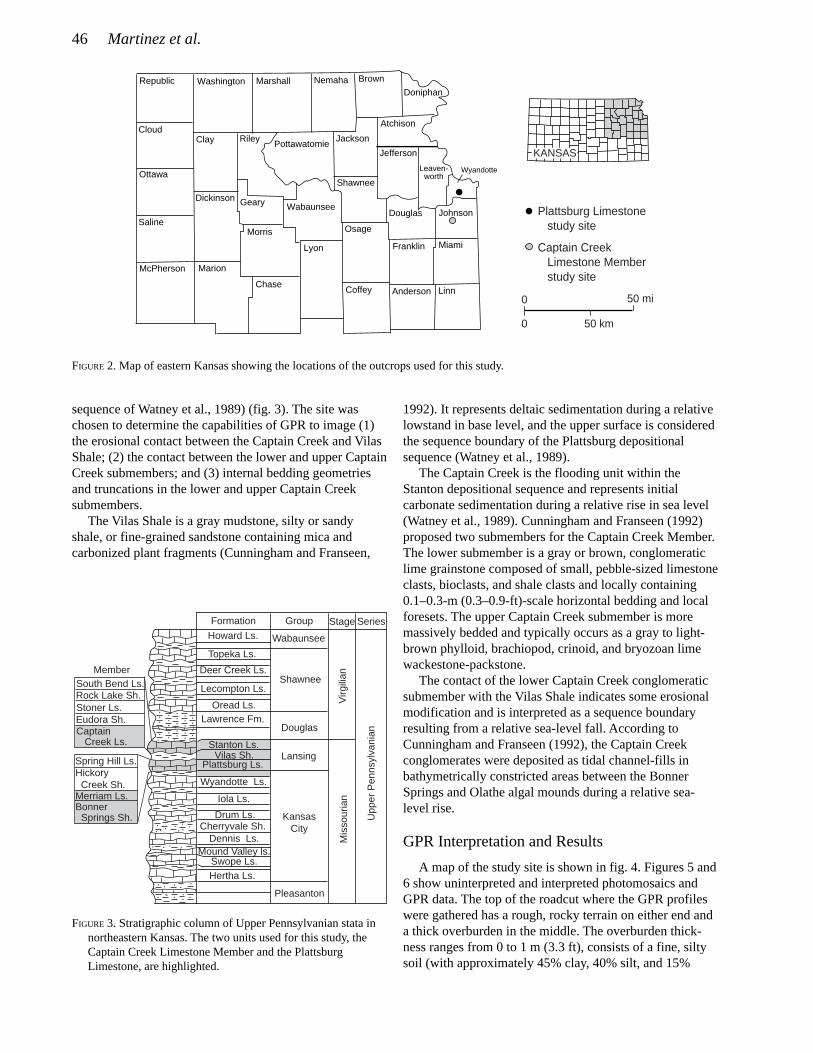
FIGURE 2. Map of eastern Kansas showing the locations of the outcrops used for this study.
FIGURE 3. Stratigraphic column of Upper Pennsylvanian stata innortheastern Kansas. The two units used for this study, theCaptain Creek Limestone Member and the PlattsburgLimestone, are highlighted.
1992). It represents deltaic sedimentation during a relativelowstand in base level, and the upper surface is consideredthe sequence boundary of the Plattsburg depositionalsequence (Watney et al., 1989).
The Captain Creek is the flooding unit within theStanton depositional sequence and represents initialcarbonate sedimentation during a relative rise in sea level(Watney et al., 1989). Cunningham and Franseen (1992)proposed two submembers for the Captain Creek Member.The lower submember is a gray or brown, conglomeraticlime grainstone composed of small, pebble-sized limestoneclasts, bioclasts, and shale clasts and locally containing0.1–0.3-m (0.3–0.9-ft)-scale horizontal bedding and localforesets. The upper Captain Creek submember is moremassively bedded and typically occurs as a gray to light-brown phylloid, brachiopod, crinoid, and bryozoan limewackestone-packstone.
The contact of the lower Captain Creek conglomeraticsubmember with the Vilas Shale indicates some erosionalmodification and is interpreted as a sequence boundaryresulting from a relative sea-level fall. According toCunningham and Franseen (1992), the Captain Creekconglomerates were deposited as tidal channel-fills inbathymetrically constricted areas between the BonnerSprings and Olathe algal mounds during a relative sea-level rise.
GPR Interpretation and Results
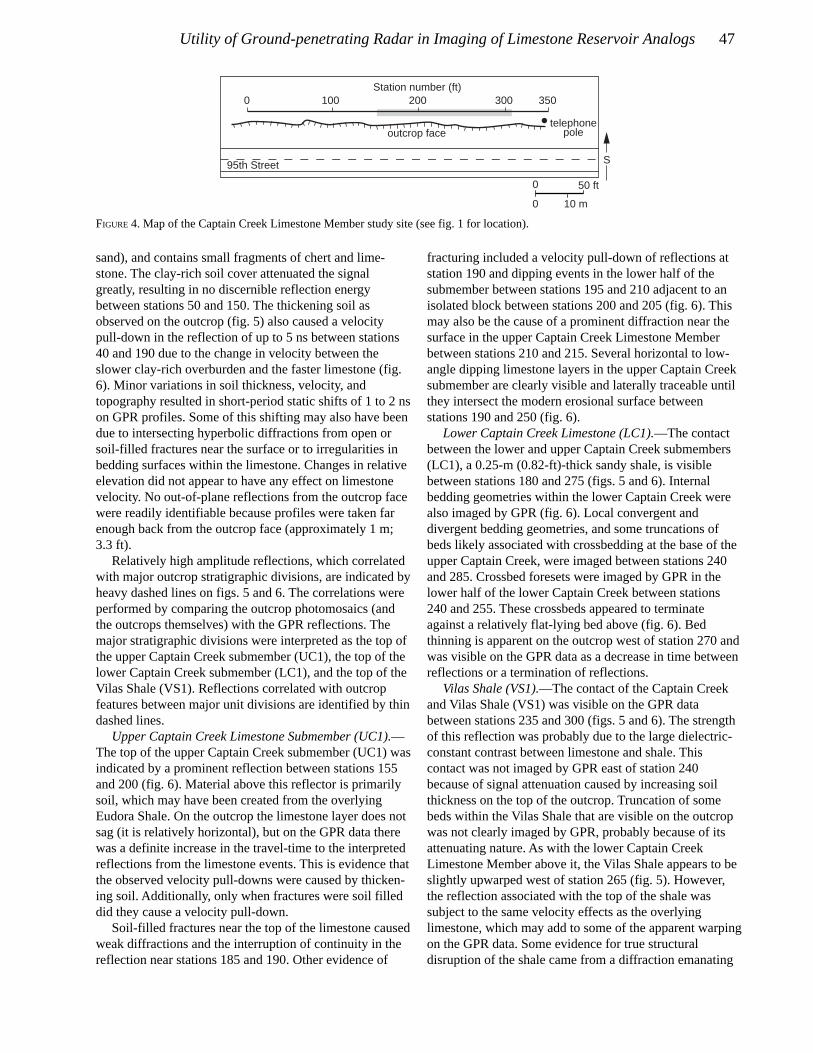
A map of the study site is shown in fig. 4. Figures 5 and6 show uninterpreted and interpreted photomosaics andGPR data. The top of the roadcut where the GPR profileswere gathered has a rough, rocky terrain on either end anda thick overburden in the middle. The overburden thick-ness ranges from 0 to 1 m (3.3 ft), consists of a fine, siltysoil (with approximately 45% clay, 40% silt, and 15%
Jefferson
Leaven-worth
Wyandotte
Atchison
Brown
Doniphan
Jackson
Shawnee
Douglas Johnson
MiamiFranklin
Osage
Lyon
Wabaunsee
NemahaMarshall
Pottawatomie
Morris
Anderson LinnCoffey
Riley
GearyDickinson
Clay
WashingtonRepublic
Cloud
Ottawa
Saline
McPherson Marion
Chase
0
0 50 km
50 mi
Plattsburg Limestone study site
Captain Creek Limestone Member study site
KANSAS
Utility of Ground-penetrating Radar in Imaging of Limestone Reservoir Analogs 47
95th Street
0 100 200 300
outcrop facetelephone
pole
350
0
0 10 m
50 ft
Station number (ft)
S
sand), and contains small fragments of chert and lime-stone. The clay-rich soil cover attenuated the signalgreatly, resulting in no discernible reflection energybetween stations 50 and 150. The thickening soil asobserved on the outcrop (fig. 5) also caused a velocitypull-down in the reflection of up to 5 ns between stations40 and 190 due to the change in velocity between theslower clay-rich overburden and the faster limestone (fig.6). Minor variations in soil thickness, velocity, andtopography resulted in short-period static shifts of 1 to 2 nson GPR profiles. Some of this shifting may also have beendue to intersecting hyperbolic diffractions from open orsoil-filled fractures near the surface or to irregularities inbedding surfaces within the limestone. Changes in relativeelevation did not appear to have any effect on limestonevelocity. No out-of-plane reflections from the outcrop facewere readily identifiable because profiles were taken farenough back from the outcrop face (approximately 1 m;3.3 ft).
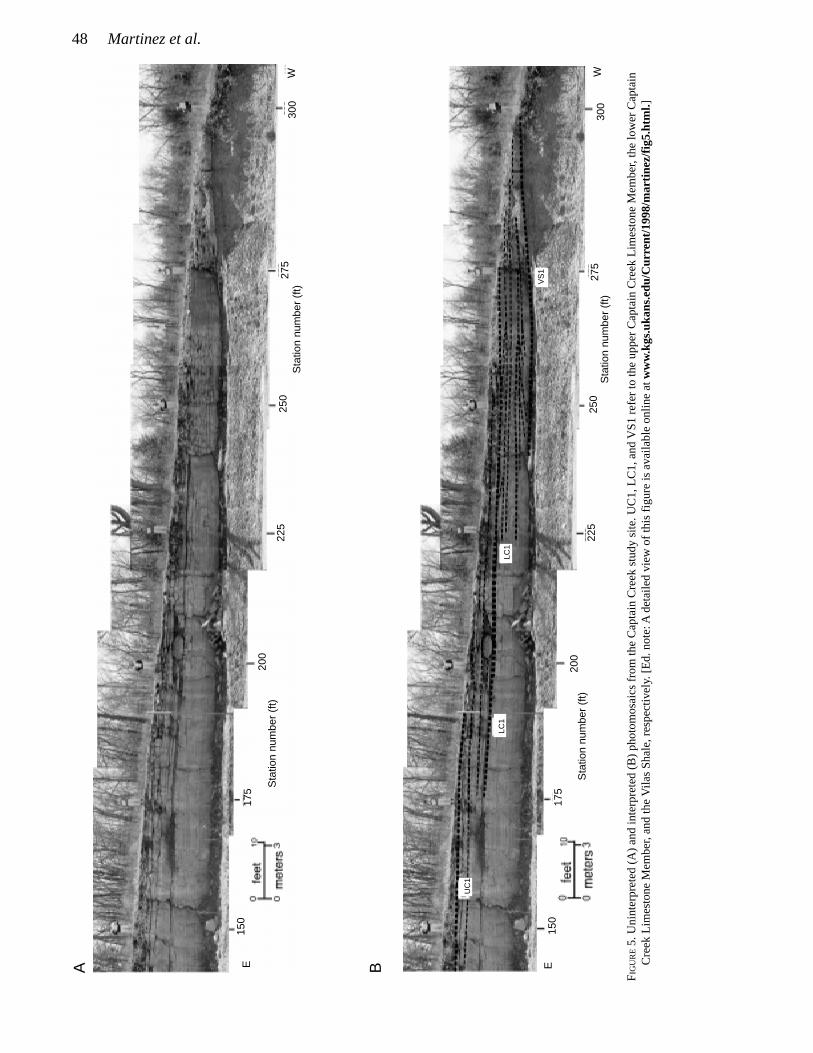
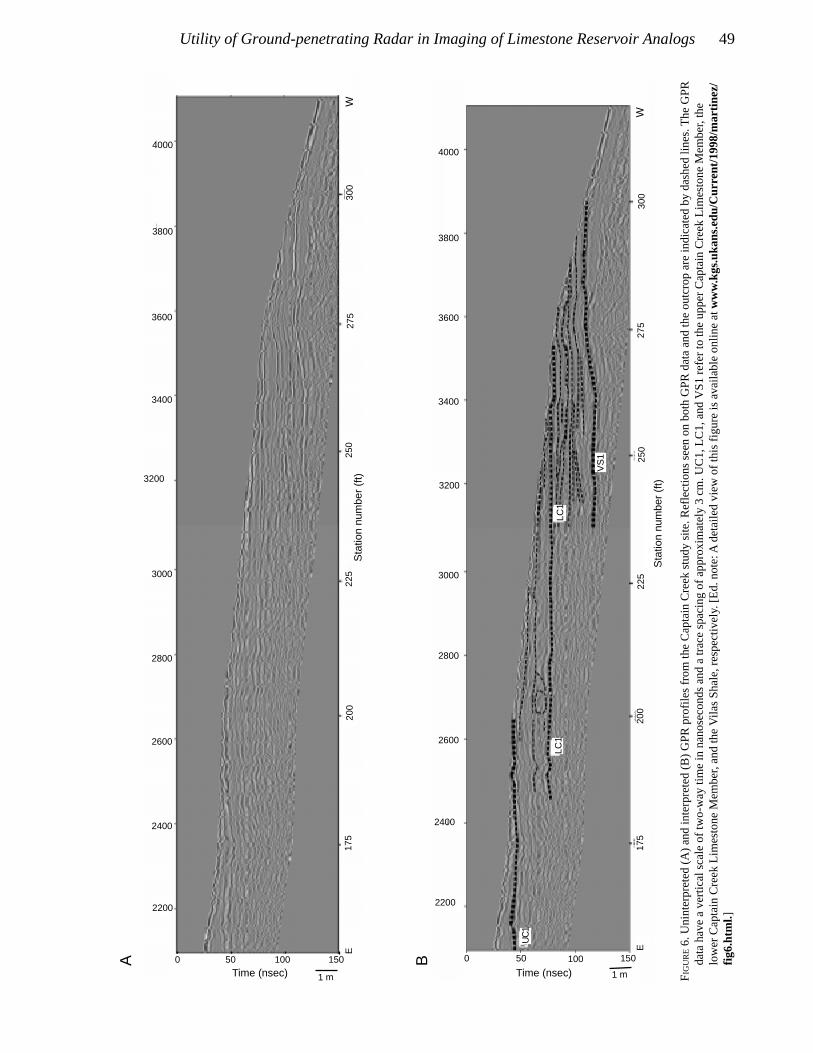
Relatively high amplitude reflections, which correlatedwith major outcrop stratigraphic divisions, are indicated byheavy dashed lines on figs. 5 and 6. The correlations wereperformed by comparing the outcrop photomosaics (andthe outcrops themselves) with the GPR reflections. Themajor stratigraphic divisions were interpreted as the top ofthe upper Captain Creek submember (UC1), the top of thelower Captain Creek submember (LC1), and the top of theVilas Shale (VS1). Reflections correlated with outcropfeatures between major unit divisions are identified by thindashed lines.
Upper Captain Creek Limestone Submember (UC1).—The top of the upper Captain Creek submember (UC1) wasindicated by a prominent reflection between stations 155and 200 (fig. 6). Material above this reflector is primarilysoil, which may have been created from the overlyingEudora Shale. On the outcrop the limestone layer does notsag (it is relatively horizontal), but on the GPR data therewas a definite increase in the travel-time to the interpretedreflections from the limestone events. This is evidence thatthe observed velocity pull-downs were caused by thicken-ing soil. Additionally, only when fractures were soil filleddid they cause a velocity pull-down.
Soil-filled fractures near the top of the limestone causedweak diffractions and the interruption of continuity in thereflection near stations 185 and 190. Other evidence of
fracturing included a velocity pull-down of reflections atstation 190 and dipping events in the lower half of thesubmember between stations 195 and 210 adjacent to anisolated block between stations 200 and 205 (fig. 6). Thismay also be the cause of a prominent diffraction near thesurface in the upper Captain Creek Limestone Memberbetween stations 210 and 215. Several horizontal to low-angle dipping limestone layers in the upper Captain Creeksubmember are clearly visible and laterally traceable untilthey intersect the modern erosional surface betweenstations 190 and 250 (fig. 6).
Lower Captain Creek Limestone (LC1).—The contactbetween the lower and upper Captain Creek submembers(LC1), a 0.25-m (0.82-ft)-thick sandy shale, is visiblebetween stations 180 and 275 (figs. 5 and 6). Internalbedding geometries within the lower Captain Creek werealso imaged by GPR (fig. 6). Local convergent anddivergent bedding geometries, and some truncations ofbeds likely associated with crossbedding at the base of theupper Captain Creek, were imaged between stations 240and 285. Crossbed foresets were imaged by GPR in thelower half of the lower Captain Creek between stations240 and 255. These crossbeds appeared to terminateagainst a relatively flat-lying bed above (fig. 6). Bedthinning is apparent on the outcrop west of station 270 andwas visible on the GPR data as a decrease in time betweenreflections or a termination of reflections.
Vilas Shale (VS1).—The contact of the Captain Creekand Vilas Shale (VS1) was visible on the GPR databetween stations 235 and 300 (figs. 5 and 6). The strengthof this reflection was probably due to the large dielectric-constant contrast between limestone and shale. Thiscontact was not imaged by GPR east of station 240because of signal attenuation caused by increasing soilthickness on the top of the outcrop. Truncation of somebeds within the Vilas Shale that are visible on the outcropwas not clearly imaged by GPR, probably because of itsattenuating nature. As with the lower Captain CreekLimestone Member above it, the Vilas Shale appears to beslightly upwarped west of station 265 (fig. 5). However,the reflection associated with the top of the shale wassubject to the same velocity effects as the overlyinglimestone, which may add to some of the apparent warpingon the GPR data. Some evidence for true structuraldisruption of the shale came from a diffraction emanating
FIGURE 4. Map of the Captain Creek Limestone Member study site (see fig. 1 for location).
48 Martinez et al.
A B
FIG
UR
E 5.
Uni
nter
pret
ed (
A)
and
inte
rpre
ted
(B)
phot
omos
aics
from
the
Cap
tain
Cre
ek s
tudy
site
. UC
1, L
C1,
and
VS
1 re
fer
to th
e up
per
Cap
tain
Cre
ek L
imes
tone
Mem
ber,
the
low
er C
apta
inC
reek
Lim
esto
ne M
embe
r, a
nd th
e V
ilas
Sha
le, r
espe
ctiv
ely.
[Ed.
not
e: A
det
aile
d vi
ew o
f thi
s fig
ure
is a
vaila
ble
onlin
e at
w
ww
.kgs
.uka
ns.e
du/C
urre
nt/1
998/
mar
tinez
/fig5
.htm
l.]
E15
017
5
Sta
tion
num
ber
(ft)
200
225
250
Sta
tion
num
ber
(ft)
275
300
W
UC
1
LC1
LC1
LC1
VS
1
150
175
Sta
tion
num
ber
(ft)
Sta
tion
num
ber
(ft)
200
225
250
275
300
W
E
Utility of Ground-penetrating Radar in Imaging of Limestone Reservoir Analogs 49
A B
FIG
UR
E 6.
Uni
nter
pret
ed (
A)
and
inte
rpre
ted
(B)
GP
R p
rofil
es fr
om th
e C
apta
in C
reek
stu
dy s
ite. R
efle
ctio
ns s
een
on b
oth
GP
R d
ata
and
the
outc
rop
are
indi
cate
d by
das
hed
lines
. T
he G
PR
data
hav
e a
vert
ical
sca
le o
f tw
o-w
ay ti
me
in n
anos
econ
ds a
nd a
trac
e sp
acin
g of
app
roxi
mat
ely
3 cm
. UC
1, L
C1,
and
VS
1 re
fer
to th
e up
per
Cap
tain
Cre
ek L
imes
tone
Mem
ber,
the
low
er C
apta
in C
reek
Lim
esto
ne M
embe
r, a
nd th
e V
ilas
Sha
le, r
espe
ctiv
ely.
[Ed.
not
e: A
det
aile
d vi
ew o
f thi
s fig
ure
is a
vaila
ble
onl
ine
at w
ww
.kgs
.uka
ns.e
du/C
urre
nt/1
998/
mar
tinez
/fig
6.ht
ml.]
0 50 100 150
Time (nsec) Time (nsec)1500 50 100
E E
2200
2400
3200
Sta
tion
num
ber
(ft)
Sta
tion
num
ber
(ft)
W
W
300
275
250
225
200
175
175
200
225
250
275
300
UC
1
LC1
LC1
VS
1
1 m 1 m
2600
2800
3000
3200
3400
3600
4000
3800
2200
2400
2600
2800
3000
3400
3600
3800
4000
50 Martinez et al.
0
400
0
30 m
100 ft
0X
VIII
IX
Area of detail
Outcrop face
N
70
435
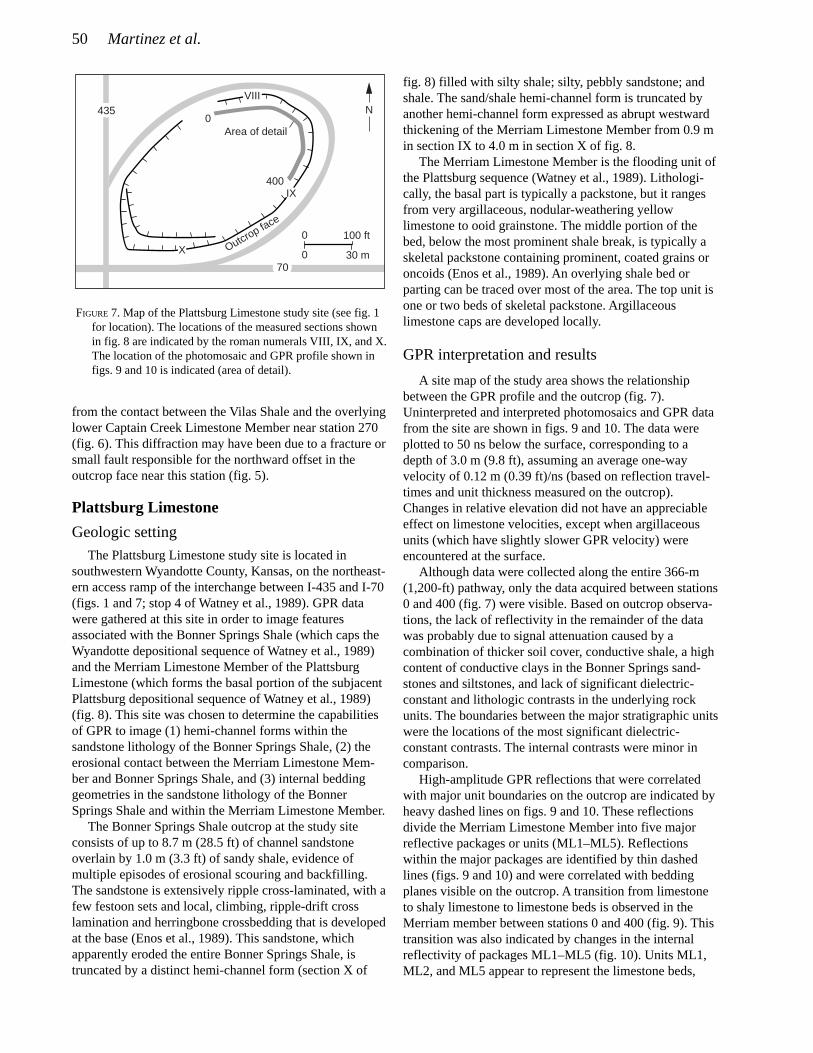
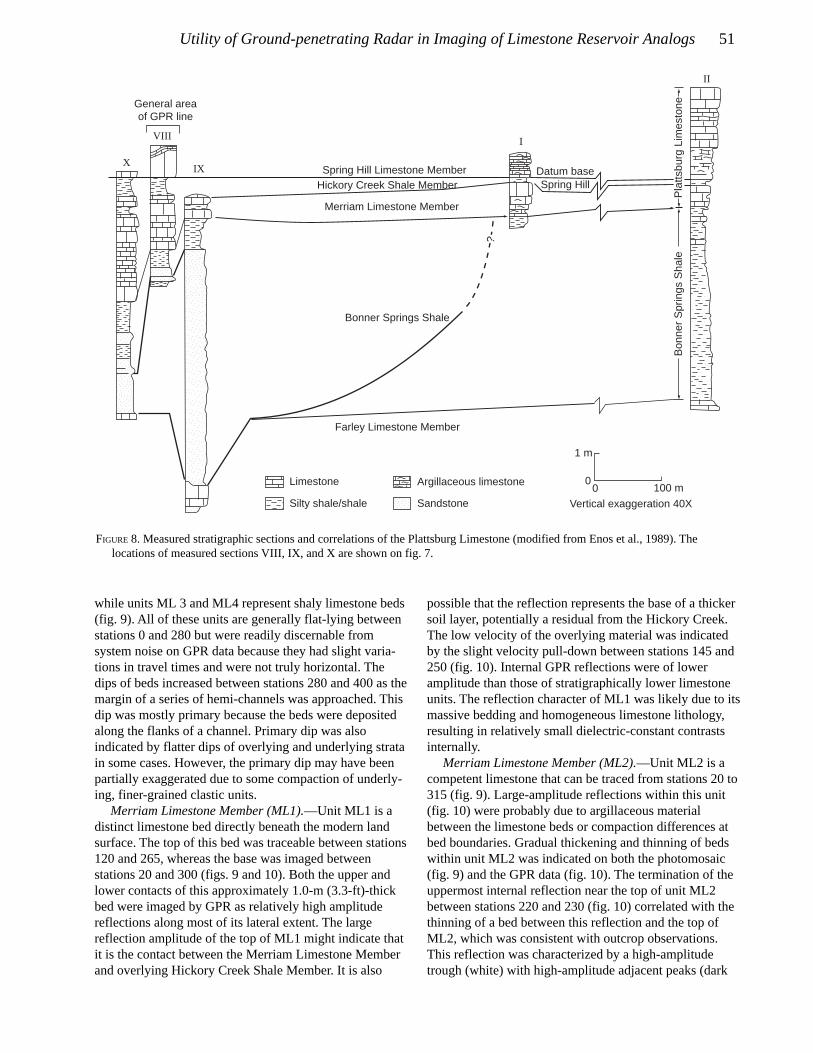
FIGURE 7. Map of the Plattsburg Limestone study site (see fig. 1for location). The locations of the measured sections shownin fig. 8 are indicated by the roman numerals VIII, IX, and X.The location of the photomosaic and GPR profile shown infigs. 9 and 10 is indicated (area of detail).
from the contact between the Vilas Shale and the overlyinglower Captain Creek Limestone Member near station 270(fig. 6). This diffraction may have been due to a fracture orsmall fault responsible for the northward offset in theoutcrop face near this station (fig. 5).
Plattsburg Limestone
Geologic setting
The Plattsburg Limestone study site is located insouthwestern Wyandotte County, Kansas, on the northeast-ern access ramp of the interchange between I-435 and I-70(figs. 1 and 7; stop 4 of Watney et al., 1989). GPR datawere gathered at this site in order to image featuresassociated with the Bonner Springs Shale (which caps theWyandotte depositional sequence of Watney et al., 1989)and the Merriam Limestone Member of the PlattsburgLimestone (which forms the basal portion of the subjacentPlattsburg depositional sequence of Watney et al., 1989)(fig. 8). This site was chosen to determine the capabilitiesof GPR to image (1) hemi-channel forms within thesandstone lithology of the Bonner Springs Shale, (2) theerosional contact between the Merriam Limestone Mem-ber and Bonner Springs Shale, and (3) internal beddinggeometries in the sandstone lithology of the BonnerSprings Shale and within the Merriam Limestone Member.
The Bonner Springs Shale outcrop at the study siteconsists of up to 8.7 m (28.5 ft) of channel sandstoneoverlain by 1.0 m (3.3 ft) of sandy shale, evidence ofmultiple episodes of erosional scouring and backfilling.The sandstone is extensively ripple cross-laminated, with afew festoon sets and local, climbing, ripple-drift crosslamination and herringbone crossbedding that is developedat the base (Enos et al., 1989). This sandstone, whichapparently eroded the entire Bonner Springs Shale, istruncated by a distinct hemi-channel form (section X of
fig. 8) filled with silty shale; silty, pebbly sandstone; andshale. The sand/shale hemi-channel form is truncated byanother hemi-channel form expressed as abrupt westwardthickening of the Merriam Limestone Member from 0.9 min section IX to 4.0 m in section X of fig. 8.
The Merriam Limestone Member is the flooding unit ofthe Plattsburg sequence (Watney et al., 1989). Lithologi-cally, the basal part is typically a packstone, but it rangesfrom very argillaceous, nodular-weathering yellowlimestone to ooid grainstone. The middle portion of thebed, below the most prominent shale break, is typically askeletal packstone containing prominent, coated grains oroncoids (Enos et al., 1989). An overlying shale bed orparting can be traced over most of the area. The top unit isone or two beds of skeletal packstone. Argillaceouslimestone caps are developed locally.
GPR interpretation and results
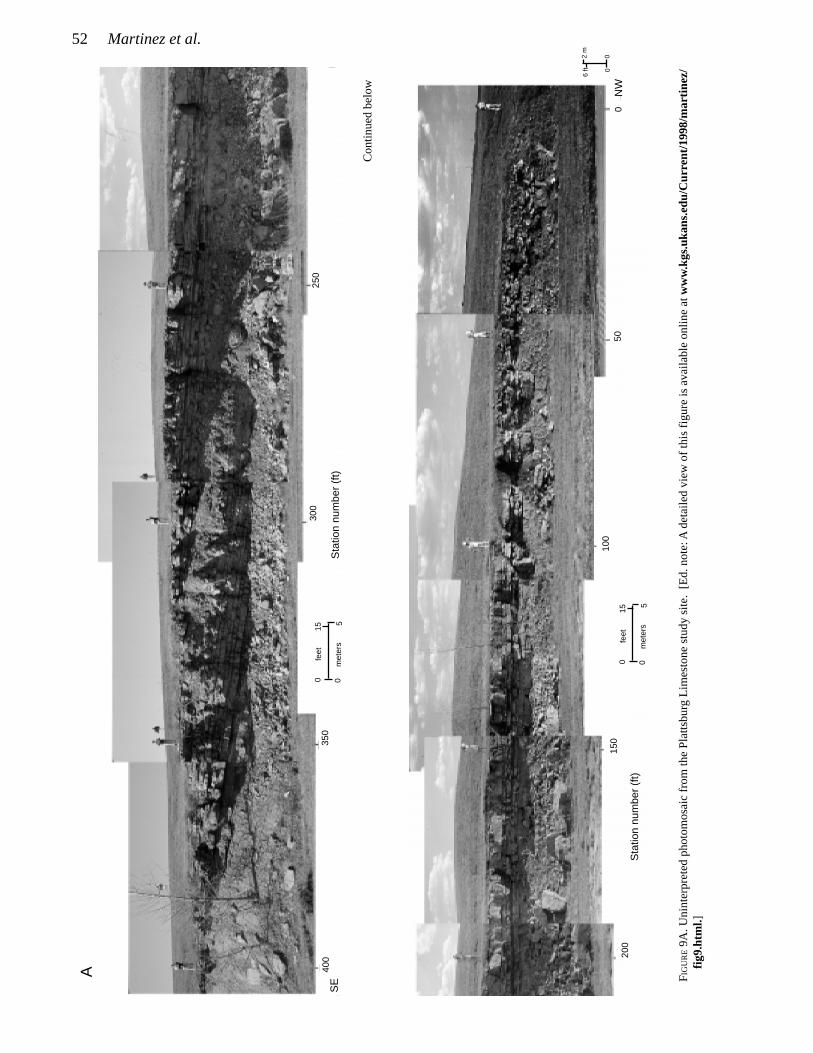
A site map of the study area shows the relationshipbetween the GPR profile and the outcrop (fig. 7).Uninterpreted and interpreted photomosaics and GPR datafrom the site are shown in figs. 9 and 10. The data wereplotted to 50 ns below the surface, corresponding to adepth of 3.0 m (9.8 ft), assuming an average one-wayvelocity of 0.12 m (0.39 ft)/ns (based on reflection travel-times and unit thickness measured on the outcrop).Changes in relative elevation did not have an appreciableeffect on limestone velocities, except when argillaceousunits (which have slightly slower GPR velocity) wereencountered at the surface.
Although data were collected along the entire 366-m(1,200-ft) pathway, only the data acquired between stations0 and 400 (fig. 7) were visible. Based on outcrop observa-tions, the lack of reflectivity in the remainder of the datawas probably due to signal attenuation caused by acombination of thicker soil cover, conductive shale, a highcontent of conductive clays in the Bonner Springs sand-stones and siltstones, and lack of significant dielectric-constant and lithologic contrasts in the underlying rockunits. The boundaries between the major stratigraphic unitswere the locations of the most significant dielectric-constant contrasts. The internal contrasts were minor incomparison.
High-amplitude GPR reflections that were correlatedwith major unit boundaries on the outcrop are indicated byheavy dashed lines on figs. 9 and 10. These reflectionsdivide the Merriam Limestone Member into five majorreflective packages or units (ML1–ML5). Reflectionswithin the major packages are identified by thin dashedlines (figs. 9 and 10) and were correlated with beddingplanes visible on the outcrop. A transition from limestoneto shaly limestone to limestone beds is observed in theMerriam member between stations 0 and 400 (fig. 9). Thistransition was also indicated by changes in the internalreflectivity of packages ML1–ML5 (fig. 10). Units ML1,ML2, and ML5 appear to represent the limestone beds,
Utility of Ground-penetrating Radar in Imaging of Limestone Reservoir Analogs 51
00
1 m
Vertical exaggeration 40X
100 m
Spring Hill Limestone Member Datum base
General areaof GPR line
Spring Hill
Limestone
Hickory Creek Shale Member
Merriam Limestone Member
Bonner Springs Shale
Bon
ner
Spr
ings
Sha
leP
latts
burg
Lim
esto
ne
Farley Limestone Member
XIX
I
II
VIII
Argillaceous limestone
Silty shale/shale Sandstone?
FIGURE 8. Measured stratigraphic sections and correlations of the Plattsburg Limestone (modified from Enos et al., 1989). Thelocations of measured sections VIII, IX, and X are shown on fig. 7.
while units ML 3 and ML4 represent shaly limestone beds(fig. 9). All of these units are generally flat-lying betweenstations 0 and 280 but were readily discernable fromsystem noise on GPR data because they had slight varia-tions in travel times and were not truly horizontal. Thedips of beds increased between stations 280 and 400 as themargin of a series of hemi-channels was approached. Thisdip was mostly primary because the beds were depositedalong the flanks of a channel. Primary dip was alsoindicated by flatter dips of overlying and underlying stratain some cases. However, the primary dip may have beenpartially exaggerated due to some compaction of underly-ing, finer-grained clastic units.
Merriam Limestone Member (ML1).—Unit ML1 is adistinct limestone bed directly beneath the modern landsurface. The top of this bed was traceable between stations120 and 265, whereas the base was imaged betweenstations 20 and 300 (figs. 9 and 10). Both the upper andlower contacts of this approximately 1.0-m (3.3-ft)-thickbed were imaged by GPR as relatively high amplitudereflections along most of its lateral extent. The largereflection amplitude of the top of ML1 might indicate thatit is the contact between the Merriam Limestone Memberand overlying Hickory Creek Shale Member. It is also
possible that the reflection represents the base of a thickersoil layer, potentially a residual from the Hickory Creek.The low velocity of the overlying material was indicatedby the slight velocity pull-down between stations 145 and250 (fig. 10). Internal GPR reflections were of loweramplitude than those of stratigraphically lower limestoneunits. The reflection character of ML1 was likely due to itsmassive bedding and homogeneous limestone lithology,resulting in relatively small dielectric-constant contrastsinternally.
Merriam Limestone Member (ML2).—Unit ML2 is acompetent limestone that can be traced from stations 20 to315 (fig. 9). Large-amplitude reflections within this unit(fig. 10) were probably due to argillaceous materialbetween the limestone beds or compaction differences atbed boundaries. Gradual thickening and thinning of bedswithin unit ML2 was indicated on both the photomosaic(fig. 9) and the GPR data (fig. 10). The termination of theuppermost internal reflection near the top of unit ML2between stations 220 and 230 (fig. 10) correlated with thethinning of a bed between this reflection and the top ofML2, which was consistent with outcrop observations.This reflection was characterized by a high-amplitudetrough (white) with high-amplitude adjacent peaks (dark
52 Martinez et al.
A
Con
tinue
d be
low
FIG
UR
E 9
A. U
nint
erpr
eted
pho
tom
osai
c fr
om th
e P
latts
burg
Lim
esto
ne s
tudy
site
. [E
d. n
ote:
A d
etai
led
view
of t
his
figur
e is
ava
ilabl
e on
line
at ww
w.k
gs.u
kans
.edu
/Cur
rent
/199
8/m
artin
ez/
fig9.
htm
l.]
400
SE
350
Sta
tion
num
ber
(ft)
Sta
tion
num
ber
(ft)
300
100
250
6 ft
2 m
00
150
200
050
NW
5
15
00fe
et
met
ers5
15
00fe
et
met
ers
Utility of Ground-penetrating Radar in Imaging of Limestone Reservoir Analogs 53
B
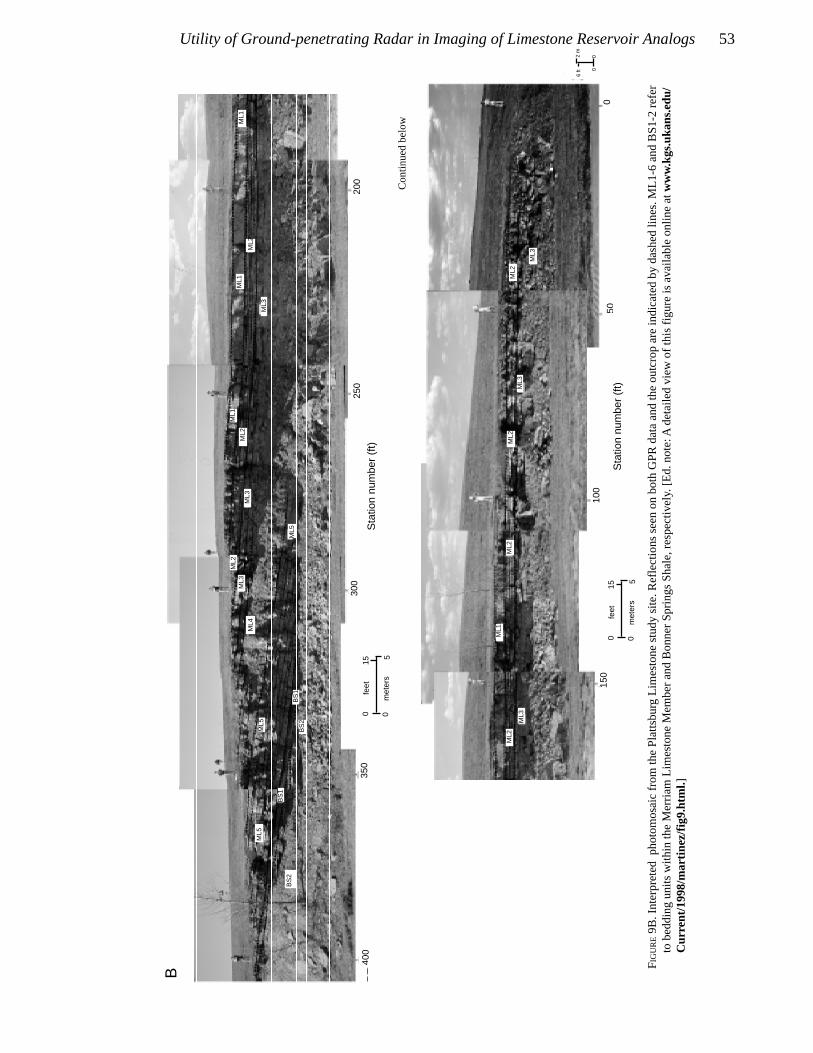
FIG
UR
E 9
B. I
nter
pret
ed p
hoto
mos
aic
from
the
Pla
ttsbu
rg L
imes
tone
stu
dy s
ite. R
efle
ctio
ns s
een
on b
oth
GP
R d
ata
and
the
outc
rop
are
ind
icat
ed b
y da
shed
line
s. M
L1-6
and
BS
1-2
refe
rto
bed
ding
uni
ts w
ithin
the
Mer
riam
Lim
esto
ne M
embe
r an
d B
onne
r S
prin
gs S
hale
, res
pect
ivel
y. [E
d. n
ote:
A d
etai
led
view
of t
his
figu
re is
ava
ilabl
e on
line
at
ww
w.k
gs.u
kans
.edu
/C
urre
nt/1
998/
mar
tinez
/fig9
.htm
l.]
Con
tinue
d be
low
200
250
300
350
400
BS
2
ML5
BS
1
BS
1
ML1
ML2
ML1
BS
2
ML5
ML3
ML1
ML2
ML3
ML5
ML2
ML3
ML4
050
5
15
00fe
et
met
ers
5
15
00fe
et
met
ers
150
100
Sta
tion
num
ber
(ft)
Sta
tion
num
ber
(ft)
ML3
ML2
ML3
ML2
ML2
ML1
ML3
ML2
00
6 ft
2 m
54 Martinez et al.
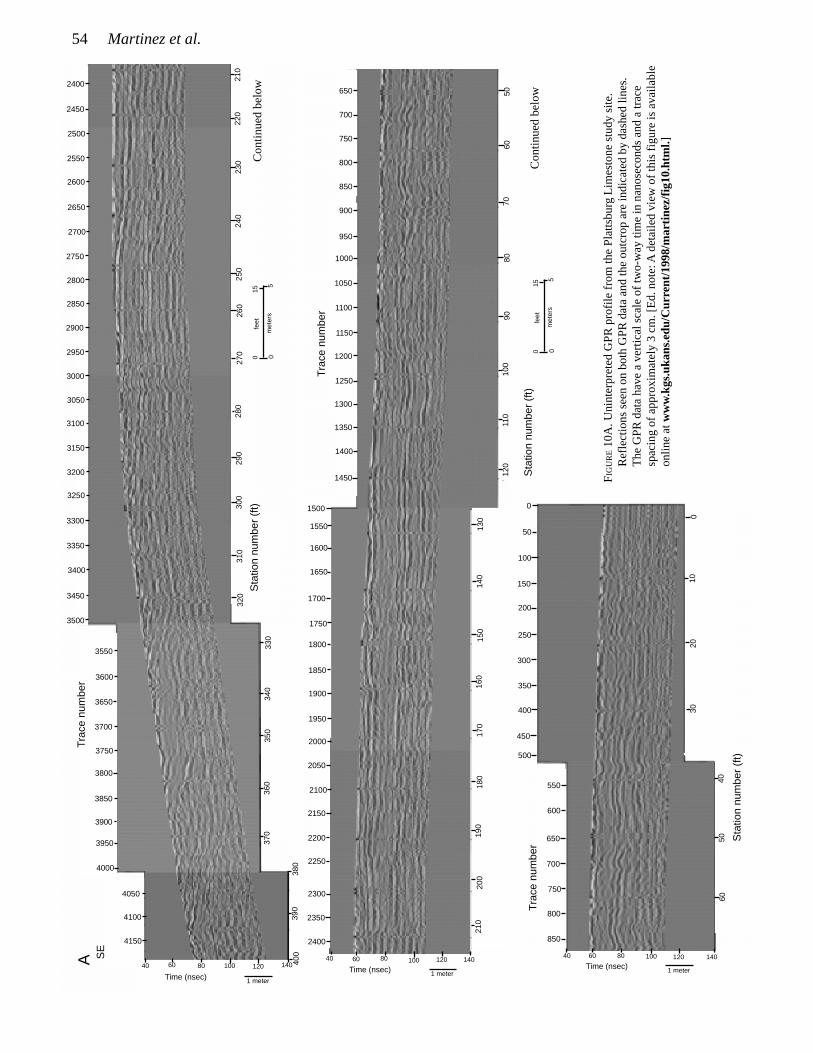
FIG
UR
E 1
0A. U
nint
erpr
eted
GP
R p
rofil
e fr
om th
e P
latts
burg
Lim
esto
ne s
tudy
site
.R
efle
ctio
ns s
een
on b
oth
GP
R d
ata
and
the
outc
rop
are
indi
cate
d by
das
hed
lines
.T
he G
PR
dat
a ha
ve a
ver
tical
sca
le o
f tw
o-w
ay ti
me
in n
anos
econ
ds a
nd a
trac
esp
acin
g of
app
roxi
mat
ely
3 cm
. [E
d. n
ote:
A d
etai
led
view
of t
his
figur
e is
ava
ilabl
eon
line
at w
ww
.kgs
.uka
ns.e
du/C
urre
nt/1
998/
mar
tinez
/fig1
0.ht
ml.]
A
4150
4100
4050
4000
3950
3900
3850
3800
3750
3700
3650
3600
3550
3500
3450
3400
3350
3300
3250
3200
3150
3100
3050
3000
2950
2900
2850
2800
2750
2700
2650
2600
2550
2500
2450
2400
SE
Tra
ce n
umbe
r
400
390
380
370
360
350
340
330
320
310
300
290
280
270
260
250
240
230
220
2350
2300
2250
2200
2150
2100
2050
2000
1950
1900
1850
1800
1750
1700
1650
1600
1550
1500
1450
210
2400
200
190
180
170
160
150
140
130
1400
1350
1300
1250
1200
1150
1100
1050
1000
950
900
850
800
750
700
650
120
110
100
9080
7060
500
10
50
100
150
200
2030
250
300
350
400
450
500
550
600
650
700
4050
60
750
800
850
Tra
ce n
umbe
r
Tra
ce n
umbe
r
Sta
tion
num
ber
(ft)
Sta
tion
num
ber
(ft)
Sta
tion
num
ber
(ft)
Con
tinue
d be
low
Con
tinue
d be
low
0
21039
0
5
15
00fe
et
met
ers
5
15
00fe
et
met
ers
40 60 80 100 120 140
Time (nsec) 1 meter
40 60 80 100 120 140
Time (nsec) 1 meter
40 60 80 100 120 140
Time (nsec) 1 meter
Utility of Ground-penetrating Radar in Imaging of Limestone Reservoir Analogs 55
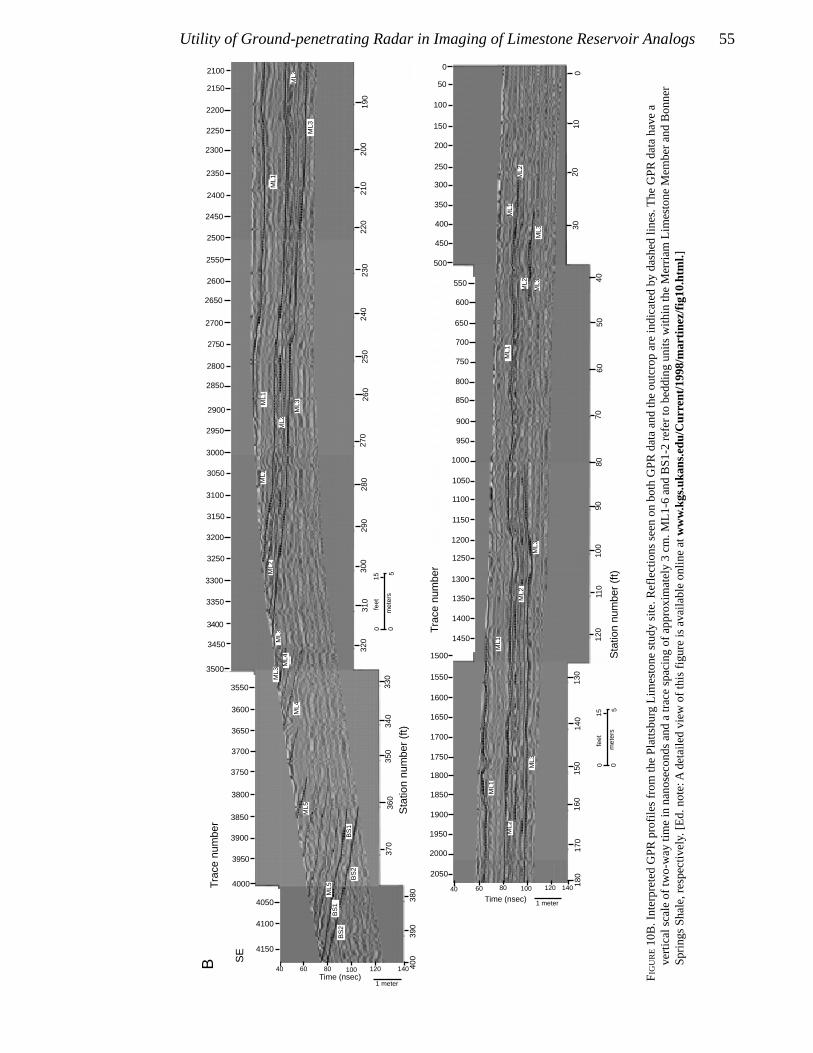
FIG
UR
E 10
B. I
nter
pret
ed G
PR
pro
files
from
the
Pla
ttsbu
rg L
imes
tone
stu
dy s
ite. R
efle
ctio
ns s
een
on b
oth
GP
R d
ata
and
the
outc
rop
are
indi
cate
d by
das
hed
lines
. The
GP
R d
ata
have
ave
rtic
al s
cale
of t
wo-
way
tim
e in
nan
osec
onds
and
a tr
ace
spac
ing
of a
ppro
xim
atel
y 3
cm. M
L1-6
and
BS
1-2
refe
r to
bed
ding
uni
ts w
ithin
the
Mer
riam
Lim
esto
ne M
embe
r an
d B
onne
rS
prin
gs S
hale
, res
pect
ivel
y. [E
d. n
ote:
A d
etai
led
view
of t
his
figur
e is
ava
ilabl
e on
line
at
ww
w.k
gs.u
kans
.edu
/Cur
rent
/199
8/m
artin
ez/fi
g10.
htm
l.]
B SE
BS
2B
S1
ML5
BS
2
Time (nsec)
Time (nsec)
BS
1
ML5
ML4
ML4
ML3
ML2
ML3
ML1
ML1
ML2
ML3
ML1
ML2
ML3
ML1
ML2
ML1
ML3
ML2
ML3
ML1
ML2
ML3
ML1
ML2
ML3
1 meter
60 80 100 120 140 400
390
380
4150
4100
4050
4000
3950
3900
3850
3800
3750
3700
3650
3600
3550
3500
3450
3400
3350
3300
3250
3200
3150
3100
3050
3000
2950
2900
2850
2800
2750
2700
2650
2600
2550
2500
2450
2400
2350
2300
2250
2200
2150
2100
370
360
340
350
330
320
310
300
290
280
270
260
250
240
230
220
210
200
190
50
100
150
200
250
300
350
400
450
500
0
1020
30
1401201008040 60
40
0
4050
60
550
600
650
700
750
800
850
7080
9010
011
0
950
900
1000
1050
1150
1200
1100
120
1250
1300
1350
1400
1450
130
140
150
160
170
1500
1550
1600
1650
1700
1750
1800
1850
1900
1950
2000
2050
180
feet
met
ers
0015
5
feet
met
ers
0015
5
Sta
tion
num
ber
(ft)
Sta
tion
num
ber
(ft)
Tra
ce n
umbe
r
Tra
ce n
umbe
r
1 meter
56 Martinez et al.
gray) along most of its length between stations 20 and 170.The relative strength of this reflection was graduallyreduced between stations 170 and 190 due to a lesseningof dielectric-constant contrasts. Beyond station 190 thereflection varied between a single event and a doublet as itinterfered with the reflection associated with the top ofML2. This reflection ended between stations 220 and 230,as the bed became too thin to image with the 500-MHzGPR antenna.
Merriam Limestone Member (ML3).—The argillaceouslimestone at the top of unit ML3 was well imaged betweenstations 30 and 315 (fig. 10), probably because of the largedielectric-constant contrast between it and the overlyinglowermost limestone bed in unit ML2. The recessiveweathering pattern of this unit suggests that it is predomi-nantly a thin-bedded, shaly limestone that becomes moreargillaceous downward (fig. 9). The high clay content ofthis unit may have caused the relatively low internalreflectivity and greater signal attenuation.
Merriam Limestone Member (ML4).—Unit ML4 is ashaly limestone that is more argillaceous and thinnerbedded than unit ML3. Reflections from this unit wereimaged only near the surface between stations 320 and360. As in unit ML3, reflections from within unit ML4were relatively weak, possibly due to high clay content atbounding surfaces and within the limestone unit, lack ofsignificant internal dielectric-constant contrasts, and thinbedding. Diffractions from within unit ML4 occurred nearthe surface near station 340 (fig. 10). They may have beendue to open fractures seen on the outcrop near the surface,the edges of collapse features, or modern weathering ofthis relatively easily erodable unit. The diffractions werenot likely to have been caused by cobbles or out-of-planereflections because of the GPR-profile distance from theoutcrop face.
Merriam Limestone Member (ML5).—Unit ML5 isprimarily a thin-to-medium-bedded limestone similar tounit ML2. It is relatively resistant and is visible in outcropbetween stations 270 and 400 (fig. 9). This unit wasimaged by GPR between stations 355 and 400 (fig. 10).The top of unit ML5 was a relatively strong reflection thatwas reduced in strength downdip due to signal attenuationcaused by unit ML4. Internal reflections within unit ML5were also attenuated by unit ML4. As with unit ML2, thehigh-amplitude reflectivity at bed boundaries was probablydue to changes in clay content or compaction. Diffractionsoccurred along many of the bed boundaries in unit ML5and were most apparent close to the surface at the top ofthe outcrop. As with the diffractions in unit ML2, theywere probably caused by open or soil-filled joints andother fractures seen on the outcrop; they could possiblyhave been caused by the edges of modern collapse featuresseen in exposures at some locations. The base of this unitis an erosional contact between the Merriam LimestoneMember and underlying Bonner Springs Shale. Theinterpretation of a hemi-channel form for the contact was
supported by the westward thickening of the Merriammember visible on the outcrop (fig. 9), the GPR data (fig.10), and measured stratigraphic sections (Enos et al., 1989)(fig. 8).
Bonner Springs Shale (BS1).—GPR successfullyimaged the erosional contact (hemi-channel form) betweenthe Bonner Springs silty shale lithology (BS1) and theoverlying Merriam Limestone Member (ML5). Thecontact was visible on both the outcrop and GPR profilebetween stations 360 and 400, where measured section IXis located (fig. 8). The contact is expressed on the outcropby low-angle truncation of dipping shale, silty shale, siltylimestone, and siltstone layers in the Bonner Springs Shale(BS1) by the overlying Merriam Limestone Member(ML5). The Bonner Springs correlates with the distinctsiltstone and shale-filled hemi-channel form below theMerriam member and above channel-filling sandstonesand siltstones (measured sections VIII, IX, and X in fig. 8).This hemi-channel form was also supported by a verygradual thickening of unit BS1 downdip (fig. 9). Thecontact between the Bonner Springs Shale and MerriamLimestone Member is a relatively high amplitude reflec-tion, but no more reflective than those between limestonebeds in the overlying ML5 unit (fig. 10). Although theerosional truncation of beds is apparent on the outcrop,study of interference patterns did not show the terminationof unit BS1 against the Merriam Limestone Member,probably because it was at too low an angle to image withthe 500-MHz GPR antenna.
Bonner Springs Shale (BS2).—The top of unit BS2 isan erosional contact with a hemi-channel form that cutsacross flatter-lying beds below (fig. 9). This unit correlateswith the lower channel-filling sandstone and siltstone inmeasured sections VIII, IX, and X (fig. 8), which occurbelow the siltstone- and shale-filled hemi-channel form.The upper contact is obvious on the outcrop, but it wasmuch less so on the GPR data. The relatively horizontalbeds of siltstone, shaly siltstone, sandy siltstone, andsandstone are visible on the outcrop, but they were notimaged by GPR. The poor reflectivity along the top andwithin unit BS2 was probably due to signal attenuationcaused by the siltstones in unit BS2, the silty to shalylayers in unit BS1, or a lack of significant dielectric-constant contrasts within the siltstones of BS2. The eventsseen at 80–100 ns between stations 390 and 400 were notrelated to beds within unit BS2, but instead were noise thatappeared parallel to the ground surface.
Discussion
High-frequency GPR can be an invaluable tool forenhancing outcrop studies because, with sufficient control,it allows detailed stratigraphic and lithologic informationto be extended into the subsurface beyond the outcrop facein a relatively continuous manner. Detailed lateral andvertical stratigraphic and lithologic information is critical

Utility of Ground-penetrating Radar in Imaging of Limestone Reservoir Analogs 57
to understanding the complex heterogeneity of reservoirsand can aid in determining production strategies. As ourstudy shows, the shapes of bounding surfaces and channelfills can be imaged in the near surface via high-frequencyGPR methods. In addition, our study indicates that verticalimaging resolutions of high-frequency GPR data aresufficient to image many small-scale details associatedwith these features, such as crossbedding and fractures.Imaging of channel fills and crossbedding can sometimesbe used to determine stratal geometries in three dimen-sions, which can aid in determining paleoflow directions,which are important for establishing three-dimensionalgeometries of reservoir flow units (Beaty et al., 1997).GPR can be used to image subsurface features and extendoutcrop correlations into areas of poor or nonexistentexposure, as long as there is a difference in dielectricconstants between subsurface media and there is sufficientcontrol on lithology and geometries from nearby outcropsor cores. The variability in GPR-amplitude responses isrelated to changes in the media through which the GPRsignal passes, and therefore can sometimes be an indica-tion of lithologic changes. Fine-grained material, such asclay and silt, can contain more bonded water moleculesthan coarser-grained material, thus increasing theirdielectric constant if wet. Bounding surfaces betweenlithologic units may provide the largest dielectric-constantcontrasts if they contain finer-grained siliciclastic material.In our study, bounding surfaces were enriched with fine-grained siliciclastics from both depositional and diageneticprocesses. In contrast, internal dielectric contrasts withinlimestone units in our study usually are of lesser magni-tude than those of major bounding surfaces because theyusually contain thinner, less continuous siliciclastic layers.The massive-bedded and argillaceous units of thePlattsburg Limestone study site illustrate the utility ofidentifying reflection character and correlating it withsubsurface lithology. At this site, the massive-bedded unitshave almost no internal reflections, whereas the argilla-ceous units have strong reflections from their upperbounding surfaces and cause significant signal attenuation.
This study was also successful in imaging joints andfractures at both study sites. The characteristics, diffrac-tions, and offsets (sometimes accompanied by slightvelocity pull-downs, when soil-filled) of these joints andfractures were confirmed using the data from the outcropface. Therefore, by identifying reflection characteristicsand correlating them to lithology and bedding features atthe outcrop, general lithological and sedimentary structuralinformation can be extended into the subsurface beyondthe outcrop face. As noted by Knight et al. (1997),knowledge gained from GPR data of the shapes, spatialdistribution, and frequency of these features (which maygreatly affect reservoir quality) can help create morerealistic reservoir models. As shown in the study byMartinez et al. (1998a), small-scale (less than 0.01 m; 0.03ft) lithologic heterogeneity that affects permeability can be
imaged using GPR methods. The results of that study,combined with those of the present study, indicate thatlaminae, beds, minor and major bounding surfaces, andfractures (all of which may affect fluid-flow characteristicswithin reservoir strata) can be imaged using GPR andthereby provide additional data for reservoir modelingefforts.
Previous outcrop studies involving GPR have usuallyused lower-frequency antennas and therefore have muchlower vertical imaging resolutions (Pratt and Miall, 1993;Liner and Liner, 1995; Beres et al., 1995). Such resolutionmay be adequate for imaging relatively large-scale features(major bounding surfaces and faults), but it is not suffi-cient for imaging the detailed features (thin internalbedding and crossbedding) that were the concern of thisstudy. It is also difficult to determine subtle lithologicalchanges from lower-frequency data because the changesmay occur at scales much smaller than the antennawavelength.
Our study also differs from most previous studies in itsdetailed correlation of photomosaics of the outcrop facewith reflection information. Detailed correlation of GPRdata with the outcrop face is critical for understanding thecause of GPR reflections at a study site and recognizingsubtle reflection characteristics of the data that allowinterpretations to include small-scale lateral and verticalsubsurface lithologic and stratigraphic variability.
The successful high-resolution imaging of majorbounding surfaces, fractures, and joints indicates that high-frequency GPR may be a useful technique for mappingfeatures associated with sequence-stratigraphic boundaries,including those evidencing paleokarst and paleosoldevelopment from subaerial exposure. Many importantreservoirs, including those in the subsurface of Kansas, areassociated with major sequence boundaries showingextensive subaerial exposure and karst features. GPRstudies of analogs may provide an additional tool forquantifying the dimensions and spacing of fractures, caves,and joints associated with such sequence boundaries.Additionally, GPR may also aid in regional correlations ofsequence boundaries. Using GPR for three-dimensionalmapping of surfaces associated with sequence-strati-graphic boundaries can assist in placing outcrop informa-tion within a sequence-stratigraphic framework and helpunderstand basin-scale depositional history, as well asprovide important data for reservoir modeling.
Clearly, as shown by the various limiting factors at ourstudy sites, high-frequency GPR is not a panacea for alloutcrop studies. Not only is it limited to areas of lowsurface conductivity (e.g., those lacking clays or shales), itis also very limited in imaging depth because of rapidsignal attenuation. For example, the 500-MHz GPRmaximum-imaging depths in the limestone units of thisstudy were approximately 3–4 m (9.8–13.1 ft). Thepenetration-depth limitations can be reduced by using asuite of antenna frequencies to image the subsurface at
58 Martinez et al.
different penetration depths and resolutions (Martinez etal., 1998b). Depth control of GPR data can also be aproblem without adequate outcrop or borehole informationto constrain possible GPR velocity values, even whenusing CDP gathers to determine velocity information.Having a detailed outcrop photomosaic to interpretalongside a GPR profile is critical if highly accurate,depth-constrained interpretations are necessary.
Conclusions
Two petroleum-reservoir-analog outcrops of limestoneunits of interest were studied using high-frequency GPRmethods to image stratigraphic architecture behind theoutcrop face. GPR successfully imaged major boundingsurfaces and features such as crossbedding and internalbedding within units in the subsurface to a maximumdepth of 3–4 m (9.8–13.1 ft). Careful interpretation of theGPR data and correlation with outcrop informationallowed general relationships between reflection character-istics and lithology to be determined. Strong reflectionswere found to correspond with major bounding surfaces,which consisted of either a decrease in grain size orchange in lithology (often enriched with clay or siltstone),both of which resulted in a change in the electromagneticproperties of the rock at these locations.
At the Captain Creek study site, the contact between theCaptain Creek Limestone Member and the Vilas Shale andthe contact between the lower and upper units of theCaptain Creek were successfully imaged using GPRmethods. Additional internal features as small as 0.1–0.2 m(0.3–0.7 ft), such as soil-filled fractures and smaller-scalebedding units (including crossbedding within the lowerand upper Captain Creek), were also imaged. Thick, clay-rich soil in the central portion of the outcrop greatlyhampered GPR-signal penetration and limited the extent ofGPR profiles.
At the Plattsburg Limestone study site, the erosionalcontact between the Bonner Springs Shale and theMerriam Limestone Member was successfully imagedusing high-frequency GPR methods. Features as small as0.1–0.2 m (0.3–0.7 ft), including smaller-scale beddingunits and air- and soil-filled fractures within the MerriamLimestone Member, were also imaged. Identification ofthinly bedded (less than 0.2 m; 0.7 ft), argillaceousintervals of the Merriam Limestone Member was possiblebecause of the high resolution of 500-MHz GPR. How-ever, signal penetration was reduced in the more argilla-ceous units of the Merriam member due to higher claycontent. High-frequency GPR also had difficulty penetrat-ing and imaging features within the Bonner Springs Shalebecause of rapid signal attenuation caused by the highconductivity of this unit. Lower-frequency GPR methodsmay provide more satisfactory results if used at this site toimage features associated with the Bonner Springs Shale.
Overall, GPR was successful in imaging detailedstratigraphic architectural elements as small as 0.1–0.2 m
(0.3–0.7 ft) at each study site. Detailed correlation betweenGPR and outcrop data allows the use of pattern recognitionwhen away from outcrops or boreholes. With a nearbyoutcrop, the shapes and patterns of sedimentary featurescan be recognized and then extrapolated into the subsur-face with some confidence. Further GPR imaging of thesereservoir analogs could provide information about three-dimensional changes in stratigraphy and lithology that maybe useful in exploitation of valuable petroleum resources.
Acknowledgments
The authors wish to thank Neil Anderson, Mike Roark,and Mike Shoemaker of the University of Missouri–Rolla,for the use of UMR’s radar equipment and field assistancein this study. David Leck provided field assistance at thePlattsburg Limestone study site, and Rich Sleezer per-formed soil sample analyses for the Captain Creek studysite. Critical reviews by Rick Miller, Toni Simo, and RogerYoung greatly aided us in clarifying our ideas andstrengthening the paper, and editing by Liz Brosius helpedmake the paper more accessible. Lastly, Tim Carr of theKansas Geological Survey graciously provided funding forthis study.
References
Beaty, D. S., Martinez, A., and Walton, A. W., 1997, Combinedminipermeameter and ground-penetrating radar characteriza-tion of valley-fill sandstones, Upper Pennsylvanian, northeast-ern Kansas: Proceedings of the Gulf Coast Section of the1997 SEPM Annual Conference, p. 41–54.
Beres, M., Green, A., Huggenberger, P., and Horstmeyer, H.,1995, Mapping the architecture of glaciofluvial sedimentswith three-dimensional georadar: Geology, v. 23, no. 12, p.1,087–1,090.
Bridge, J. S., Alexander, J., Collier, R. E., Gawthorpe, R. L., andJarvis, J., 1995, Ground-penetrating radar and coring used tostudy the large-scale structure of point-bar deposits in threedimensions: Sedimentology, v. 42, p. 839–852.
Brown, H. A., 1963, Examination of Pennsylvanian carbonatebanks in southwestern Kansas: Kansas Geological Survey,Open-file Report 63-5, 9 p.
Cunningham, K. J., and Franseen, E. K., 1992, Conglomeraticlimestones of the Upper Pennsylvanian Captain CreekLimestone and their association with the lower sequenceboundary of the Stanton depositional sequence, NorthwesternJohnson County, Kansas: Kansas Geological Survey, Open-file Report 92-51, 47 p.
Daniels, D. J., 1996. Surface-penetrating radar; in, IEEE Radar,Sonar, Navigation and Avionics Series 6, E. D. R. Sharmanand P. Bradsell, eds.: Exeter, United Kingdom, Short RunPress Ltd., 300 p.
Davis, J. L., and Annan, A. P., 1989, Ground-penetrating radarfor high-resolution mapping of soil and rock stratigraphy:Geophysical Prospecting, v. 37, p. 531–551.
Dominic, D. F., Egan, K., Carney, C., Wolfe, P. J., and Boardman,M. R., 1995, Delineation of shallow stratigraphy usingground-penetrating radar: Journal of Applied Geophysics, v.33, p. 167–175.

Utility of Ground-penetrating Radar in Imaging of Limestone Reservoir Analogs 59
Enos, P., Herman, D., Watney, W. L., and Franseen, E., 1989,Stop 4 I-70/I-435 interchange—Bonner Springs Shale andPlattsburg Limestone; in, Sequence Stratigraphic Interpreta-tions and Modeling of Cyclothems in the Upper Pennsylva-nian (Missourian), Lansing and Kansas City Groups inEastern Kansas: Kansas Geological Society Guidebook, 41stAnnual Field Trip, October 14–15, 1989, Kansas GeologicalSurvey, Open-file Report 89-44, p. 115–126.
Feldman, H. R., and Franseen, E. K., 1991, Stratigraphy andDepositional History of the Drum Limestone and AssociatedStrata (Pennsylvanian) in the Independence, Kansas, Area-AField Trip Guidebook and Road Log: Kansas GeologicalSurvey, Open-file Report 91-45, 29 p.
Franseen, E. K., Feldman, H. R., Anderson, N. L., and Miller, R.D., 1995, Depositional and stratigraphic analysis of KansasCity group strata utilizing high-resolution seismic imaging,Montgomery County, Kansas; in, Geophysical Atlas ofSelected Oil and Gas Fields in Kansas, N. L. Anderson and D.E. Hedke, eds.: Kansas Geological Survey, Bulletin 237, p.43-46.
Gawthorpe, R. L., Collier, R. E., Alexander, J., Bridge, J. S., andLeeder, M. R., 1993, Ground-penetrating radar—Applicationto sandbody geometry and heterogeneity studies: GeologicalSociety, Special Publication no. 73, p. 421–432.
Hamblin, W. K., 1969, Marine paleocurrent directions inlimestones of the Kansas City Group (Upper Pennsylvanian)in eastern Kansas: Kansas Geological Survey, Bulletin 194,pt. 2, 25 p.
Jol, H. M., Smith, D. G., Meyers, R. A., and Lawton, D. C., 1996,Ground penetrating radar—High resolution stratigraphicanalysis of coastal and fluvial environments: Gulf CoastSection of the SEPM Foundation 17th Annual ResearchConference on Stratigraphic Analysis, p. 153–163.
Knight, R., Tercier, P., and Jol, H., 1997, The role of ground-penetrating radar and geostatistics in reservoir description:The Leading Edge, v. 16, no. 11, p. 1,576–1,582.
Kruger, J. M., Martinez, A., and Franseen, E. K., 1996, A high-frequency ground-penetrating radar study of the DrumLimestone, Montgomery County, Kansas: Kansas GeologicalSurvey Open-file Report 96-49, 17 p.
Liner, C. L., and Liner, J. L., 1995, Ground penetrating radar—Anear-face experience from Washington County, Arkansas: TheLeading Edge, v. 14, no. 1, p. 17–21.
Martinez, A., Kruger, J. M., Franseen, E. K., Shoemaker, M. L.,and Roark, M. L., 1995a, A high-frequency ground-penetrat-ing radar study of the Captain Creek Limestone, JohnsonCounty, Kansas: Kansas Geological Survey, Open-file Report95-57, 23 p.
Martinez, A., Kruger, J. M., and Franseen, E. K., 1995b, A high-frequency ground-penetrating radar study of the PlattsburgLimestone and Bonner Springs Shale, I-435/I-70 Interchange,Southwest Wyandotte County, Kansas: Kansas GeologicalSurvey, Open-file Report 95-58, 52 p.
Martinez, A., Feldman, H. R., Kruger, J. M., and Beaty, D. S.,1996, Three-dimensional characterization of a fluvialsandstone reservoir analog in northeast Kansas using high-resolution ground-penetrating radar: Kansas GeologicalSurvey, Open-file Report 96-38, 30 p.
Martinez, A., Beaty, D. S., Stiles, J., and Carr, T. R., 1998a,Comparison of ground-penetrating radar reflectivity and rockproperties in a sandstone-dominated incised valley-filldeposit: Proceedings Volume 2, Seventh InternationalConference on Ground Penetrating Radar, University ofKansas, Lawrence, KS, p. 693–698.
Martinez, A., Franseen, E. K., and Beaty, D. S., 1998b, Applica-tions of ground-penetrating radar to sedimentologic andstratigraphic studies—Examples from Pennsylvaniansilciclastics and carbonates in Kansas: Proceedings Volume 2,Seventh International Conference on Ground PenetratingRadar, University of Kansas, Lawrence, KS, p. 687–692.
Miller, R. A., Anderson, N. L., Feldman, H. R., and Franseen, E.K., 1995, Vertical resolution of a seismic survey in carbonateand siliciclastic sequences less than 100 m deep in southeast-ern Kansas: Geophysics, v. 60, p. 423–430.
Newell, K. D., Watney, W. L., Cheng, S. W. L., and Brownrigg,R. L., 1987, Stratigraphic and spatial distribution of oil andgas production in Kansas: Kansas Geological Survey,Subsurface Geology Series 9, 86 p.
Pratt, B. R., and Miall, A. D., 1993, Anatomy of a bioclasticgrainstone megashoal (Middle Silurian, southern Ontario)revealed by ground-penetrating radar: Geology, v. 21, no. 3, p.223–226.
Schon, J. H., 1996, Physical Properties of Rocks: Fundamentalsand Principles of Petrophysics: Tarrytown, New York,Elsevier Science Inc., p. 465–478.
Watney, W. L., 1980, Cyclic sedimentation of the Lansing andKansas City groups (Missourian) in northwestern Kansas andsouthwestern Nebraska—A guide for petroleum exploration:Kansas Geological Survey, Bulletin 220, 72 p.
Watney, W. L., French, J. A., and Franseen, E. K., eds., 1989,Sequence stratigraphic interpretations and modeling ofcyclothems in the Upper Pennsylvanian (Missourian),Lansing and Kansas City Groups in eastern Kansas: KansasGeological Society Guidebook, 41st Annual Field Trip,October 14–15, 1989, Kansas Geological Survey, Open-fileReport 89-44, 211 p.