Embed Size (px)
Citation preview

VALIDATION OF A TEST ASSESSING FUNCTIONAL CAPACITY IN STROKE
SURVIVORS: UCSD PERFORMANCE-BASED SKILLS ASSESSMENT (UPSA)
A THESIS IN
Psychology
Present to the Faculty at the University
of Missouri-Kansas City in partial fulfillment of
the requirements for the degree
MASTER OF ARTS
by
DENISSE TIZNADO
B.A., San Diego State University, 2011
Kansas City, Missouri
2014

iii
VALIDATION OF A TEST ASSESSING FUNCTIONAL CAPACITY IN STROKE
SURVIVORS: UCSD PERFORMANCE-BASED SKILLS ASSESSMENT (UPSA)
Denisse Tiznado, Candidate for the Master of Arts Degree
University of Missouri-Kansas City, 2014
ABSTRACT
Everyday functioning is an important outcome that is evaluated and targeted in stroke
rehabilitation programs. Therefore, it is important to identify assessments of functional capacity
that are feasible, acceptable and valid to predict daily life abilities among stroke survivors. The
purpose of the present study was to determine the feasibility, acceptability and validity of the
UCSD Performance-Based Skills Assessment (UPSA) in a stroke population. Participants were
40 stroke survivors, 22 Caregivers, and 20 Healthy Controls. The UPSA was validated against
the Executive Function Performance Test (EFPT), a valid measure of daily functioning in stroke
survivors, and Social Participation was measured using the Assessment of Life-Habits Scale
(LIFE-H) which was completed by the stroke survivor’s caregiver. Significant correlations were
found between UPSA total and EPFT total scores, UPSA Communication and EFPT Telephone
scores, and UPSA Household Management and EFPT Simple Cooking scores. However, no
significant correlation was found between the UPSA Finance and the EFPT Bill Payment scores.
Additionally, stroke survivors’ Social Participation was significantly predicted by UPSA total
scores, controlling for age, education and severity of stroke. Regarding our sensitivity analysis,
no differences were found between stroke survivors’ and healthy controls’ performance in UPSA
iv
total scores and domain scores, except in the transportation domain. The UPSA provides
advantages for its use in this population including: the limited amount of training needed to
administer and score it, its portability, and the time of administration (i.e., 30 minutes). In
summary, findings from this study offer preliminary support for the feasibility, acceptability and
validity of the UPSA as a performance-based measure of functional capacity in stroke survivors.
v
APPROVAL PAGE
The faculty listed below, appointed by the Dean of the College of Arts and Sciences have
examined a thesis titled “Validation of a Test Assessing Functional Capacity in Stroke Survivors:
UCSD Performance-based Skills Assessment (UPSA)” presented by Denisse Tiznado, candidate
for the Master of Arts degree, and certify that in their opinion it is worthy of acceptance.
Supervisory Committee
Joan McDowd, Ph.D.
Department of Psychology
Diane Filion, Ph.D.
Department of Psychology
Jared Bruce, Ph.D.
Department of Psychology
Melisa Rempfer, Ph.D.
Department of Psychology
vi
CONTENTS
ABSTRACT ............................................................................................................................ iii
LIST OF TABLES ................................................................................................................ viii
LIST OF ILLUSTRATIONS .................................................................................................. ix
ACKNOWLEDGMENTS ....................................................................................................... x
Chapter
1. INTRODUCTION AND BACKGROUND ............................................................ 1
Assessing Functional Capacity ........................................................................ 1
The UCSD Performance-Based Skills Assessment (UPSA) ........................... 6
Why the UPSA? ............................................................................................... 7
Purpose of the Present Study ........................................................................... 8
2. METHODOLOGY ................................................................................................ 10
Recruitment and Data Collection ................................................................... 10
Measures ........................................................................................................ 11
Demographic Information ................................................................ 11
Beck Depression Inventory (BDI-II) ................................................ 11
NIH Stroke Scale (NIHSS) ............................................................... 11
UCSD Performance-based Skills Assessment (UPSA) .................... 12
Executive Function Performance Test (EFPT) ................................ 13
The Assessment of Life-Habits Scale (LIFE-H) .............................. 14
Analysis.......................................................................................................... 15
3. RESULTS .............................................................................................................. 17
vii
Participant Characteristics ............................................................................. 17
Feasibility of the UPSA ................................................................................ 17
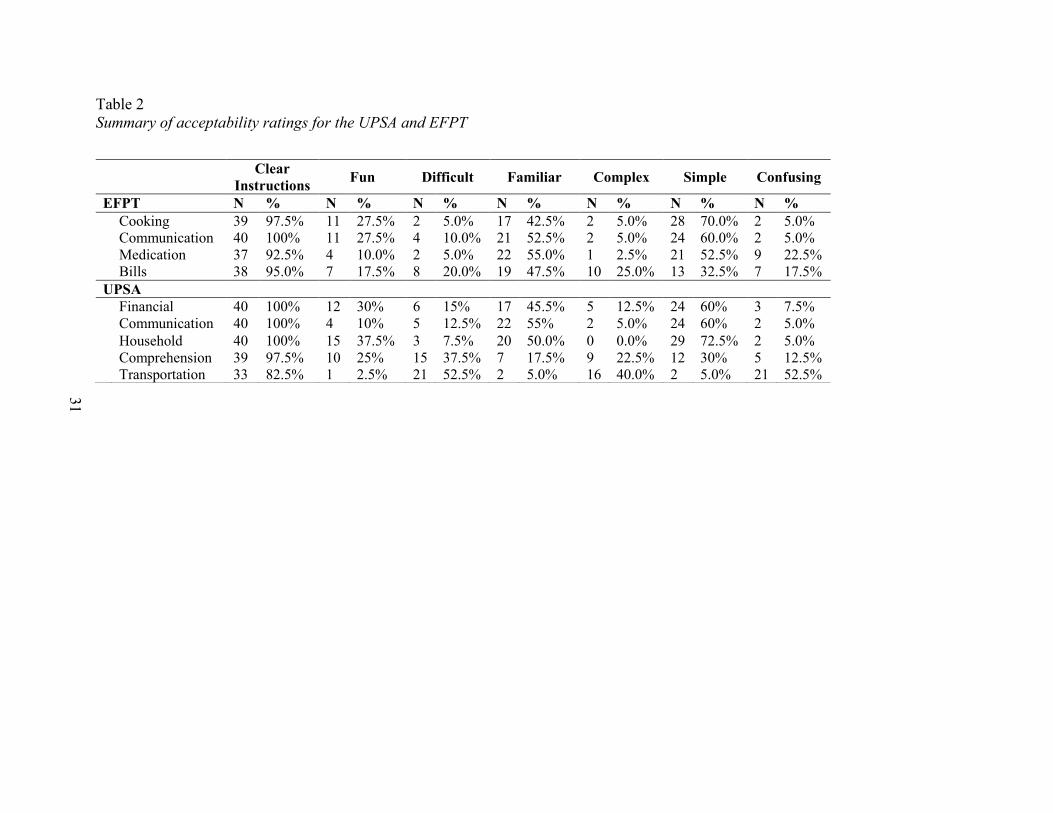
Acceptability of the UPSA ........................................................................... 18
Sensitivity of the UPSA ............................................................................... 21
. Hypothesis 1: Comparison Between Healthy Controls and Stroke
Survivors .......................................................................................... 21
Validity of the UPSA ................................................................................... 21
Hypothesis 2: Relationship Between EFPT and UPSA ................... 21
Hypothesis 3: Predicting Social Participation with UPSA Scores ... 22
4. DISCUSSION ........................................................................................................ 24
Validity and Sensitivity of the UPSA ............................................................ 24
Limitations and Future Directions ................................................................. 28
Conclusion ..................................................................................................... 29
APPENDIX A
Tables 1 – 5 ................................................................................................................ 31
APPENDIX B
Figures 1 – 4............................................................................................................... 35
REFERENCES ...................................................................................................................... 37
VITA ...................................................................................................................................... 42
viii
TABLES
Table Page
1. Participant Characteristics ......................................................................................... 31
2. Summary of Acceptability Ratings for the UPSA and EFPT .................................... 32
3. UPSA and EFPT Means and Standard Deviations .................................................... 33
4. Correlations Between the UPSA and EFPT in Stroke Survivors .............................. 33
5. Predicting Social Participation in Stroke Survivors................................................... 34

ix
ILLUSTRATIONS
Figure Page
1. Correlation Between UPSA Total Scores and EFPT Total Scores ............................ 35
2. Correlation Between UPSA Communication Domain and EFPT Telephone Task ... 35
3. Correlation Between UPSA Household Domain and EFPT Cooking Task .............. 36
4. Correlations Between UPSA Finance and EFPT Bill Payment Task ........................ 36
x
ACKNOWLEDGMENTS
We gratefully acknowledge the contributions of the stroke survivors, caregivers and
healthy controls who made this study possible. We also acknowledge the extraordinary efforts of
our research team (Joan McDowd, Mark Poirier, Jeffrey Soulliere, Julie Miller, Cristal
Hernandez, and Natosha Lasher). This thesis could not have been completed without the
assistance of the committee members as well as the support of my friends and family. I would
especially like to thank Dr. Joan McDowd for her commitment as a mentor.
1
CHAPTER 1
INTRODUCTION AND BACKGROUND
Each year in the United States 795,000 people experience a new or recurrent stroke
(Lloyd-Jones et al., 2010). Mortality rates in stroke survivors have declined by 18.4% from 1996
to 2006 (Lloyd-Jones et al., 2010), and both life expectancy after a stroke and the number of
stroke survivors has been increasing (Hannerz & Nielsen, 2001). These numbers indicate that
living with disability following stroke is becoming an increasingly large public health problem.
Indeed, people who experience a stroke tend to suffer from a number of disabilities, including
impaired physical mobility, balance, gait speed, upper extremity function, cognition, and
functional ability (Mayo et al., 1999). The World Health Organization has proposed the
International Classification of Functioning, Disability and Health (WHO ICF) framework for
understanding disability involving body functions, activities and participation, and
environmental factors (Üstün, 2003). An important advantage of using this framework to define
disability is the incorporation of psychological, environmental, and social factors, rather than
focusing solely on the biology of the illness or condition. This framework emphasizes the
importance of activities (tasks and actions by an individual) and participation (involvement in a
life situation) for maximizing quality of life. Using this model to characterize disability
following stroke requires a focus on functional ability, rather than deficits. In order to better
target the difficulties faced by stroke survivors, rehabilitation professionals need to know the best
way to assess functional abilities in order to tailor strategies to serve those survivors.
Assessing Functional Capacity
As stated in the WHO ICF framework, everyday functioning is an important outcome that
should be evaluated and targeted in stroke rehabilitation programs. Indeed, impairment in daily
2
functioning has been found to have a significant negative impact in stroke survivors’ overall
quality of life (Carod-Artal, Egido, González, & Varela de Seijas, 2000; Kim, Warren, Madill, &
Hadley, 1999). Efforts in stroke rehabilitation programs and research have been made to utilize
the WHO ICF framework to operationalize outcomes of interest, such as activity and
participation. In reviews of outcome measures used in drug trials and rehabilitative therapies
(e.g., occupational, speech and language, cognitive) for stroke survivors, the most common
activity measure used was the Barthel Index, followed by the Rankin Scale and Modified Rankin
Scale (mRs) (Geyh et al., 2004). The Barthel Index (BI) is a measure completed by the clinician
that assesses participants in two different domains, mobility and self-care. The Rankin Scale and
mRs are also completed by the clinician who assesses the individuals’ global disability on a 5-
point scale, ranging from no symptoms at all to severe disability; bedridden, incontinent and
requiring constant nursing care and attention. These measures are cost-effectiveness and quick
to administer, but do not capture the range of ability an individual may have.
Everyday functioning can be measured using many different methods including self-
report, proxy reports, behavioral observations and performance-based measures. A problem with
self-report measures is the possibility that the person’s cognitive functioning or other factors
such as communication problems, may be a threat to the validity and accuracy of their responses.
Although self-report measures are cost-effective and provide a voice for the person, they may not
represent an accurate evaluation of the person’s level of real-world functioning.
There are advantages of assessing daily-living functioning via proxy reports. For
instance, stroke survivors who suffer from communication difficulties such as aphasia, or motor
impairments, may have difficulties performing self-report measures. However, assessing daily-
living functioning with proxy reports also can be problematic. For example, in a study by Dassel
3
and Schmitt (2008), the educational background and executive function levels of Alzheimer's
patients’ caregivers significantly predicted discrepancies between caregiver’s report of the
patient’s functioning and direct assessment of patient’s activities of daily living. These results
suggest caregivers are not always accurate judges of their care recipient’s abilities (Dassel &
Schmitt, 2008).
Another source of every-day functioning reports are clinicians’ evaluations like those
described above using the Barthel Index or Rankin Scale. However, a drawback to clinician
ratings is the limited range of behaviors that they can report due to lack of direct observation in
real-world settings. Behavioral observation in situ is the ideal method to assess real world
functioning. However this method is not very cost-effective and the presence of an observer can
influence a person’s behavior and not truly reflect their level of functioning.
The closest approximation to behavioral observations would seem to be performance-
based measures. Performance-based measures are assessments that ask the individual to perform
everyday living tasks such as writing checks, cooking meals, preparing a grocery list, or
managing medications under standardized, simulated conditions. Extensive research on
performance-based measures has been conducted in people with schizophrenia, bipolar disorder,
dementia, and older healthy adults, finding that these measures tend to be more reliable and valid
than self-report or proxy reports of functioning. In a review of performance-based measures of
functional living skills, it was found that most measures reviewed demonstrated good internal
validity, test-retest reliability, and concurrent validity (Moore, Palmer, Patterson, & Jeste, 2007).
In these studies, concurrent validity was assessed by examining the relationship between
performance-based measures and other measures of daily functioning, other performance-based
measures, and/or cognitive and neuropsychological assessments (Moore et al., 2007). Although
4
no stroke-specific performance-based measure was identified in this review, other authors have
published validity and reliability data on performance-based measures in stroke survivors. Two
of these measures that show the most promise for capturing functional ability among stroke
survivors are the Functional Impact Assessment (FIA) (Heaton et al., 2004) and the Executive
Function Performance Test (EFPT) (Baum et al., 2008).
The FIA is a performance-based measure designed to assess participants in different
everyday living tasks, specifically finances, communication, shopping, cooking, and medication
management. The subtests in the FIA are composed from different published measures of IADLs
and newly developed subtests. The subtests of financial skills, shopping, and communication
were selected from the Direct Assessment of Functional Status (DAFS) (Loewenstein et al.,
1989) and the medication management subtest was selected from the Medication Management
Test (MMT) (Albert et al., 1999). The two new subtests include advanced finances and cooking.
However, the initial reliability and validity study (Sadek, Stricker, Adair, & Haaland, 2011)
suggested that more evidence is needed before the FIA is a good option for use with stroke
survivors.
The EFPT was designed to assess executive function in everyday tasks by asking
individuals to perform tasks including cooking, finances, telephone use and medication
management. In each task, the person is assessed in their initiation, organization, sequencing,
safety and judgment, and completion of the task. If the person is having difficulties performing
the task, the examiner can provide them with cues. If needed, there are five levels of cuing,
including indirect verbal guidance, gestural guidance, direct verbal assistance, and physical
assistance. If the person still cannot complete the task, the examiner will perform the task for the
person. The examiner is required to give the cues progressively starting from no cue to indirect
5
verbal guidance, gestural guidance, direct verbal assistance, physical assistance and finally to
perform the task for the participant if necessary. In comparison to other tests that take off points
for errors in task performance, the EFPT does not allow the examinee to make errors. Rather, the
examiner provides cues to support successful task completion, and records the level of cueing
required to complete the task. This scoring system was designed to identify what individuals can
do and how much assistance they need to complete each task. The EFPT has been validated in
adults with multiple sclerosis (Goverover et al. 2005), in people with schizophrenia (Katz,
Tadmor, Felzen, & Hartman-Maeir, 2007) and with stroke survivors (Baum et al. 2008).
There are several advantages to the EFPT. In contrast to other performance-based
measures the EFPT provides the person with cues, and assesses what type of assistance they need
to successfully perform the task instead of assessing their level of impairment. Therefore,
examiners can better understand the type of assistance participants need versus only knowing
that they need assistance. Also, the EFPT provides scores for the executive function components
of initiation, organization, sequencing, safety and judgment, and completion. This provides the
examiner with a better idea of which executive functions are impaired. However, the EFPT also
has a few drawbacks. The EFPT requires extensive training on its administration and scoring.
For example the examiner needs to know the appropriate level of cuing and has to carefully time
the cueing that the participant requires to successfully complete the task. That is, the examiner
needs to provide the examinee with enough time to work on the task, but also needs to provide
the cue before the examinee makes a mistake. In addition, the EFPT requires a variety of
materials and equipment (e.g. hot plate, phone line) making it challenging to transport the test to
field settings.
6
Even though performance-based measures often require significant time to administer,
training of examiners, and the expense of gathering and transporting a variety of materials, these
measures also tend to be more reliable, valid and less likely to have ceiling effects than self-
report or proxy reports, therefore providing more accurate assessments of real-world functioning.
Accuracy in measuring individuals’ real-world functioning can aid researchers, clinicians and
therapists in improving rehabilitation placement and effectiveness in assessing readiness to
function independently. However, there are a limited number of performance-based measures
available that assess daily functioning in stroke survivors, and these may not be appropriate for
every situation or purpose. Therefore, it is necessary to investigate other performance-based
measures that have not yet been applied in the stroke population, to assess their appropriateness
for this population and provide clinicians, therapists, and researchers a range of options to best fit
their setting and needs. One such option that is similar to the EFPT is the UCSD Performance-
based Skills Assessment (UPSA), a measure of daily living skills.
The UCSD Performance-Based Skills Assessment (UPSA)
The UPSA has been validated and tested in different populations such as older adults
diagnosed with schizophrenia (Patterson, Goldman, McKibbin, Hughs, & Jeste, 2001), bipolar
disorder (Depp et al., 2009), mild cognitive impairment (Goldberg et al., 2010) and Alzheimer’s
disease (Goldberg et al., 2010). A study conducted by Harvey, Velligan, and Bellack (2007),
assessed the reliability of different performance-based measures and found very high test-retest
and inter-rater reliability data for the UPSA in people diagnosed with schizophrenia. The UPSA
has also been found to correlate with cognitive performance, specifically processing speed,
attention and working memory (Bowie et al., 2008), which have been shown to be good
predictors of functional ability (Bowie, Reichenberg, Patterson, Heaton, & Harvey, 2010). The
7
UPSA has also been found to have good criterion validity in people diagnosed with
schizophrenia. In a study by Mausbach et al. (2008), an UPSA total score of 75 or above
significantly predicted living status in a large sample of people diagnosed with schizophrenia or
schizoaffective disorder. The UPSA was also found to be related to degree of independence in
the community defined by living situation (Twamley et al., 2002) and greater community
responsibilities such as doing volunteer work, household chores, or taking care of children
(Cardenas et al., 2008). These results suggest that this test is valid and reliable for use with the
populations studied. However, nothing is known about the use of this test for individuals who
have experienced a stroke. We therefore propose to test the validity of the UPSA with stroke
survivors.
Why the UPSA?
The UPSA has several features to commend its use in field settings. First, there is a large
amount of research supporting its validity and reliability in other clinical populations.
Additionally, the UPSA takes approximately thirty minutes to administer. The props for this
assessment do not require complex equipment that may be difficult to obtain or transport. For
example, the EFPT asks participants to cook oatmeal and make a phone call, requiring a hot plate
or stove and a working telephone. The UPSA, however, only requires a disconnected phone, a
bus schedule, a map, simulated currency, and pantry items. Therefore, the UPSA can be easily
implemented in a variety of settings, including field settings. Another advantage of the UPSA is
that it only requires a minimum amount of training, thereby allowing easy administration and
scoring (Patterson & Mausbach, 2010). Thus it may provide the sensitivity and validity of other
performance-based measures, while also being easier and quicker to administer in a variety of
settings. The utility of the UPSA with stroke survivors will be examined in the present study.
8
Purpose of the Present Study
The purpose of the present study was to determine the feasibility, acceptability and
validity of the UCSD Performance-Based Skills Assessment in a stroke population. To address
the question of feasibility, we assessed the practical aspects of task administration. We counted
the number of people that could perform the UPSA, and the number who could not. We modified
tasks requiring motor skills to be sure performance was not an artifact of their physical disability.
For example, when participants were unable to hold the telephone and dial a number, we assisted
them by holding the phone and dialing for them. However, they still had to perform the task,
meaning that they had to provide us with instructions on how to make the phone call. We kept
detailed notes of issues that arose during test administration, and any task modifications that
were necessary.
To address the question of acceptability, we assessed participants’ responses to both the
UPSA and EFPT. Participants were asked about the clarity of the instructions for both the UPSA
and the EFPT. We also asked participants to rate the UPSA, EFPT and their subscales as “fun”,
“difficult”, “familiar”, “complex”, “simple” and/or “confusing.” Participants were encouraged to
provide feedback explaining their ratings. Time taken to complete each measure was recorded.
To address the question of sensitivity we compared performance on UPSA total scores
and UPSA subscales scores between stroke survivors and healthy controls. To address the
question of validity we compared performance scores of the UPSA with performance on the
EFPT which has been validated in stroke survivors, and we assessed whether the UPSA
predicted stroke survivor’s social participation.
Hypotheses
1. Our hypothesis regarding the sensitivity of the UPSA to stroke related deficits is:
9
a. Participants with a diagnosis of stroke will perform significantly poorer on the UPSA
relative to comparably aged participants without a diagnosis of stroke (i.e. healthy
controls).
2. Our hypotheses regarding the validity of the UPSA for assessing stroke related deficits are:
a. Scores on the UPSA will be significantly correlated with scores on the EFPT,
meaning that people who perform poorly on the UPSA would also exhibit worse
performance on the EFPT; and
b. Total scores on the UPSA will significantly predict participation (as defined by the
WHO ICF) in stroke survivors as measured by the Assessment of Life Habits (LIFE-
H), over and above age, education and stroke severity.
10
CHAPTER 2
METHODOLOGY
Recruitment and Data Collection
Forty stroke survivors, 22 family members or caregivers, and 20 healthy older adults as a
comparison group were recruited to participate in this study. The data used in this study were
collected as part of a larger study designed to examine determinants of functional ability among
stroke survivors. Stroke survivors and caregivers were recruited from the American Stroke
Foundation, a local organization providing post-rehabilitation services to adults living with a
stroke, and the Landon Center on Aging at the University of Kansas Medical Center. Stroke
survivors (both male and female) were enrolled if they were at least 6 months post-stroke and
living in the community and if they were able to identify a caregiver or family member who was
familiar with the participant’s daily functioning and willing and able to sign an informed
consent. Exclusion criteria included severe difficulties with motor function that would prevent
task performance, and an inability to communicate with the experimenter, as measured by the
NIH Stroke Scale. Healthy older adults were recruited from the SilverRoo database developed by
Dr. Joan McDowd in the Department of Psychology at the University of Missouri-Kansas City
(UMKC). We recruited a sample of 20 persons with no history of stroke (i.e. healthy controls),
both males and females who were 45 years of age or older and free of neurological disorder.
Stroke survivors and healthy controls were matched on age and educational levels. The
assessment for both the stroke survivors and caregivers took place at the American Stroke
Foundation Mission Kansas Center, The Landon Center on Aging, or at the SilverRoo lab at
UMKC. Healthy adults were assessed at the SilverRoo Lab. Stroke survivors and healthy adults
were offered a 40 dollar incentive and caregivers were offered 10 dollars for their participation.
11
Measures
Demographic Information
Demographic information was collected using a self-report demographic questionnaire.
Information collected included age, education levels, gender, income level, marital status, living
situation, ethnicity, and employment status. Participants were also asked to report time since
stroke, number of strokes, length of time in the hospital, length of time in a rehabilitation
program after the stroke, medical and psychiatric history.
Beck Depression Inventory (BDI-II)
Symptoms of depression were measured using the Beck Depression Inventory-II (BDI-
II). The BDI-II is comprised of 21 items, rated in a 4-point scale; total score could range from 0
to 84. Scores of 0 to 13 indicate no to minimal depressive symptoms, 14 to 19 mild depressive
symptoms, 20-28 moderate depressive symptoms and 29-63 indicate severe depressive
symptoms. The BDI-II takes approximately 5-10 minutes to administer. The BDI-II has been
found to have good validity and reliability in stroke survivors (Aben, Verhey, Lousberg, Lodder,
& Honig, 2002).
NIH Stroke Scale (NIHSS)
Chronic stroke severity was measured using the NIH Stroke Scale (NIHSS) (Brott et al.,
1989). The NIHSS is a brief measure that assesses stroke patient’s neurological status in three
different domains. These domains include: (a) Movement; (b) Sensation; and (c) Perception. The
NIHSS has been found to have good validity and reliability (D’Olhaberriague, Litvan, Mitsias, &
Mansbach, 1996), and is typically administered shortly after stroke to asses stroke severity.
However, in the absence of severity measures for chronic stroke, we applied the measure to this
12
context. Scores for this measure were converted to percentage scores with higher scores
representing more severe symptoms of stroke.
UCSD Performance-Based Skills Assessment (UPSA)
The UPSA (Patterson et al., 2001) assesses the person’s ability to perform a variety of
everyday living tasks in the following domains: (a) Finance; (b) Communications; (c)
Organization/Planning; (d) Transportation; and (e) Household Management.
The UPSA involves role-play tasks similar in complexity to situations that an older
community-dwelling person is likely to encounter. For example, the finance domain provides
participants with simulated bills and real coins. The first task asks participants to count specific
amounts (e.g., $12.49, $6.73, $1.02) and to make change from ten dollars. For the second part of
this domain participants are given a utility bill and are asked to provide information included in
the bill (e.g., check is written to utility company, how much to pay, when to pay). This subtest
takes about five minutes to complete.
In the communication domain participants are provided with a disconnected telephone
and are asked to dial the number they would call if they had an emergency (correct response is 9-
1-1). An additional task is to role-play a call to “information”, asking for a number and dialing
the number from memory. The final communication task asks participants to read a letter they
received from their doctor about an appointment, and then to call the hospital and leave a voice
mail requesting to reschedule their appointment. Participants are scored on the quality of their
message. In addition, participants are also asked to recall information from the letter, such as
how they were to prepare for their medical appointment (e.g., fast for a blood draw) and what
two items they were to take to their appointment (e.g., insurance card and list of medications).
This subtest takes approximately five minutes to complete.
13
The organization/planning domain asks participants to read a “newspaper article”
describing the opening of a new Water Theme Park. They are then asked to recall important
information from the article, and to generate a list of seven objects they should take to the
waterpark (e.g., sunscreen, swimsuit, sandals, towel, sunglasses). This subtest takes
approximately five minutes to complete.
In the transportation domain participants are provided with three bus schedules and are
asked about the cost of the bus ticket, the telephone number they could dial to obtain more
information on bus schedules, and to point to the different trolley stations. They are also asked to
point to the correct bus schedule to get to a particular location and where they would get off the
bus to transfer to a different bus. The last task asks participants to use the information from the
bus schedule to answer questions about when to catch a bus in order to arrive early to an
appointment. These tasks take approximately five minutes to complete.
The household management domain provides participants with a recipe for rice pudding
along with an incomplete shopping list. Participants are then presented with 29 items that can be
found in their pantry (e.g., potato chips, rice, crackers, jelly, toothpaste) and are asked to write a
shopping list based on the missing and necessary items they need to buy to cook rice pudding.
This task takes about five minutes to complete.
Administration of the UPSA requires approximately 30 minutes to complete. Participants
receive scores for each of the 5 subscales (range = 0-20), which are summed to create a summary
score ranging from 0 to 100. Higher scores represent better performance on the UPSA.
Executive Function Performance Test (EFPT)
The Executive Function Performance Test (EFPT) (Baum et al., 2008) assesses executive
function by requiring role-playing of everyday living tasks including (a) Simple Cooking; (b)
14
Telephone use; (c) Medication Management; and (d) Bill Payment. All of the materials required
to accomplish the tasks in the EFPT are found in a clear box provided by the examiner, and
participants are required to search for the necessary materials to accomplish each specific task.
The cooking subtest provides participants with an oatmeal recipe and requires
participants to prepare oatmeal by following the instructions. The telephone use subtest requires
participants to look up the number for a grocery store in a telephone book, and call the grocery
store to ask if they deliver groceries. For the medication management subtest participants are
asked to find their prescribed medication among two pill bottles (one bottle without their name,
one has their name on the label), to follow the instructions on the pill bottle and to take their
medicine. They are also asked when they need to take their medication, what they are supposed
to take with it, and what do they need to be careful about with this medication. And finally, the
bill payment task requires participants to find their bills, check the amount of money in their
check register, pay their bills and balance their checkbook. The EFPT takes approximately 45
minutes to complete.
Prior to performing each task, participants are asked how familiar they are and how much
assistance they will need to perform each task. In contrast to the UPSA, participants are scored
depending on the level of cuing needed for each task. Participants receive scores for each task
(range = 0-25), and a total score (range= 0 to 100). Higher scores on the EFPT indicate the need
for more assistance performing the tasks.
The Assessment of Life-Habits Scale (LIFE-H)
Participation was assessed using The Assessment of Life-Habits Scale (LIFE-H). The
LIFE-H is a self-report measure that assesses individuals in 12 different categories including,
nutrition, fitness, personal care, communication, housing, mobility, responsibilities, interpersonal
15
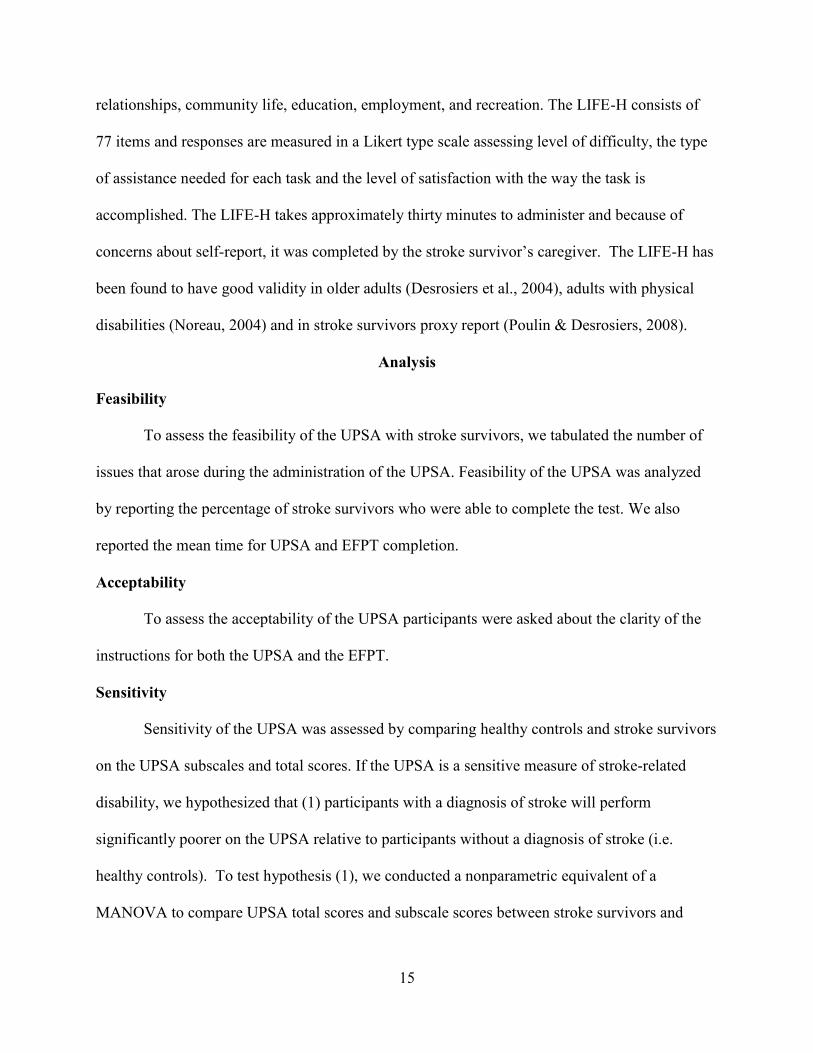
relationships, community life, education, employment, and recreation. The LIFE-H consists of
77 items and responses are measured in a Likert type scale assessing level of difficulty, the type
of assistance needed for each task and the level of satisfaction with the way the task is
accomplished. The LIFE-H takes approximately thirty minutes to administer and because of
concerns about self-report, it was completed by the stroke survivor’s caregiver. The LIFE-H has
been found to have good validity in older adults (Desrosiers et al., 2004), adults with physical
disabilities (Noreau, 2004) and in stroke survivors proxy report (Poulin & Desrosiers, 2008).
Analysis
Feasibility
To assess the feasibility of the UPSA with stroke survivors, we tabulated the number of
issues that arose during the administration of the UPSA. Feasibility of the UPSA was analyzed
by reporting the percentage of stroke survivors who were able to complete the test. We also
reported the mean time for UPSA and EFPT completion.
Acceptability
To assess the acceptability of the UPSA participants were asked about the clarity of the
instructions for both the UPSA and the EFPT.
Sensitivity
Sensitivity of the UPSA was assessed by comparing healthy controls and stroke survivors
on the UPSA subscales and total scores. If the UPSA is a sensitive measure of stroke-related
disability, we hypothesized that (1) participants with a diagnosis of stroke will perform
significantly poorer on the UPSA relative to participants without a diagnosis of stroke (i.e.
healthy controls). To test hypothesis (1), we conducted a nonparametric equivalent of a
MANOVA to compare UPSA total scores and subscale scores between stroke survivors and
16
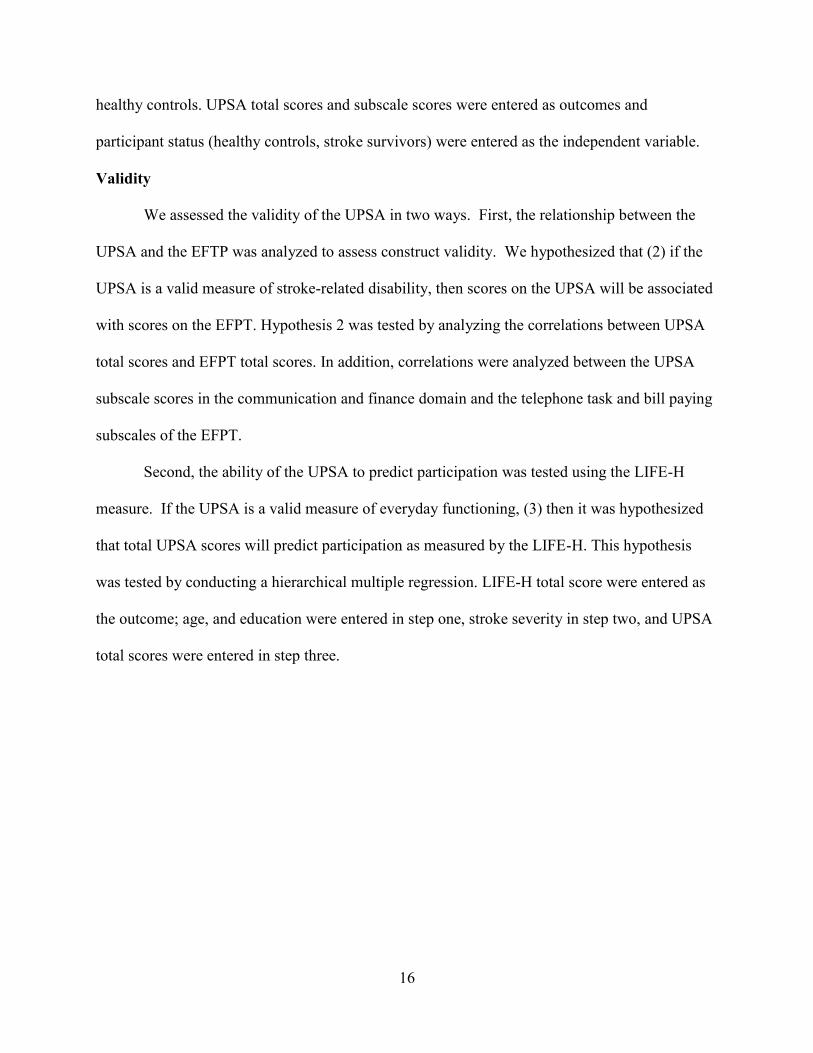
healthy controls. UPSA total scores and subscale scores were entered as outcomes and
participant status (healthy controls, stroke survivors) were entered as the independent variable.
Validity
We assessed the validity of the UPSA in two ways. First, the relationship between the
UPSA and the EFTP was analyzed to assess construct validity. We hypothesized that (2) if the
UPSA is a valid measure of stroke-related disability, then scores on the UPSA will be associated
with scores on the EFPT. Hypothesis 2 was tested by analyzing the correlations between UPSA
total scores and EFPT total scores. In addition, correlations were analyzed between the UPSA
subscale scores in the communication and finance domain and the telephone task and bill paying
subscales of the EFPT.
Second, the ability of the UPSA to predict participation was tested using the LIFE-H
measure. If the UPSA is a valid measure of everyday functioning, (3) then it was hypothesized
that total UPSA scores will predict participation as measured by the LIFE-H. This hypothesis
was tested by conducting a hierarchical multiple regression. LIFE-H total score were entered as
the outcome; age, and education were entered in step one, stroke severity in step two, and UPSA
total scores were entered in step three.
17
CHAPTER 3
RESULTS
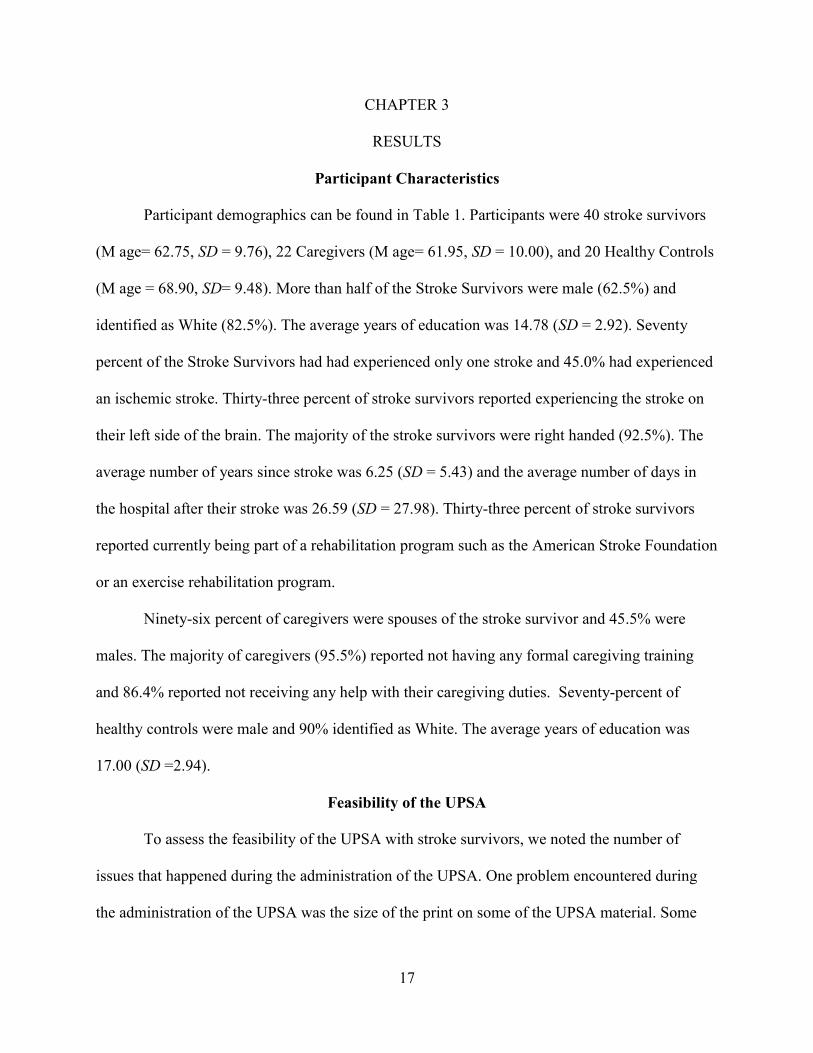
Participant Characteristics
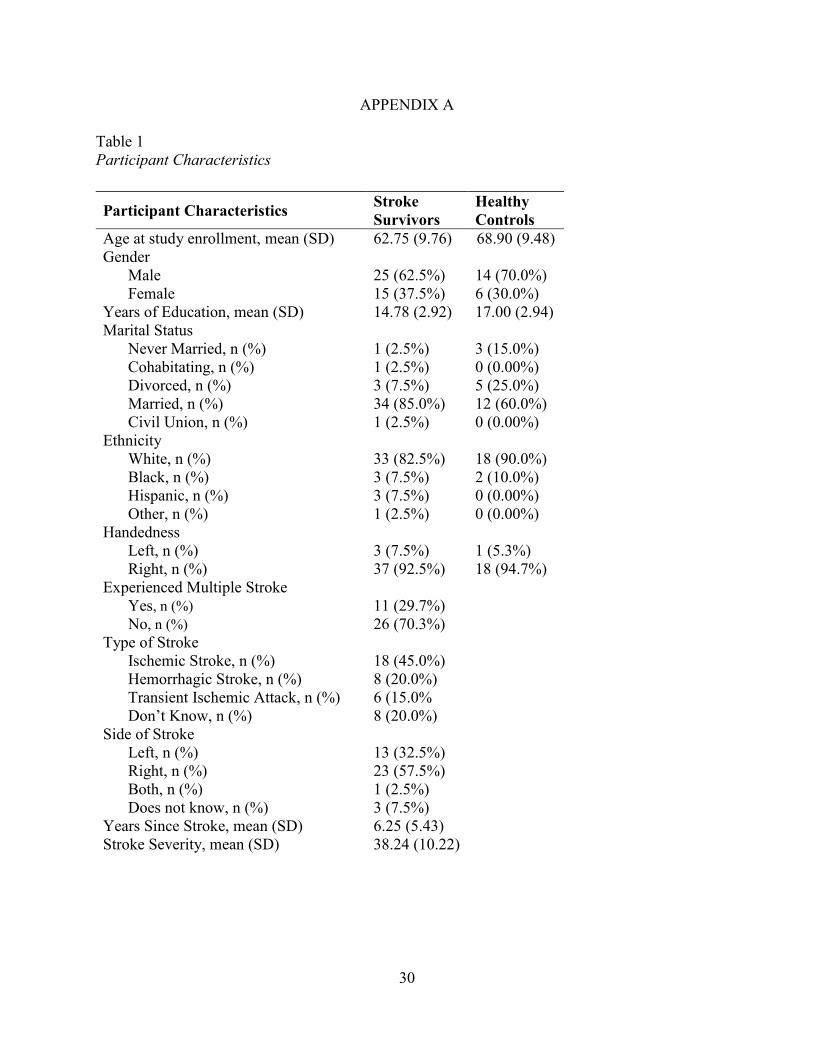
Participant demographics can be found in Table 1. Participants were 40 stroke survivors
(M age= 62.75, SD = 9.76), 22 Caregivers (M age= 61.95, SD = 10.00), and 20 Healthy Controls
(M age = 68.90, SD= 9.48). More than half of the Stroke Survivors were male (62.5%) and
identified as White (82.5%). The average years of education was 14.78 (SD = 2.92). Seventy
percent of the Stroke Survivors had had experienced only one stroke and 45.0% had experienced
an ischemic stroke. Thirty-three percent of stroke survivors reported experiencing the stroke on
their left side of the brain. The majority of the stroke survivors were right handed (92.5%). The
average number of years since stroke was 6.25 (SD = 5.43) and the average number of days in
the hospital after their stroke was 26.59 (SD = 27.98). Thirty-three percent of stroke survivors
reported currently being part of a rehabilitation program such as the American Stroke Foundation
or an exercise rehabilitation program.
Ninety-six percent of caregivers were spouses of the stroke survivor and 45.5% were
males. The majority of caregivers (95.5%) reported not having any formal caregiving training
and 86.4% reported not receiving any help with their caregiving duties. Seventy-percent of
healthy controls were male and 90% identified as White. The average years of education was
17.00 (SD =2.94).
Feasibility of the UPSA
To assess the feasibility of the UPSA with stroke survivors, we noted the number of
issues that happened during the administration of the UPSA. One problem encountered during
the administration of the UPSA was the size of the print on some of the UPSA material. Some
18
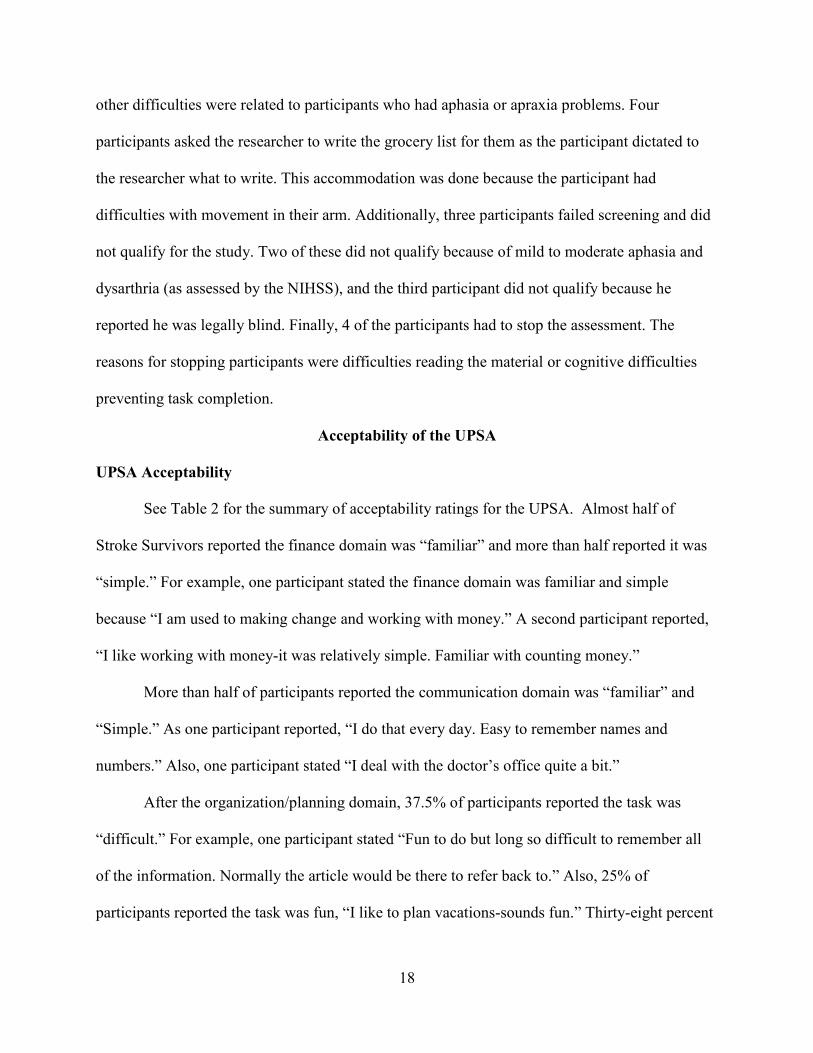
other difficulties were related to participants who had aphasia or apraxia problems. Four
participants asked the researcher to write the grocery list for them as the participant dictated to
the researcher what to write. This accommodation was done because the participant had
difficulties with movement in their arm. Additionally, three participants failed screening and did
not qualify for the study. Two of these did not qualify because of mild to moderate aphasia and
dysarthria (as assessed by the NIHSS), and the third participant did not qualify because he
reported he was legally blind. Finally, 4 of the participants had to stop the assessment. The
reasons for stopping participants were difficulties reading the material or cognitive difficulties
preventing task completion.
Acceptability of the UPSA
UPSA Acceptability
See Table 2 for the summary of acceptability ratings for the UPSA. Almost half of
Stroke Survivors reported the finance domain was “familiar” and more than half reported it was
“simple.” For example, one participant stated the finance domain was familiar and simple
because “I am used to making change and working with money.” A second participant reported,
“I like working with money-it was relatively simple. Familiar with counting money.”
More than half of participants reported the communication domain was “familiar” and
“Simple.” As one participant reported, “I do that every day. Easy to remember names and
numbers.” Also, one participant stated “I deal with the doctor’s office quite a bit.”
After the organization/planning domain, 37.5% of participants reported the task was
“difficult.” For example, one participant stated “Fun to do but long so difficult to remember all
of the information. Normally the article would be there to refer back to.” Also, 25% of
participants reported the task was fun, “I like to plan vacations-sounds fun.” Thirty-eight percent
19
of participants reported the task was difficult because of the amount of information they have to
remember to answer the questions correctly.
Regarding the transportation domain, more than half of participants reported the
Transportation task was difficult, confusing and 40% reported it was a “complex” task. For
example, one participant stated “It was very difficult and very confusing. The times table. I really
had trouble. Not making any sense. Again, my number problem. A lot of decision based on times
of day.” A different participant stated “The layout of the schedule kind of threw me. I don't
utilize buses. It was difficult. Finding where I was going and where I was coming from.”
Finally, more than half of the participants reported the household management domain
was “familiar” and 72.5% reported it was a “simple” task. As one participant stated, “I like to
cook. I used to really like to cook, the fun is coming back. I used to cook and want to cook. I am
used to it. Thinking about what to do.” Another participant stated, “My wife always wants me to
get stuff at the store.” A number of participants reported this was a task they often have to do and
having the recipe made it simple to accomplish.
In addition, participants were asked to rate the complete set of UPSA tasks on a scale
going from tedious at one end, to engaging on the other end. The response scale ranged from 1
(tedious) to 7 (engaging). Eleven percent of participants rated the tasks from 1 to 3, 21.1% as 4
and 68.3% rated the tasks from 5-7. More than half of the participants found the complete set of
tasks to be engaging. In this study, the UPSA took on average 31.45 (SD = 7.60) minutes to
administer.
EFPT Acceptability
After performing the cooking task, more than half of the participants reported the task
was “simple.” For example one participant stated, “Very limited amount of instructions to
20
follow.” Forty-three percent of the participants also reported the task was “familiar” and 27.5%
reported it was “fun.” As one participant stated, “I cook oatmeal. I thought it was fun. Everything
I do is fun. It's still a challenge.”
Half of the participants reported the communication task was “familiar,” more than half
reported it was “simple” and 27.5% reported it was fun. During our interview one participant
stated, “Just a matter of calling and asking a question.” Another participant indicated, “Once I
realized you just wanted me to make a call and ask a question, it was no problem.”
Regarding the Medication task, half of the participants reported the task was “familiar”
and “simple.” However, 22.5% reported it was “confusing.” Participants stated “Directions
[were] unclear. Confusing, not sure what the goal was. [I have] difficulties opening bottles
without the device I have at home.” Other examples of participants’ statements are “[I] did not
realize that other people’s meds might be in the box” and “[Familiar] I take medications on a
regular basis. Simple task.”
Lastly, after participants completed the Bill Paying task 47.5% reported the task was
“familiar” and 25% reported it was “complex.” As one participant stated, “All of it. It is kind of a
trick, see if you catch it. I didn't read it well enough I make it harder than it has to be. Too much
of a hurry. Should have taken my time. You have more time at home.” Also, another participant
reported “[Familiar] Paying bills is something I do at home. [Difficult] Not at all like I do things
at home. I don't balance my check book for one thing.” Participants reported that even though it
was a familiar task, it was “tricky” and it involved many steps.
In addition, participants were asked to rate the complete set of EFPT tasks on a scale
going from tedious at one end, to engaging on the other end. The response scale ranged from 1
(tedious) to 7 (engaging). Thirteen percent of participants rated the tasks from 1 to 3, 5.3% as 4
21
and 81.6% rated the tasks from 5-7. The majority of participants found the complete set of tasks
in the EFPT to be engaging.
Sensitivity of the UPSA
Hypothesis 1: Comparison between healthy controls and stroke survivors
To test hypothesis 1 a nonparametric equivalent of a MANOVA was conducted to
compare UPSA total scores and domains scores between stroke survivors and healthy controls.
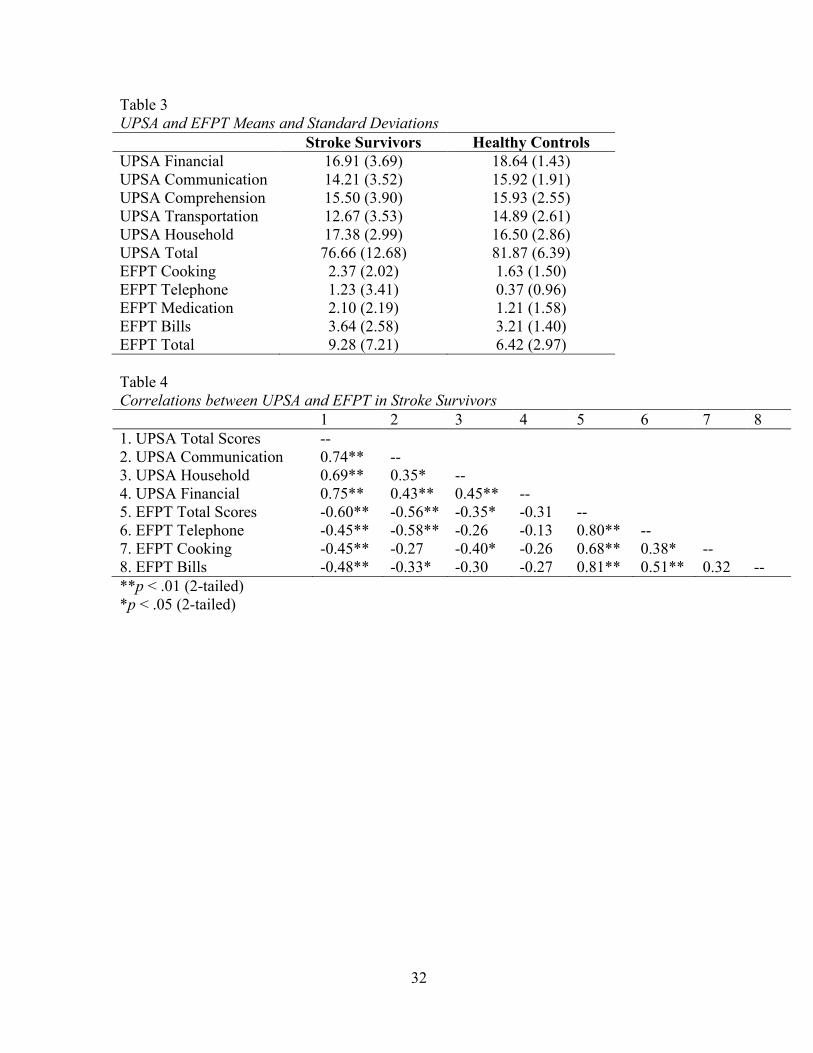
See Table 3 for the means and standard deviations on the UPSA and EFPT in stroke survivors
and healthy controls. UPSA total scores and subscale scores were entered as outcomes and
participant status (healthy controls, stroke survivors) was entered as the independent variable.
Preliminary screening indicated that scores on all UPSA domains, except communication and
total score for Healthy Controls, were not normally distributed.
As a result of the violation of normality and homogeneity of variance a Mann-Whitney
test was conducted to test for differences in UPSA total scores and domain scores between stroke
survivors and healthy controls. There were no significant differences between stroke survivors
and healthy controls scores in the UPSA Finance, Communication, Organization/Planning,
Household Management and total scores. However, there was a significant difference between
Stroke Survivors (Mdn = 13.33, Mean= 12.67) and Healthy Controls (Mdn = 13.33, Mean =
14.89) scores on the Transportation domain, U = 537.50, z = 2.24, p =.025, r = .29.
Validity of the UPSA
Hypothesis 2: Relationship between EFPT and UPSA
We hypothesized that scores on the UPSA will be associated with scores on the EFPT.
Hypothesis 2 was tested by calculating the correlation between UPSA total scores and EFPT
total scores in stroke survivors. Correlations were also calculated between the subtests on the two
22
measures that assessed similar areas of functioning. UPSA domain scores on the
communication, finance and the household management domains, were correlated with the
telephone use task, bill payment task, and simple cooking tasks of the EFPT.
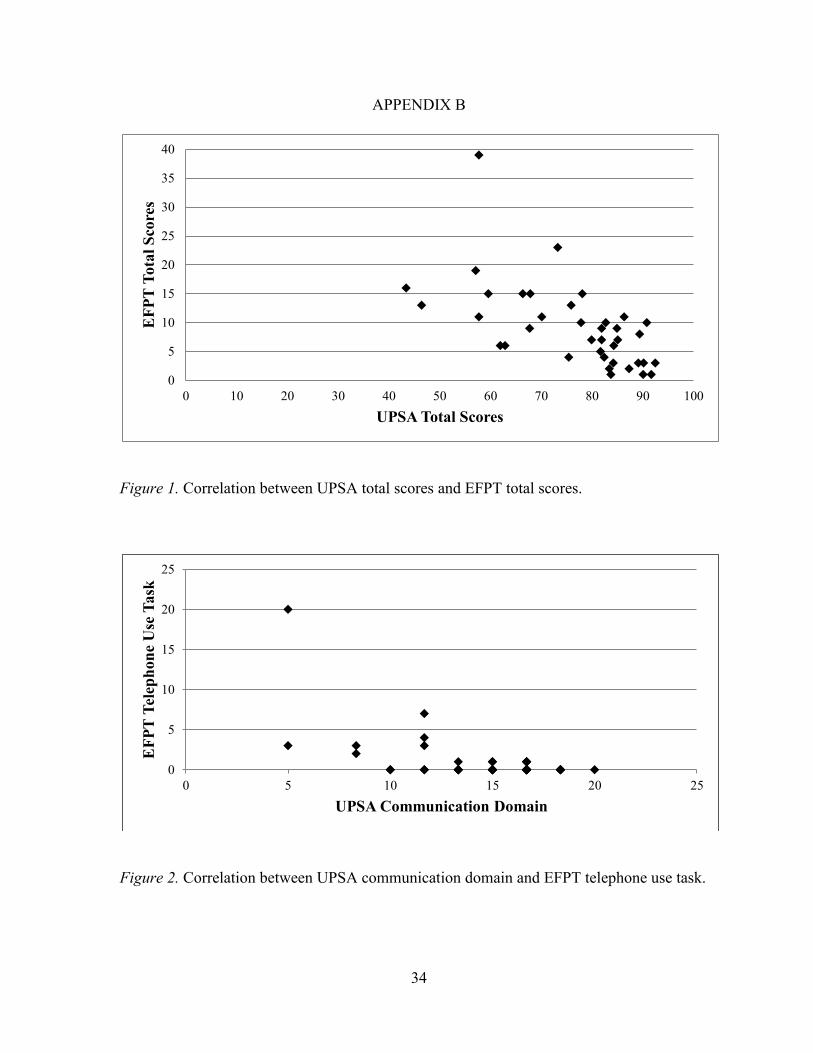
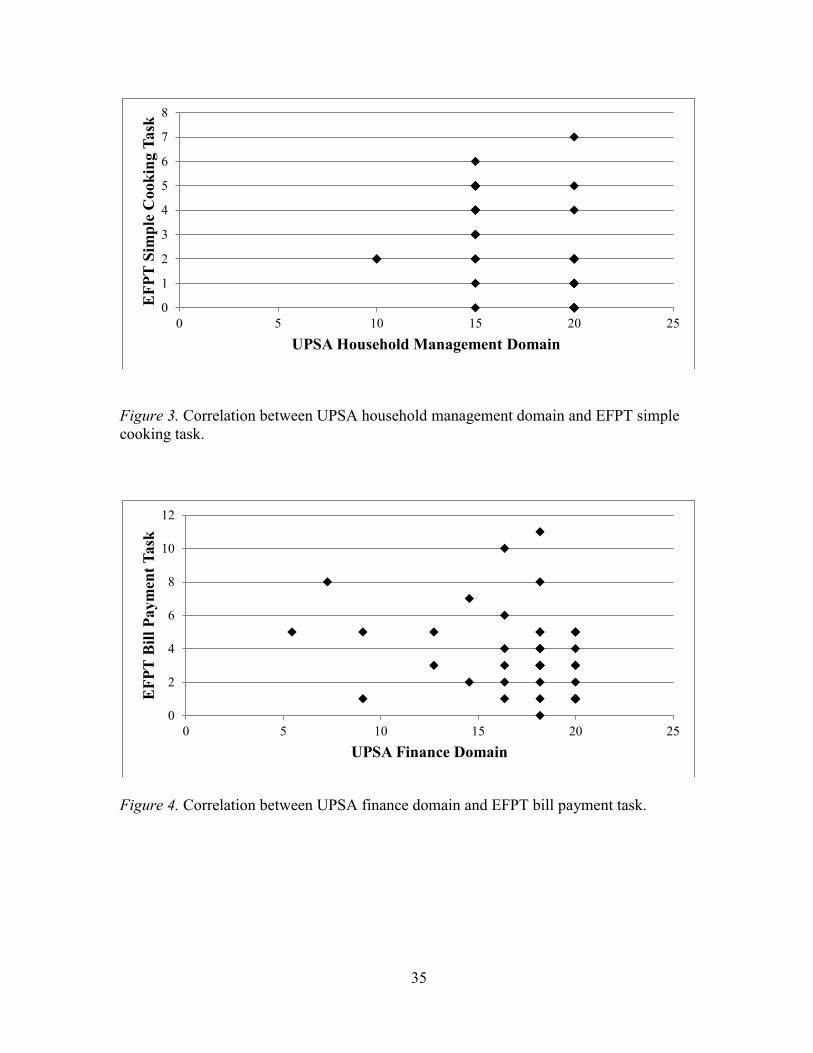
As hypothesized, a negative significant correlation was found between UPSA total scores
and EPFT total scores, r (37) = -.602, p <.001, as the two measures are scaled in opposite
directions. Also, significant negative correlations were found between the UPSA Communication
domain scores and the EFPT Telephone use task scores, r (37) = -.579, p <.001, and the UPSA
Household Management domain scores and EFPT Simple Cooking task scores, r (36) = -.391, p
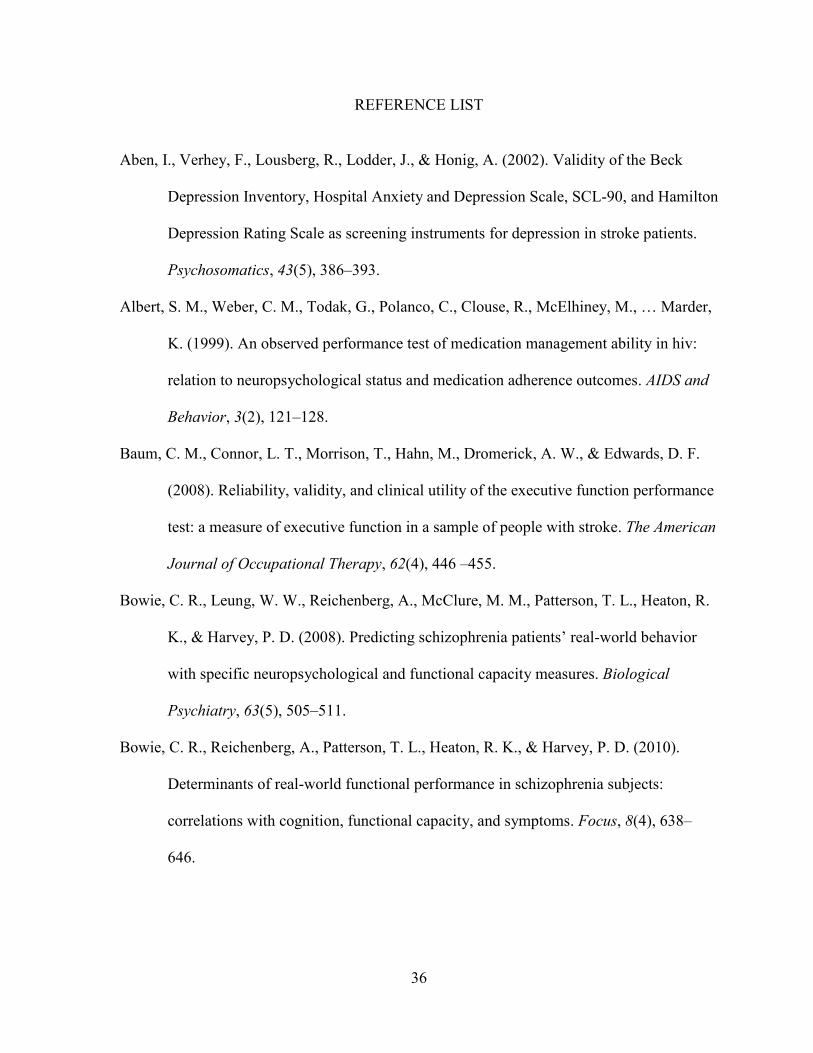
= .015. However, no significant correlation was found between the UPSA Finance domain scores
and the EFPT Bill Payment task scores, r (37) = -.272, p = .094. See Table 4 for the correlations
between the UPSA and EFPT in stroke survivors and Figures 1-4 for the scatterplots of these
correlations.
Hypothesis 3: Predicting social participation with UPSA scores
A hierarchical multiple regression analysis was conducted to test the hypothesis that total
UPSA scores would predict social participation. For this analysis age and years of education
were entered in step one, NIHSS (stroke severity) in step two, and UPSA total scores were
entered in step three.
Preliminary analysis suggested no violations of linearity and normality of the residuals.
Examination for outliers suggested the presence of one outlier. However, further investigation of
casewise diagnostics suggested no extreme cases influenced the model. The assumption of no
multicollinearity was upheld by examining the VIF and tolerance statistics. The assumption of
independent errors was met as examined via the Durbin-Watson statistic.
23
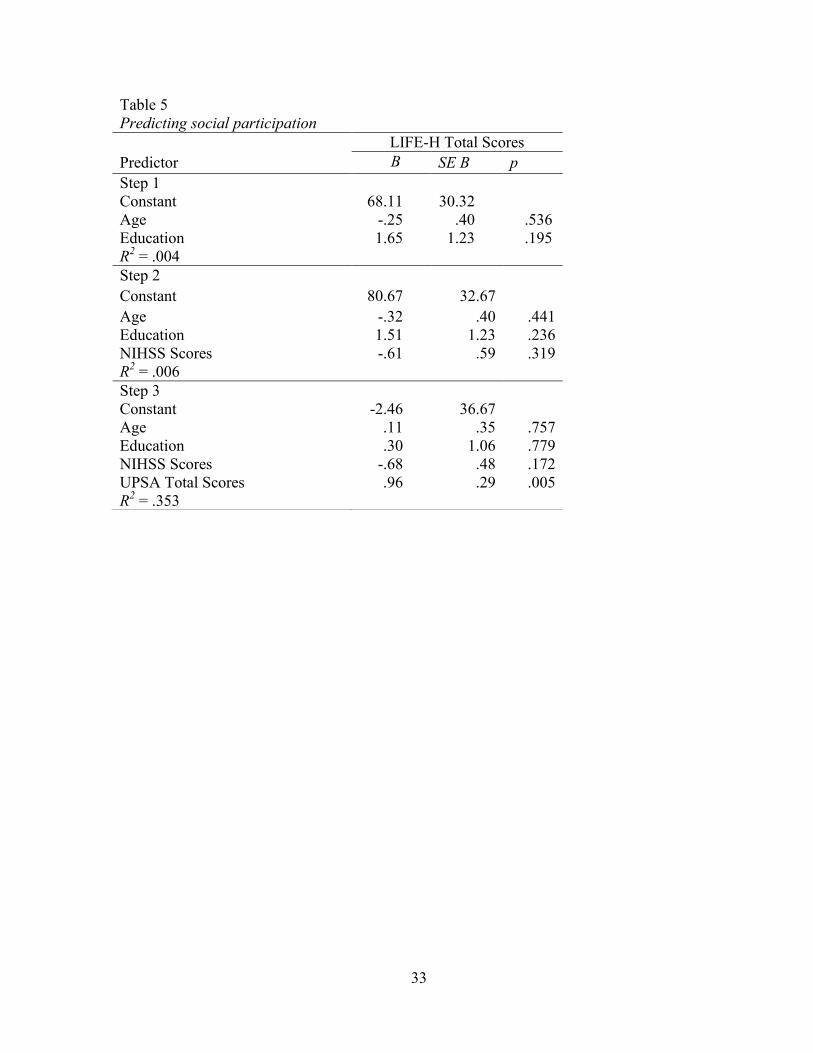
A hierarchical multiple regression was performed to assess the contribution of UPSA
total scores, over and above age, education, and NHISS to LIFE-H total score. In step 1, neither
age nor education were significant predictors of LIFE-H total score. In step 2, NIHSS score was
not a significant predictor of LIFE-H total scores. Lastly, in step 3 UPSA total score was a
significant predictor of LIFE-H total score, β=.96, t (18) = 3.26, p =.005, while age, education
and NIHSS remained non-significant. A significant R-square change in step 3 also indicated that
UPSA total score made a significant contribution to predicting LIFE-H scores, ∆R2=.33, F
change (1,17) = 10.64, p =.005, over and above age, education and NIHSS scores. The overall
regression including age, education, NIHSS scores, and total UPSA scores was statistically
significant, R2= .35, F (4,17) = 3.86, p = .021. Detailed results of this regression are summarized
in Table 5.
24
CHAPTER 4
DISCUSSION
The primary purpose of the present study was to assess the validity of the UCSD
Performance-based Skills Assessment for use with stroke survivors. The goal was to identify an
additional assessment that is feasible, acceptable and valid to predict daily life abilities among
stroke survivors.
Validity and Sensitivity of the UPSA
Using the EFPT as the standard against which to evaluate the UPSA, we predicted that
significant correlations would be observed between the two assessments. The relationship
between scores on the UPSA and the EFPT was found significant in stroke survivors.
Participants who had less difficulty performing the complete set of tasks in the EFTP also had
less difficulty on the UPSA, suggesting the UPSA and EFPT measure similar constructs. These
results provide support for the UPSA as valid assessment of functional ability in stroke
survivors, comparable to the EFPT.
Regarding the acceptability of the UPSA, overall stroke survivors reported that the
instructions for the UPSA subscales were clear and indicated no difficulties with the majority of
the tasks. However, stroke survivors did report difficulties with the transportation domain.
Participants reported this scale was confusing and therefore difficult to accomplish. Overall, the
UPSA was well accepted by our participants.
In addition to the significant relationship between the UPSA and the EFPT on total
scores, significant relationships were found between the EFPT Telephone task and the UPSA
Communication task, and the EFPT Simple Cooking task and UPSA Household Management
task, meaning these subtests measure similar constructs. However, no relationship was found
25
between the UPSA Finance domain and the EFPT Bill Paying task, suggesting this UPSA
domain may be measuring a different construct compared to the EFPT. A possible explanation
for these results is that the UPSA Finance domain measures knowledge of information and the
ability to work with money. Specifically, this task provides participants with simulated bills and
real coins and participants are asked to count specific amounts (e.g., $12.49, $6.73, $1.02) and to
make change from ten dollars. For the second part of this task participants are given a utility bill
and are asked to provide information included in the bill (e.g., check is written to utility
company, how much to pay, when to pay). In contrast to the UPSA, the EFPT Bill Paying task is
concerned with whether participants understand and can carry out the process of paying bills
(e.g., checking the balance, opening the mail) involving a number of different steps.
The difference between these two tasks illustrates a fundamental difference in the
principles and motivations that guided the design of the UPSA and the EFPT. Specifically, the
UPSA was developed with the goal of quantifying functional outcomes and improvements in
social disabilities and testing the skills and abilities needed to function independently in the
community. Also, the UPSA was developed to address the limitations of other approaches for
evaluating functioning (e.g., self-report, proxy reports) by collecting observable data in people
with schizophrenia (Patterson et al., 2001). In contrast to the UPSA, the EFPT had a more
limited purpose. It was designed to assess executive functional abilities (i.e., initiation,
organization, judgment and task completion) in an everyday context. The goal of the developers
of the EFPT was to create an ecologically valid assessment of executive functions in stroke
survivors (Baum et al., 2008) as a predictor of occupational performance and participation. Thus
the surface similarity of these two subscales (UPSA Finance and EFPT Bill Paying) may not
reflect the underlying differences produced by their different purposes.
26
Concerning the predictive validity of the UPSA, as hypothesized, stroke survivors’ Social
Participation was significantly predicted by UPSA total scores, controlling for age, education,
and stroke severity. These results suggests that stroke survivors with better performance on the
UPSA were more likely to have been reported via proxy as more socially engaged and as having
greater levels of participation. Specifically, stroke survivors with better performance on the
UPSA were reported to have less difficulty with activities related to nutrition, fitness, personal
care, communication, housing, mobility, responsibilities, interpersonal relationships, community
life, and recreation. These findings with the UPSA are consistent with previous work showing
everyday functioning to be related to an individual’s social engagement and participation
(Cardenas et al., 2008; Patterson & Mausbach, 2010).
Regarding our sensitivity analysis, surprisingly there were no differences between stroke
survivors’ and healthy controls’ performance in UPSA total scores and domain scores, except in
the transportation domain. In the case of the transportation domain, stroke survivors performed
less well than the healthy control participants. Interestingly, many of the stroke survivor
participants had reported that the transportation domain was difficult and confusing. This domain
appears to be sensitive to differences between stroke survivors and healthy controls; it would be
interesting for future research to identify the task components that distinguished the performance
of stroke survivors and healthy controls. Possible candidate components are task familiarity,
task complexity, and print size on the bus schedules, any one of which might be responsible for
the group differences.
There are several hypotheses that could explain the lack of differences between stroke
survivors and healthy controls on the UPSA total scores and domain scores. First, it may be that
the stroke survivors in our sample had only minor levels of disability, as suggested by low scores
27
on the NIH Stroke Scale. In addition, half of our stroke survivors were engaged at the American
Stroke Foundation (ASF) where they participate in a variety of activities designed to promote
functional independence. Stroke survivors who attend the ASF may be engaged in a number of
activities in the community as the Foundation promotes social engagement. Also, ASF
participants may be working to reduce disability and may have achieved levels of functioning not
different from healthy controls.
A second possibility is that the assistance provided to stroke survivors who experienced
physical difficulties during their performance of the UPSA reduced the sensitivity of the task.
For example, the examiner provided physical assistance to stroke survivors who had difficulties
writing the shopping list (household management domain), thus possibly decreasing task
sensitivity to stroke specific deficits. We may have inadvertently assessed stroke survivors’
knowledge of how tasks should be performed, rather than their actual ability to perform those
tasks.
Lastly, the lack of difference between healthy controls and stroke survivors could be
explained by possible functional difficulties experienced by our sample of healthy controls. The
data from the initial validation studies of the UPSA and EFPT were examined and it was found
the healthy controls in the present study scored significantly lower on UPSA and EFPT total
scores compared to the original UPSA (Patterson et al., 2001) and EFPT (Baum et al., 2008)
sample of healthy controls. In an effort to further examine the characteristics of our sample of
healthy older adults, we assessed their RBANS performance against RBANS norms. Healthy
controls in this study were performing in the average/above average range relative to RBANS
norms, suggesting that they were not experiencing cognitive difficulties. Stroke survivors
performed less well than healthy controls, and were in the average/below average range relative
28
to RBANS norms. Thus impaired cognition among the control participants does not appear to
explain the pattern of results found in this study. However, even though no differences were
found between stroke survivors and healthy controls, the UPSA was found to be related to other
measures of everyday functioning and social participation in stroke survivors. Future studies that
examine the suggested hypotheses may help to tease out the adequacy of these explanations.
Limitations and Future Directions
This study has limitations that are important to mention. The sample size of stroke
survivors, caregivers and healthy controls is small, therefore limiting the types and number of
analyses that could be conducted for this study. Specifically, the number of caregivers enrolled in
this study is low compared to the number of caregivers we planned to enroll. Caregivers for this
study were difficult to contact and schedule within the time constraints of the present study.
Also, social participation was assessed via caregiver report of the stroke survivor’s
functioning and was used as the outcome measure to assess the predictive validity of the UPSA.
Even though previous research has found agreement between proxies’ and stroke survivors
responses to the LIFE-H (Poulin & Desrosiers, 2008), assessing social participation via caregiver
report could be problematic in the interpretation of our findings as caregivers are not always
accurate judges of their care recipient’s abilities (Dassel & Schmitt, 2008). Therefore, future
studies should assess the predictive validity of the UPSA utilizing different real-world outcomes
(e.g., living independently in the community).
Lastly, a large number of stroke survivors were involved in the services provided by the
American Stroke Foundation. This could be problematic in the generalization of our findings
because stroke survivors involved in the American Stroke Foundation engage in a number of
classes such as balance, fitness, mobility, and stress management which have been found to
29
increase functioning in stroke survivors (Werner & Kessler, 1996). Therefore, future studies
should assess stroke survivors with broader range of stroke severity and stroke survivors who are
not currently involve in post-rehabilitation activities. Future studies can assess how these
samples of stroke survivors perform in the UPSA compared to healthy controls. This could
provide a better understanding of the UPSA’s sensitivity.
Conclusion
Although the UPSA provides a number of advantages to use with this population,
disadvantages of the UPSA are worthy of mention. The sensitivity of the UPSA in stroke
survivors needs further evaluation as no differences were found between stroke survivors and
healthy controls. Additionally, stroke survivors with severe motor, communication and cognitive
difficulties were unable to complete the UPSA, thus limiting the assessment of stroke survivors
with a full range of abilities. Finally, the everyday tasks assessed by the UPSA may be outdated
for a number of individuals as more of these tasks are being performed online (e.g., online
banking, shopping). However, the UPSA provides advantages for its use in this population
including: the limited amount of training needed to administer and score it, the portability of the
UPSA (e.g., requiring only a few easily-obtained materials that are easy to transport), and the
time of administration (i.e., 30 minutes). The UPSA could aid researchers, clinicians and
therapists in improving rehabilitation placement and effectiveness. In summary, findings from
this study offer preliminary support for the feasibility, acceptability and validity of the UPSA as
a performance-based measure of functional capacity in stroke survivors.
30
APPENDIX A
Table 1
Participant Characteristics
Participant Characteristics Stroke
Survivors
Healthy
Controls
Age at study enrollment, mean (SD) 62.75 (9.76) 68.90 (9.48)
Gender
Male 25 (62.5%) 14 (70.0%)
Female 15 (37.5%) 6 (30.0%)
Years of Education, mean (SD) 14.78 (2.92) 17.00 (2.94)
Marital Status
Never Married, n (%) 1 (2.5%) 3 (15.0%)
Cohabitating, n (%) 1 (2.5%) 0 (0.00%)
Divorced, n (%) 3 (7.5%) 5 (25.0%)
Married, n (%) 34 (85.0%) 12 (60.0%)
Civil Union, n (%) 1 (2.5%) 0 (0.00%)
Ethnicity
White, n (%) 33 (82.5%) 18 (90.0%)
Black, n (%) 3 (7.5%) 2 (10.0%)
Hispanic, n (%) 3 (7.5%) 0 (0.00%)
Other, n (%) 1 (2.5%) 0 (0.00%)
Handedness
Left, n (%) 3 (7.5%) 1 (5.3%)
Right, n (%) 37 (92.5%) 18 (94.7%)
Experienced Multiple Stroke
Yes, n (%) 11 (29.7%)
No, n (%) 26 (70.3%)
Type of Stroke
Ischemic Stroke, n (%) 18 (45.0%)
Hemorrhagic Stroke, n (%) 8 (20.0%)
Transient Ischemic Attack, n (%) 6 (15.0%
Don’t Know, n (%) 8 (20.0%)
Side of Stroke
Left, n (%) 13 (32.5%)
Right, n (%) 23 (57.5%)
Both, n (%) 1 (2.5%)
Does not know, n (%) 3 (7.5%)
Years Since Stroke, mean (SD) 6.25 (5.43)
Stroke Severity, mean (SD) 38.24 (10.22)
31
Table 2
Summary of acceptability ratings for the UPSA and EFPT
Clear
Instructions Fun Difficult Familiar Complex Simple Confusing
EFPT N % N % N % N % N % N % N %
Cooking 39 97.5% 11 27.5% 2 5.0% 17 42.5% 2 5.0% 28 70.0% 2 5.0%
Communication 40 100% 11 27.5% 4 10.0% 21 52.5% 2 5.0% 24 60.0% 2 5.0%
Medication 37 92.5% 4 10.0% 2 5.0% 22 55.0% 1 2.5% 21 52.5% 9 22.5%
Bills 38 95.0% 7 17.5% 8 20.0% 19 47.5% 10 25.0% 13 32.5% 7 17.5%
UPSA
Financial 40 100% 12 30% 6 15% 17 45.5% 5 12.5% 24 60% 3 7.5%
Communication 40 100% 4 10% 5 12.5% 22 55% 2 5.0% 24 60% 2 5.0%
Household 40 100% 15 37.5% 3 7.5% 20 50.0% 0 0.0% 29 72.5% 2 5.0%
Comprehension 39 97.5% 10 25% 15 37.5% 7 17.5% 9 22.5% 12 30% 5 12.5%
Transportation 33 82.5% 1 2.5% 21 52.5% 2 5.0% 16 40.0% 2 5.0% 21 52.5%
32
Table 3 UPSA and EFPT Means and Standard Deviations
Stroke Survivors Healthy Controls
UPSA Financial 16.91 (3.69) 18.64 (1.43)
UPSA Communication 14.21 (3.52) 15.92 (1.91)
UPSA Comprehension 15.50 (3.90) 15.93 (2.55)
UPSA Transportation 12.67 (3.53) 14.89 (2.61)
UPSA Household 17.38 (2.99) 16.50 (2.86)
UPSA Total 76.66 (12.68) 81.87 (6.39)
EFPT Cooking 2.37 (2.02) 1.63 (1.50)
EFPT Telephone 1.23 (3.41) 0.37 (0.96)
EFPT Medication 2.10 (2.19) 1.21 (1.58)
EFPT Bills 3.64 (2.58) 3.21 (1.40)
EFPT Total 9.28 (7.21) 6.42 (2.97)
Table 4
Correlations between UPSA and EFPT in Stroke Survivors
1 2 3 4 5 6 7 8
1. UPSA Total Scores --
2. UPSA Communication 0.74** --
3. UPSA Household 0.69** 0.35* --
4. UPSA Financial 0.75** 0.43** 0.45** --
5. EFPT Total Scores -0.60** -0.56** -0.35* -0.31 --
6. EFPT Telephone -0.45** -0.58** -0.26 -0.13 0.80** --
7. EFPT Cooking -0.45** -0.27 -0.40* -0.26 0.68** 0.38* --
8. EFPT Bills -0.48** -0.33* -0.30 -0.27 0.81** 0.51** 0.32 --
**p < .01 (2-tailed)
*p < .05 (2-tailed)
33
Table 5
Predicting social participation
LIFE-H Total Scores
Predictor B SE B p
Step 1
Constant 68.11 30.32
Age -.25 .40 .536
Education 1.65 1.23 .195
R2 = .004
Step 2
Constant 80.67 32.67
Age -.32 .40 .441
Education 1.51 1.23 .236
NIHSS Scores -.61 .59 .319
R2 = .006
Step 3
Constant -2.46 36.67
Age .11 .35 .757
Education .30 1.06 .779
NIHSS Scores -.68 .48 .172
UPSA Total Scores .96 .29 .005
R2 = .353
34
APPENDIX B
Figure 1. Correlation between UPSA total scores and EFPT total scores.
Figure 2. Correlation between UPSA communication domain and EFPT telephone use task.
0
5
10
15
20
25
30
35
40
0 10 20 30 40 50 60 70 80 90 100
EF
PT
Tota
l S
core
s
UPSA Total Scores
0
5
10
15
20
25
0 5 10 15 20 25
EF
PT
Tel
eph
on
e U
se T
ask
UPSA Communication Domain
35
Figure 3. Correlation between UPSA household management domain and EFPT simple
cooking task.
Figure 4. Correlation between UPSA finance domain and EFPT bill payment task.
0
1
2
3
4
5
6
7
8
0 5 10 15 20 25
EF
PT
Sim
ple
Cook
ing T
ask
UPSA Household Management Domain
0
2
4
6
8
10
12
0 5 10 15 20 25
EF
PT
Bil
l P
aym
ent
Task
UPSA Finance Domain
36
REFERENCE LIST
Aben, I., Verhey, F., Lousberg, R., Lodder, J., & Honig, A. (2002). Validity of the Beck
Depression Inventory, Hospital Anxiety and Depression Scale, SCL-90, and Hamilton
Depression Rating Scale as screening instruments for depression in stroke patients.
Psychosomatics, 43(5), 386–393.
Albert, S. M., Weber, C. M., Todak, G., Polanco, C., Clouse, R., McElhiney, M., … Marder,
K. (1999). An observed performance test of medication management ability in hiv:
relation to neuropsychological status and medication adherence outcomes. AIDS and
Behavior, 3(2), 121–128.
Baum, C. M., Connor, L. T., Morrison, T., Hahn, M., Dromerick, A. W., & Edwards, D. F.
(2008). Reliability, validity, and clinical utility of the executive function performance
test: a measure of executive function in a sample of people with stroke. The American
Journal of Occupational Therapy, 62(4), 446 –455.
Bowie, C. R., Leung, W. W., Reichenberg, A., McClure, M. M., Patterson, T. L., Heaton, R.
K., & Harvey, P. D. (2008). Predicting schizophrenia patients’ real-world behavior
with specific neuropsychological and functional capacity measures. Biological
Psychiatry, 63(5), 505–511.
Bowie, C. R., Reichenberg, A., Patterson, T. L., Heaton, R. K., & Harvey, P. D. (2010).
Determinants of real-world functional performance in schizophrenia subjects:
correlations with cognition, functional capacity, and symptoms. Focus, 8(4), 638–
646.
37
Brott, T., Adams, H. P., Olinger, C. P., Marler, J. R., Barsan, W. G., Biller, J., … Hertzberg,
V. (1989). Measurements of acute cerebral infarction: a clinical examination scale.
Stroke, 20(7), 864–870.
Cardenas, V., Mausbach, B. T., Barrio, C., Bucardo, J., Jeste, D., & Patterson, T. (2008). The
relationship between functional capacity and community responsibilities in middle-
aged and older Latinos of Mexican origin with chronic psychosis. Schizophrenia
Research, 98(1–3), 209–216.
Carod-Artal, J., Egido, J. A., González, J. L., & Varela de Seijas, E. (2000). Quality of life
among stroke survivors evaluated 1 year after stroke : experience of a stroke unit.
Stroke, 31(12), 2995 –3000.
D’Olhaberriague, L., Litvan, I., Mitsias, P., & Mansbach, H. H. (1996). A reappraisal of
reliability and validity studies in stroke. Stroke, 27(12), 2331–2336.
Dassel, K. B., & Schmitt, F. A. (2008). The impact of caregiver executive skills on reports of
patient functioning. The Gerontologist, 48(6), 781–792.
Depp, C. A., Mausbach, B. T., Eyler, L. T., Palmer, B. W., Cain, A. E., Lebowitz, B. D., …
Jeste, D. V. (2009). Performance-based and subjective measures of functioning in
middle-aged and older adults with bipolar disorder. The Journal of Nervous and
Mental Disease, 197(7), 471–475.
Desrosiers, J., Noreau, L., Robichaud, L., Fougeyrollas, P., Rochette, A., & Viscogliosi, C.
(2004). Validity of the assessment of life habits in older adults. Journal of
Rehabilitation Medicine, 36(4), 177–182.
Geyh, S., Kurt, T., Brockow, T., Cieza, A., Ewert, T., Omar, Z., & Resch, K.-L. (2004).
Identifying the concepts contained in outcome measures of clinical trials on stroke
38
using the international classification of functioning, disability and health as a
reference. Journal of Rehabilitation Medicine, 36, 56–62.
Goldberg, T. E., Koppel, J., Keehlisen, L., Christen, E., Dreses-Werringloer, U., Conejero-
Goldberg, C., … Davies, P. (2010). Performance-based measures of everyday
function in mild cognitive impairment. The American Journal of Psychiatry, 167(7),
845–853.
Goverover, Y., Kalmar, J., Gaudino-Goering, E., Shawaryn, M., Moore, N. B., Halper, J., &
DeLuca, J. (2005). The relation between subjective and objective measures of
everyday life activities in persons with multiple sclerosis. Archives of Physical
Medicine and Rehabilitation, 86(12), 2303–2308.
Hannerz, H., & Nielsen, M. L. (2001). Life expectancies among survivors of acute
cerebrovascular disease. Stroke, 32(8), 1739–1744.
Harvey, P. D., Velligan, D. I., & Bellack, A. S. (2007). Performance-based measures of
functional skills: usefulness in clinical treatment studies. Schizophrenia Bulletin,
33(5), 1138–1148.
Heaton, R. K., Marcotte, T. D., Mindt, M. R., Sadek, J., Moore, D. J., Bentley, H., … Grant,
I. (2004). The impact of HIV-associated neuropsychological impairment on everyday
functioning. Journal of the International Neuropsychological Society: JINS, 10(3),
317–331.
Katz, N., Tadmor, I., Felzen, B., & Hartman-Maeir, A. (2007). Validity of the Executive
Function Performance Test in individuals with schizophrenia. OTJR: Occupation,
Participation, and Health, 27(2), 44–51.
39
Kim, P., Warren, S., Madill, H., & Hadley, M. (1999). Quality of life of stroke survivors.
Quality of Life Research, 8(4), 293–301.
Lloyd-Jones, D., Adams, R. J., Brown, T. M., Carnethon, M., Dai, S., De Simone, G., …
(2010). Heart disease and stroke statistics—2010 update. Circulation, 121(7), e46 –
e215.
Loewenstein, D. A., Amigo, E., Duara, R., Guterman, A., Hurwitz, D., Berkowitz, N., …
Eisdorfer, C. (1989). A new scale for the assessment of functional status in
Alzheimer’s Disease and related disorders. Journal of Gerontology, 44(4), 114–121.
Mausbach, B. T., Bowie, C. R., Harvey, P. D., Twamley, E. W., Goldman, S. R., Jeste, D. V.,
& Patterson, T. L. (2008). Usefulness of the UCSD performance-based skills
assessment (UPSA) for predicting residential independence in patients with chronic
schizophrenia. Journal of Psychiatric Research, 42(4), 320–327.
Mayo, N. E., Wood-Dauphinee, S., Gordon, C., Higgins, J., Mcewen, S., & Salbach, N.
(1999). Disablement following stroke. Disability & Rehabilitation, 21(5/6), 258–268.
Moore, D. J., Palmer, B. W., Patterson, T. L., & Jeste, D. V. (2007). A review of
performance-based measures of functional living skills. Journal of Psychiatric
Research, 41(1–2), 97–118.
Noreau, L. (2004). Measuring social participation: reliability of the LIFE-H in older adults
with disabilities. Disability & Rehabilitation, 26(6), 346–352.
Patterson, T. L., Goldman, S., McKibbin, C. L., Hughs, T., & Jeste, D. V. (2001). UCSD
performance-based skills assessment: development of a new measure of everyday
functioning for severely mentally ill adults. Schizophrenia Bulletin, 27(2), 235 –245.
40
Patterson, T. L., & Mausbach, B. T. (2010). Measurement of functional capacity: a new
approach to understanding functional differences and real-world behavioral
adaptation in those with mental illness. Annual Review of Clinical Psychology, 6,
139–154.
Poulin, V., & Desrosiers, J. (2008). Participation after stroke: comparing proxies’ and
patients’ perceptions. Journal of Rehabilitation Medicine: Official Journal of the
UEMS European Board of Physical and Rehabilitation Medicine, 40(1), 28–35.
Sadek, J. R., Stricker, N., Adair, J. C., & Haaland, K. Y. (2011). Performance-based
everyday functioning after stroke: relationship with IADL questionnaire and
neurocognitive performance. Journal of the International Neuropsychological
Society, 17(05), 832–840.
Twamley, E. W., Doshi, R. R., Nayak, G. V., Palmer, B. W., Golshan, S., Heaton, R. K., …
Jeste, D. V. (2002). Generalized cognitive impairments, ability to perform everyday
tasks, and level of independence in community living situations of older patients with
psychosis. The American Journal of Psychiatry, 159(12), 2013–2020.
Üstün, T. B. C. (2003). The International Classification of Functioning, Disability and
Health: a new tool for understanding disability and health. Disability &
Rehabilitation, 25, 565.
Werner, R. A., & Kessler, S. M. (1996). Effectiveness of an intensive outpatient
rehabilitation program for postacute stroke patients1. Journal of Physical Medicine,
75(2), 114–120.
41
VITA
Denisse Tiznado was born on September 19, 1988, in San Diego, California. She
attended elementary school in Mexico and returned with her family to Chula Vista,
California where she attended local middle school and high school. Denisse graduates from
Eastlake High School in 2006. Denisse attended Southwestern Community College where
she earned an Associate of Arts degree in 2008 with a major in Transfer Studies. She then
transferred to San Diego State University (SDSU) where she graduated summa cum laude, in
2011. Her degree was a Bachelor of Arts degree in Psychology. Denisse was also a member
of the SDSU McNair Scholars Program and the NIMH funded Career Opportunities in
Research Scholars Program during 2009 through 2011.
Prior to graduating from SDSU, Denisse was accepted to the Clinical Health
Psychology doctoral program at the University of Missouri-Kansas City (UMKC), which she
began in August, 2011. Since that time, Denisse has been involved in research assessing
everyday functioning in stroke survivors. Additionally, Denisse is the co-principal
investigator of a project designed to develop a self-efficacy of health literacy measure.
Denisse has completed and collaborated in multiple research projects that has presented in
national research conferences. She is a member of the Gerontological Society of America,
American Psychological Association and the Society of Behavioral Medicine.