Embed Size (px)
Citation preview

Dr. Peter M. Vallone GWU November 12, 2010
http://www.cstl.nist.gov/biotech/strbase/pub_pres/ValloneGWU2010.pdf 1
DNA as a Biometric
Dr. Peter M. ValloneNational Institute of Standards and Technology
George Washington Universityg g yWashington, D.C.
Friday November 12, 2010
[email protected] (301) 975-4872
Outline
• What is a Biometric?
• Rapid PCR Protocols
• DNA Typing on Integrated Systems

Dr. Peter M. Vallone GWU November 12, 2010
http://www.cstl.nist.gov/biotech/strbase/pub_pres/ValloneGWU2010.pdf 2
What is a Biometric?
Method for uniquely recognizing humans based upon one or more intrinsic physical or behavioral traits
Jain, A. K.; Ross, Arun; Prabhakar, Salil (January 2004), "An introduction to biometric recognition", IEEE Transactions on Circuits and Systems for Video Technology 14th (1): 4–20
Current BiometricsSome commonly measured features
• Physical– Fingerprints (Palm/hand geometry)– Iris, retinal– Face– Odor/scent– DNA?
• Behavioral– Gait
V i– Voice– Vein (IR thermogram)
– Hand geometry– Handwriting
Dr. Peter M. Vallone GWU November 12, 2010
http://www.cstl.nist.gov/biotech/strbase/pub_pres/ValloneGWU2010.pdf 3
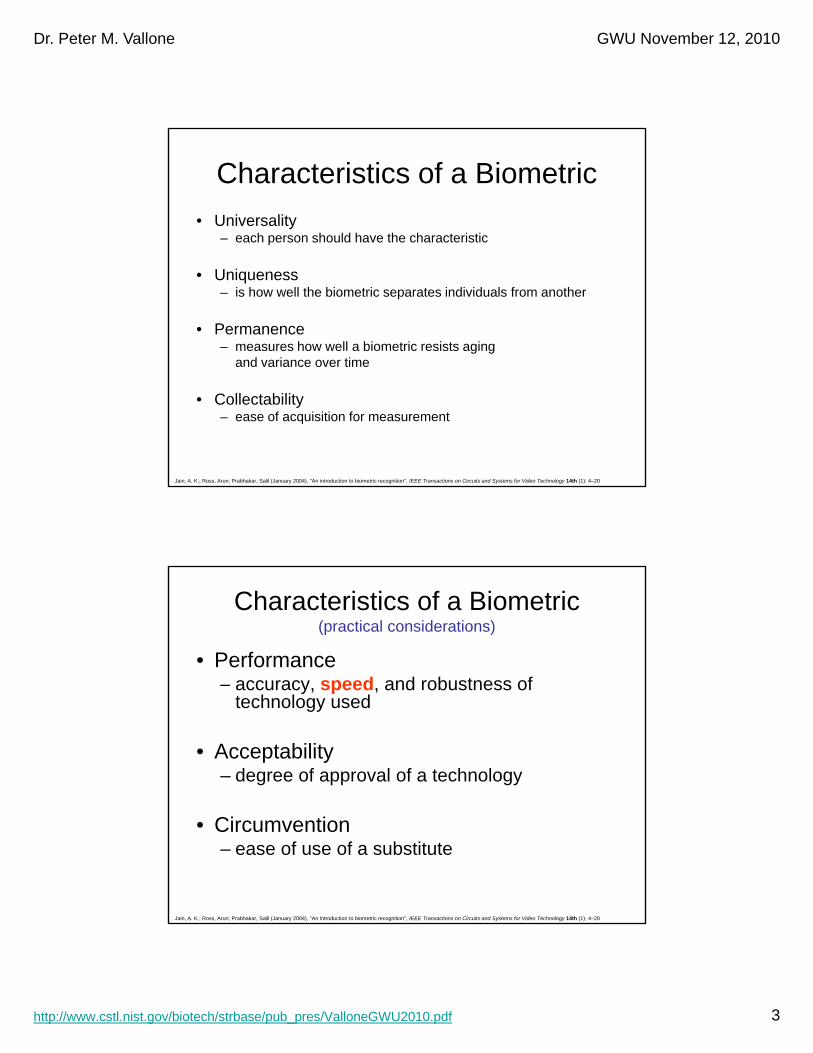
Characteristics of a Biometric• Universality
– each person should have the characteristic
• Uniqueness– is how well the biometric separates individuals from another
• Permanence– measures how well a biometric resists aging
and variance over time
• Collectability– ease of acquisition for measurement
Jain, A. K.; Ross, Arun; Prabhakar, Salil (January 2004), "An introduction to biometric recognition", IEEE Transactions on Circuits and Systems for Video Technology 14th (1): 4–20
Characteristics of a Biometric(practical considerations)
• Performance– accuracy speed and robustness of– accuracy, speed, and robustness of
technology used
• Acceptability– degree of approval of a technology
• Circumvention – ease of use of a substitute
Jain, A. K.; Ross, Arun; Prabhakar, Salil (January 2004), "An introduction to biometric recognition", IEEE Transactions on Circuits and Systems for Video Technology 14th (1): 4–20

Dr. Peter M. Vallone GWU November 12, 2010
http://www.cstl.nist.gov/biotech/strbase/pub_pres/ValloneGWU2010.pdf 4
Modes of Use• Enrollment – Capturing and storing the biometric
into a databaseinto a database
• Verification – A one to one comparison of a captured biometric with a stored template to verify/confirm identity
• Identification – A one to many comparison of the captured biometric against a biometric database in attempt to identify an unknown individual
Enrollment
Verification
Identification

Dr. Peter M. Vallone GWU November 12, 2010
http://www.cstl.nist.gov/biotech/strbase/pub_pres/ValloneGWU2010.pdf 5
Biometric Forensic?
Person Biometric Event
Event Forensic Person
• Pre-event • Verification
Biometric Forensic?
• Verification• Identification• Rapid answer – real time• Cooperative – non intrusive• High quality, (not necessarily) stored (quality capture)• Post EventPost Event• Application to legal issues/problems• Evidence from an event is analyzed off line afterwards• Non-cooperative (mask evidence), intrusive • Data stored

Dr. Peter M. Vallone GWU November 12, 2010
http://www.cstl.nist.gov/biotech/strbase/pub_pres/ValloneGWU2010.pdf 6
DNA Typing as a Biometric
• High level of accuracy (Gold Standard)
• Expensive
Advantages Challenges
(Gold Standard)
• Solid foundation of Forensic DNA Testing (pop stats, molecular biology, court acceptance, protocols, training, education)
• Kinship determination (unique to DNA)
P t ti l f
• Time consuming
• Sample collection (invasive, stability issues)
• Technical expertise required for analysis
• Potential use for:– Phenotype (traits; eye/hair color)– Ancestry
• Low level template, mixtures, PCR inhibition
• Policy/Privacy/Ethical issues
Steps in Forensic DNA AnalysisUsually 1-2 day process (a minimum of ~8 hours)
DNA Extraction
Multiplex PCR Amplification
Sample Collection & Storage
Buccal swabBlood StainDNA
Quantitation
Statistics Calculated
DNA Database search
Biol
ogy
tics
Interpretation of Results
Paternity testReference sample
Applied Use of Information
STR Typing
DNA separation and sizing
Tech
nolo
gyGene
t

Dr. Peter M. Vallone GWU November 12, 2010
http://www.cstl.nist.gov/biotech/strbase/pub_pres/ValloneGWU2010.pdf 7
Full Profile (Good Quality)4000RFUs
Same DNA with Different Quality
Partial Profile (Poor Quality)600
Smaller sized DNA fragments type With degraded DNA samples
Signal Strength is Lower
RFUsfragments type With degraded DNA samples,
information is simply lost at the larger sized STR loci
Typing “1 ng” degraded DNA
At very low amounts of DNA template results are
not reproducible
5 replicates of typing
Locus 1 (FGA) Locus 2 (CSF1PO)
Low Levels of DNA Template
5 replicates of typing 10 pg of DNA are shown
ArtifactsDrop out (false negative)Drop in (false positive)
Peak imbalanceHigh stutter
No result
PowerPlex 16 HS (10 pg @ 34 cycles)

Dr. Peter M. Vallone GWU November 12, 2010
http://www.cstl.nist.gov/biotech/strbase/pub_pres/ValloneGWU2010.pdf 8
Single Source SampleLocus 1 Locus 2 Locus 3 Locus 4 Locus 5
16,16 9,9.3 8,12 9,9 17,19
Mixture Interpretation – A Major Challenge…
One or two peaks observed at each locus (tested DNA region)
Mixture SampleLocus 1 Locus 2 Locus 3 Locus 4 Locus 5
Different possible combinations could have given rise to the particular mixture observed
More than two peaks observed at more than two loci (tested DNA regions)
Biometric Sample Collection
• Similar to collecting a reference sample– Single source, human specific– No quantitation
• Collected on site (buccal swab)Not sample limited– Not sample limited
• > 100 ng of template DNA– No mixtures, no LCN, no inhibitors

Dr. Peter M. Vallone GWU November 12, 2010
http://www.cstl.nist.gov/biotech/strbase/pub_pres/ValloneGWU2010.pdf 9
Interest in Rapid DNA Typing• DoD (field testing, rapid intelligence, mass fatalities)
• DHS (kinship determination border security immigration)DHS (kinship determination, border security, immigration)
• DoJ (law enforcement, initial information)• Industry (security, authentication)
• Each customer will have specific requirements– sample input– information output– degrees of ‘accuracy’
The time required for generating a STR profile will
have to be significantly reduced
Immigration TestingU.S. Department of Homeland Security
U.S. anchor
Anchor may sponsor up to 15 relatives (spouse, parents, siblings, children)
79% of refugee claims were fraudulent based on DNA testing or failure to appear for DNA testing (U.S. Dept. of State)
DHS is looking to require DNA to support relationship claims

Dr. Peter M. Vallone GWU November 12, 2010
http://www.cstl.nist.gov/biotech/strbase/pub_pres/ValloneGWU2010.pdf 10
Kinship Testing• DNA profiles can also be used to evaluate
the probability of a specific familialthe probability of a specific familial relationship
• As a familial relationship becomes more distant, the ability of DNA to confirm the likelihood of that relationship decreases
1. Parent-offspring p g2. Siblings3. Half siblings = uncle/nephew = grandchild4. Cousins
Allele Sharing Probabilities
Relationship 0 alleles 1 alleles 2 allelesP t hild 0 1 0Parent-child 0 1 0Full siblings 1/4 1/2 1/4Half siblings 1/2 1/2 0Cousins 3/4 1/4 0Uncle-nephew 1/2 1/2 0Grandparent-grandchild 1/2 1/2 0

Dr. Peter M. Vallone GWU November 12, 2010
http://www.cstl.nist.gov/biotech/strbase/pub_pres/ValloneGWU2010.pdf 11
Dad
Autosomal Paternity Example
Mom
MeMe
Sister
Likelihood Ratio
• Examining or counting shared alleles is lit tiqualitative
• Likelihood ratio can be used to help quantify the information
Probability of the evidence (genotypes) given a particular hypothesis Probability of the evidence (genotypes) given an alternative hypothesisLR =

Dr. Peter M. Vallone GWU November 12, 2010
http://www.cstl.nist.gov/biotech/strbase/pub_pres/ValloneGWU2010.pdf 12
Posing a Hypothesis• Basic equations for calculating LR are
known• Available in the literature and in
i l fcommercial software• Requirements:• Genotypes of individuals being tested• Allele frequencies for the loci involved
in the testing• Two Hypotheses!
Prob. of observing the genotypes for 19 and 34 given that they are parent–offspringProb. of observing the genotypes for 19 and 34 given that they are unrelatedLR =
Likelihood Ratios with 15 Loci
Comparison LR for LR for LR for Comparison 34 & 19 18 & 19 34 & 10Parent-Child 1.28E+06
Full Siblings 2.76E+07
Half Siblings
Cousins
Uncle-Nephew 6.65E-01
GrandparentGrandparent-Grandchild
Parent/Child
FullSibs
Uncle/Nephew
LR calculations were performed with GeneMarker HIDv1.90

Dr. Peter M. Vallone GWU November 12, 2010
http://www.cstl.nist.gov/biotech/strbase/pub_pres/ValloneGWU2010.pdf 13
DNA Analysis Approaches (non-integrated)
Collection
Steps Involved Traditional Protocols
Rapid Improvements(Direct PCR)
Rapid Improvements
(Buccal)
Extraction
Quantitation
Amplification
Separation/D t ti
1.5 hours
1.5 hours
3.5 hours
1 hour
Manual
qPCR
3 hour
1 hour
Using PowerPlex 16 HS or Identifiler Direct for direct amplification from a
1.2mm blood punch
1.5 hours
<36 min.
1 hour
Automated ExtractionQiagen EZ1 Advanced
Rapid PCR conditions
Blood Stain
30 min.
DataInterpretation
Detection
Total Time
1 hour
Minimum ~7.5 hours
Capillary ElectrophoresisABI 3130xl
1 hour
~4 hours
1 hour
~4 hours
Time may vary depending on software, sample quality and analyst expertise
1.2mm Blood Punch on 903
Direct PCRPowerPlex16 HS (25 μL reaction, 32 cycles)
1.2 mm blood punch (903 paper)
25ul PP16HS rxn, standard cycling (32cyc)
Bypass extraction3 hour PCR amplification

Dr. Peter M. Vallone GWU November 12, 2010
http://www.cstl.nist.gov/biotech/strbase/pub_pres/ValloneGWU2010.pdf 14
Direct PCRPowerPlex16 HS (25 μL reaction, 32 cycles)
1.2 mm saliva punch (903 paper)
Saliva transferred to 903 paper3 hour PCR amplification
Recent Work with Rapid PCR
Developing rapid PCR protocols M lti l lifi ti f STR kit i 20 30 iMultiplex amplification of STR kits in 20 - 30 min
~3.5 h•Evaluating faster polymerases
•Faster thermal cyclers~20 min?
Multiplex PCR Amplification•Deviating from standard STR typing kit protocols

Dr. Peter M. Vallone GWU November 12, 2010
http://www.cstl.nist.gov/biotech/strbase/pub_pres/ValloneGWU2010.pdf 15
DNA Polymerases
• Takara– SpeedStar
General characteristicsSpeedSta
• Fermentas– PyroStart Master Mix
• QiagenQIAGEN Fast Cycling PCR Kit
2 - 5x faster processivity than TaqGold
1-5 min hot start at 95oC
Minimal post-cycling ‘soak’
– QIAGEN Fast Cycling PCR Kit
• New England Biolabs/Finnzymes– Phusion DNA Polymerases
Thermal Cyclers
Cepheid SmartCyclerRamp rate = 10oC/s
Eppendorf Mastercycler pro
Ramp rate = 6oC/sec
Ramp rate 10 C/s
Qiagen Rotor-Gene
Ramp rate = 15oC/s

Dr. Peter M. Vallone GWU November 12, 2010
http://www.cstl.nist.gov/biotech/strbase/pub_pres/ValloneGWU2010.pdf 16
PCR Thermal Cycling Profile28 cycles of PCR
95oC10 min
95oC1 min 58oC
1 min
72oC1 min
60oC60 min
95oC 95oC 72oC 72oC95 C58oC
72oC 72oC1 min 5 s
10 s10 s 1 min
Sub 36 min run time
Maximum heating rate of ~4 to 10oC/s (cycler dependent)
36 Minute PCR Amplificationon AB 9700 Cycler
• All peaks above 150 RFU threshold
• D21S11 & D19S433 weakest signal
• Evaluate inter- and intra-locus signal balance, incomplete adenylation & stutter %
28 cycles, Identifiler STR kit, 1 ng of DNA, 10 μL rxn volume
• Further optimization will rely on increasing specific primer pair concentrations

Dr. Peter M. Vallone GWU November 12, 2010
http://www.cstl.nist.gov/biotech/strbase/pub_pres/ValloneGWU2010.pdf 17
36 Minute PCR Amplificationon Rotor-Gene Cycler
28 cycles, Identifiler STR kit, 1 ng of DNA, 10 μL rxn volume
20 Minute PCR Amplificationon Cepheid Cycler
28 cycles, Identifiler STR kit, 1 ng of DNA, 10 μL rxn volume

Dr. Peter M. Vallone GWU November 12, 2010
http://www.cstl.nist.gov/biotech/strbase/pub_pres/ValloneGWU2010.pdf 18
19 Minute PCR Amplificationon Eppendorf Cycler
28 cycles, Identifiler STR kit, 1 ng of DNA, 10 μL rxn volume
Rapid PCR Article
Vallone P M Hill C R Butler J M (2008) Demonstration of rapid multiplex PCRVallone, P.M., Hill, C.R., Butler, J.M. (2008) Demonstration of rapid multiplex PCR amplification involving 16 genetic loci. FSI Genetics 3(1): 42-45.
Rapid PCR Amplification of STR Typing Kits 20th Annual International Symposium on Human Identification (Promega Meeting) October 14, 2009, Las Vegas, NV
Rapid Amplification of Commercial STR Typing Kits, International Society of Forensic Genetics (ISFG), September 16, 2009, Buenos Aires, Argentina
http://www.cstl.nist.gov/biotech/strbase/NISTpub.htm

Dr. Peter M. Vallone GWU November 12, 2010
http://www.cstl.nist.gov/biotech/strbase/pub_pres/ValloneGWU2010.pdf 19
Rapid PCR of STRs on a chip-based thermal cycler
• Multiplex amplifications in microfluidic biochip-based thermal cycler in 17.3 min
• Full CODIS-compatible profiles were generated using the Profiler Plus ID, COfiler and Identifiler primer sets
Profiler Plus® ID Profile
Giese et. al., Fast Multiplexed Polymerase Chain Reaction for Conventional and Microfluidic Short Tandem Repeat Analysis J Forensic Sci, Vol. 54, 1287-1296

Dr. Peter M. Vallone GWU November 12, 2010
http://www.cstl.nist.gov/biotech/strbase/pub_pres/ValloneGWU2010.pdf 20
Current State of Rapid PCR Protocols
• Rapid amplification of at least 16 loci is possible – 17.3 minutes
• Faster DNA polymerases and thermal cyclers are required
• Optimized rapid STR typing kits could be produced for– chip based thermal cyclers – standard bench top cyclersp y
• Success with ~1 ng of DNA template (single source)
• Sub 45 minute PCR will be essential for rapid typing in a integrated/ portable system
Goals for Rapid DNA Typing Systems
• Develop an integrated system capable of performing DNA testing in less than 1 hourperforming DNA testing in less than 1 hour
• Little user interaction (or experience)• Rugged• Robust Swab in…answer out
• Simple data interpretation• 4-16 samples per run• Disposable chips (with reagents on board)

Dr. Peter M. Vallone GWU November 12, 2010
http://www.cstl.nist.gov/biotech/strbase/pub_pres/ValloneGWU2010.pdf 21
Collection
Extraction
Steps Involved
Rapid extraction (solid or liquid phase?)
Buccal swab, blood, other?
~15 min
DNA Analysis Approach (integrated)Challenges
Target Times
Extraction
Quantitation
Amplification
Separation/ Resolution reproducibility sensitivity post-run signal processing
Rapid PCR amplification of a commercial STR kitLocus balance, stutter, adenylation, heterozygote balance, reproducibility
Reagents stable and compatible with device
Can be skipped for a reference sample BUTDoes the extraction method allow for a target amount of DNA to be released?
~1 ng
15 min
~20-30 min
~20 min
DataInterpretation
Detection
Total Time
Expert system software? How much user intervention is needed?
Resolution, reproducibility, sensitivity, post-run signal processing
Can rapid typing be performed reproducibly and accurately?Cost efficient? (instrumentation, reagents, consumables)
General challenge of going from macro scale to micro scale!
20 min
~1 hour
Rapid DNA Typing Systems Under Development
• Systems are currently under development and are notSystems are currently under development and are not yet commercially available
• Network Biosystems (Woburn, MA)http://www.netbio.com
• ZyGEM and Lockheed Martin (Charlottesville,VA)http://www.zygem.com
• IntegenX (Pleasanton, CA)h // ihttp://www.integenx.com
• Forensic Science Service (UK)http://www.forensic.gov.uk/
Use of DNA as a Biometric Tool American Academy of Forensic Science, Feb 22, 2010, Seattle, WAhttp://www.cstl.nist.gov/biotech/strbase/NISTpub.htm
Biometrics Consortium Conference September, 2010 Tampa, FL http://www.biometrics.org/bc2010/program.pdf

Dr. Peter M. Vallone GWU November 12, 2010
http://www.cstl.nist.gov/biotech/strbase/pub_pres/ValloneGWU2010.pdf 22
Microchip Biotechnologies, Inc. (slide courtesy of Helen Franklin)
Microchip Biotechnologies, Inc. (slide courtesy of Helen Franklin)

Dr. Peter M. Vallone GWU November 12, 2010
http://www.cstl.nist.gov/biotech/strbase/pub_pres/ValloneGWU2010.pdf 23
Microchip Biotechnologies, Inc. (slide courtesy of Helen Franklin)
Network Biosystems (slide courtesy of Dr. Eugene Tan)

Dr. Peter M. Vallone GWU November 12, 2010
http://www.cstl.nist.gov/biotech/strbase/pub_pres/ValloneGWU2010.pdf 24
Network Biosystems (slide courtesy of Dr. Eugene Tan)
Network Biosystems (slide courtesy of Dr. Eugene Tan)

Dr. Peter M. Vallone GWU November 12, 2010
http://www.cstl.nist.gov/biotech/strbase/pub_pres/ValloneGWU2010.pdf 25
Lockheed Martin & MicroLab Diagnostics (slide courtesy of Dr. Joan Bienvenue)
DNA Analysis for Human ID RapI.D.RapI.D.TMTM
2009 Alpha Design• Wet swab sample to analysisIn ~ 75 min; partial profile
•Liquid Extraction•PCR•Separation & Detection
• Smaller box 24” by 10” by 18”• More ruggedized design• Improved valving• IR light source improvement• IR light source improvement• On-box syringe heater• Analysis software improvements• Configured for future growth
Integrated DNA AnalysisPostPost--PCR PCR TreatmentTreatment• Microfluidically-Integrated DNA
Purification STR Amplification and
Lockheed Martin & MicroLab Diagnostics (slide courtesy of Dr. Joan Bienvenue)
LELE
PCRPCRMEME
Purification, STR Amplification, and Electrophoretic Separation and Detection
(off(off--chip)chip)
– PCR-Micro Electrophoresis (ME)• Modified chip preparation and cleaning methodology• Optimized fluidic control for integrated processing

Dr. Peter M. Vallone GWU November 12, 2010
http://www.cstl.nist.gov/biotech/strbase/pub_pres/ValloneGWU2010.pdf 26
Primary Aim:Evidential Quality
Forensic Science Service (slide courtesy of Keith Elliott & Dr. Gillian Tully)
• Current status– Single sample: reduce error– Off chip lysis - flexibility– Lysate to profile with no
manual intervention
4 hours
manual intervention– Plastic integrated cartridge– Integrated transfer to glass
CE chip (1.2bp resolution)
• In development
Forensic Science Service (slide courtesy of Keith Elliott & Dr. Gillian Tully)
– Integration of sample collection cartridge
– Single pre-loaded plastic cartridge for whole process
– Fully automated “sample to name” <2h
– Multiple cartridge loading capability for multiple sample analysis with maximum flexibility

Dr. Peter M. Vallone GWU November 12, 2010
http://www.cstl.nist.gov/biotech/strbase/pub_pres/ValloneGWU2010.pdf 27
Benefits of Developing Integrated Devices
• Pushing technology and reagent development forward
Potential
forward– Faster methods of DNA extraction– Faster PCR cycling protocols, optimized STR kits– Alternative chip electrophoresis, faster separations
Ad ances can be applied to benefit DNA t ping• Advances can be applied to benefit DNA typing performed in a lab setting – after proper validation studies
• Functional prototypes should be available for testing in the next 12-18 months
Benefits of Developing Integrated Devices
• 3-4 year horizon until concordance testing and validation
• The use of rapid DNA testing as a biometric would have an impact in various areas: – field testing, reference samples, rapid intelligence, mass fatalities,
kinship determination airport and border security immigrationkinship determination, airport and border security, immigration, booking stations
– other identification needs e.g., bioagent/pathogen detection, clinical diagnostics

Dr. Peter M. Vallone GWU November 12, 2010
http://www.cstl.nist.gov/biotech/strbase/pub_pres/ValloneGWU2010.pdf 28
Resources & Websites• FBI Biometric Center of Excellence
http://www biometriccoe gov– http://www.biometriccoe.gov• Biometric Consortium
– http://www.biometrics.org/• Biometrics.gov
– http://www.biometrics.gov/default.aspx• IEEE Biometrics CouncilIEEE Biometrics Council
– http://ieee-biometrics.org/• Biometrics Task Force
– http://www.biometrics.dod.mil/
Acknowledgements• Erica Butts (NIST)• Dr. Kristen Lewis (NIST)
• Helen Franklin (Microchip Biotechnologies)• Dr. Eugene Tan (Network Biosystems)• Dr. Joan Bienvenue (Lockheed Martin)• Dr. Gillian Tully, Keith Elliott and Dr. Andrew Hopwood (FSS)
• FBI for funding (Evaluation of DNA as a Biometric)FBI for funding (Evaluation of DNA as a Biometric)
http://www.cstl.nist.gov/biotech/strbase/[email protected]

Dr. Peter M. Vallone GWU November 12, 2010
http://www.cstl.nist.gov/biotech/strbase/pub_pres/ValloneGWU2010.pdf 29

Dr. Peter M. Vallone GWU November 12, 2010
http://www.cstl.nist.gov/biotech/strbase/pub_pres/ValloneGWU2010.pdf 30
Rapid PCRApplications
• Faster sample-to-answerInitial Questions
• Robustness• Increase throughput • Integrated platforms for
forensics and biometrics• Single source reference
samples = 1ng of DNA
• Sensitivity• PCR artifacts• Locus-to-locus balance
• Validation• Mixtures• PCR Inhibitors
Develop a PCR protocol for typing the Applied Biosystems Identifiler
STR kit in less than 1 hour
Common Thermal Cycling TimesCan we reduce PCR cycling times? What are the effects or limitations?
Year Run on a 9700 thermal cycler Hot start Time per cycle Cycles Post soak Total time1997/98 P fil Pl /C fil 11 i 3 i 28 60 i 2 52
Thermal Cycling Times for Current STR Typing Kits
1997/98 Profiler Plus/Cofiler 11 min 3 min 28 60 min 2:521999 SGM Plus 11 min 3 min 28 45 min 2:532000 PowerPlex 16 12 min 1 min 45 s 32 30 min 3:002001 Identifiler 11 min 3 min 28 60 min 2:582003 PowerPlex Y 12 min 1 min 45 s 32 30 min 3:182004 Yfiler 11 min 3 min 30 80 min 2:452007 PowerPlex S5 2 min 4 min 30 45 min 3:21
2007 minifiler 11 min 3 min 20 s 30 45 min 3:16
2009 ESI 16, 17 ESX 16,17 2 min 4 min 30 45 min 3:222009 PowerPlex 16 HS 2 min 1 min 45 s 32 30 min 2:42
2009 NGM 11 min 3 min 20 s 29 10 min 2:33
2009 Identifler Direct 11 min 3 min 26 25 min 2:342010 Idenfiler Plus 11 min 3 min 20 s 28 10 min 2:18

Dr. Peter M. Vallone GWU November 12, 2010
http://www.cstl.nist.gov/biotech/strbase/pub_pres/ValloneGWU2010.pdf 31
DNA Polymerases
• AmpliTaq Gold® is typically used– Heat activated (avoid non-specific PCR
products)
• SpeedSTAR™ HS DNA Polymerase – Extension times of 100 bp/s are possible
FermentasPyroStart Master Mix
QiagenQIAGEN Fast Cycling PCR KitExtension times of 100 bp/s are possible
(compared to 20 bp/s for other polymerases)– Still using standard PCR instrumentation– Hot-start formulation is antibody mediated
New England Biolabs/FinnzymesPhusion DNA Polymerases
Thermal Cyclers1. GeneAmp 9700 (Applied Biosystems)2. Mastercycler Pro S (Eppendorf)
P lti b d– Peltier based3. Rotor-Gene Q (Qiagen)
– Air heated and cooled4. SmartCycler (Cepheid)
– Hot plates for heating, fans for cooling
Intended for real-time PCR
• Cycling for most STR kits is run in ‘9600 emulation mode’ (1oC/s)
Dr. Peter M. Vallone GWU November 12, 2010
http://www.cstl.nist.gov/biotech/strbase/pub_pres/ValloneGWU2010.pdf 32
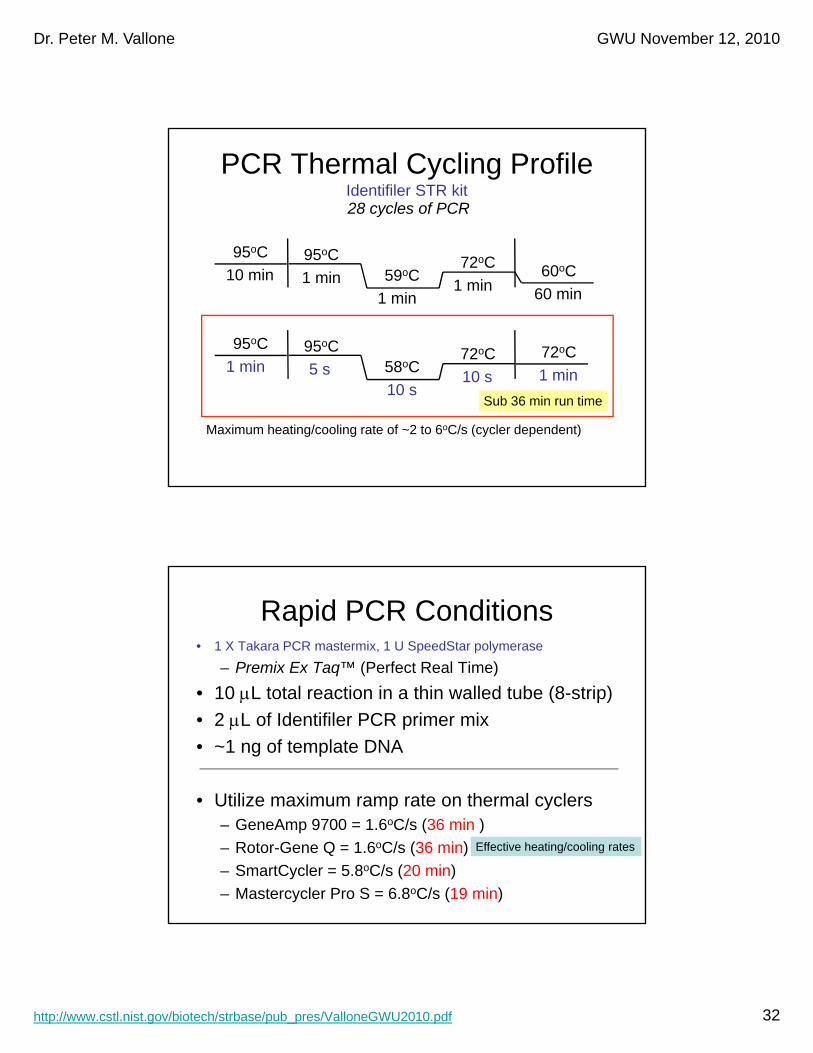
PCR Thermal Cycling ProfileIdentifiler STR kit28 cycles of PCR
95oC95oC10 min
95oC1 min 59oC
1 min
72oC1 min
60oC60 min
95oC 95oC58oC
72oC 72oC1 min 5 s 58oC1 min 5 s
10 s10 s 1 min
Sub 36 min run time
Maximum heating/cooling rate of ~2 to 6oC/s (cycler dependent)
Rapid PCR Conditions• 1 X Takara PCR mastermix, 1 U SpeedStar polymerase
– Premix Ex Taq™ (Perfect Real Time)• 10 μL total reaction in a thin walled tube (8-strip) • 2 μL of Identifiler PCR primer mix• ~1 ng of template DNA
• Utilize maximum ramp rate on thermal cyclersUtilize maximum ramp rate on thermal cyclers– GeneAmp 9700 = 1.6oC/s (36 min )– Rotor-Gene Q = 1.6oC/s (36 min)– SmartCycler = 5.8oC/s (20 min)– Mastercycler Pro S = 6.8oC/s (19 min)
Effective heating/cooling rates

Dr. Peter M. Vallone GWU November 12, 2010
http://www.cstl.nist.gov/biotech/strbase/pub_pres/ValloneGWU2010.pdf 33
Experimental Design• Type a set of NIST population samples (n=95)• Evaluate
– Full profiles (% success and concordance)– Identify artifacts of rapid PCR (adenylation, other)– Heterozygote peak height balance– Stutter %– Signal balance (locus-to-locus) and intensity
S iti it– Sensitivity• Not inhibitors or mixtures
Separated on a 3130xlInjection = 3kV for 5 s
Allele calling threshold = 50 RFUs
GeneAmp 9700 – 36 min PCRIdentifiler STR Profile

Dr. Peter M. Vallone GWU November 12, 2010
http://www.cstl.nist.gov/biotech/strbase/pub_pres/ValloneGWU2010.pdf 34
Mastercycler Pro S - 19 min PCRIdentifiler STR Profile
Rotor-Gene Q – 36 min PCRIdentifiler STR Profile

Dr. Peter M. Vallone GWU November 12, 2010
http://www.cstl.nist.gov/biotech/strbase/pub_pres/ValloneGWU2010.pdf 35
SmartCycler – 20 min PCRIdentifiler STR Profile
Summary of Initial Results
• All 95 samples were successfully typed on h th l l i th id PCReach thermal cycler using the rapid PCR
protocol
• One sample gave a discordant genotype

Dr. Peter M. Vallone GWU November 12, 2010
http://www.cstl.nist.gov/biotech/strbase/pub_pres/ValloneGWU2010.pdf 36
Discordant sample D18S51 - Identifiler
9700Rapid36 min cycling
(13,15)Peak height ratio = 0.17
9700AmpliTaq Gold3 hour cycling
(15,15)
Discordant sample• Amplification with PowerPlex 16 indicated
a (13,15) genotype( ) g yp
• A SNP under the binding site an Identifiler PCR primer results in the null allele**Hill et al., (2007) J. Forensic Sci. 52: 870-873
• Still present with a 59oC annealing temperature– But with lower signal intensity

Dr. Peter M. Vallone GWU November 12, 2010
http://www.cstl.nist.gov/biotech/strbase/pub_pres/ValloneGWU2010.pdf 37
Rapid PCR Artifacts
TPOX
219 bp

Dr. Peter M. Vallone GWU November 12, 2010
http://www.cstl.nist.gov/biotech/strbase/pub_pres/ValloneGWU2010.pdf 38
TH01
168 bp 184 bp160 bp
D8S1179
174 bp121 bp

Dr. Peter M. Vallone GWU November 12, 2010
http://www.cstl.nist.gov/biotech/strbase/pub_pres/ValloneGWU2010.pdf 39
D16S539
286 bp
Summary of PCR ArtifactsPCR Artifacts Observed 9700 Smart Cycler Master Cycler Pro Rotor-Gene
D16S539 (287 bp) 35 4 1 6
N = 95 Number of times an artifact was observed
D8S1179 (121 bp) 6 0 1 3D8S1179 (174 bp) 14 10 1 7
TH01 (160 bp) 28 2 1 11TH01 (168 bp) 83 32 1 40TH01 (184 bp) 59 19 0 25
TPOX (219 bp) 77 13 2 22Artifacts only called above 50 RFUsArtifacts only called above 50 RFUs
PCR artifacts did not affect allele calls (not in bins) and exhibited signal intensities similar to stutter peaks
Artifact signal intensities varied based on cycler

Dr. Peter M. Vallone GWU November 12, 2010
http://www.cstl.nist.gov/biotech/strbase/pub_pres/ValloneGWU2010.pdf 40
Heterozygote peak height ratiosn = 95 D8S1179 D21S11 D7S820 CSF1PO D3S1358 TH01 D13S317 D16S539 D2S1338 D19S433 vWA TPOX D18S51 AMEL D5S818 FGA
9700 0.89 0.91 0.90 0.89 0.90 0.90 0.89 0.91 0.88 0.88 0.89 0.90 0.91 0.92 0.90 0.89SmartCycler 0.90 0.88 0.89 0.87 0.88 0.89 0.88 0.89 0.88 0.89 0.87 0.90 0.86 0.90 0.88 0.89
Mastercycler pro 0.89 0.89 0.89 0.89 0.90 0.90 0.87 0.89 0.88 0.90 0.89 0.89 0.88 0.93 0.90 0.89Rotor Gene Q 0 88 0 85 0 86 0 88 0 88 0 90 0 86 0 88 0 88 0 88 0 87 0 89 0 86 0 90 0 88 0 89
• Average PHR for rapid PCR conditions > 0.85
• Standard deviation per locus < 0 1 (n=95)
Rotor‐Gene Q 0.88 0.85 0.86 0.88 0.88 0.90 0.86 0.88 0.88 0.88 0.87 0.89 0.86 0.90 0.88 0.899700 Taq Gold 0.87 0.89 0.88 0.84 0.84 0.88 0.83 0.88 0.84 0.87 0.86 0.88 0.84 0.88 0.88 0.86SD <0.1
• Standard deviation per locus < 0.1 (n=95)• 1 ng of DNA amplified with the rapid PCR
protocols exhibited heterozygote peak height balance comparable to traditional kit cycling conditions
Stutter Intensity N > 80 for all points
9700 Taq 9700 SmartCy MasterC Rotor‐GLocus Mean SD Mean SD Mean SD Mean SD Mean SD
CSF1PO 3.9 1.8 7.4 4.3 6.8 2.6 7.5 3.3 6.7 2.5D13S317 4.1 2.7 7.7 5.7 6.7 4.3 7.5 4.2 6.9 5.0D16S539 4 2 2 2 7 7 3 3 7 7 2 6 8 0 2 3 7 5 3 7D16S539 4.2 2.2 7.7 3.3 7.7 2.6 8.0 2.3 7.5 3.7D18S51 7.8 2.7 11.8 5.9 10.6 4.2 12.6 5.5 10.9 4.4
D19S433 7.2 2.4 10.4 3.9 9.6 2.4 10.0 2.5 11.3 4.1D21S11 5.3 1.5 9.2 1.9 9.6 2.4 10.1 1.9 9.7 2.6
D2S1338 6.1 1.9 12.0 2.8 12.3 3.2 12.7 3.1 12.4 3.2D3S1358 7.6 4.1 11.7 4.7 10.4 2.3 11.4 3.1 10.4 2.4D5S818 4.8 3.6 8.8 4.7 8.0 2.6 9.1 3.8 8.3 2.9D7S820 3.7 1.3 5.9 2.6 5.9 2.0 6.5 2.2 5.8 2.0
On average, stutter peak intensity for rapid protocol is 30-40 % higher than for PCR standard conditions
D8S1179 5.7 3.6 9.3 4.4 8.5 2.5 8.9 2.2 8.6 2.8FGA 7.0 3.7 9.9 4.6 10.0 3.8 10.2 3.5 9.6 3.2TH01 3.0 5.0 5.8 6.5 3.8 3.9 4.8 6.2 5.1 6.6TPOX 2.6 3.8 4.7 4.1 4.5 3.5 4.1 2.0 4.8 4.0vWA 6.5 5.0 11.0 4.9 10.5 3.1 10.6 3.6 10.8 4.0

Dr. Peter M. Vallone GWU November 12, 2010
http://www.cstl.nist.gov/biotech/strbase/pub_pres/ValloneGWU2010.pdf 41
Signal IntensityAverage signal intensity per locus (RFUs)
D8S1179 D21S11 D7S820 CSF1PO D3S1358 TH01 D13S317 D16S539 D2S1338 D19S433 vWA TPOX D18S51 AMEL D5S818 FGA
9700 4289 4322 4068 5395 5243 6348 6541 7582 5896 2923 4042 5324 5209 4812 4723 4069SmartCycler 1377 1036 1603 2133 1712 2625 2564 2409 2514 976 1175 2304 1888 1756 1530 1040
Mastercycler Pro 2488 2461 2783 3948 2005 2175 2081 4150 4431 2286 2807 3321 3927 3042 2466 1260Mastercycler Pro 2488 2461 2783 3948 2005 2175 2081 4150 4431 2286 2807 3321 3927 3042 2466 1260Rotor‐Gene Q 2292 1751 1845 2458 2564 3568 3476 3520 3486 1503 1939 2885 2476 2358 2608 17759700 Taq Gold 3554 2958 1601 1840 3221 5166 3309 3501 3228 4631 5155 4241 1804 4146 3699 1952
3000
4000
5000
6000
7000
nal I
nten
sity
(RFU
s)
Average overall signal intensity per cycler (RFUs)
Overall multiplex balance comparable to standard conditions…
0
1000
2000
Gene Amp9700
MastercyclerPro
Rotor-Gene Q SmartCycler 9700 TaqGold
Ave
rage
Sig
n
3h
0.04
0.06
0.08
0.10
0.12
0.14
0.16
0.18
n of
Sum
of A
ll Pe
ak H
eigh
ts Standard PCR Conditions
Increasing signal contribution
D7S
820
D18
S51
CS
F1P
O
FGA
D21
S11
D2S
1338
D13
S31
7
D3S
1358
D16
S53
9
D8S
1179
AM
EL
D5S
818
TPO
X
D19
S43
3
vWA
TH01
0.00
0.02
Frac
tion
16 15 14 13 12 11 10 9 8 7 6 5 4 3 2 1

Dr. Peter M. Vallone GWU November 12, 2010
http://www.cstl.nist.gov/biotech/strbase/pub_pres/ValloneGWU2010.pdf 42
0.04
0.06
0.08
0.10
0.12
0.14
0.16
0.18
n of
Sum
of A
ll Pe
ak H
eigh
ts Standard PCR Conditions
Increasing signal contribution
0.12
0.14
0.16
0.18
Peak
Hei
ghts
D7S
820
D18
S51
CS
F1P
O
FGA
D21
S11
D2S
1338
D13
S31
7
D3S
1358
D16
S53
9
D8S
1179
AM
EL
D5S
818
TPO
X
D19
S43
3
vWA
TH01
0.00
0.02
Frac
tion
Rapid PCR Conditions 9700
16 15 14 13 12 11 10 9 8 7 6 5 4 3 2 1
D19
S43
3
vWA
FGA
D7S
820
D8S
1179
AM
EL
D21
S11
D5S
818
D18
S51
D3S
1358
CS
F1P
O
D2S
1338
TPO
X
TH01
D13
S31
7
D16
S53
9
0.00
0.02
0.04
0.06
0.08
0.10
Frac
tion
of S
um o
f All
3 2 13 16 7 6 12 5 15 9 14 11 4 1 10 8
Sensitivity Study on 9700• Titration of highly
characterized DNA9700
36 min
D8S117
D21S1
D7S82
CSF1P
D3S135
TH0
D13S31
D16S53
D2S133
D19S43
vW
TPO
D18S5
AME
D5S81
FG
Standard Injection
– Stock at 52.44 ng/µL• 7 concentrations
amplified in duplicate• Injected on the 3130
– 3 kV for 10 s
79
11
20
PO
58
01
17
39
38
33
WA
OX
51
EL
18
GA
1000 pg
750 pg
500 pg
250 pg
125 pg
62.5 pg 51
• 50 RFU detection cutoff
62.5 pg 5180
31.3 pg 85 71 60 134 5661 77 50 75 140 54
full profilefull drop outone allele
drop in/high stutter
*number corresponds to the height of the peak that is called

Dr. Peter M. Vallone GWU November 12, 2010
http://www.cstl.nist.gov/biotech/strbase/pub_pres/ValloneGWU2010.pdf 43
Sensitivity Study 125 pg
Sensitivity Study 62.5 pg

Dr. Peter M. Vallone GWU November 12, 2010
http://www.cstl.nist.gov/biotech/strbase/pub_pres/ValloneGWU2010.pdf 44
Peltier Cyclers: 9700 and Mastercycler Pro S
9700 36 min
D8S1179
D21S11
D7S820
CSF1PO
D3S1358
TH01
D13S317
D16S539
D2S1338
D19S433
vWA
TPOX
D18S51
AMEL
D5S818
FGA
Standard Injection
Mastercycler 19 min
D8S1179
D21S11
D7S820
CSF1PO
D3S1358
TH01
D13S317
D16S539
D2S1338
D19S433
vWA
TPOX
D18S51
AMEL
D5S818
FGA
Standard Injection
9 1 0 O 8 1 7 9 8 3 A X 1 L 8 A1000 pg
750 pg
500 pg
250 pg
125 pg
62.5 pg 51180
31 3 pg 85 71 60 134 56
9 1 0 O 8 1 7 9 8 3 A X 1 L 8 A1000 pg
750 pg
500 pg
250 pg 59
125 pg 65 16550 54
62.5 pg67 63 56 94 127 93 51
31 3 pg31.3 pg 85 71 60 134 5661 77 50 75 140 54
full profilefull drop outone allele
drop in/high stutter
*number corresponds to the height of the peak that is called
31.3 pg64 62
full profilefull drop outone allele
drop in/high stutter
*number corresponds to the height of the peak that is called
SmartCycler and Rotor-Gene QSmartCycler
20 min
D8S117
D21S1
D7S82
CSF1P
D3S135
TH0
D13S31
D16S53
D2S133
D19S43
vW
TPO
D18S5
AME
D5S81
FG
Standard Injection
Rotor-Gene 36 min
D8S117
D21S1
D7S82
CSF1P
D3S135
TH0
D13S31
D16S53
D2S133
D19S43
vW
TPO
D18S5
AME
D5S81
FG
Standard Injection
79
11
20
PO
58
01
17
39
38
33
WA
OX
51
EL
18
GA
1000 pg
750 pg
500 pg
250 pg
125 pg 104 118
62.5 pg 56 172 56 98 67123 81
79
11
20
PO
58
01
17
39
38
33
WA
OX
51
EL
18
GA
1000 pg
750 pg
500 pg
250 pg
125 pg 98
62.5 pg 73 67 65 78 5089123 81
31.3 pg 66 61 51 51
full profilefull drop outone allele
drop in/high stutter
*number corresponds to the height of the peak that is called
8931.3 pg 152 80 67 151
full profilefull drop outone allele
drop in/high stutter
*number corresponds to the height of the peak that is called

Dr. Peter M. Vallone GWU November 12, 2010
http://www.cstl.nist.gov/biotech/strbase/pub_pres/ValloneGWU2010.pdf 45
Changing Volumes and Cycling Times• Increasing PCR volume (10 µL to 25 µL)
– Slight decrease in signal intensity of PCR artifacts– Heterozygote peak height ratios similar– No decrease in signal for stutter peaks– Decrease in signal intensity (due to higher volume)
• Effects of increasing cycling hold times for the g y grapid protocol (36 min, 60 min, 3 hour)– Signal intensity of PCR artifacts increased– Heterozygote peak height ratios similar– No decrease in signal for stutter peaks
Summary of Rapid PCR Protocols• Rapid PCR protocols can successfully amplify 15
STR loci in 19 to 36 minutes – Utility for reference samples, integrated typing systems
• PCR artifacts did not affect allele calls• Stutter is 30-40% greater
– Test different ‘fast’ polymerases– High stutter may affect DNA mixture interpretation
• Sensitivity varies by cycler (250 - 500 pg)• Thermal cycler characteristics affect the quality of
an STR profile (faster = fewer artifacts, less signal)

Dr. Peter M. Vallone GWU November 12, 2010
http://www.cstl.nist.gov/biotech/strbase/pub_pres/ValloneGWU2010.pdf 46
Acknowledgements
NRCPostdoctoral fellow
DNA Biometrics Project Team
Becky Hill
Dave Duewer
Erica Butts
John Butler
Postdoctoral fellow
Kristen O’Connor
Funding from the FBI S&T Branch through the NIST Information Access Division
http://www.cstl.nist.gov/biotech/strbase/[email protected]
1-301-975-4872


![Microsoft PowerPoint - NYP talk.ppt [Read-Only]](https://img.pdfslide.net/doc/110x75/5589527ad8b42aea0b8b45d6/microsoft-powerpoint-nyp-talkppt-read-only.jpg)


![Cdd mind the health gap 2010 talk.ppt [autosaved]](https://img.pdfslide.net/doc/110x75/549bfcbeac7959dd2a8b45fc/cdd-mind-the-health-gap-2010-talkppt-autosaved.jpg)