Embed Size (px)
Citation preview
3rd EU-LFS/EU-SILC European User Conference 1
Variance estimation on SILC based indicators
Emilio Di Meglio – Eurostat [email protected]
Guillaume Osier – STATEC [email protected]
1
3rd EU-LFS/EU-SILC European User Conference 2
EU SILC is a sample survey
This means that when looking at indicators we should also
take a look at accuracy measures
EU SILC is a complex survey
Naive methods are not directly applicable
We present the first results of variance estimation using
linearization techniques
Our main message today
2
Why variance estimation?
Requested by regulation
Quality report
Compliance
Requested by users
Policy relevance of indicators
Requested by researchers
3rd EU-LFS/EU-SILC European User Conference 3
Current quality precision requirements
According to Reg.1982/2003, the X and L (initial sample) data
are to be based on a nationally representative probability
sample of the population residing in private households…
Representative probability samples shall be achieved both for
households and for individual persons in the target population.
The sampling frame and methods of sample selection should
ensure that every individual and household in the target
population is assigned a known and non-zero probability of
selection.
Reg. 1177/2003 defines the minimum effective sample
sizes to be achieved.
3rd EU-LFS/EU-SILC European User Conference 4
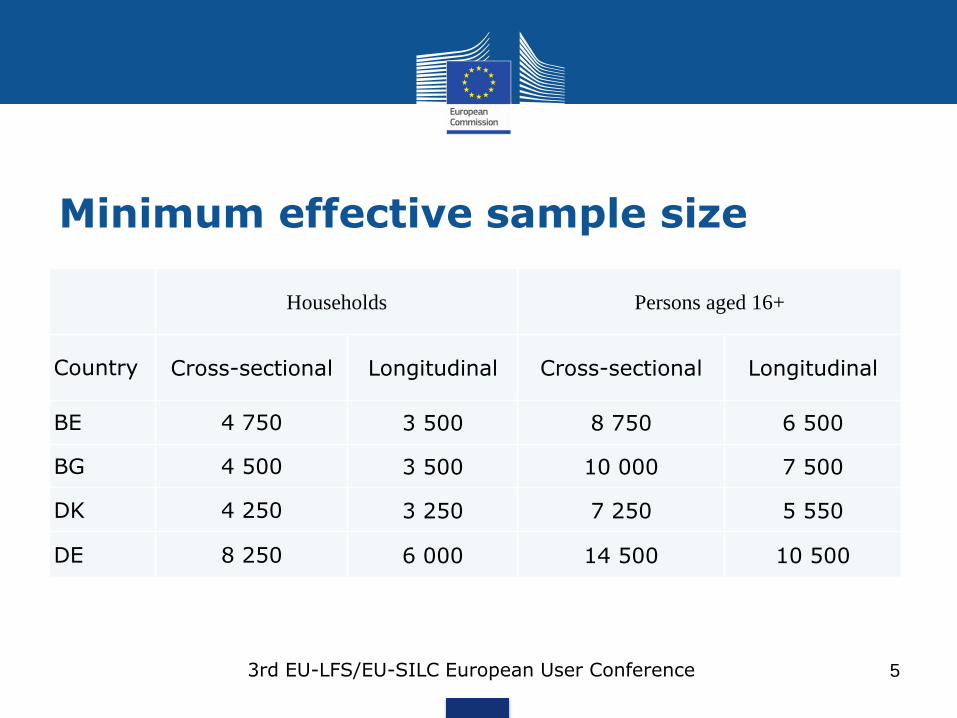
Minimum effective sample size
3rd EU-LFS/EU-SILC European User Conference 5
Households Persons aged 16+
Country Cross-sectional Longitudinal Cross-sectional Longitudinal
BE 4 750 3 500 8 750 6 500
BG 4 500 3 500 10 000 7 500
DK 4 250 3 250 7 250 5 550
DE 8 250 6 000 14 500 10 500
DEFF (Kish, 1965)
Definition: "The ratio of the variance under the given sample
design, to the variance under a simple random sample of the
same size"
Importance: a tool to measure the efficiency of your complex
sample design
Calculation based on at-risk-of poverty rate
3rd EU-LFS/EU-SILC European User Conference 6
What influences variance?
Variability of the phenomenon
Sample size
Indicator value
Sampling design
Imputation
Calibration
Weighting
…
3rd EU-LFS/EU-SILC European User Conference 7
Main challenges for EU SILC
Difficulty to find the « best » possible method for
variance estimation
– Different designs (flexibility)
– Missing information
– Debate on methods ongoing
Differentiate the needs: accuracy estimates for policy
usage and accuracy estimates for researchers.
3rd EU-LFS/EU-SILC European User Conference 8
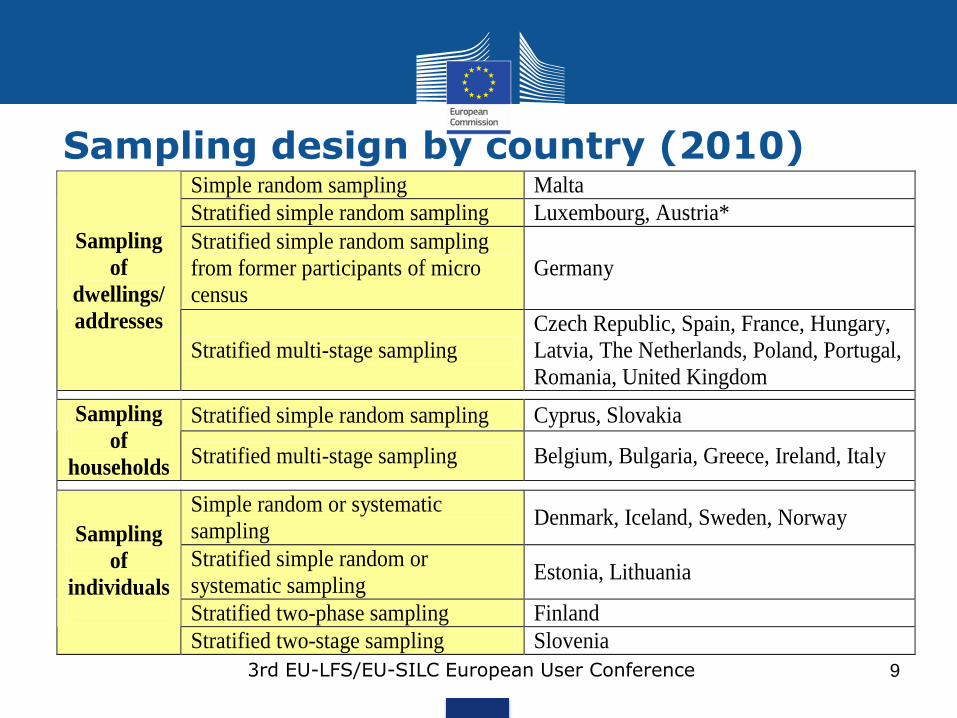
Sampling design by country (2010)
3rd EU-LFS/EU-SILC European User Conference 9
Simple random sampling Malta
Stratified simple random sampling Luxembourg, Austria*
Stratified simple random sampling
from former participants of micro
census
Germany
Sampling
of
dwellings/
addresses
Stratified multi-stage sampling
Czech Republic, Spain, France, Hungary,
Latvia, The Netherlands, Poland, Portugal,
Romania, United Kingdom
Stratified simple random sampling Cyprus, Slovakia Sampling
of
households Stratified multi-stage sampling Belgium, Bulgaria, Greece, Ireland, Italy
Simple random or systematic
sampling Denmark, Iceland, Sweden, Norway
Stratified simple random or
systematic sampling Estonia, Lithuania
Stratified two-phase sampling Finland
Sampling
of
individuals
Stratified two-stage sampling Slovenia
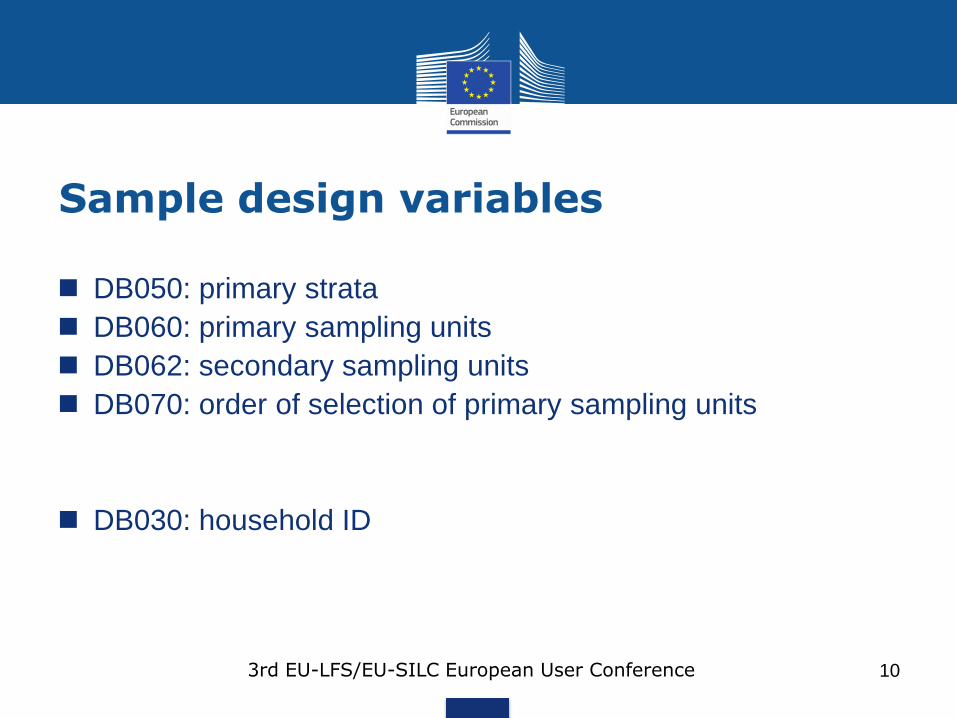
Sample design variables
DB050: primary strata
DB060: primary sampling units
DB062: secondary sampling units
DB070: order of selection of primary sampling units
DB030: household ID
3rd EU-LFS/EU-SILC European User Conference 10
Our objective
Resampling taking into account all the possible elements
coming from 32 countries would be extremely computationally
and resource intensive
Variance estimation methods balancing between scientific
accuracy and administrative considerations (time, cost,
simplicity) are the only viable solution
Aim: to quickly provide to users and policy makers standard
errors for the SILC-based indicators, particularly the AROPE,
its components and its main breakdowns.
3rd EU-LFS/EU-SILC European User Conference 11
The proposed approach
We have considered different methods: bootstrap,
Jacknife, linearisation
We carried out comparative experiments on a limited
number of countries and results are similar
We chose to work with linearisation (ultimate cluster
approach proposed by Net-SILC2) that can provide
acceptable results given the constraints we face
The approach was discussed at the Workshop accuracy
(Net-SILC2) and validated by the SILC WG
3rd EU-LFS/EU-SILC European User Conference 12
The method (synthesis)
Linearization is a technique based on the use of linear approximation to reduce non-linear statistics to a linear form, justified by asymptotic properties of the estimator (Särndal et al, 1992 ; Deville, 1999 ; Wolter, 2006 ; Osier, 2009)
The "ultimate cluster" approach (Särndal et al, 1992) is a simplification consisting in calculating the variance taking into account only variation among Primary Sampling Unit (PSU) totals
This method requires first stage sampling fractions to be small which is nearly always the case.
This method allows a great flexibility and simplifies the calculations of variances.
It can also be generalized to calculate variance of the differences of one year to another (Berger, 2004 , 2010 ).
Applicable with the main statistical packages (SAS, R, STATA)
3rd EU-LFS/EU-SILC European User Conference 13
The method and the results
The described methodology has been applied in Eurostat for running an estimation of variance and confidence intervals
For AROPE and its subcomponents for 3 age groups (0-17, 18-64, 65+) and gender breakdowns
For estimating variance of net changes.
We have used the SAS procedures SURVEYMEANS and SURVEYFREQ that allow to specify the survey design
According to the characteristics and availability of data for different countries we have used different variables to specify strata and cluster information.
3rd EU-LFS/EU-SILC European User Conference 14
The method and the results
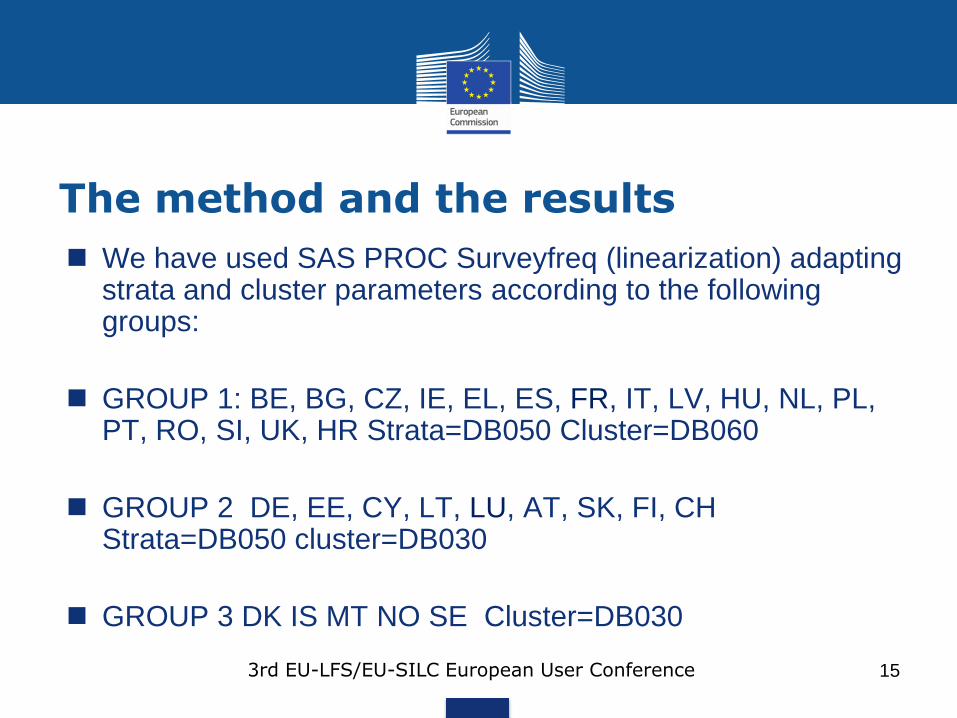
We have used SAS PROC Surveyfreq (linearization) adapting strata and cluster parameters according to the following groups:
GROUP 1: BE, BG, CZ, IE, EL, ES, FR, IT, LV, HU, NL, PL, PT, RO, SI, UK, HR Strata=DB050 Cluster=DB060
GROUP 2 DE, EE, CY, LT, LU, AT, SK, FI, CH Strata=DB050 cluster=DB030
GROUP 3 DK IS MT NO SE Cluster=DB030
3rd EU-LFS/EU-SILC European User Conference 15
Results on AROPE
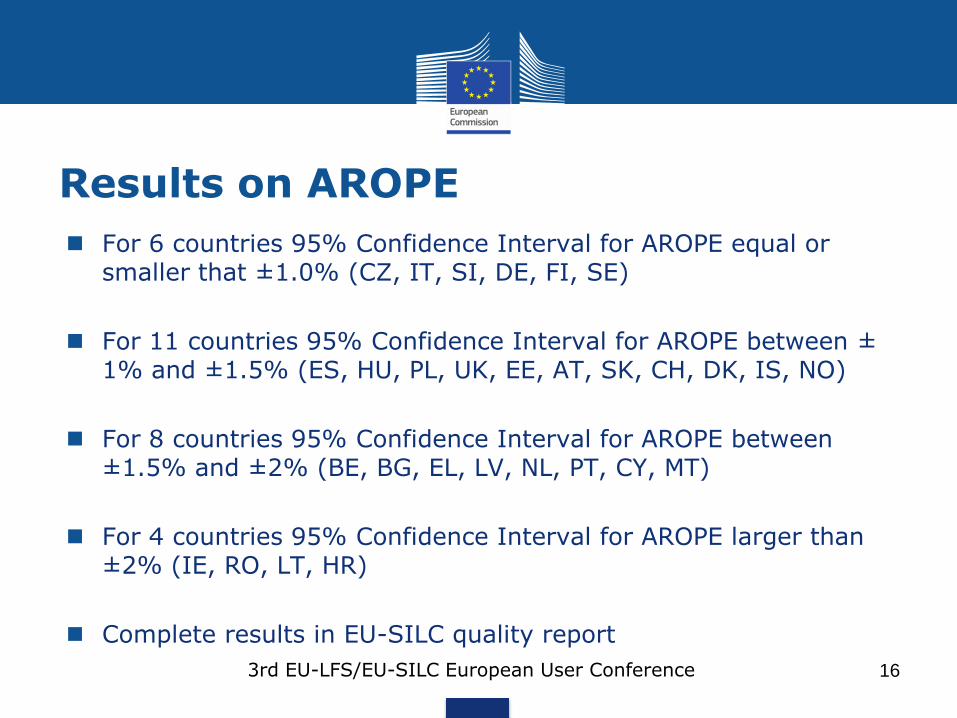
For 6 countries 95% Confidence Interval for AROPE equal or smaller that ±1.0% (CZ, IT, SI, DE, FI, SE)
For 11 countries 95% Confidence Interval for AROPE between ± 1% and ±1.5% (ES, HU, PL, UK, EE, AT, SK, CH, DK, IS, NO)
For 8 countries 95% Confidence Interval for AROPE between ±1.5% and ±2% (BE, BG, EL, LV, NL, PT, CY, MT)
For 4 countries 95% Confidence Interval for AROPE larger than ±2% (IE, RO, LT, HR)
Complete results in EU-SILC quality report
3rd EU-LFS/EU-SILC European User Conference 16
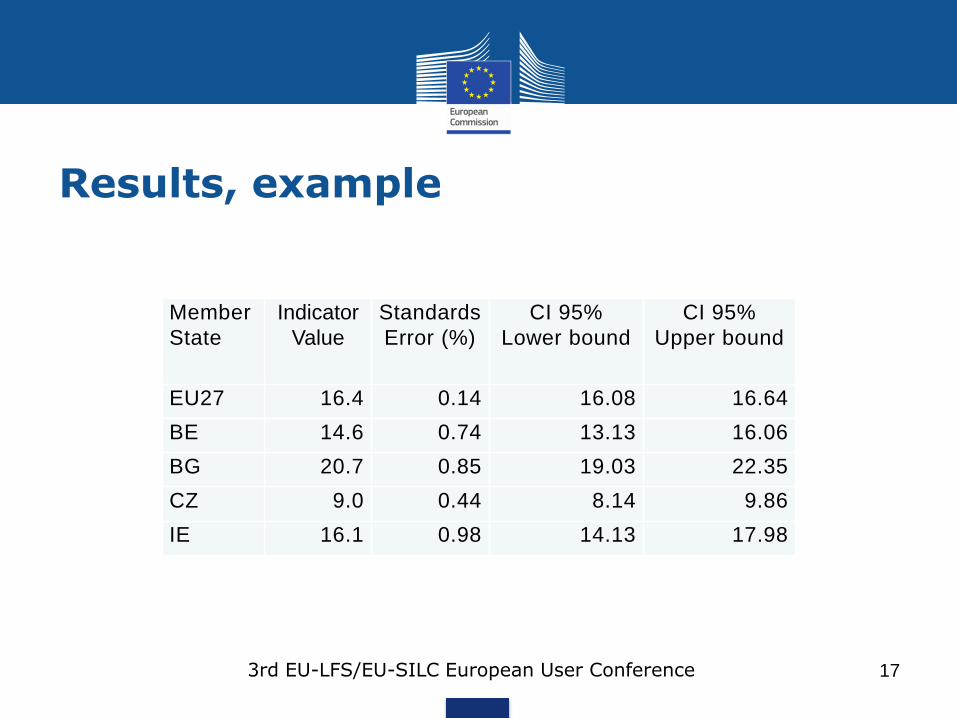
Results, example
3rd EU-LFS/EU-SILC European User Conference 17
Member
State
Indicator
Value
Standards
Error (%)
CI 95%
Lower bound
CI 95%
Upper bound
EU27 16.4 0.14 16.08 16.64
BE 14.6 0.74 13.13 16.06
BG 20.7 0.85 19.03 22.35
CZ 9.0 0.44 8.14 9.86
IE 16.1 0.98 14.13 17.98
Measurement of net changes
To measure the significance of the evolution of social indicators
Example:
When the At-risk-of-poverty or social exclusion rate for Cyprus
goes from 22.9% in 2010 to 23.5% in 2011, are we able to say
that this change is significant?
Exercise already done for: AROPE, AROPE(0-
17),ARP,ARP(65+), SMD, VLWI, IWP, UMNC
3rd EU-LFS/EU-SILC European User Conference 18
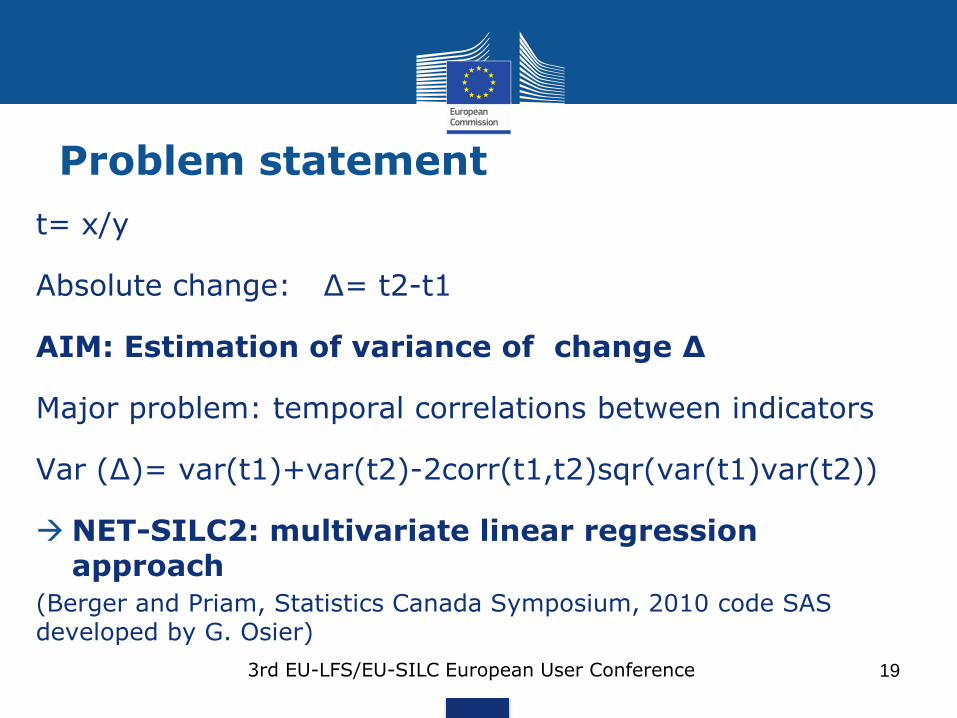
Problem statement
t= x/y
Absolute change: ∆= t2-t1
AIM: Estimation of variance of change ∆
Major problem: temporal correlations between indicators
Var (∆)= var(t1)+var(t2)-2corr(t1,t2)sqr(var(t1)var(t2))
NET-SILC2: multivariate linear regression approach
(Berger and Priam, Statistics Canada Symposium, 2010 code SAS developed by G. Osier)
3rd EU-LFS/EU-SILC European User Conference 19
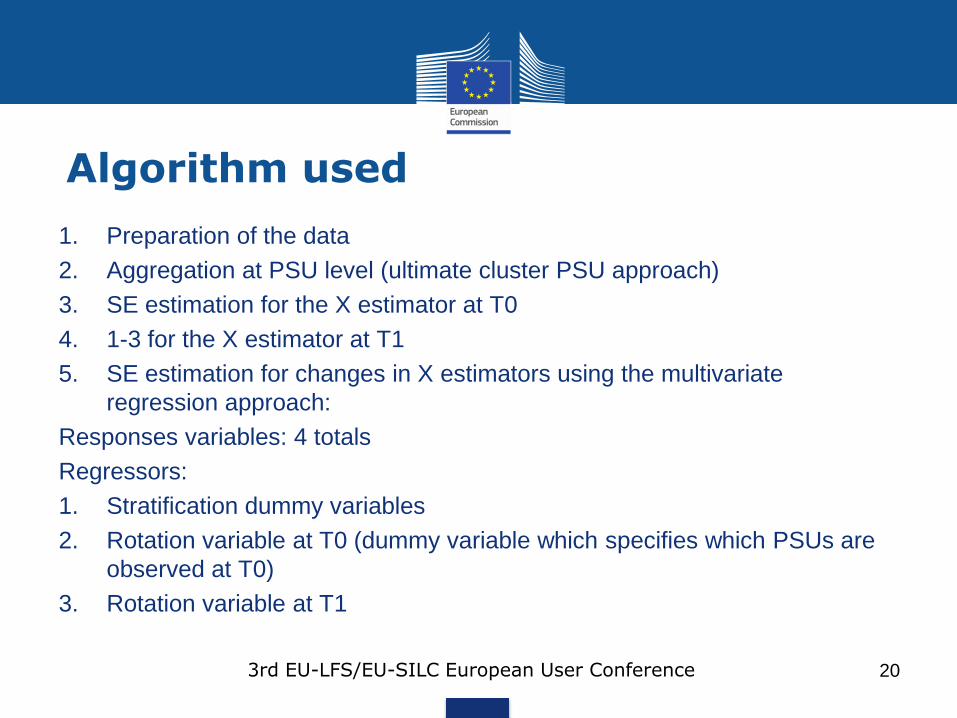
Algorithm used
1. Preparation of the data
2. Aggregation at PSU level (ultimate cluster PSU approach)
3. SE estimation for the X estimator at T0
4. 1-3 for the X estimator at T1
5. SE estimation for changes in X estimators using the multivariate
regression approach:
Responses variables: 4 totals
Regressors:
1. Stratification dummy variables
2. Rotation variable at T0 (dummy variable which specifies which PSUs are
observed at T0)
3. Rotation variable at T1
3rd EU-LFS/EU-SILC European User Conference 20
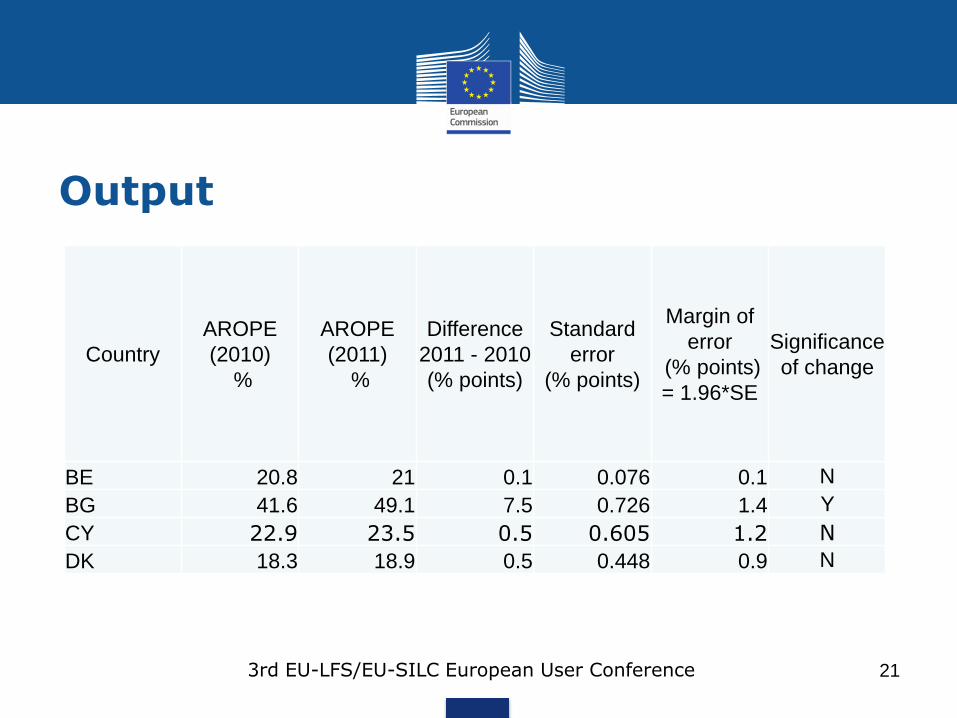
Output
3rd EU-LFS/EU-SILC European User Conference 21
Country
AROPE
(2010)
%
AROPE
(2011)
%
Difference
2011 - 2010
(% points)
Standard
error
(% points)
Margin of
error
(% points)
= 1.96*SE
Significance
of change
BE 20.8 21 0.1 0.076 0.1 N
BG 41.6 49.1 7.5 0.726 1.4 Y
CY 22.9 23.5 0.5 0.605 1.2 N
DK 18.3 18.9 0.5 0.448 0.9 N
Conclusion and future plans
The methodology is of relatively simple application
It can be considered as a good compromise between scientific
soundness and feasibility under current constraints.
SILC based indicators in the current implementation can be
considered as having an overall acceptable accuracy;
The next steps consist in still improving these calculations by asking
Member States to provide the necessary information where missing.
Dissemination of further information to users under investigation.
3rd EU-LFS/EU-SILC European User Conference 22