Embed Size (px)
Citation preview
Research Report No. 18
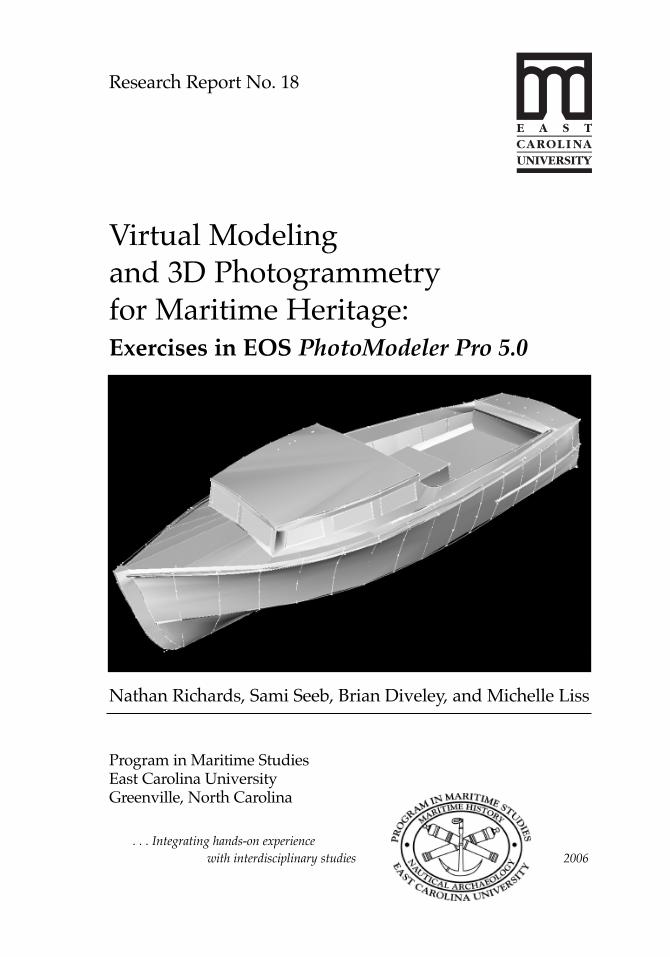
Virtual Modelingand 3D Photogrammetryfor Maritime Heritage:Exercises in EOS PhotoModeler Pro 5.0
Nathan Richards, Sami Seeb, Brian Diveley, and Michelle Liss
Program in Maritime StudiesEast Carolina UniversityGreenville, North Carolina
. . . Integrating hands-on experiencewith interdisciplinary studies 2006

Research Report No. 18
Virtual Modelingand 3D Photogrammetryfor Maritime Heritage:Exercises in EOS PhotoModeler Pro 5.0
Nathan Richards, Sami Seeb, Brian Diveley, and Michelle Liss
© 2006 by the Program in Maritime Studies, East Carolina University, Admiral Ernest M. Eller House,Greenville, North Carolina 27858. Nathan Richards, series editor. Printed in the United States of America.
ISBN 0-9741937-9-8 (Volume 18)
Cover: Shaded photo-model of NCHH0025 (Brian Diveley, 2005)

Contents
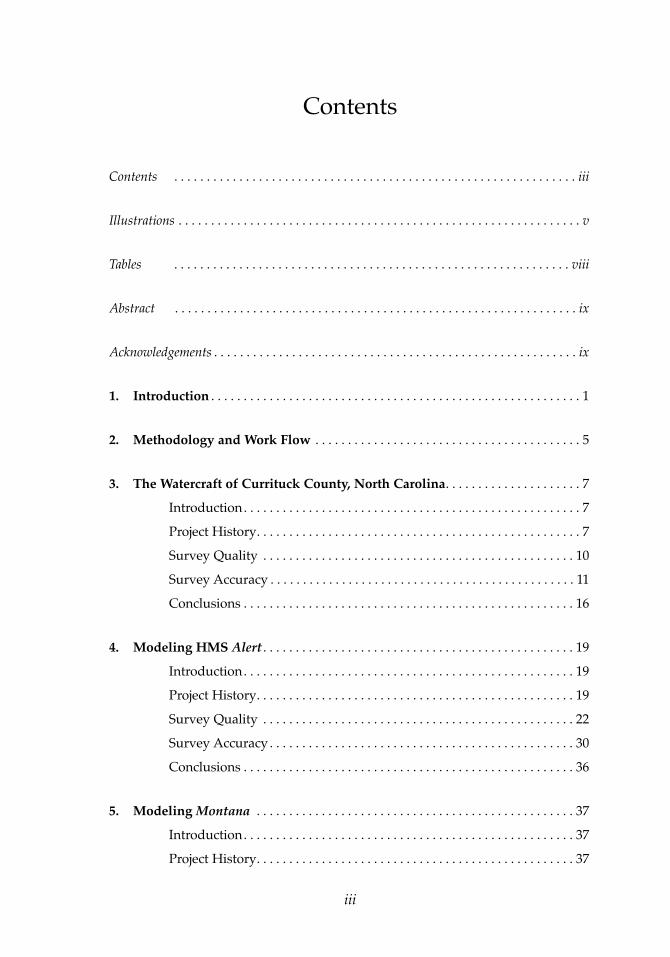
Contents . . . . . . . . . . . . . . . . . . . . . . . . . . . . . . . . . . . . . . . . . . . . . . . . . . . . . . . . . . . . . . iii
Illustrations . . . . . . . . . . . . . . . . . . . . . . . . . . . . . . . . . . . . . . . . . . . . . . . . . . . . . . . . . . . . . . v
Tables . . . . . . . . . . . . . . . . . . . . . . . . . . . . . . . . . . . . . . . . . . . . . . . . . . . . . . . . . . . . . viii
Abstract . . . . . . . . . . . . . . . . . . . . . . . . . . . . . . . . . . . . . . . . . . . . . . . . . . . . . . . . . . . . . . ix
Acknowledgements . . . . . . . . . . . . . . . . . . . . . . . . . . . . . . . . . . . . . . . . . . . . . . . . . . . . . . . . ix
1. Introduction . . . . . . . . . . . . . . . . . . . . . . . . . . . . . . . . . . . . . . . . . . . . . . . . . . . . . . . . . 1
2. Methodology and Work Flow . . . . . . . . . . . . . . . . . . . . . . . . . . . . . . . . . . . . . . . . . 5
3. The Watercraft of Currituck County, North Carolina. . . . . . . . . . . . . . . . . . . . . 7Introduction. . . . . . . . . . . . . . . . . . . . . . . . . . . . . . . . . . . . . . . . . . . . . . . . . . . . 7Project History. . . . . . . . . . . . . . . . . . . . . . . . . . . . . . . . . . . . . . . . . . . . . . . . . . 7Survey Quality . . . . . . . . . . . . . . . . . . . . . . . . . . . . . . . . . . . . . . . . . . . . . . . . 10Survey Accuracy . . . . . . . . . . . . . . . . . . . . . . . . . . . . . . . . . . . . . . . . . . . . . . . 11Conclusions . . . . . . . . . . . . . . . . . . . . . . . . . . . . . . . . . . . . . . . . . . . . . . . . . . . 16
4. Modeling HMS Alert . . . . . . . . . . . . . . . . . . . . . . . . . . . . . . . . . . . . . . . . . . . . . . . . 19Introduction. . . . . . . . . . . . . . . . . . . . . . . . . . . . . . . . . . . . . . . . . . . . . . . . . . . 19Project History. . . . . . . . . . . . . . . . . . . . . . . . . . . . . . . . . . . . . . . . . . . . . . . . . 19Survey Quality . . . . . . . . . . . . . . . . . . . . . . . . . . . . . . . . . . . . . . . . . . . . . . . . 22Survey Accuracy . . . . . . . . . . . . . . . . . . . . . . . . . . . . . . . . . . . . . . . . . . . . . . . 30Conclusions . . . . . . . . . . . . . . . . . . . . . . . . . . . . . . . . . . . . . . . . . . . . . . . . . . . 36
5. Modeling Montana . . . . . . . . . . . . . . . . . . . . . . . . . . . . . . . . . . . . . . . . . . . . . . . . . 37Introduction. . . . . . . . . . . . . . . . . . . . . . . . . . . . . . . . . . . . . . . . . . . . . . . . . . . 37Project History. . . . . . . . . . . . . . . . . . . . . . . . . . . . . . . . . . . . . . . . . . . . . . . . . 37
iii

Survey Quality . . . . . . . . . . . . . . . . . . . . . . . . . . . . . . . . . . . . . . . . . . . . . . . . 45Survey Accuracy . . . . . . . . . . . . . . . . . . . . . . . . . . . . . . . . . . . . . . . . . . . . . . . 48Conclusions . . . . . . . . . . . . . . . . . . . . . . . . . . . . . . . . . . . . . . . . . . . . . . . . . . . 50
References Cited . . . . . . . . . . . . . . . . . . . . . . . . . . . . . . . . . . . . . . . . . . . . . . . . . . . . . . . . . . 55
iv
Illustrations
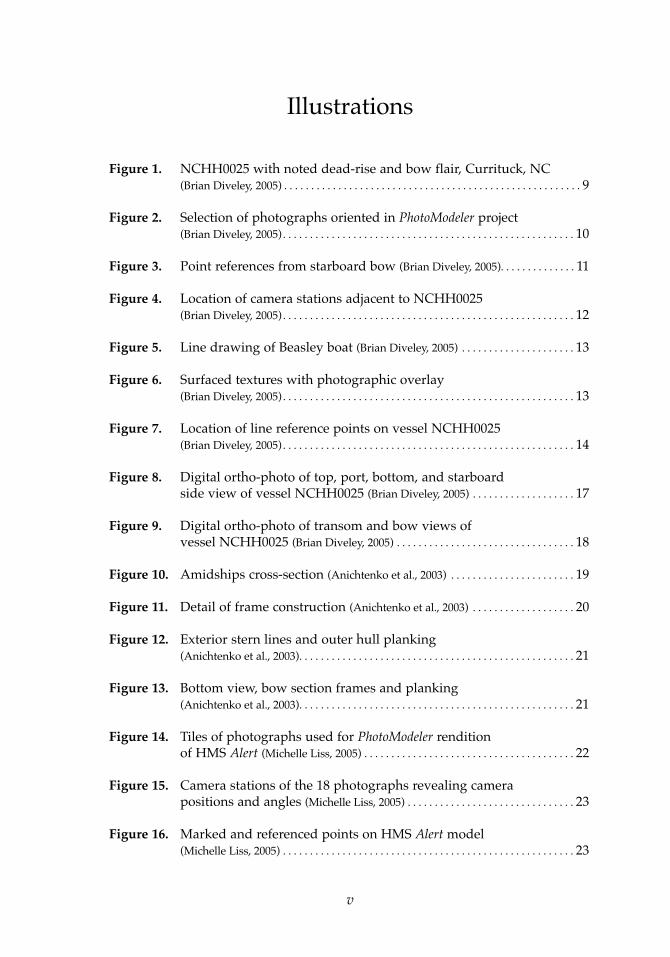
Figure 1. NCHH0025 with noted dead-rise and bow flair, Currituck, NC(Brian Diveley, 2005) . . . . . . . . . . . . . . . . . . . . . . . . . . . . . . . . . . . . . . . . . . . . . . . . . . . . . . . 9
Figure 2. Selection of photographs oriented in PhotoModeler project (Brian Diveley, 2005) . . . . . . . . . . . . . . . . . . . . . . . . . . . . . . . . . . . . . . . . . . . . . . . . . . . . . . 10
Figure 3. Point references from starboard bow (Brian Diveley, 2005). . . . . . . . . . . . . . 11
Figure 4. Location of camera stations adjacent to NCHH0025(Brian Diveley, 2005) . . . . . . . . . . . . . . . . . . . . . . . . . . . . . . . . . . . . . . . . . . . . . . . . . . . . . . 12
Figure 5. Line drawing of Beasley boat (Brian Diveley, 2005) . . . . . . . . . . . . . . . . . . . . . 13
Figure 6. Surfaced textures with photographic overlay (Brian Diveley, 2005) . . . . . . . . . . . . . . . . . . . . . . . . . . . . . . . . . . . . . . . . . . . . . . . . . . . . . . 13
Figure 7. Location of line reference points on vessel NCHH0025 (Brian Diveley, 2005) . . . . . . . . . . . . . . . . . . . . . . . . . . . . . . . . . . . . . . . . . . . . . . . . . . . . . . 14
Figure 8. Digital ortho-photo of top, port, bottom, and starboard side view of vessel NCHH0025 (Brian Diveley, 2005) . . . . . . . . . . . . . . . . . . . 17
Figure 9. Digital ortho-photo of transom and bow views of vessel NCHH0025 (Brian Diveley, 2005) . . . . . . . . . . . . . . . . . . . . . . . . . . . . . . . . . 18
Figure 10. Amidships cross-section (Anichtenko et al., 2003) . . . . . . . . . . . . . . . . . . . . . . . 19
Figure 11. Detail of frame construction (Anichtenko et al., 2003) . . . . . . . . . . . . . . . . . . . 20
Figure 12. Exterior stern lines and outer hull planking (Anichtenko et al., 2003). . . . . . . . . . . . . . . . . . . . . . . . . . . . . . . . . . . . . . . . . . . . . . . . . . . 21
Figure 13. Bottom view, bow section frames and planking (Anichtenko et al., 2003). . . . . . . . . . . . . . . . . . . . . . . . . . . . . . . . . . . . . . . . . . . . . . . . . . . 21
Figure 14. Tiles of photographs used for PhotoModeler rendition of HMS Alert (Michelle Liss, 2005) . . . . . . . . . . . . . . . . . . . . . . . . . . . . . . . . . . . . . . . 22
Figure 15. Camera stations of the 18 photographs revealing camera positions and angles (Michelle Liss, 2005) . . . . . . . . . . . . . . . . . . . . . . . . . . . . . . . 23
Figure 16. Marked and referenced points on HMS Alert model (Michelle Liss, 2005) . . . . . . . . . . . . . . . . . . . . . . . . . . . . . . . . . . . . . . . . . . . . . . . . . . . . . . 23
v
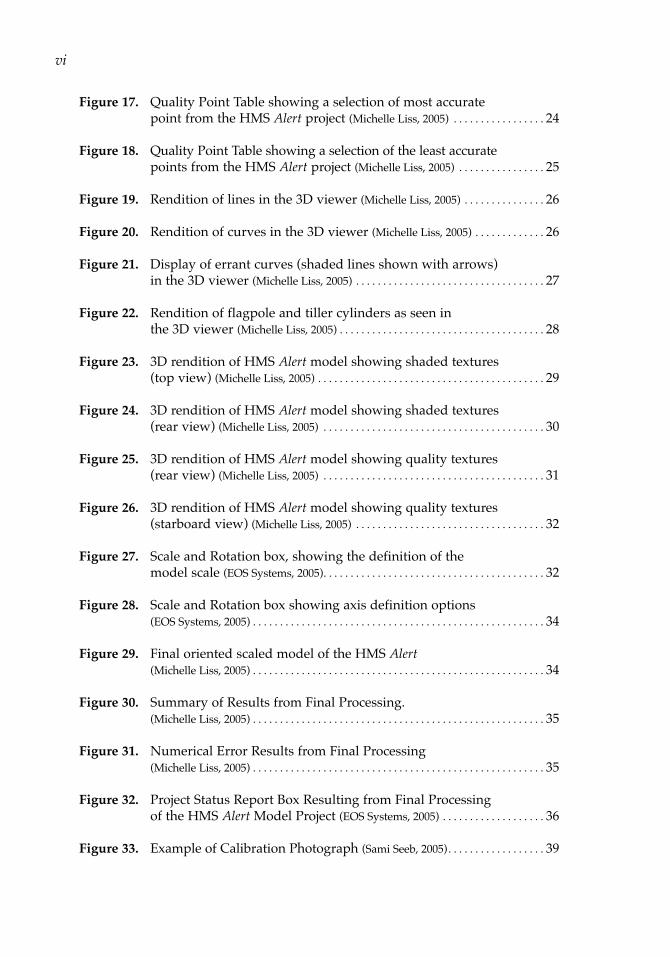
Figure 17. Quality Point Table showing a selection of most accurate point from the HMS Alert project (Michelle Liss, 2005) . . . . . . . . . . . . . . . . . 24
Figure 18. Quality Point Table showing a selection of the least accuratepoints from the HMS Alert project (Michelle Liss, 2005) . . . . . . . . . . . . . . . . 25
Figure 19. Rendition of lines in the 3D viewer (Michelle Liss, 2005) . . . . . . . . . . . . . . . 26
Figure 20. Rendition of curves in the 3D viewer (Michelle Liss, 2005) . . . . . . . . . . . . . 26
Figure 21. Display of errant curves (shaded lines shown with arrows) in the 3D viewer (Michelle Liss, 2005) . . . . . . . . . . . . . . . . . . . . . . . . . . . . . . . . . . . 27
Figure 22. Rendition of flagpole and tiller cylinders as seen in the 3D viewer (Michelle Liss, 2005) . . . . . . . . . . . . . . . . . . . . . . . . . . . . . . . . . . . . . . 28
Figure 23. 3D rendition of HMS Alert model showing shaded textures (top view) (Michelle Liss, 2005) . . . . . . . . . . . . . . . . . . . . . . . . . . . . . . . . . . . . . . . . . . 29
Figure 24. 3D rendition of HMS Alert model showing shaded textures (rear view) (Michelle Liss, 2005) . . . . . . . . . . . . . . . . . . . . . . . . . . . . . . . . . . . . . . . . . 30
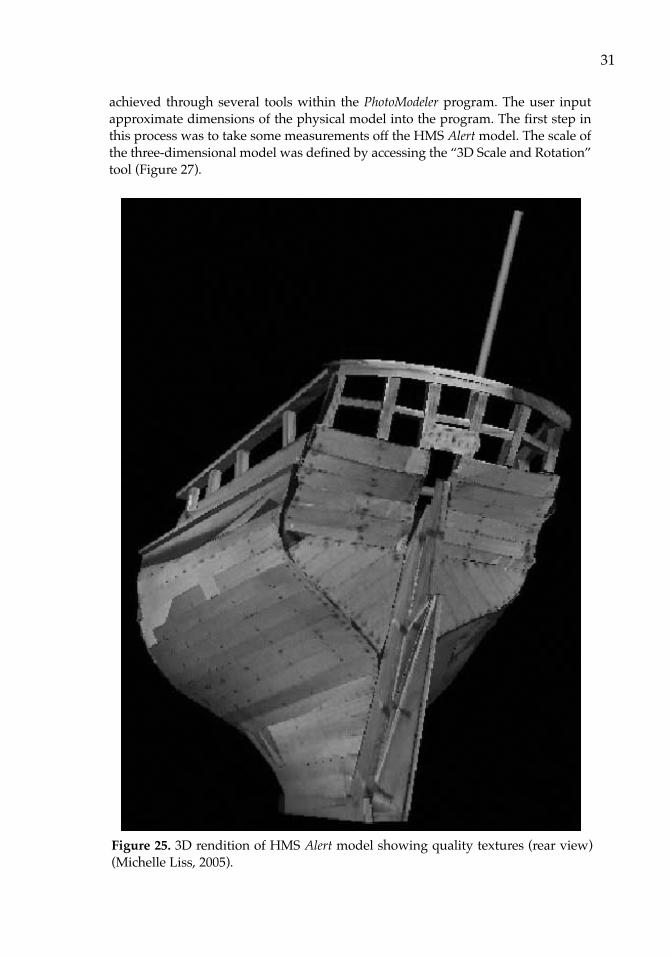
Figure 25. 3D rendition of HMS Alert model showing quality textures (rear view) (Michelle Liss, 2005) . . . . . . . . . . . . . . . . . . . . . . . . . . . . . . . . . . . . . . . . . 31
Figure 26. 3D rendition of HMS Alert model showing quality textures(starboard view) (Michelle Liss, 2005) . . . . . . . . . . . . . . . . . . . . . . . . . . . . . . . . . . . 32
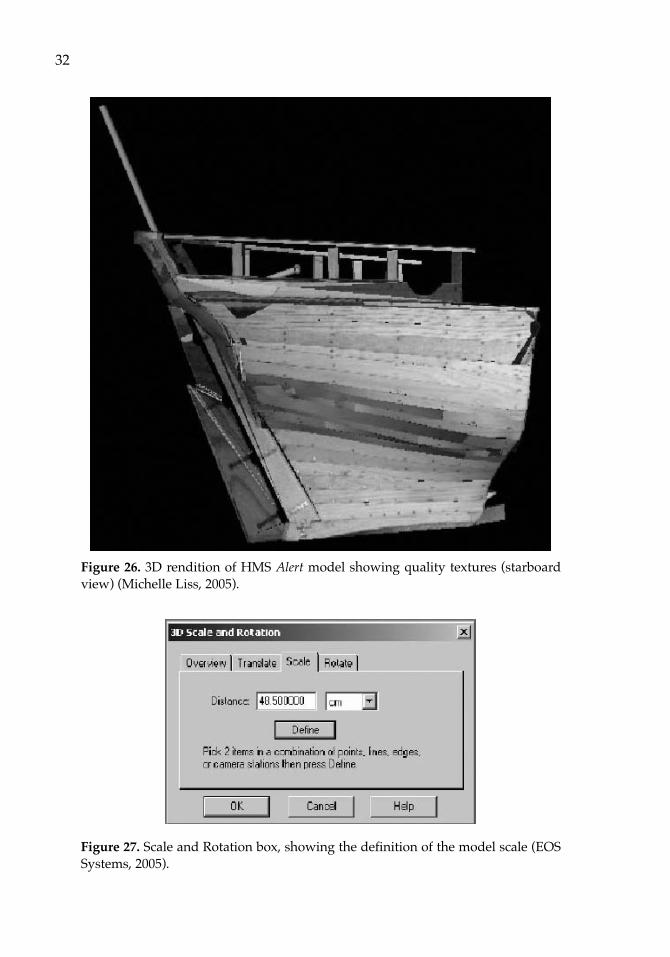
Figure 27. Scale and Rotation box, showing the definition of the model scale (EOS Systems, 2005). . . . . . . . . . . . . . . . . . . . . . . . . . . . . . . . . . . . . . . . . 32
Figure 28. Scale and Rotation box showing axis definition options(EOS Systems, 2005) . . . . . . . . . . . . . . . . . . . . . . . . . . . . . . . . . . . . . . . . . . . . . . . . . . . . . . 34
Figure 29. Final oriented scaled model of the HMS Alert(Michelle Liss, 2005) . . . . . . . . . . . . . . . . . . . . . . . . . . . . . . . . . . . . . . . . . . . . . . . . . . . . . . 34
Figure 30. Summary of Results from Final Processing. (Michelle Liss, 2005) . . . . . . . . . . . . . . . . . . . . . . . . . . . . . . . . . . . . . . . . . . . . . . . . . . . . . . 35
Figure 31. Numerical Error Results from Final Processing (Michelle Liss, 2005) . . . . . . . . . . . . . . . . . . . . . . . . . . . . . . . . . . . . . . . . . . . . . . . . . . . . . . 35
Figure 32. Project Status Report Box Resulting from Final Processing of the HMS Alert Model Project (EOS Systems, 2005) . . . . . . . . . . . . . . . . . . . 36
Figure 33. Example of Calibration Photograph (Sami Seeb, 2005). . . . . . . . . . . . . . . . . . 39
vi
Figure 34. Overview of the photos imported for the project. Six of the twenty-four photographs remained unused(Sami Seeb, 2005) . . . . . . . . . . . . . . . . . . . . . . . . . . . . . . . . . . . . . . . . . . . . . . . . . . . . . . . . . 40
Figure 35. Camera station angles and the camera identifications (Sami Seeb, 2005) . . . . . . . . . . . . . . . . . . . . . . . . . . . . . . . . . . . . . . . . . . . . . . . . . . . . . . . . . 40
Figure 36. Points referenced on completed three-dimensional model (Sami Seeb, 2005) . . . . . . . . . . . . . . . . . . . . . . . . . . . . . . . . . . . . . . . . . . . . . . . . . . . . . . . . . 41
Figure 37. Lines referenced on completed three-dimensional model (Sami Seeb, 2005) . . . . . . . . . . . . . . . . . . . . . . . . . . . . . . . . . . . . . . . . . . . . . . . . . . . . . . . . . 42
Figure 38. Curves referenced on completed three-dimensional model (Sami Seeb, 2005) . . . . . . . . . . . . . . . . . . . . . . . . . . . . . . . . . . . . . . . . . . . . . . . . . . . . . . . . . 43
Figure 39. Edges referenced on completed three-dimensional model (Sami Seeb, 2005) . . . . . . . . . . . . . . . . . . . . . . . . . . . . . . . . . . . . . . . . . . . . . . . . . . . . . . . . . 44
Figure 40. Surfaces and textures on completed three-dimensional model (Sami Seeb, 2005) . . . . . . . . . . . . . . . . . . . . . . . . . . . . . . . . . . . . . . . . . . . . . . . . . . . . . . . . . 44
Figure 41. This point chart shows point 520 has the largest residual error in the project. The most error for the point exists on photo 15. The table provides the necessary information to fix the points with significant error (Sami Seeb, 2005) . . . . . . . . . . . . . . . . . . . . . . . . . . . . . . . . . 45
Figure 42. Some noticeably bad curves on the underside of the model (Sami Seeb, 2005) . . . . . . . . . . . . . . . . . . . . . . . . . . . . . . . . . . . . . . . . . . . . . . . . . . . . . . . . . 46
Figure 43. The iterations and error log produced from processing (Sami Seeb, 2005) . . . . . . . . . . . . . . . . . . . . . . . . . . . . . . . . . . . . . . . . . . . . . . . . . . . . . . . . . 47
Figure 44. Delineation of the measurements taken to check accuracy (Sami Seeb, 2005) . . . . . . . . . . . . . . . . . . . . . . . . . . . . . . . . . . . . . . . . . . . . . . . . . . . . . . . . . 48
Figure 45. Two images showing the same perspective, one in the field and one on the three-dimensional model, demonstrating analysis prospects (Courtesy Maritime Studies Program, ECU © 2002) . . . . . . . . . . . . . . . . . . . . . . . . . . 50
Figure 46. Texture distortions due to light surfaces on photographs (Sami Seeb, 2005) . . . . . . . . . . . . . . . . . . . . . . . . . . . . . . . . . . . . . . . . . . . . . . . . . . . . . . . . . 51
Figure 47. Three points deemed bad references because of the point of view of the photograph. The points mark the same corners, but the program, because of the photo angle, is unable to recognize that they correspond (Sami Seeb, 2005) . . . . . . . . . . . . . . . . . . . . . . 51
vii
Figure 48. A three-dimensional image shows a skewed drawn curve on the photographs appears to be straight (Sami Seeb, 2005) . . . . . . . . . . . . . . 52
Figure 49. Two surfaces created using the swath tool. While it was known that the surfaces exist in space, it was not possible to draw lines to delineate the surfaces there (Sami Seeb, 2005). . . . . . . . . 53
Tables
Table 1. Line accuracy measures. . . . . . . . . . . . . . . . . . . . . . . . . . . . . . . . . . . . . . . . . . . . . . . 15
Table 2. Overall Currituck Survey Statistics. . . . . . . . . . . . . . . . . . . . . . . . . . . . . . . . . . . 15
Table 3. Comparison of scaled measurements from physical model to 3D model . . . . . . . . . . . . . . . . . . . . . . . . . . . . . . . . . . . . . . . . . . . . . . . . . . . . . . . . . . . 33
Table 4. Montana Project PhotoModeler statistics . . . . . . . . . . . . . . . . . . . . . . . . . . . . . . . 47
Table 5. Resulting error with measurement 1 input as scale. . . . . . . . . . . . . . . . . . 49
Table 6. Resulting error with measurement 4 input as scale. . . . . . . . . . . . . . . . . . 49
viii
Abstract
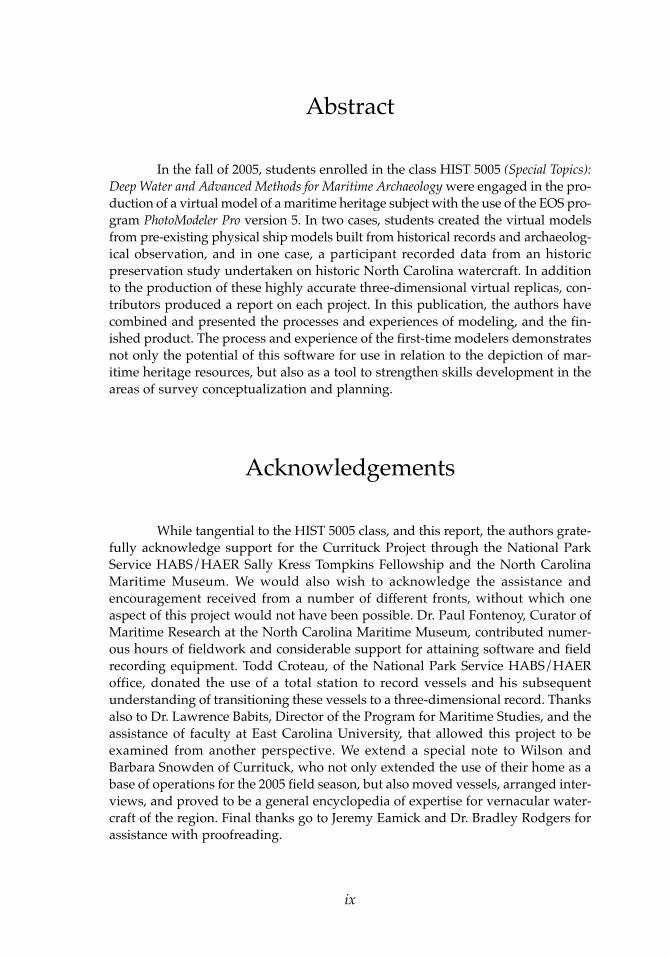
In the fall of 2005, students enrolled in the class HIST 5005 (Special Topics):Deep Water and Advanced Methods for Maritime Archaeology were engaged in the pro-duction of a virtual model of a maritime heritage subject with the use of the EOS pro-gram PhotoModeler Pro version 5. In two cases, students created the virtual modelsfrom pre-existing physical ship models built from historical records and archaeolog-ical observation, and in one case, a participant recorded data from an historicpreservation study undertaken on historic North Carolina watercraft. In additionto the production of these highly accurate three-dimensional virtual replicas, con-tributors produced a report on each project. In this publication, the authors havecombined and presented the processes and experiences of modeling, and the fin-ished product. The process and experience of the first-time modelers demonstratesnot only the potential of this software for use in relation to the depiction of mar-itime heritage resources, but also as a tool to strengthen skills development in theareas of survey conceptualization and planning.
Acknowledgements
While tangential to the HIST 5005 class, and this report, the authors grate-fully acknowledge support for the Currituck Project through the National ParkService HABS/HAER Sally Kress Tompkins Fellowship and the North CarolinaMaritime Museum. We would also wish to acknowledge the assistance andencouragement received from a number of different fronts, without which oneaspect of this project would not have been possible. Dr. Paul Fontenoy, Curator ofMaritime Research at the North Carolina Maritime Museum, contributed numer-ous hours of fieldwork and considerable support for attaining software and fieldrecording equipment. Todd Croteau, of the National Park Service HABS/HAERoffice, donated the use of a total station to record vessels and his subsequentunderstanding of transitioning these vessels to a three-dimensional record. Thanksalso to Dr. Lawrence Babits, Director of the Program for Maritime Studies, and theassistance of faculty at East Carolina University, that allowed this project to beexamined from another perspective. We extend a special note to Wilson andBarbara Snowden of Currituck, who not only extended the use of their home as abase of operations for the 2005 field season, but also moved vessels, arranged inter-views, and proved to be a general encyclopedia of expertise for vernacular water-craft of the region. Final thanks go to Jeremy Eamick and Dr. Bradley Rodgers forassistance with proofreading.
ix

1
Introduction
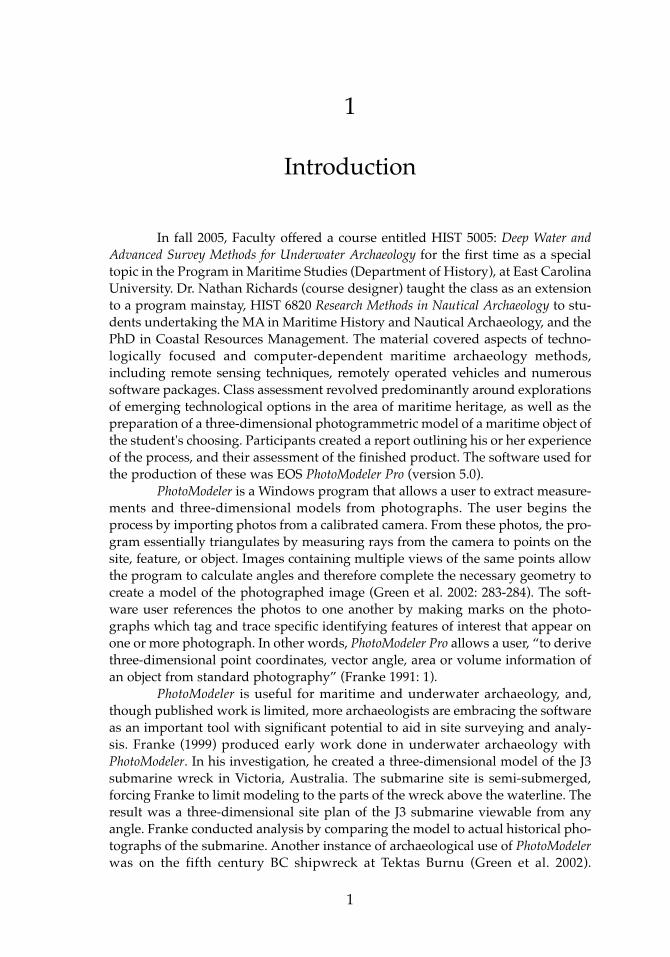
In fall 2005, Faculty offered a course entitled HIST 5005: Deep Water andAdvanced Survey Methods for Underwater Archaeology for the first time as a specialtopic in the Program in Maritime Studies (Department of History), at East CarolinaUniversity. Dr. Nathan Richards (course designer) taught the class as an extensionto a program mainstay, HIST 6820 Research Methods in Nautical Archaeology to stu-dents undertaking the MA in Maritime History and Nautical Archaeology, and thePhD in Coastal Resources Management. The material covered aspects of techno-logically focused and computer-dependent maritime archaeology methods,including remote sensing techniques, remotely operated vehicles and numeroussoftware packages. Class assessment revolved predominantly around explorationsof emerging technological options in the area of maritime heritage, as well as thepreparation of a three-dimensional photogrammetric model of a maritime object ofthe student's choosing. Participants created a report outlining his or her experienceof the process, and their assessment of the finished product. The software used forthe production of these was EOS PhotoModeler Pro (version 5.0).
PhotoModeler is a Windows program that allows a user to extract measure-ments and three-dimensional models from photographs. The user begins theprocess by importing photos from a calibrated camera. From these photos, the pro-gram essentially triangulates by measuring rays from the camera to points on thesite, feature, or object. Images containing multiple views of the same points allowthe program to calculate angles and therefore complete the necessary geometry tocreate a model of the photographed image (Green et al. 2002: 283-284). The soft-ware user references the photos to one another by making marks on the photo-graphs which tag and trace specific identifying features of interest that appear onone or more photograph. In other words, PhotoModeler Pro allows a user, “to derivethree-dimensional point coordinates, vector angle, area or volume information ofan object from standard photography” (Franke 1991: 1).
PhotoModeler is useful for maritime and underwater archaeology, and,though published work is limited, more archaeologists are embracing the softwareas an important tool with significant potential to aid in site surveying and analy-sis. Franke (1999) produced early work done in underwater archaeology withPhotoModeler. In his investigation, he created a three-dimensional model of the J3submarine wreck in Victoria, Australia. The submarine site is semi-submerged,forcing Franke to limit modeling to the parts of the wreck above the waterline. Theresult was a three-dimensional site plan of the J3 submarine viewable from anyangle. Franke conducted analysis by comparing the model to actual historical pho-tographs of the submarine. Another instance of archaeological use of PhotoModelerwas on the fifth century BC shipwreck at Tektas Burnu (Green et al. 2002).
1
Photogrammetry provided a resolution to the problem of conducting divingarchaeological investigations, which must be limited because of the depth of thesite. Using control points put directly onto artifacts surrounded by a control gridenabled archaeologists to map artifacts in three dimensions which were otherwisedifficult or impossible to map.
The photo modeling product provides a tool for archaeologists to conductanalysis that might otherwise be restricted or impossible. Precise measurementsand three-dimensional models allow archaeologists an additional approach to ana-lytical work on sites. In circumstances where time or access to a site is limited,photo modeling provides a means to spend a short time capturing the site digital-ly so that the researcher can create maps and drawings later. Photo modelingmight also help with post-fieldwork analysis, highlighting specific features orcharacteristics that might not have been readily apparent in the field. In addition,PhotoModeler software has an innately predictive character, allowing the user toestimate features that might have been unclear or unnoticed in the field with ahigh level of accuracy. Additionally, photo modeling allows the user to create andview aspects of a site or feature that they could not see while at the site.
By the end of the fall, 2005 semester, the students had produced threehighly-accurate digital photo-models. In one case, this was of an historic smallcraft, reconstructed from photographs taken by a student during a stint of field-work for the National Parks Service in the summer of 2005. In two other cases, par-ticipants constructed photogrammetric replicas from ship models built by facultyand students during Dr. Bradley Rodgers' class HIST 6810: History of MarineArchitecture and Ship Construction. These two models were very different. One, con-structed in 2003 by ECU MA Students Evguenia Anichtenko, Jake Betz, JeffBowdoin, Matt Brenkle, Clint Ethridge, Calvin Mires, Dave Nelson, Jason Rogers,and Travis Snyder emerged from the ship plans of the British Frigate HMS Alert.The other was the product of ECU archaeological inspections of the wreck of thepaddle-steamer Montana (model by Dr. Bradley A. Rodgers). Together, these threephoto-models represent the process and progress of students learning about notonly the strengths and limitations of photogrammetry, but also about photogra-phy, survey, and geometry. The hundreds of hours spent in learning about the pro-gram, photographing their subjects, processing photographs, and fine-tuning theirmodels was an invaluable experience, with lessons that can be extended not onlyto the creation of future photogrammetric models with EOS PhotoModeler Pro soft-ware, but also when creating two-dimensional photo-mosaics. The lessons alsoinvariably influence the development of conceptual skills in general survey plan-ning and execution.
This report is a re-configured, re-contextualized, and expanded amalgamof the three reports submitted in fall 2005 (see Diveley 2005; Liss 2005, Seeb 2005).What follows is a synopsis of the PhotoModeler work flow model common to eachof the participants in the experimentation with the software (Chapter 2), followedby a detailed description of each of the photo-models created throughout thesemester (Chapters 3-5). While the photo-models described in detail in this reportare not without error, they represent an astonishing learning curve that demon-strates that the PhotoModeler Pro 5 software has much potential, and can produce
2

impressive results. Indeed, all of the authors agree that Photomodeler is an amazingtool – and that with further experience and experimentation the few minor problemsnoticed are likely fixable. In particular, had our hardware capabilities included themost up-to-date processors, graphics cards, and expanded memory, we feel thatthe finished product would represent an even more accurate and fault-free product.
3

2
Methodology and Work Flow
All photo modeling projects follow a basic pattern of steps necessary forproducing a three-dimensional model. The steps, outlined by Franke (1999: 2) andthe PhotoModeler user manual (EOS Systems Inc. 2004), delineate the work flow:
1. Plan proposal• Assessment of objectives, budget, and scheduling.• Acquisition of metric compatible cameras.
2. Suitability of PhotoModeler Pro 5.0• Evaluation of proposal in relation to the PhotoModeler software.• Determination of whether coded targets should be used in the project.
If so, estimation of target size based on size of the subject and cameraresolution (EOS Systems Inc. 2004:444).
• Where targets are not utilized, points should be marked on flat surfaces that have no visible reference marks (for example, wherethere is a need to record flare and dead-rise of watercraft).
• Metric compatible cameras should be calibrated using focal lengthssuitable to the project needs. Calibration of the camera should be completed at earliest convenience before survey is to commence.
3. Photographing the object• Targets should be placed on the object or site where necessary. Target
distribution varies depending on the size and scale of the object/site being recorded. Larger sites will require more reference points than smaller ones, although features should be recorded in greatest detailpossible.
• Scales are referenced in photographs to verify accuracy of measure-ments taken on-site. Duplicate photographs should be considered.
• Conditions and shutter speed are important in acquiring the highest depth of field possible. On larger sites and at angles greater than 90°, reference points can be difficult to distinguish if blurry. By increasing aperture/decreasing shutter speed of the camera, the photograph will have better focal accuracy. However, if extending shutter speed at or below 1/60 second, a tripod should be used.
• Depending on the type of vessel, camera stations should be orientatedat as close to 90° angle to one another as possible. Smaller angles will generate an incorrect position for the three-dimensional point(EOS Systems Inc. 2004:69). Similar attention to horizontal and
5
vertical separation should be given to photographing targets when possible (EOS Systems Inc. 2004:71).
• Photographs should only be taken from calibrated focal lengths. When using different calibrated focal lengths, field notebooks shouldbe kept logging changes.
4. Transfer photographs to PhotoModeler Pro 5• Photographs taken in digital format can be transferred to
PhotoModeler Pro using direct link cables.• Printed photographs should be scanned and imported into
PhotoModeler.• Camera calibration, when necessary should be set to specific photo-
graphs used in a PhotoModeler project.
5. Data processing• Use of targets allows the user to automatically reference given points
taken on a project. This process inherently decreases the amount of processing time to reference points.
• When use of targets is not mandated, or possible, manual reference using a mouse to trace and tag individual points in a project is neces-sary. Although this process is labor intensive and often complicated, the system can be used to recreate objects without previous consider-ation of the photogrammetric process.
• Excess data should be tagged if possible to increase accuracy in a project. Data not used in referencing points or from non-orientated photographs can be removed after each vessel is completed.
6. Structuring the model• Similar to step five, referencing using additional points, lines and
surfaces allows greater visualization of the three dimensional object.
7. Representation• Structured models can be visualized and measurements taken using
the 3D viewer. Three-dimensional inspection of the model, layered with photographic textures, can be used for additional analysis.
8. Data export• Surfaced data can be exported to SurfaceWorks or other three-
dimensional viewing and manipulation programs such as Cosmo Player. Architectural line drawings and ship curves arederived based on three-dimensional data collected in this process.
• x, y, and z points can also be exported to Computer Aided Design (CAD) software packages or applicable software application.
6
3
The Watercraft ofCurrituck County, North Carolina
Introduction
This chapter describes the use of survey techniques in recording tradition-al watercraft off the Outer Banks of North Carolina, and the subsequent use of doc-umentation to re-create a three-dimensional photogrammetric model of thesevessels without the use of expensive hardware. Technological advances and newmethods of application have seen the development of improved photogrammetricmethods to record cultural heritage. The evolution of these tools and their applica-tion to terrestrial and maritime archaeological environments has expanded signifi-cantly with each new version of software released.
A grant supported by the National Park Service's historic preservationeffort, the Historic American Buildings Survey/Historic American EngineeringRecord (HABS/HAER), and the North Carolina Maritime Museum in Beaufort,North Carolina initiated the preliminary survey of North Carolina Outer Bankswatercraft. Parameters of the project included historic documentation, photograph-ic recording, and two-dimensional/three-dimensional representations of projectdata using SurfaceWorks 5.0. Funding for the project specifically provided for per-sonnel, software, and hardware use, specifically that of a Sokkia total station for theduration of the two month survey.
Although costs incurred throughout this project were justified in the surveyproposal, recording vessels of this type, specifically using PhotoModeler to recordthree-dimensional spatial location, could obviate the use of expensive equipmentsuch as the total station. This chapter intends to discuss the inherent advantages anddisadvantages of using PhotoModeler Pro 5 as a viable means to record watercraft.
Project History
As per the parameters of the project, the survey had three separate com-ponents. The first included historic documentation of each vessel in the Curritucksurvey, regional background, vessel history, and builder and owner informationwhen possible. The second component consisted of low resolution and high reso-lution photographic documentation of each vessel in accordance with archivalstandards and guidelines for national archive submission. The third aspect of thisproject involved the software SurfaceWorks 5.0 and included the use of a Sokkiatotal station to record two-dimensional and three-dimensional features of eachvessel in the survey.
7
A Sokkia total station collected initial project data (x, y, and z values) alongstations noted on the hull surface. Stations consisted of various points to record hullflare and dead-rise as well as specific design and construction features such ascombing, rub-rail, keel, keelson, shoe, transom, beam, shaft, rudder, prop, and var-ious deck-side components. These points were later transferred to SurfaceWorks 5.0,a program that allows users to re-create three-dimensional drawings based on theseries of points taken in each project. SurfaceWorks recreations can be easily convert-ed to architectural line drawings based on points recorded on the vessel. While thischapter does not address the specific benefits of using SurfaceWorks, the applicationof PhotoModeler to this software will be addressed later.
Of the 32 vessels in the Currituck survey project, NCHH0025 became therepresentative model for this photo-modeling project. As mentioned above, photo-graphic consideration was given based on the parameters of the project, which con-sisted of recording individual features of each vessel. However, because over 280photographs were taken at a resolution of 7.1 mega-pixels, there was a high proba-bility that there would be a greater diversity of photographic options available inthe photogrammetric process. While technically only one photograph is necessaryto create a photo-model of a vessel of this type, with pronounced dead-rise and flareof the hull sections, additional photographs were considered necessary to includesections not in focus or not visible.
Vessel NCHH0025 is currently catalogued with the North Carolina historicvessel registry database at the Maritime Museum in Beaufort, North Carolina (NCHABS/HAER Database). Built by Burbel Beasley in 1958, vessel NCHH0025 is oneof few surviving personal and recreational watercraft specific to regions of NorthCarolina and southern Virginia. Beasley, an engineer at the Ford Plant in Virginia,built the vessel on commission to Ranier Collins, of Currituck, NC (Wilson Sowden2005, pers. comm.).
Collins later used NCHH0025 as a transport carrier that brought workersfrom Church Island to Corolla and back. In 1964, Collins transferred vessel registra-tion to the Whalehead Club, and it again changed hands in 1966 when the club soldthe vessel to Atlantic Research, which was engaged in testing rocket fuel and spacerockets off the islands of the Outer Banks of North Carolina (North CarolinaDepartment of Fish and Game (NCDFG) 1964, 1966). Atlantic Research again usedvessel NCHH0025 to transport its employees to and from work sites. Local historiansnote that during this period, Collins helped install a jet engine into the boat, whichsupposedly broke up shortly after running into the marsh during a test run.
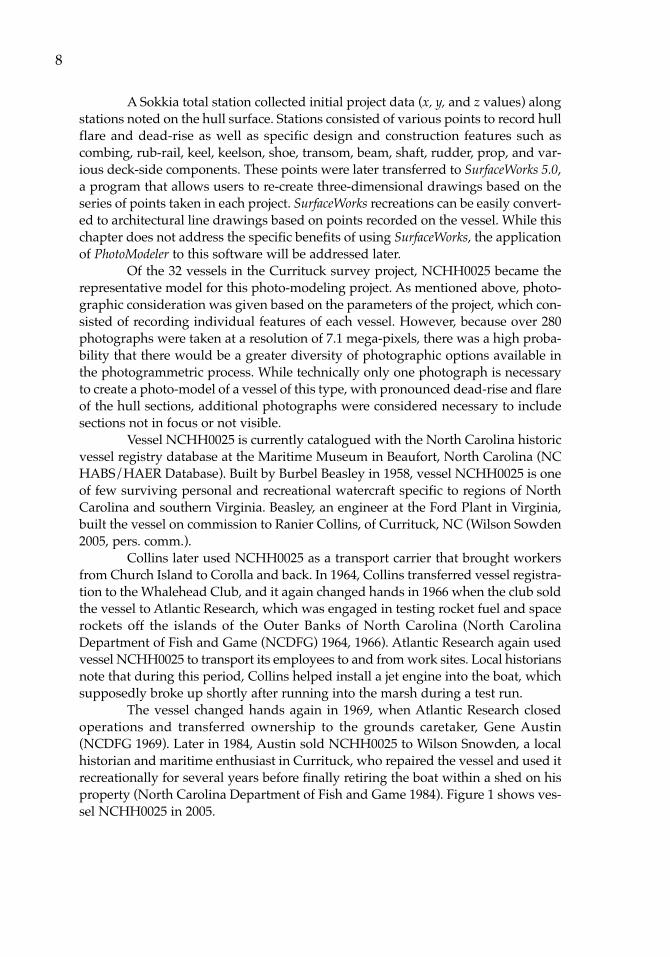
The vessel changed hands again in 1969, when Atlantic Research closedoperations and transferred ownership to the grounds caretaker, Gene Austin(NCDFG 1969). Later in 1984, Austin sold NCHH0025 to Wilson Snowden, a localhistorian and maritime enthusiast in Currituck, who repaired the vessel and used itrecreationally for several years before finally retiring the boat within a shed on hisproperty (North Carolina Department of Fish and Game 1984). Figure 1 shows ves-sel NCHH0025 in 2005.
8
During the course of this project, NCHH0025 was identified for inclusionin the 2005 survey. Despite having been stored away for almost thirty years, thevessel was in remarkably good shape. Some noted sagging and hogging was doc-umented, but overall conditions were very good given the period in storage. Afterproject participants removed the vessel from its storage facility, they took photo-graphs and total station points on the vessel. Additional line drawings were madeto record construction features, including the pronounced dead-rise in the transomand extreme flare in the bow section. Beasley is noted for this type of vessel con-struction.
In applying a PhotoModeler project to the selected photographs taken in theCurrituck survey, several assumptions had to be made. First, the edge tool wasused to estimate potential points located along pronounced curves and on photo-graphs with limited focal integrity. Initial tests processed with high error residuals.Edged points proved to be highly inaccurate and increased the number of overallprocessing iterations well beyond acceptable limitations. Summarily edged pointswere removed and project error returned to normal levels.
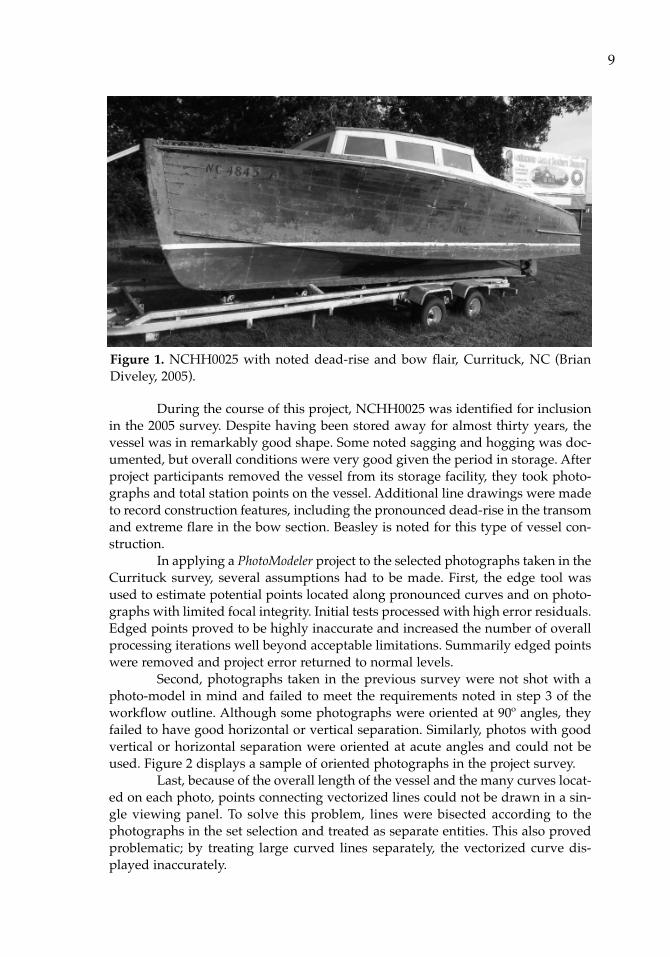
Second, photographs taken in the previous survey were not shot with aphoto-model in mind and failed to meet the requirements noted in step 3 of theworkflow outline. Although some photographs were oriented at 90º angles, theyfailed to have good horizontal or vertical separation. Similarly, photos with goodvertical or horizontal separation were oriented at acute angles and could not beused. Figure 2 displays a sample of oriented photographs in the project survey.
Last, because of the overall length of the vessel and the many curves locat-ed on each photo, points connecting vectorized lines could not be drawn in a sin-gle viewing panel. To solve this problem, lines were bisected according to thephotographs in the set selection and treated as separate entities. This also provedproblematic; by treating large curved lines separately, the vectorized curve dis-played inaccurately.
9
Figure 1. NCHH0025 with noted dead-rise and bow flair, Currituck, NC (BrianDiveley, 2005).
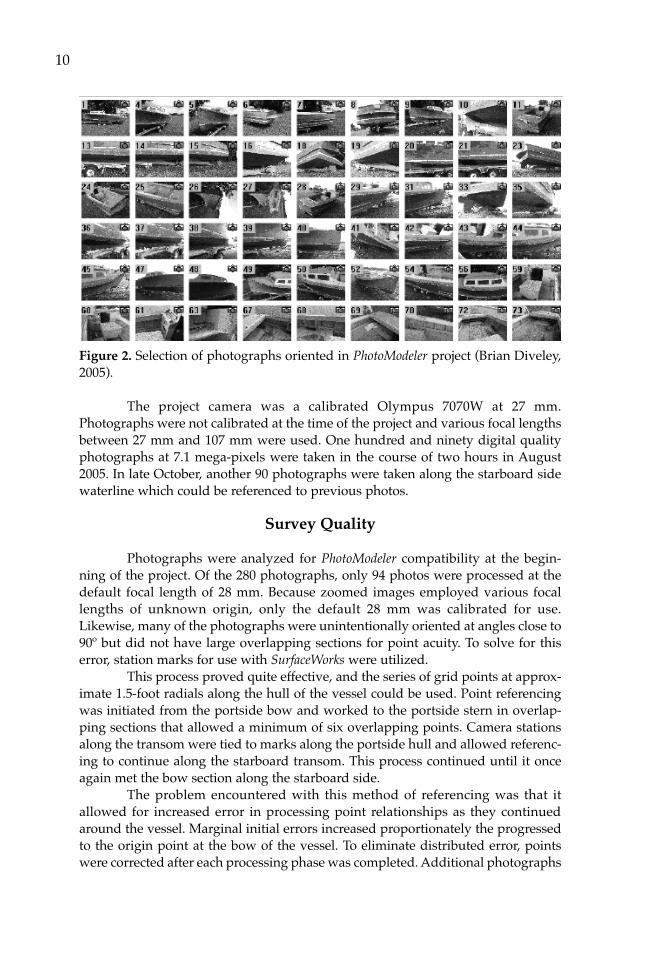
Figure 2. Selection of photographs oriented in PhotoModeler project (Brian Diveley,2005).
The project camera was a calibrated Olympus 7070W at 27 mm.Photographs were not calibrated at the time of the project and various focal lengthsbetween 27 mm and 107 mm were used. One hundred and ninety digital qualityphotographs at 7.1 mega-pixels were taken in the course of two hours in August2005. In late October, another 90 photographs were taken along the starboard sidewaterline which could be referenced to previous photos.
Survey Quality
Photographs were analyzed for PhotoModeler compatibility at the begin-ning of the project. Of the 280 photographs, only 94 photos were processed at thedefault focal length of 28 mm. Because zoomed images employed various focallengths of unknown origin, only the default 28 mm was calibrated for use.Likewise, many of the photographs were unintentionally oriented at angles close to90º but did not have large overlapping sections for point acuity. To solve for thiserror, station marks for use with SurfaceWorks were utilized.
This process proved quite effective, and the series of grid points at approx-imate 1.5-foot radials along the hull of the vessel could be used. Point referencingwas initiated from the portside bow and worked to the portside stern in overlap-ping sections that allowed a minimum of six overlapping points. Camera stationsalong the transom were tied to marks along the portside hull and allowed referenc-ing to continue along the starboard transom. This process continued until it onceagain met the bow section along the starboard side.
The problem encountered with this method of referencing was that itallowed for increased error in processing point relationships as they continuedaround the vessel. Marginal initial errors increased proportionately the progressedto the origin point at the bow of the vessel. To eliminate distributed error, pointswere corrected after each processing phase was completed. Additional photographs
10
spanning the length of the vessel were added to the data collection and althoughthese did not have high resolution and pinpoint accuracy, they allowed marked sec-tions to be accurately related to one another.
Once the vessel exterior was marked, evaluation was possible. Detailedmeasurement of the bow at various points showed a marked deviation of 0.5 inches.With a low project distribution error of 1.4 pixels in a 7.1 mega-pixel image, addi-tional points marking combing, rub-rail, and deck-side features were referenced.The point references used are illustrated in Figure 3.
Figure 3. Point references on NCHH0025 from starboard bow (Brian Diveley, 2005).
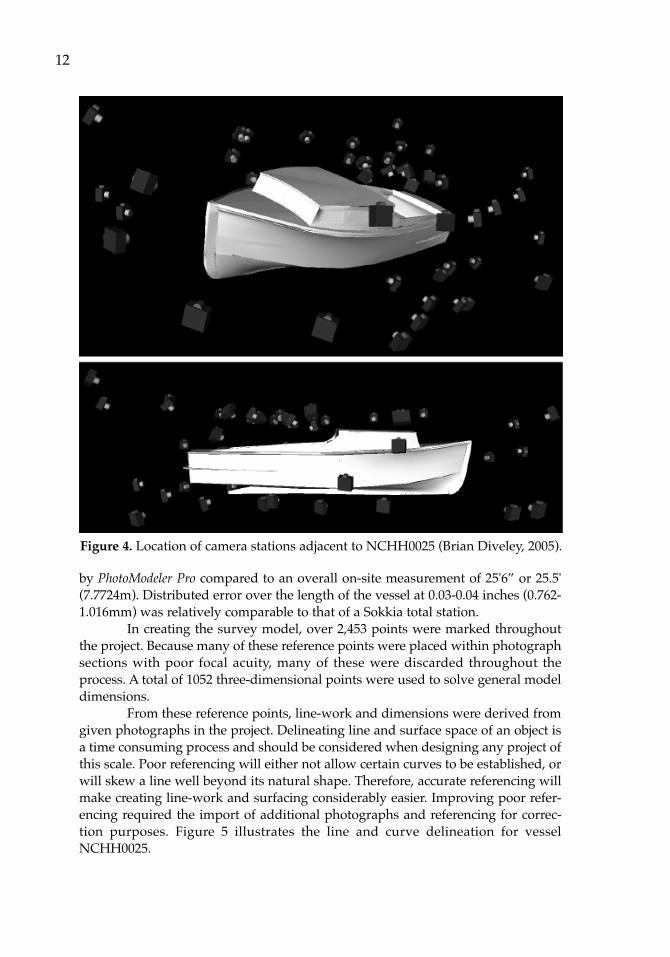
Visibility along the underside of the vessel diminished significantly due toshading, vessel curves, perspective, and focus. To correct for missing referencepoints, the second photo set was imported into the project. In total, 54 qualifiedimages were sufficient to model vessel NCHH0025. The points of view of theseimages, or camera stations, are noted in Figure 4.
Survey Accuracy
With reference points in place, general orientation of the vessel can beestablished. The origin of the coordinate system was set with an x, y, and z axis. Thex axis was established along the port side length of the vessel from bow to stern.The y axis was assigned to the beam along the transom and the z axis was set atright angles to the deck. If incorporating a project into SurfaceWorks, orientation canbe set up in either program. However, this setup in SurfaceWorks is significantly eas-ier and recommended over PhotoModeler's rotation feature.
Model scale was established through camera calibration and was estimatedby the overall point distribution over given photographs in a project. Measurementsof the vessel are made directly through the measure tool in PhotoModeler. Overallvessel length through given points at the bow and stern measures 25.538' (7.78998 m)
11
by PhotoModeler Pro compared to an overall on-site measurement of 25'6” or 25.5'(7.7724m). Distributed error over the length of the vessel at 0.03-0.04 inches (0.762-1.016mm) was relatively comparable to that of a Sokkia total station.
In creating the survey model, over 2,453 points were marked throughoutthe project. Because many of these reference points were placed within photographsections with poor focal acuity, many of these were discarded throughout theprocess. A total of 1052 three-dimensional points were used to solve general modeldimensions.
From these reference points, line-work and dimensions were derived fromgiven photographs in the project. Delineating line and surface space of an object isa time consuming process and should be considered when designing any project ofthis scale. Poor referencing will either not allow certain curves to be established, orwill skew a line well beyond its natural shape. Therefore, accurate referencing willmake creating line-work and surfacing considerably easier. Improving poor refer-encing required the import of additional photographs and referencing for correc-tion purposes. Figure 5 illustrates the line and curve delineation for vesselNCHH0025.
12
Figure 4. Location of camera stations adjacent to NCHH0025 (Brian Diveley, 2005).
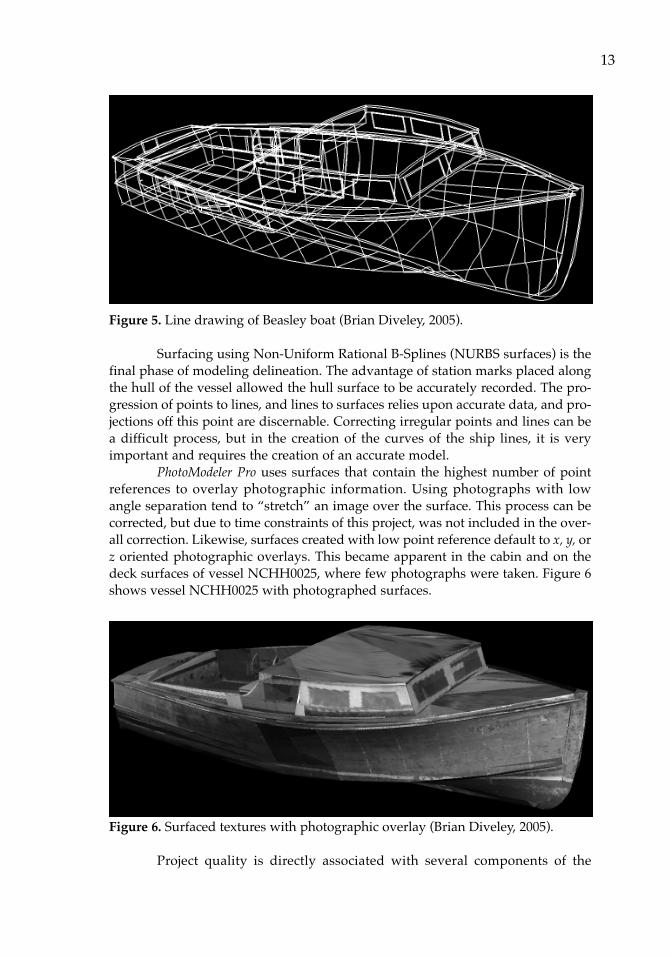
Figure 5. Line drawing of Beasley boat (Brian Diveley, 2005).
Surfacing using Non-Uniform Rational B-Splines (NURBS surfaces) is thefinal phase of modeling delineation. The advantage of station marks placed alongthe hull of the vessel allowed the hull surface to be accurately recorded. The pro-gression of points to lines, and lines to surfaces relies upon accurate data, and pro-jections off this point are discernable. Correcting irregular points and lines can bea difficult process, but in the creation of the curves of the ship lines, it is veryimportant and requires the creation of an accurate model.
PhotoModeler Pro uses surfaces that contain the highest number of pointreferences to overlay photographic information. Using photographs with lowangle separation tend to “stretch” an image over the surface. This process can becorrected, but due to time constraints of this project, was not included in the over-all correction. Likewise, surfaces created with low point reference default to x, y, orz oriented photographic overlays. This became apparent in the cabin and on thedeck surfaces of vessel NCHH0025, where few photographs were taken. Figure 6shows vessel NCHH0025 with photographed surfaces.
Figure 6. Surfaced textures with photographic overlay (Brian Diveley, 2005).
Project quality is directly associated with several components of the
13
PhotoModeler program which rely on quality of camera calibration, resolution of thecamera, geometry of the camera positions, and the precision of user marks on pho-tographic images (EOS Systems Inc. 2004:435). Accuracy measure of 1:5,000 orhigher is assumed for a project of this size and is classified between average accu-racy and highest accuracy. Estimates are based on 7.1 mega-pixel digital output,calibrated camera, between 20 and 90 degree angle separation of photos, 13 pointsper photo, 13-78% coverage, and naturally lit target set (EOS Systems Inc.2004:438).
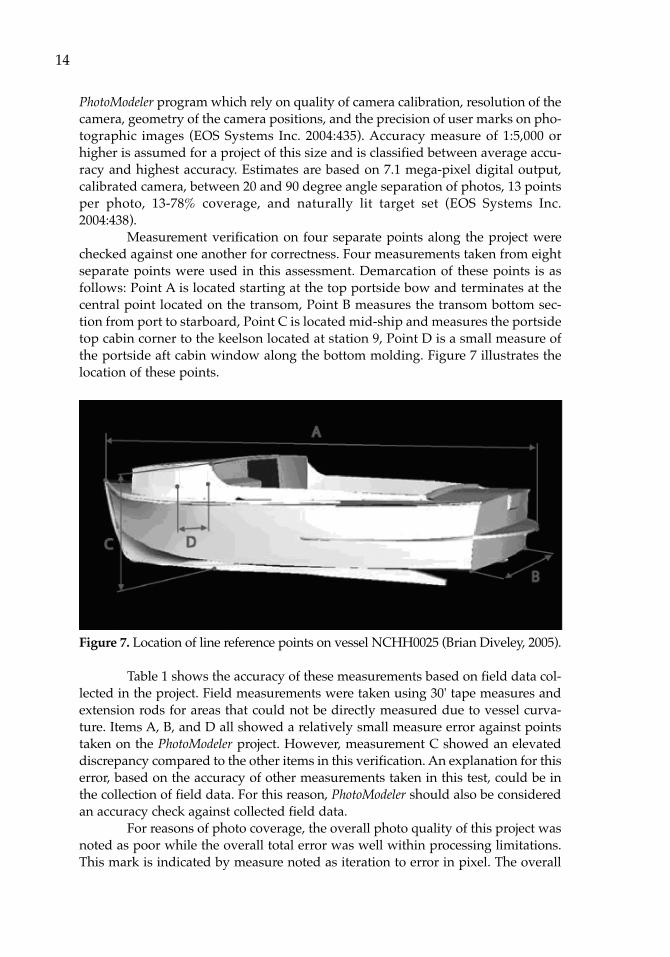
Measurement verification on four separate points along the project werechecked against one another for correctness. Four measurements taken from eightseparate points were used in this assessment. Demarcation of these points is asfollows: Point A is located starting at the top portside bow and terminates at thecentral point located on the transom, Point B measures the transom bottom sec-tion from port to starboard, Point C is located mid-ship and measures the portsidetop cabin corner to the keelson located at station 9, Point D is a small measure ofthe portside aft cabin window along the bottom molding. Figure 7 illustrates thelocation of these points.
Figure 7. Location of line reference points on vessel NCHH0025 (Brian Diveley, 2005).
Table 1 shows the accuracy of these measurements based on field data col-lected in the project. Field measurements were taken using 30' tape measures andextension rods for areas that could not be directly measured due to vessel curva-ture. Items A, B, and D all showed a relatively small measure error against pointstaken on the PhotoModeler project. However, measurement C showed an elevateddiscrepancy compared to the other items in this verification. An explanation for thiserror, based on the accuracy of other measurements taken in this test, could be inthe collection of field data. For this reason, PhotoModeler should also be consideredan accuracy check against collected field data.
For reasons of photo coverage, the overall photo quality of this project wasnoted as poor while the overall total error was well within processing limitations.This mark is indicated by measure noted as iteration to error in pixel. The overall
14
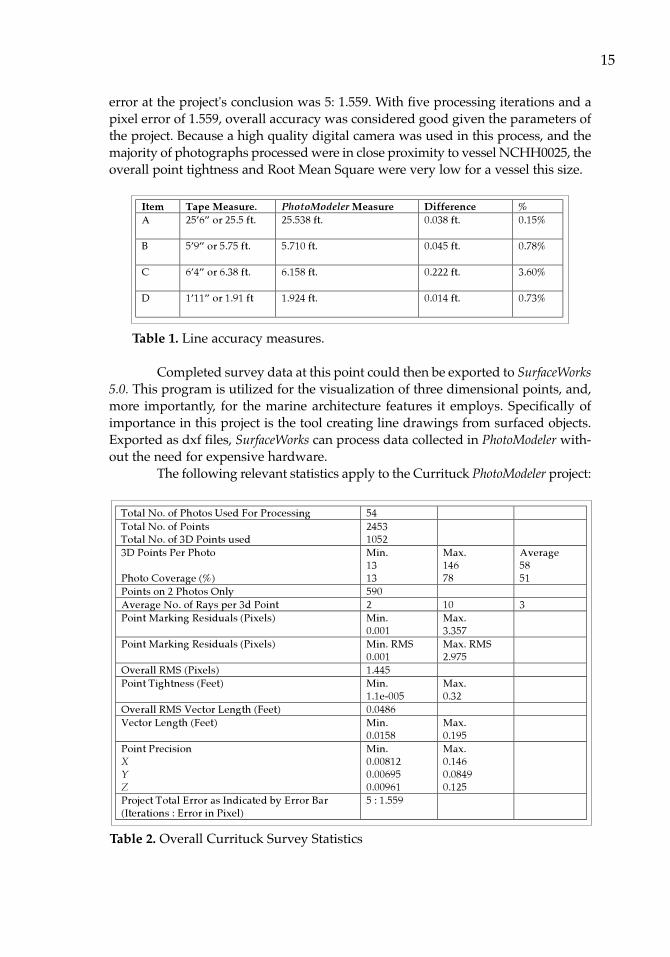
error at the project's conclusion was 5: 1.559. With five processing iterations and apixel error of 1.559, overall accuracy was considered good given the parameters ofthe project. Because a high quality digital camera was used in this process, and themajority of photographs processed were in close proximity to vessel NCHH0025, theoverall point tightness and Root Mean Square were very low for a vessel this size.
Completed survey data at this point could then be exported to SurfaceWorks5.0. This program is utilized for the visualization of three dimensional points, and,more importantly, for the marine architecture features it employs. Specifically ofimportance in this project is the tool creating line drawings from surfaced objects.Exported as dxf files, SurfaceWorks can process data collected in PhotoModeler with-out the need for expensive hardware.
The following relevant statistics apply to the Currituck PhotoModeler project:
15
Table 1. Line accuracy measures.
Item Tape Measure. PhotoModeler Measure Difference %
A 25’6” or 25.5 ft. 25.538 ft. 0.038 ft. 0.15%
B 5’9” or 5.75 ft. 5.710 ft. 0.045 ft. 0.78%
C 6’4” or 6.38 ft. 6.158 ft. 0.222 ft. 3.60%
D 1’11” or 1.91 ft 1.924 ft. 0.014 ft. 0.73%
Total No. of Photos Used For Processing 54Total No. of PointsTotal No. of 3D Points used
24531052
3D Points Per Photo
Photo Coverage (%)
Min.1313
Max.14678
Average5851
Points on 2 Photos Only 590Average No. of Rays per 3d Point 2 10 3Point Marking Residuals (Pixels) Min.
0.001Max.3.357
Point Marking Residuals (Pixels) Min. RMS0.001
Max. RMS2.975
Overall RMS (Pixels) 1.445Point Tightness (Feet) Min.
1.1e-005Max.0.32
Overall RMS Vector Length (Feet) 0.0486Vector Length (Feet) Min.
0.0158Max.0.195
Point PrecisionX
Y
Z
Min.0.008120.006950.00961
Max.0.1460.08490.125
Project Total Error as Indicated by Error Bar(Iterations : Error in Pixel)
5 : 1.559
Table 2. Overall Currituck Survey Statistics

Conclusions
Based on data presented in this project, use of PhotoModeler Pro 5 presentsnew options for collecting field data, specifically in maritime heritage survey. Inaddition to being a useful method to evaluate field data collection, one of the mostimportant features is the relative inexpensive cost compared to expensive hardwarealternatives. Although this chapter does not recommend one method over another,it does present PhotoModeler Pro 5 as a viable option for projects of this type andshould be considered with small craft survey.
Yet there are definitive drawbacks to PhotoModeler, specifically in theamount of manual processing required and instruction necessary to become profi-cient in use of this software. Proficiency in the PhotoModeler environment are notrequired, but is especially useful when designing and solving problems inherentwhen processing data. Additionally, target marking and auto-reference features ofPhotoModeler could alleviate much of the time required to process large projects ofthis size in future PhotoModeler projects. This method is practical in design, but itsapplication still requires assessment.
PhotoModeler is also an efficient tool in the examination of field data andrecording accuracy in a given project. This process allows measurements to bechecked against one another and provides information about recorder accuracy inthe field. Likewise, field measurements, as shown in this project, can be used tocheck PhotoModeler accuracy.
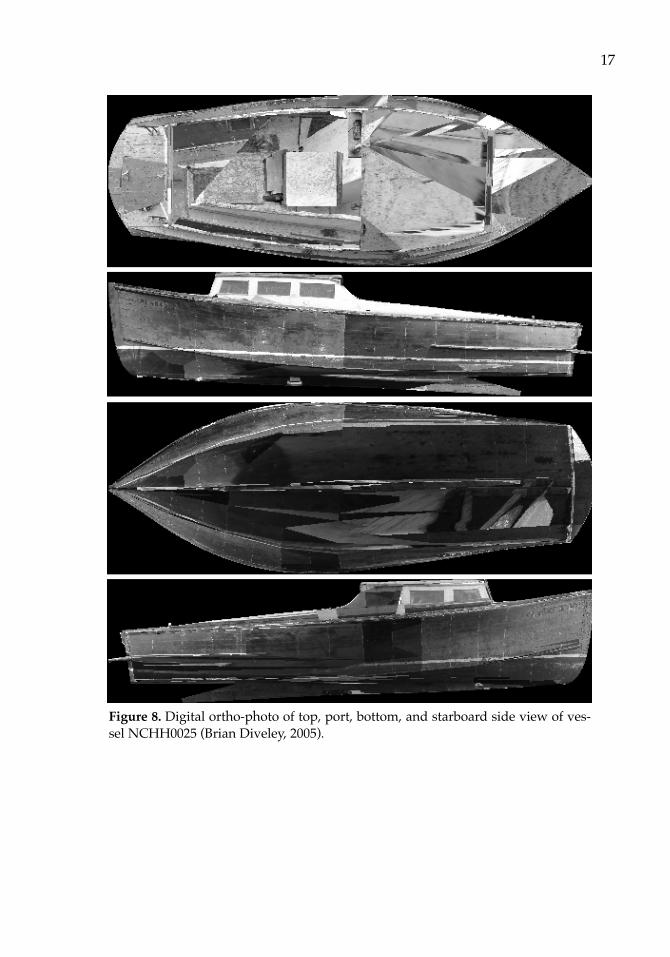
The final component examined in this project was PhotoModeler's orthophotocreation capability (Figures 8 and 9) and seamless integration with SurfaceWorks 5.Importing PhotoModeler data into SurfaceWorks allows users to construct marinearchitecture line drawings of archival quality in a relatively short period. Thisprocess is reliant on the use of auto-referencing techniques to decrease the amountof referencing time required in a project.
16
17
Figure 8. Digital ortho-photo of top, port, bottom, and starboard side view of ves-sel NCHH0025 (Brian Diveley, 2005).
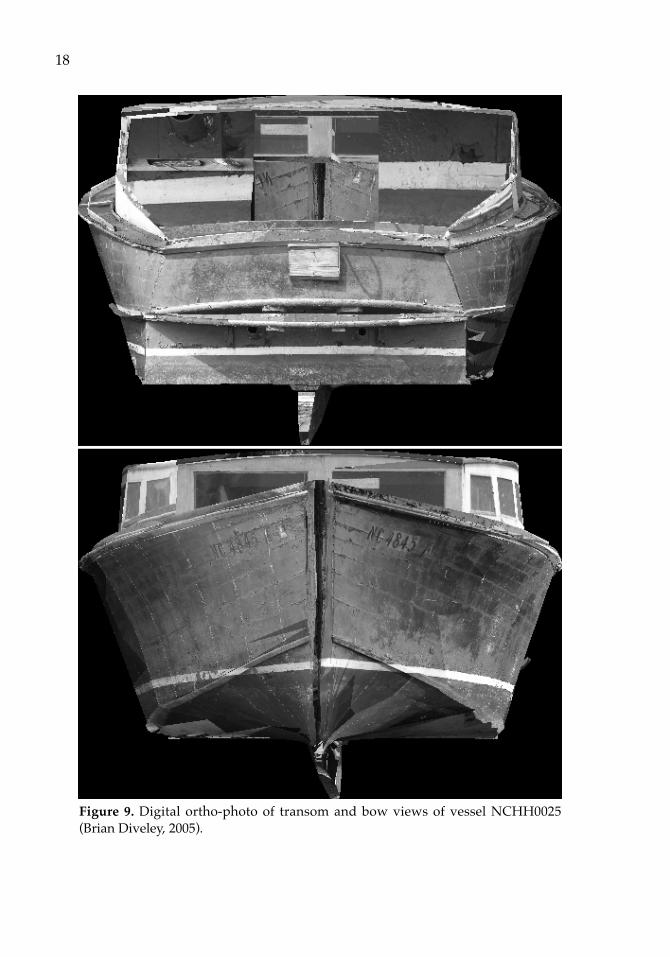
Figure 9. Digital ortho-photo of transom and bow views of vessel NCHH0025(Brian Diveley, 2005).
18
19
Figure 10. Amidships cross-section (Anichtenko et al., 2003).
4
Modeling HMS Alert
Introduction
The objective of this project was to create a three-dimensional model of thestern portion of the HMS Alert ship model. The result of this project is going to bethe eventual production of the models on the World Wide Web. This will allowviewers from all over the world to see the kinds of projects former and current stu-dents have completed. It will also serve as an advertisement to the capabilities ofthe Maritime Studies Program at East Carolina University (http://www.ecu.edu/maritime/cou5005a.htm).
Project History
The HMS Alert ship model was constructed for a project during the EastCarolina University ship construction class of 2003. Every year the ship construc-tion class builds models of historic shipwrecks to learn, hands on, how historicships were erected. That year the entire class, consisting of Evguenia Anichtenko,Jake Betz, Jeff Boudoin, Matt Brenkle, Clint Ethridge, Calvin Mires, Dave Nelson,Jason Rogers, and Travis Snyder, worked on the construction of the three part HMSAlert model. The entire model consisted of a bow section, an amidships section, anda stern section. The three parts of the model were constructed using the same scale,so the separate sections could be fitted together to model the entire ship.
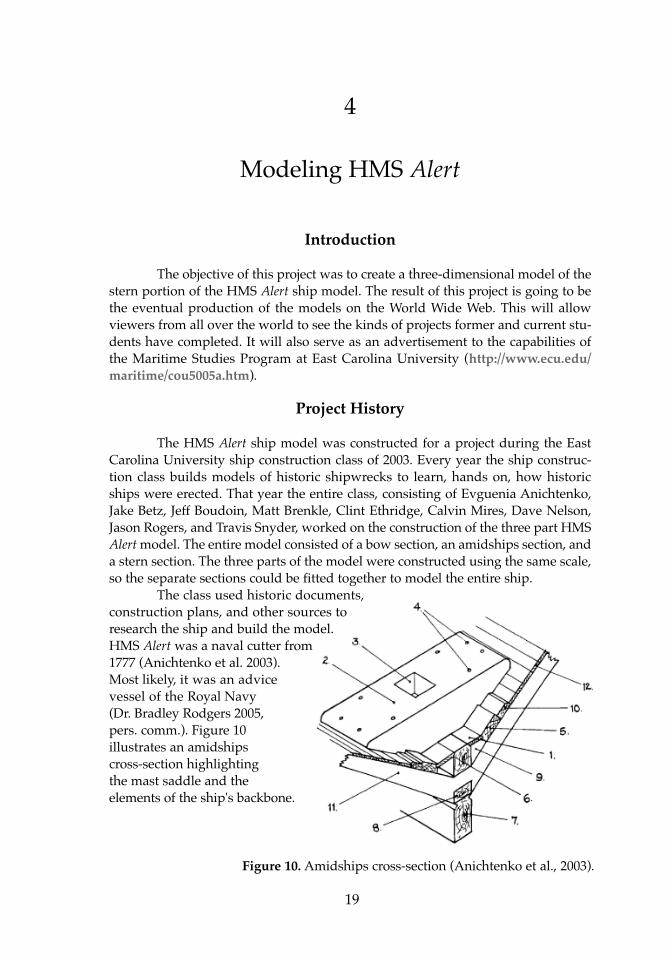
The class used historic documents, construction plans, and other sources to research the ship and build the model. HMS Alert was a naval cutter from 1777 (Anichtenko et al. 2003). Most likely, it was an advice vessel of the Royal Navy (Dr. Bradley Rodgers 2005, pers. comm.). Figure 10 illustrates an amidships cross-section highlighting the mast saddle and the elements of the ship's backbone.
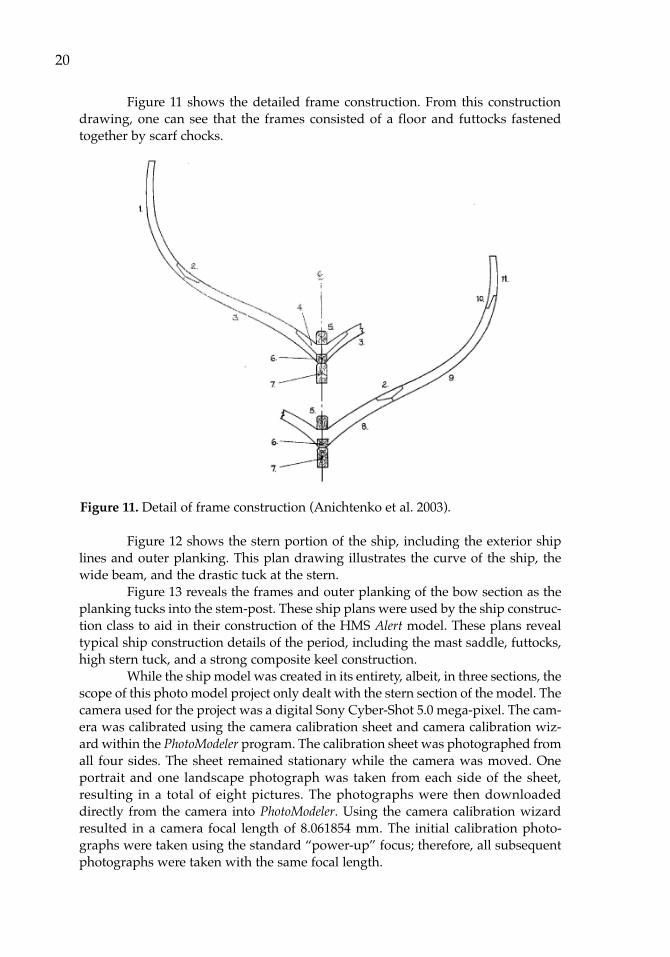
Figure 11 shows the detailed frame construction. From this constructiondrawing, one can see that the frames consisted of a floor and futtocks fastenedtogether by scarf chocks.
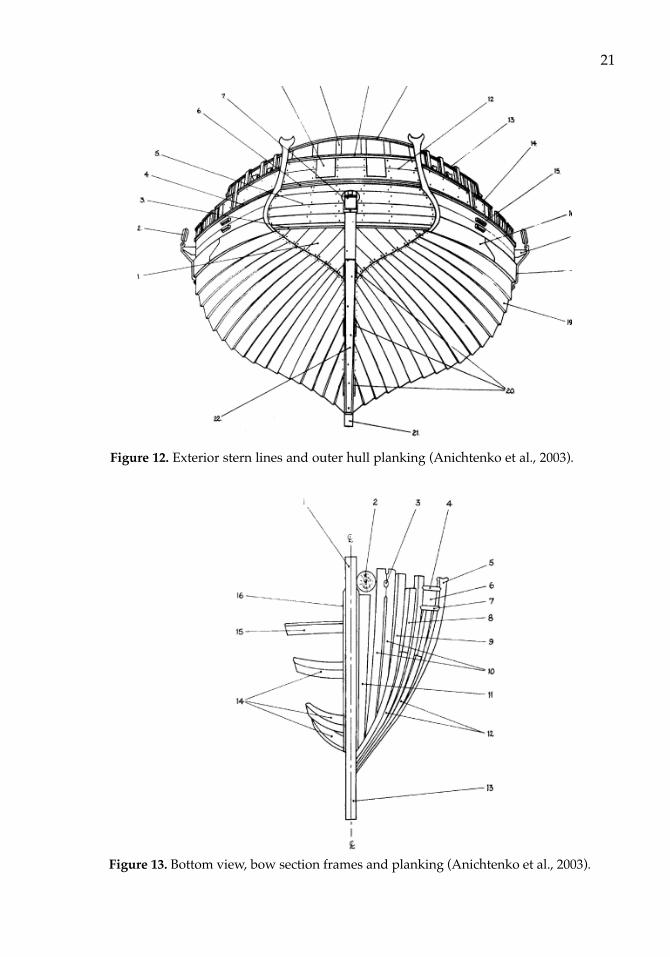
Figure 12 shows the stern portion of the ship, including the exterior shiplines and outer planking. This plan drawing illustrates the curve of the ship, thewide beam, and the drastic tuck at the stern.
Figure 13 reveals the frames and outer planking of the bow section as theplanking tucks into the stem-post. These ship plans were used by the ship construc-tion class to aid in their construction of the HMS Alert model. These plans revealtypical ship construction details of the period, including the mast saddle, futtocks,high stern tuck, and a strong composite keel construction.
While the ship model was created in its entirety, albeit, in three sections, thescope of this photo model project only dealt with the stern section of the model. Thecamera used for the project was a digital Sony Cyber-Shot 5.0 mega-pixel. The cam-era was calibrated using the camera calibration sheet and camera calibration wiz-ard within the PhotoModeler program. The calibration sheet was photographed fromall four sides. The sheet remained stationary while the camera was moved. Oneportrait and one landscape photograph was taken from each side of the sheet,resulting in a total of eight pictures. The photographs were then downloadeddirectly from the camera into PhotoModeler. Using the camera calibration wizardresulted in a camera focal length of 8.061854 mm. The initial calibration photo-graphs were taken using the standard “power-up” focus; therefore, all subsequentphotographs were taken with the same focal length.
20
Figure 11. Detail of frame construction (Anichtenko et al. 2003).
21
Figure 12. Exterior stern lines and outer hull planking (Anichtenko et al., 2003).
Figure 13. Bottom view, bow section frames and planking (Anichtenko et al., 2003).
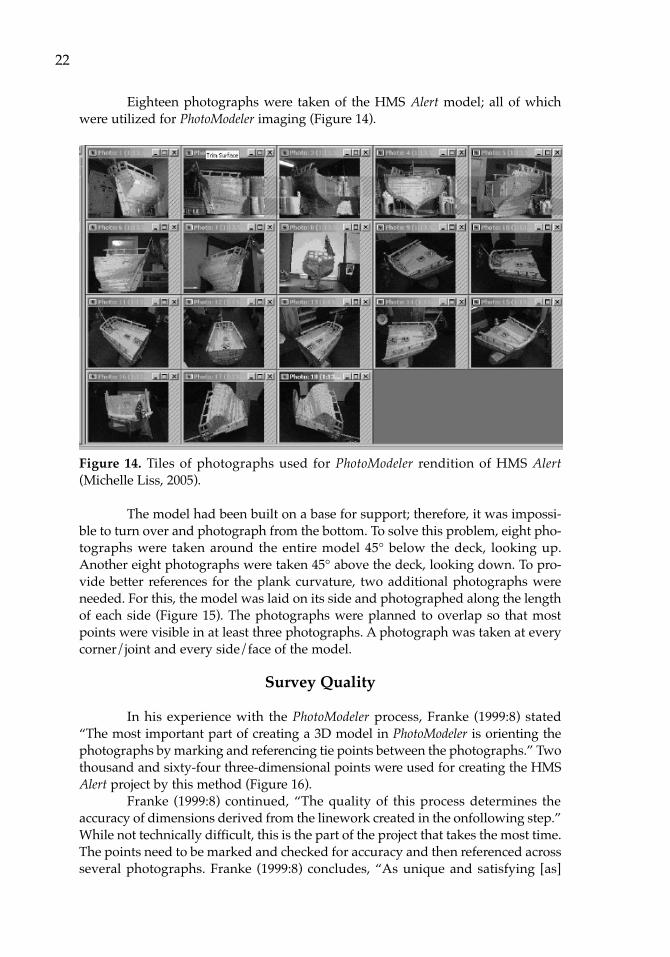
Eighteen photographs were taken of the HMS Alert model; all of whichwere utilized for PhotoModeler imaging (Figure 14).
Figure 14. Tiles of photographs used for PhotoModeler rendition of HMS Alert(Michelle Liss, 2005).
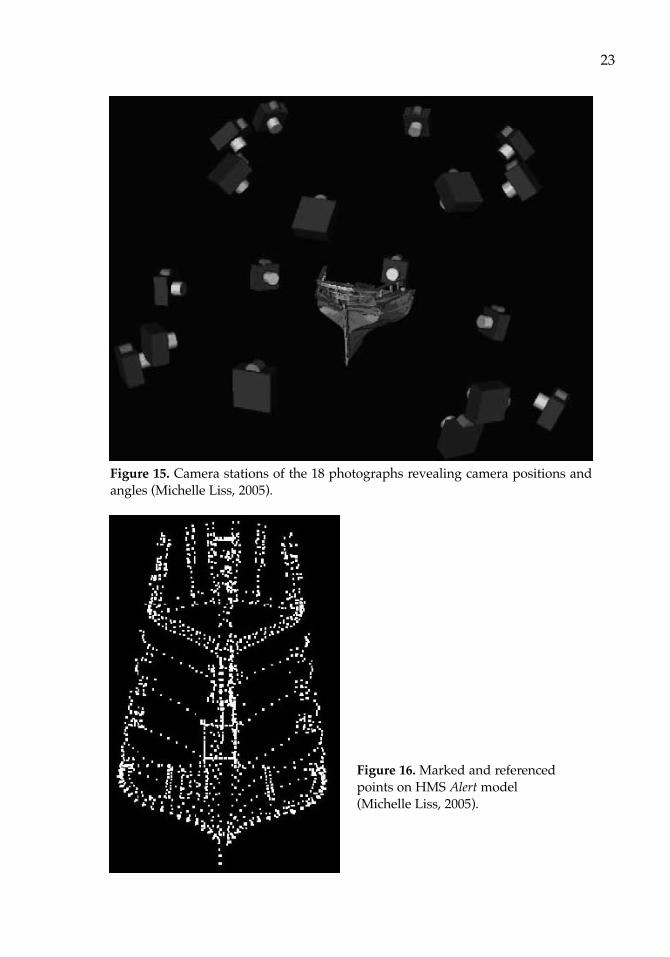
The model had been built on a base for support; therefore, it was impossi-ble to turn over and photograph from the bottom. To solve this problem, eight pho-tographs were taken around the entire model 45° below the deck, looking up.Another eight photographs were taken 45° above the deck, looking down. To pro-vide better references for the plank curvature, two additional photographs wereneeded. For this, the model was laid on its side and photographed along the lengthof each side (Figure 15). The photographs were planned to overlap so that mostpoints were visible in at least three photographs. A photograph was taken at everycorner/joint and every side/face of the model.
Survey Quality
In his experience with the PhotoModeler process, Franke (1999:8) stated“The most important part of creating a 3D model in PhotoModeler is orienting thephotographs by marking and referencing tie points between the photographs.” Twothousand and sixty-four three-dimensional points were used for creating the HMSAlert project by this method (Figure 16).
Franke (1999:8) continued, “The quality of this process determines theaccuracy of dimensions derived from the linework created in the onfollowing step.”While not technically difficult, this is the part of the project that takes the most time.The points need to be marked and checked for accuracy and then referenced acrossseveral photographs. Franke (1999:8) concludes, “As unique and satisfying [as]
22
23
Figure 16. Marked and referencedpoints on HMS Alert model (Michelle Liss, 2005).
Figure 15. Camera stations of the 18 photographs revealing camera positions andangles (Michelle Liss, 2005).
PhotoModeler results can be, the amount of time that needs to be invested to reachthat result can be considerable.” Taking the initial photographs from appropriate an-gles, rendering quality images, can aid in the marking and referencing of points later.
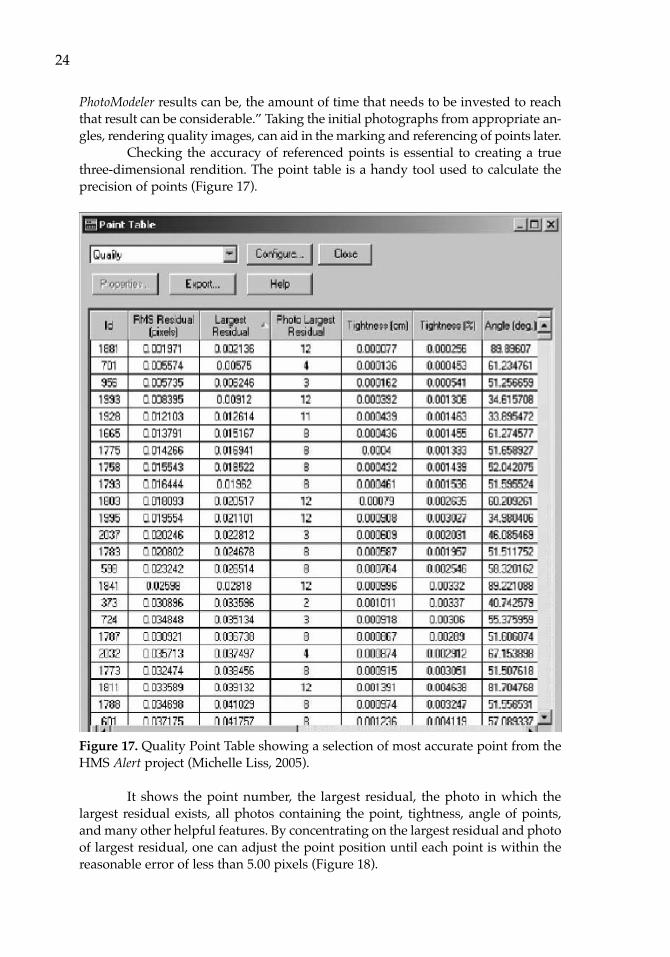
Checking the accuracy of referenced points is essential to creating a truethree-dimensional rendition. The point table is a handy tool used to calculate theprecision of points (Figure 17).
Figure 17. Quality Point Table showing a selection of most accurate point from theHMS Alert project (Michelle Liss, 2005).
It shows the point number, the largest residual, the photo in which thelargest residual exists, all photos containing the point, tightness, angle of points,and many other helpful features. By concentrating on the largest residual and photoof largest residual, one can adjust the point position until each point is within thereasonable error of less than 5.00 pixels (Figure 18).
24
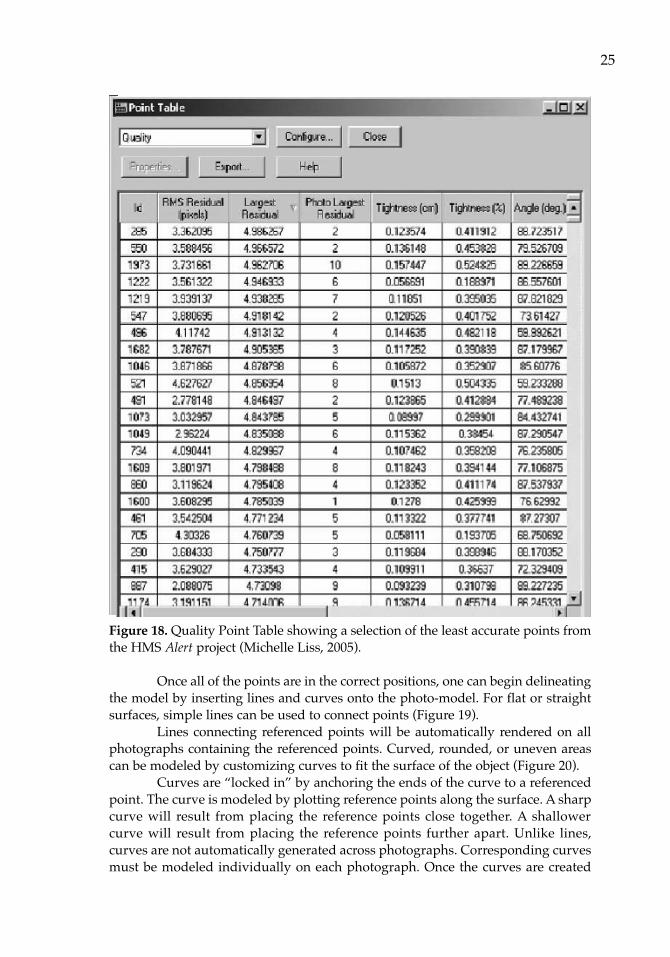
Figure 18. Quality Point Table showing a selection of the least accurate points fromthe HMS Alert project (Michelle Liss, 2005).
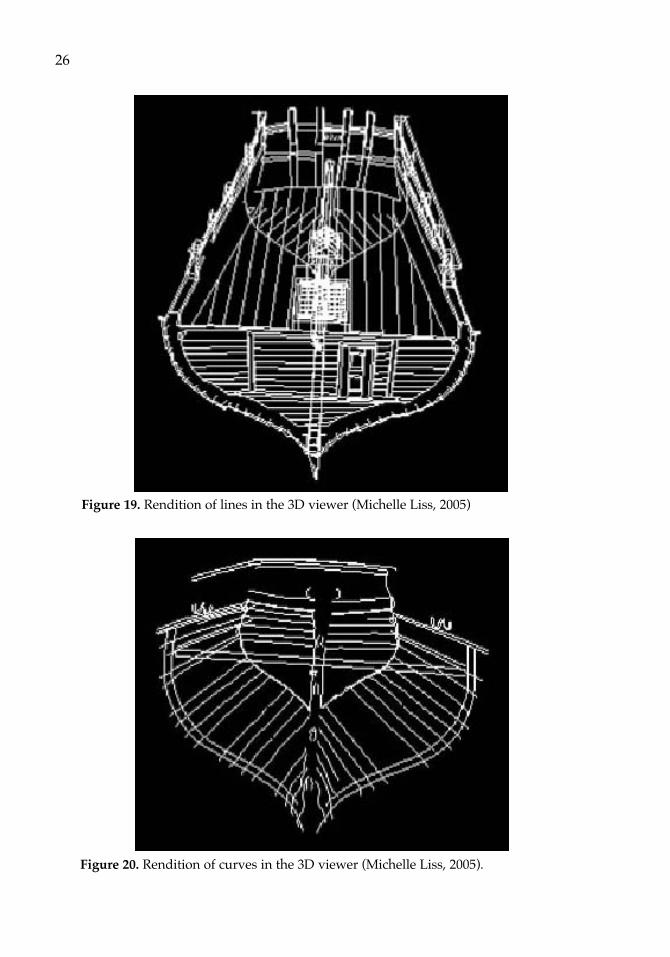
Once all of the points are in the correct positions, one can begin delineatingthe model by inserting lines and curves onto the photo-model. For flat or straightsurfaces, simple lines can be used to connect points (Figure 19).
Lines connecting referenced points will be automatically rendered on allphotographs containing the referenced points. Curved, rounded, or uneven areascan be modeled by customizing curves to fit the surface of the object (Figure 20).
Curves are “locked in” by anchoring the ends of the curve to a referencedpoint. The curve is modeled by plotting reference points along the surface. A sharpcurve will result from placing the reference points close together. A shallowercurve will result from placing the reference points further apart. Unlike lines,curves are not automatically generated across photographs. Corresponding curvesmust be modeled individually on each photograph. Once the curves are created
25
26
Figure 19. Rendition of lines in the 3D viewer (Michelle Liss, 2005)
Figure 20. Rendition of curves in the 3D viewer (Michelle Liss, 2005).
they must be referenced together so the program knows which curves correspondto each other.
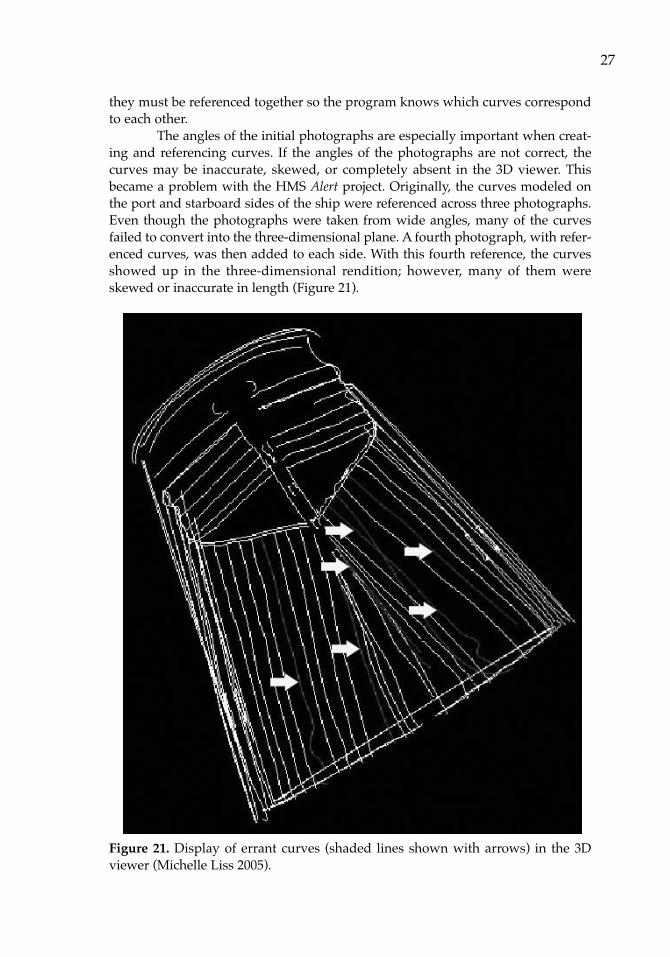
The angles of the initial photographs are especially important when creat-ing and referencing curves. If the angles of the photographs are not correct, thecurves may be inaccurate, skewed, or completely absent in the 3D viewer. Thisbecame a problem with the HMS Alert project. Originally, the curves modeled onthe port and starboard sides of the ship were referenced across three photographs.Even though the photographs were taken from wide angles, many of the curvesfailed to convert into the three-dimensional plane. A fourth photograph, with refer-enced curves, was then added to each side. With this fourth reference, the curvesshowed up in the three-dimensional rendition; however, many of them wereskewed or inaccurate in length (Figure 21).
Figure 21. Display of errant curves (shaded lines shown with arrows) in the 3Dviewer (Michelle Liss 2005).
27
The appearance of some of the curves was improved by making the curvesplanar or increasing the tightness of the curve. Other curves were worsened, or notaffected at all, by this manipulation. All errant curves were rechecked for accuracyacross the original photographs. Many manipulations were attempted to improvethe form of the curves to no avail. With no solution in sight, some of the bad curveshad to be eliminated from the project.
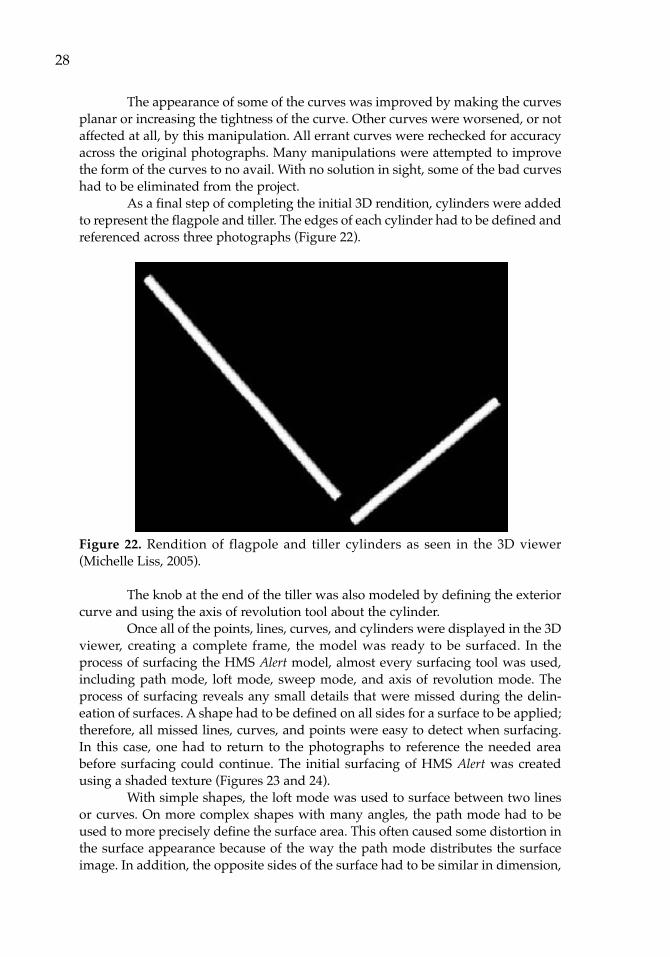
As a final step of completing the initial 3D rendition, cylinders were addedto represent the flagpole and tiller. The edges of each cylinder had to be defined andreferenced across three photographs (Figure 22).
Figure 22. Rendition of flagpole and tiller cylinders as seen in the 3D viewer(Michelle Liss, 2005).
The knob at the end of the tiller was also modeled by defining the exteriorcurve and using the axis of revolution tool about the cylinder.
Once all of the points, lines, curves, and cylinders were displayed in the 3Dviewer, creating a complete frame, the model was ready to be surfaced. In theprocess of surfacing the HMS Alert model, almost every surfacing tool was used,including path mode, loft mode, sweep mode, and axis of revolution mode. Theprocess of surfacing reveals any small details that were missed during the delin-eation of surfaces. A shape had to be defined on all sides for a surface to be applied;therefore, all missed lines, curves, and points were easy to detect when surfacing.In this case, one had to return to the photographs to reference the needed areabefore surfacing could continue. The initial surfacing of HMS Alert was createdusing a shaded texture (Figures 23 and 24).
With simple shapes, the loft mode was used to surface between two linesor curves. On more complex shapes with many angles, the path mode had to beused to more precisely define the surface area. This often caused some distortion inthe surface appearance because of the way the path mode distributes the surfaceimage. In addition, the opposite sides of the surface had to be similar in dimension,
28
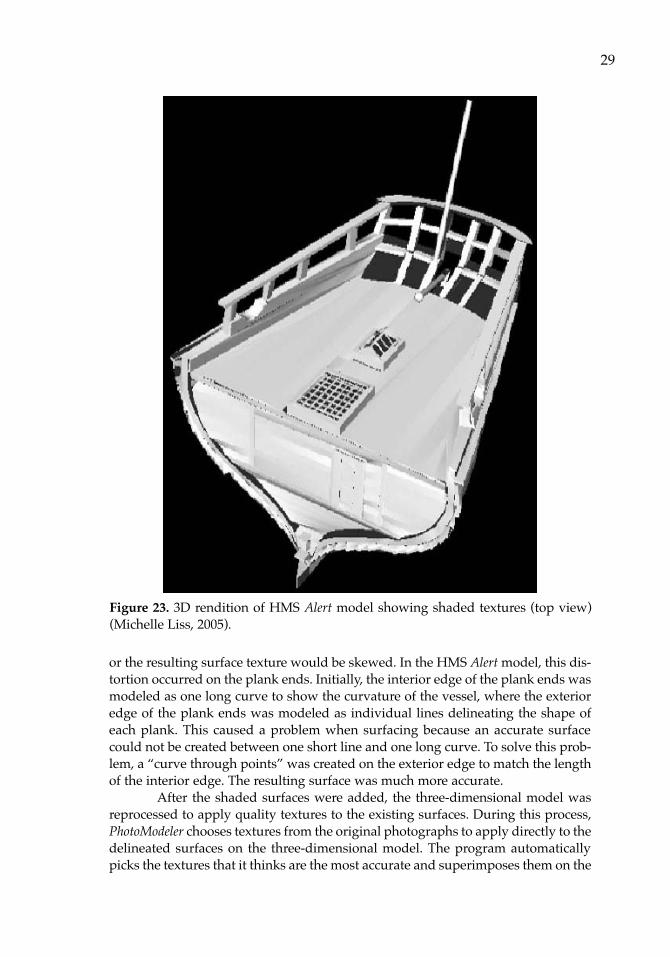
or the resulting surface texture would be skewed. In the HMS Alert model, this dis-tortion occurred on the plank ends. Initially, the interior edge of the plank ends wasmodeled as one long curve to show the curvature of the vessel, where the exterioredge of the plank ends was modeled as individual lines delineating the shape ofeach plank. This caused a problem when surfacing because an accurate surfacecould not be created between one short line and one long curve. To solve this prob-lem, a “curve through points” was created on the exterior edge to match the lengthof the interior edge. The resulting surface was much more accurate.
After the shaded surfaces were added, the three-dimensional model wasreprocessed to apply quality textures to the existing surfaces. During this process,PhotoModeler chooses textures from the original photographs to apply directly to thedelineated surfaces on the three-dimensional model. The program automaticallypicks the textures that it thinks are the most accurate and superimposes them on the
29
Figure 23. 3D rendition of HMS Alert model showing shaded textures (top view)(Michelle Liss, 2005).
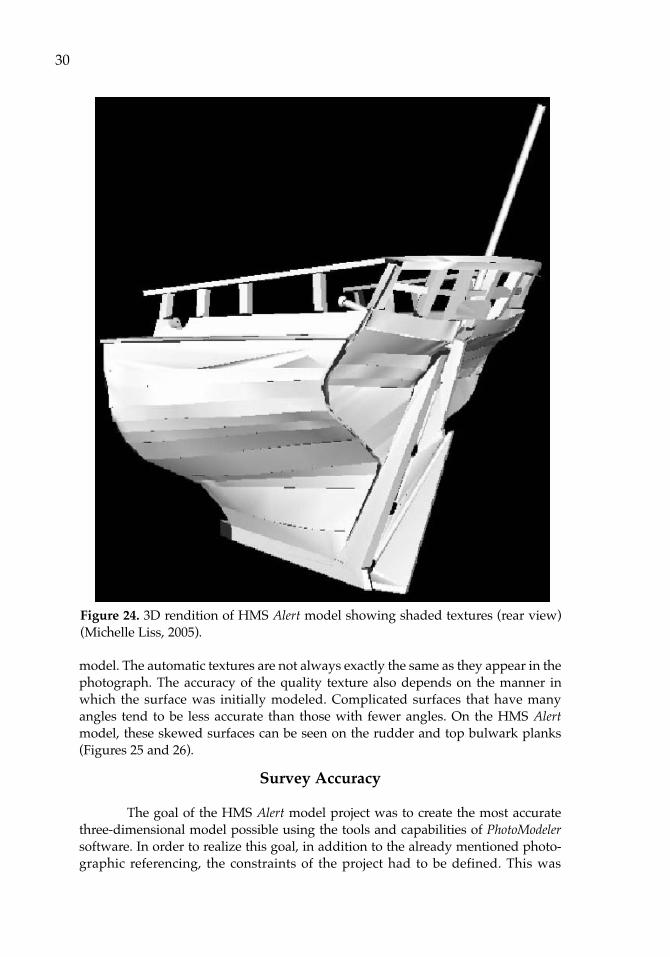
model. The automatic textures are not always exactly the same as they appear in thephotograph. The accuracy of the quality texture also depends on the manner inwhich the surface was initially modeled. Complicated surfaces that have manyangles tend to be less accurate than those with fewer angles. On the HMS Alertmodel, these skewed surfaces can be seen on the rudder and top bulwark planks(Figures 25 and 26).
Survey Accuracy
The goal of the HMS Alert model project was to create the most accuratethree-dimensional model possible using the tools and capabilities of PhotoModelersoftware. In order to realize this goal, in addition to the already mentioned photo-graphic referencing, the constraints of the project had to be defined. This was
30
Figure 24. 3D rendition of HMS Alert model showing shaded textures (rear view)(Michelle Liss, 2005).
achieved through several tools within the PhotoModeler program. The user inputapproximate dimensions of the physical model into the program. The first step inthis process was to take some measurements off the HMS Alert model. The scale ofthe three-dimensional model was defined by accessing the “3D Scale and Rotation”tool (Figure 27).
31
Figure 25. 3D rendition of HMS Alert model showing quality textures (rear view)(Michelle Liss, 2005).
32
Figure 26. 3D rendition of HMS Alert model showing quality textures (starboardview) (Michelle Liss, 2005).
Figure 27. Scale and Rotation box, showing the definition of the model scale (EOSSystems, 2005).
By selecting the “Scale” tab, one is able to define a distance between twopoints for use as the model scale. For this project, the distance used was the beamwidth from the most extreme points on the outer railings (points 1 and 669). On thephysical model, this distance was 48.5 cm. The points were defined in the modeland the distance entered into the box. This defined the overall scale for the model,from which all other measurements could be extrapolated. To test the true accura-cy of this scale, other measurements were compared from the physical model andthe three-dimensional model (Table 3).
Table 3. Comparison of scaled measurements from physical model to 3D model.
Measurements were taken on the three-dimensional rendition using themeasurement tool. The program is able to calculate the distance between any twoselected points once the proper scale is defined. Using the defined scale, the maxi-mum measurement error between models was 2.9%.
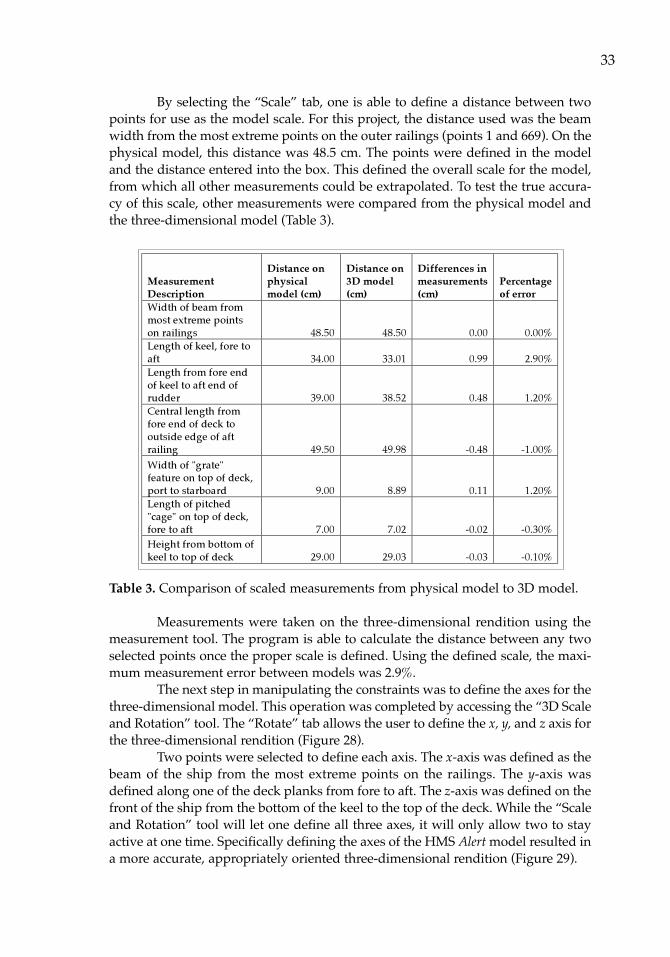
The next step in manipulating the constraints was to define the axes for thethree-dimensional model. This operation was completed by accessing the “3D Scaleand Rotation” tool. The “Rotate” tab allows the user to define the x, y, and z axis forthe three-dimensional rendition (Figure 28).
Two points were selected to define each axis. The x-axis was defined as thebeam of the ship from the most extreme points on the railings. The y-axis wasdefined along one of the deck planks from fore to aft. The z-axis was defined on thefront of the ship from the bottom of the keel to the top of the deck. While the “Scaleand Rotation” tool will let one define all three axes, it will only allow two to stayactive at one time. Specifically defining the axes of the HMS Alert model resulted ina more accurate, appropriately oriented three-dimensional rendition (Figure 29).
33
MeasurementDescription
Distance onphysicalmodel (cm)
Distance on3D model(cm)
Differences inmeasurements(cm)
Percentageof error
Width of beam frommost extreme pointson railings 48.50 48.50 0.00 0.00%Length of keel, fore toaft 34.00 33.01 0.99 2.90%Length from fore endof keel to aft end ofrudder 39.00 38.52 0.48 1.20%Central length fromfore end of deck tooutside edge of aftrailing 49.50 49.98 -0.48 -1.00%
Width of "grate"feature on top of deck,port to starboard 9.00 8.89 0.11 1.20%Length of pitched"cage" on top of deck,fore to aft 7.00 7.02 -0.02 -0.30%
Height from bottom ofkeel to top of deck 29.00 29.03 -0.03 -0.10%
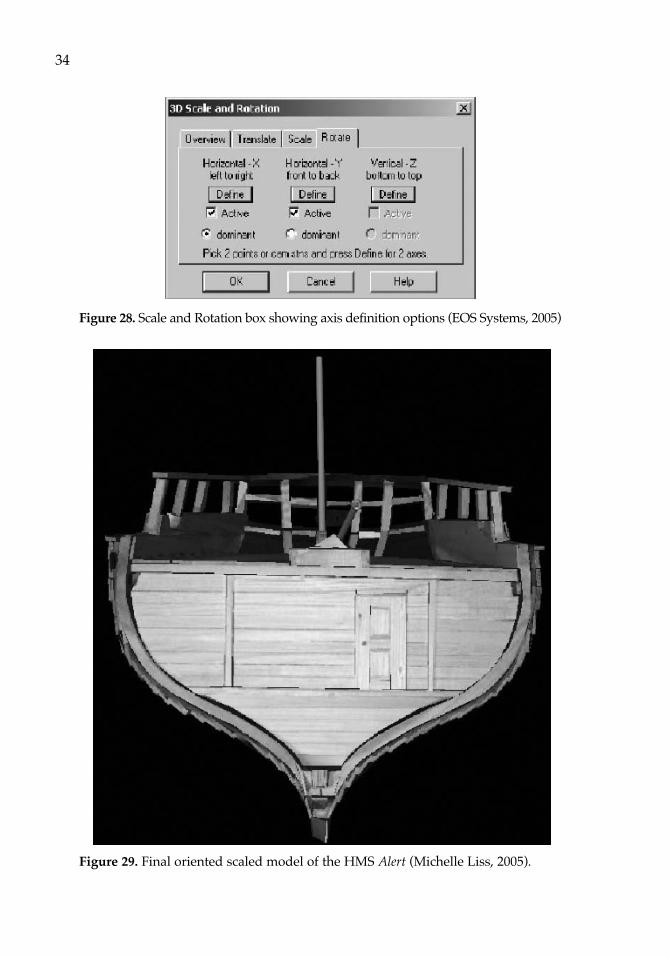
Figure 28. Scale and Rotation box showing axis definition options (EOS Systems, 2005)
Figure 29. Final oriented scaled model of the HMS Alert (Michelle Liss, 2005).
34
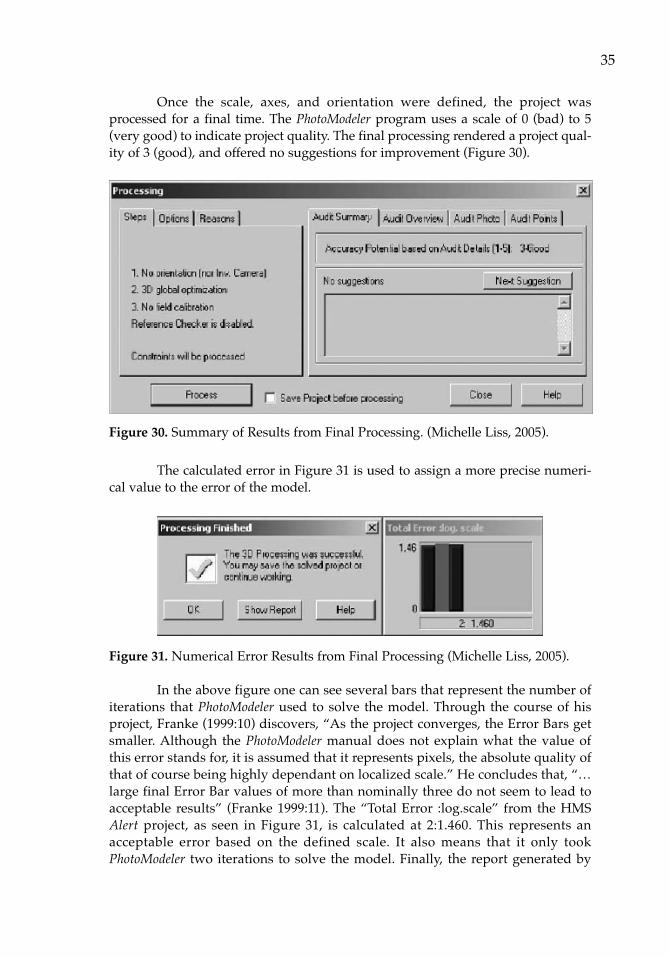
Once the scale, axes, and orientation were defined, the project wasprocessed for a final time. The PhotoModeler program uses a scale of 0 (bad) to 5(very good) to indicate project quality. The final processing rendered a project qual-ity of 3 (good), and offered no suggestions for improvement (Figure 30).
Figure 30. Summary of Results from Final Processing. (Michelle Liss, 2005).
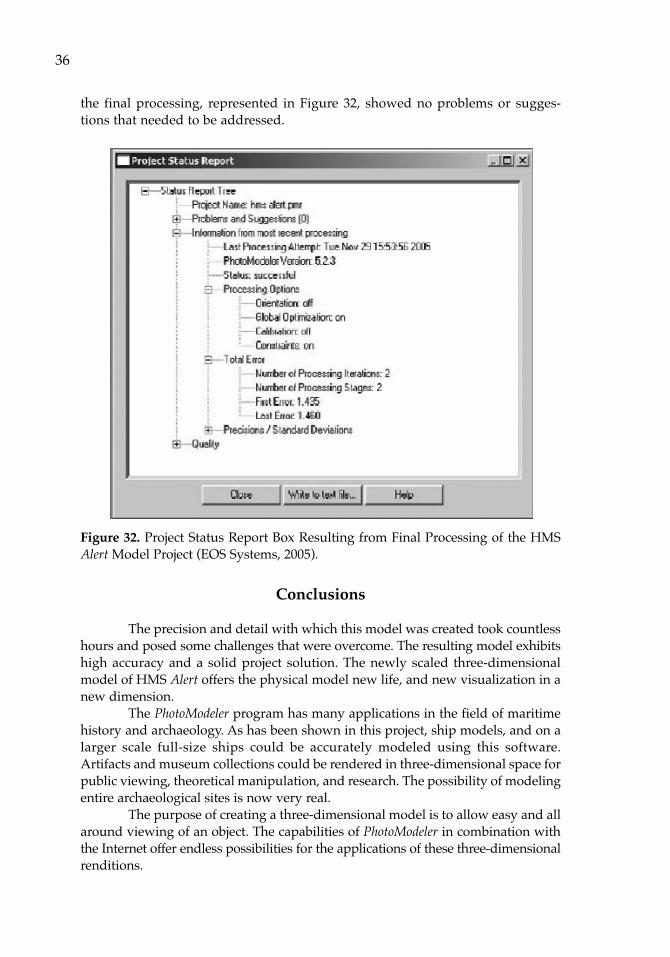
The calculated error in Figure 31 is used to assign a more precise numeri-cal value to the error of the model.
Figure 31. Numerical Error Results from Final Processing (Michelle Liss, 2005).
In the above figure one can see several bars that represent the number ofiterations that PhotoModeler used to solve the model. Through the course of hisproject, Franke (1999:10) discovers, “As the project converges, the Error Bars getsmaller. Although the PhotoModeler manual does not explain what the value ofthis error stands for, it is assumed that it represents pixels, the absolute quality ofthat of course being highly dependant on localized scale.” He concludes that, “…large final Error Bar values of more than nominally three do not seem to lead toacceptable results” (Franke 1999:11). The “Total Error :log.scale” from the HMSAlert project, as seen in Figure 31, is calculated at 2:1.460. This represents anacceptable error based on the defined scale. It also means that it only tookPhotoModeler two iterations to solve the model. Finally, the report generated by
35
the final processing, represented in Figure 32, showed no problems or sugges-tions that needed to be addressed.
Figure 32. Project Status Report Box Resulting from Final Processing of the HMSAlert Model Project (EOS Systems, 2005).
Conclusions
The precision and detail with which this model was created took countlesshours and posed some challenges that were overcome. The resulting model exhibitshigh accuracy and a solid project solution. The newly scaled three-dimensionalmodel of HMS Alert offers the physical model new life, and new visualization in anew dimension.
The PhotoModeler program has many applications in the field of maritimehistory and archaeology. As has been shown in this project, ship models, and on alarger scale full-size ships could be accurately modeled using this software.Artifacts and museum collections could be rendered in three-dimensional space forpublic viewing, theoretical manipulation, and research. The possibility of modelingentire archaeological sites is now very real.
The purpose of creating a three-dimensional model is to allow easy and allaround viewing of an object. The capabilities of PhotoModeler in combination withthe Internet offer endless possibilities for the applications of these three-dimensionalrenditions.
36
5
Modeling Montana
Introduction
The objective of this project was to learn the PhotoModeler Pro software andgauge the feasibility of modeling archaeological work conducted at East CarolinaUniversity in the Program of Maritime Studies (PMS). The software could prove to beuseful in a number of arenas, and an extension of the objective of this project was todetermine the areas in which the software is applicable and its use warranted throughactually performing the solving of a model. Specifically, this report describes the cre-ation of a three-dimensional model of a wooden boat model of the vessel, Montana,using digital images imported into PhotoModeler Pro, version 5.0 software.
Project History
Montana was a luxury steamer built near Pittsburgh, Pennsylvania over thewinter of 1878-1879. The vessel measured 252 feet long by 48 feet and 8 inches inbeam and carried 959 tons (Way 1983: 118, 330). Sanford B. Coulson built the luxu-rious vessel to operate on the Missouri River at a time when the mountain steamer,the smaller, lighter, more utilitarian vessels were typical of the Missouri River vessels.The elaborately decorated Montana mimicked the typical passenger vessels of theMississippi River, averaging nearly double the cost and carrying about twice the loadof the typical mountain steamers of the Missouri River (Corbin et al. 2004: 18-20).
In June 1884, carrying 500 tons of freight along with passengers and crew,Montana's Captain Massie attempted to maneuver the hulking vessel between thepiers of the St. Charles Bridge in Missouri. As the vessel went under the bridge, itswung around, struck the third pier of the bridge, and limped to a spot near shorejust below the bridge where it sank in twelve feet of water. One passenger reportedthat, as it passed under the bridge, the paddlewheel became caught in an eddy, ren-dering the vessel powerless in a strong current which forced the boat against thepier, breaking the hold of the vessel (Corbin et al. 2004: 23-25).
In February 2002, archaeologists from East Carolina University led a fieldschool on behalf of the Missouri Department of Natural Resources State HistoricPreservation office to document the site. The archaeology team conducted a PhaseII pre-disturbance survey to document the site in situ. Additionally, field techniciansconducted test excavations to reveal more detailed information for creating the sitemap (Corbin et al. 2004: 48, 50, 56). In the spring of 2005, students studying shipconstruction at East Carolina University built a model of Montana. The students haddifficulty building the model because of limited knowledge on the constructionspecifics of the vessel. None of the students who built the model had seen the
37
archaeological remains and had little more than the site map and drawings fromwhich to gain dimensional and structural information about the vessel. The modelbuilder conjectured many of the details resulting in a model of limited accuracy(McFadden et al. 2005).
Later that year, in the summer of 2005, one of the primary investigators ofthe archaeological project, Dr. Bradley Rodgers, attempted a second model, thistime of the stern section, of Montana to fix distinct errors on the first model. The sec-ond Montana model, used in this PhotoModeler project, is a detailed and precise rep-resentation of the actual vessel. It clearly demonstrates key structural features suchas the staggered half floor construction which allowed Montana the flexibility nec-essary given the dimensions of the vessel. The model also accurately depicts theengine trough and the cylinder timbers on which the engine operated. Under thecylinder timbers sit the pylons and tie rods which added support to the enginetrough. In addition, it accurately displays the cocked hats that stiffened the sharpturn of the bilge. The model also demonstrates the bustle in the stern and the apron,a distinct design feature on Montana used to push water into the paddle wheel andrudders (Bradley A. Rodgers 2005, pers. comm.).
PhotoModeler has a distinct application within the Montana project.PhotoModeler could have been used on photographs from the archaeological site tocreate the site map, or could still be used on the photographs to verify the existingsite map. Logistically, conditions at the Montana site create a difficult working envi-ronment and use of PhotoModeler might have alleviated some of the difficulties.Using the software might have simplified construction of wooden models. Studentsin the ship construction class mention the difficulties they had in determining spe-cific details associated with constructing the model (McFadden et al. 2005) andusing PhotoModeler on site plans, digitized drawings, digital photographs, and his-toric photographs might have aided in determining such construction information.
Regardless, using PhotoModeler will still aid in future analysis of Montana.The three-dimensional image allows for analysis of ship construction using a differ-ent tool than a wooden model or two-dimensional drawing. Additionally, usingPhotoModeler to create a three-dimensional image highlighted some avoidable andunavoidable errors in the wooden model itself, such as the misalignment of outerhull planking and inconsistencies in timber measurements. Overlaying photo-graphs and drawings onto the three-dimensional model can provide a further toolfor analysis. Another use for PhotoModeler is to check archaeological work done inthe field. The three-dimensional image can be more accurate than measurementscoming from the field, depending upon circumstances in the field, and the modelmight be able to eradicate or minimize error from the field. Also, PhotoModeler couldbe used as a site management tool. Modeling over time could allow for analysis ofsite formation processes and could enable a manager to monitor major changes ona site, simply from photographs. PhotoModeler can serve many purposes for theMontana project and beyond.
The primary step in the modeling process was camera calibration. This isnecessary for PhotoModeler to build a proper geometric relationship between pointson photographs and points in three-dimensional space (EOS Systems Inc. 2004:50).To calibrate the camera, sixteen images were taken of a calibration sheet included
38
in the software (Figure 33). These images were put through the calibrator programwithin the software to ensure the program would produce accurate camera param-eters. Initially, the calibration did not work. This was apparent because the calibra-tion sheets have 100 possible points to reference, and nearly 120 points werereferenced during the calibration process. When viewing the calibration photo-graphs, it became apparent that because the sheet was on a spotted carpet when thephotos were taken, the carpet interfered with the calibration. After removal of theerror, new photos were taken and the camera re-calibrated.
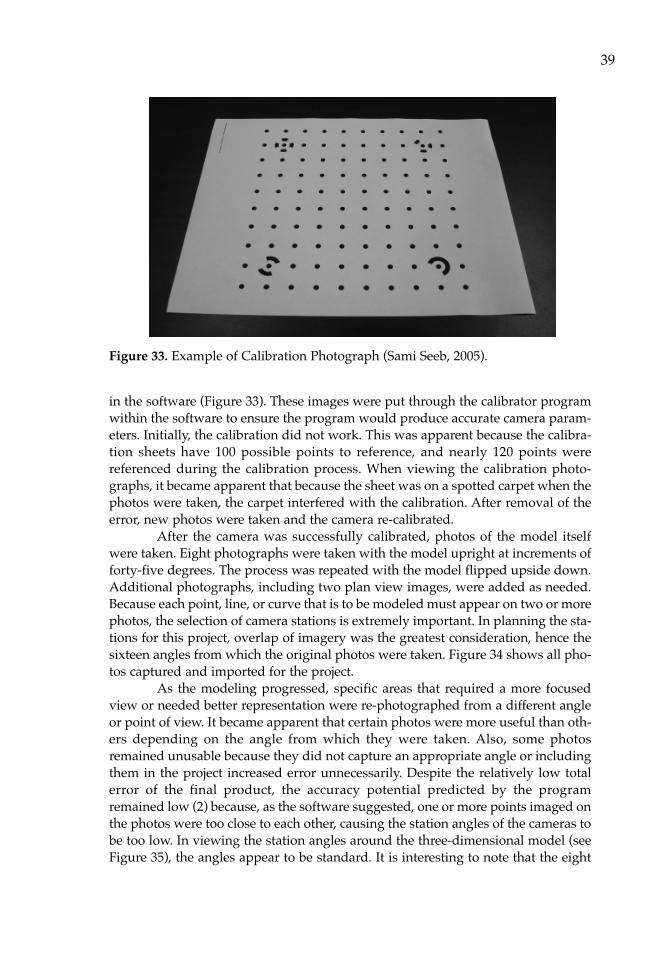
After the camera was successfully calibrated, photos of the model itselfwere taken. Eight photographs were taken with the model upright at increments offorty-five degrees. The process was repeated with the model flipped upside down.Additional photographs, including two plan view images, were added as needed.Because each point, line, or curve that is to be modeled must appear on two or morephotos, the selection of camera stations is extremely important. In planning the sta-tions for this project, overlap of imagery was the greatest consideration, hence thesixteen angles from which the original photos were taken. Figure 34 shows all pho-tos captured and imported for the project.
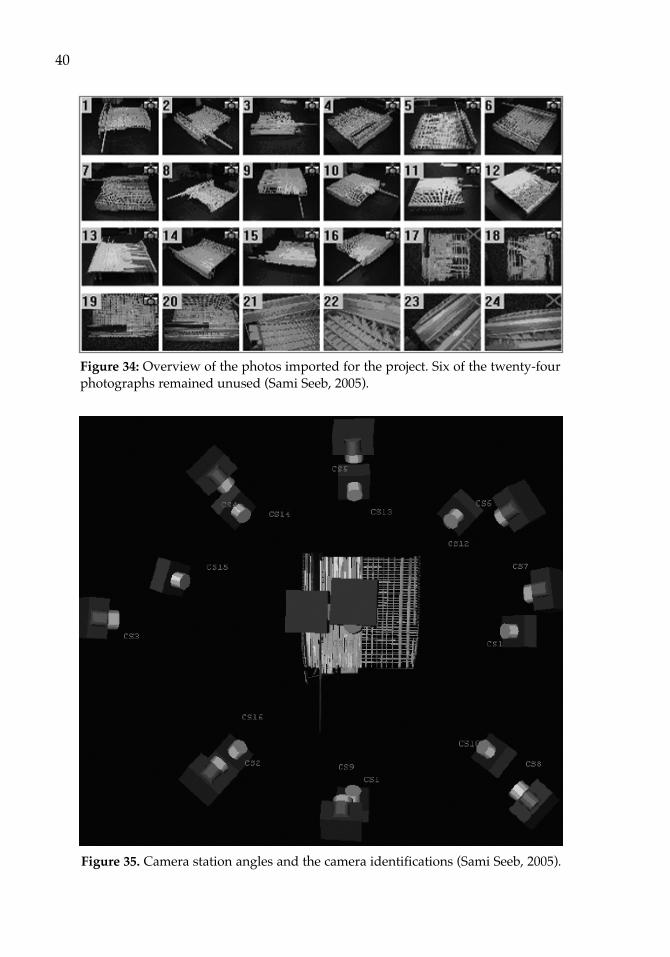
As the modeling progressed, specific areas that required a more focusedview or needed better representation were re-photographed from a different angleor point of view. It became apparent that certain photos were more useful than oth-ers depending on the angle from which they were taken. Also, some photosremained unusable because they did not capture an appropriate angle or includingthem in the project increased error unnecessarily. Despite the relatively low totalerror of the final product, the accuracy potential predicted by the programremained low (2) because, as the software suggested, one or more points imaged onthe photos were too close to each other, causing the station angles of the cameras tobe too low. In viewing the station angles around the three-dimensional model (seeFigure 35), the angles appear to be standard. It is interesting to note that the eight
39
Figure 33. Example of Calibration Photograph (Sami Seeb, 2005).
40
Figure 34: Overview of the photos imported for the project. Six of the twenty-fourphotographs remained unused (Sami Seeb, 2005).
Figure 35. Camera station angles and the camera identifications (Sami Seeb, 2005).
stations used to capture the bottom of the model appear upside down, reflecting thefact that the model was flipped at the time those images were captured.
The most commonly occurring problem with photographs was pixelation.When trying to locate a very specific point, zooming in close on the photographproved to be problematic because of resolution.
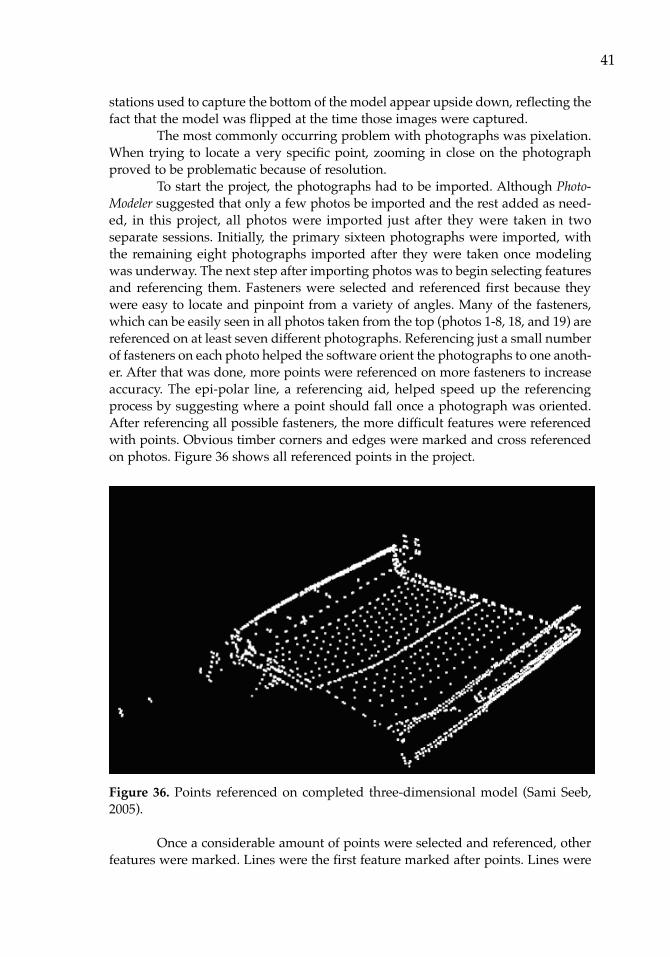
To start the project, the photographs had to be imported. Although Photo-Modeler suggested that only a few photos be imported and the rest added as need-ed, in this project, all photos were imported just after they were taken in twoseparate sessions. Initially, the primary sixteen photographs were imported, withthe remaining eight photographs imported after they were taken once modelingwas underway. The next step after importing photos was to begin selecting featuresand referencing them. Fasteners were selected and referenced first because theywere easy to locate and pinpoint from a variety of angles. Many of the fasteners,which can be easily seen in all photos taken from the top (photos 1-8, 18, and 19) arereferenced on at least seven different photographs. Referencing just a small numberof fasteners on each photo helped the software orient the photographs to one anoth-er. After that was done, more points were referenced on more fasteners to increaseaccuracy. The epi-polar line, a referencing aid, helped speed up the referencingprocess by suggesting where a point should fall once a photograph was oriented.After referencing all possible fasteners, the more difficult features were referencedwith points. Obvious timber corners and edges were marked and cross referencedon photos. Figure 36 shows all referenced points in the project.
Figure 36. Points referenced on completed three-dimensional model (Sami Seeb,2005).
Once a considerable amount of points were selected and referenced, otherfeatures were marked. Lines were the first feature marked after points. Lines were
41
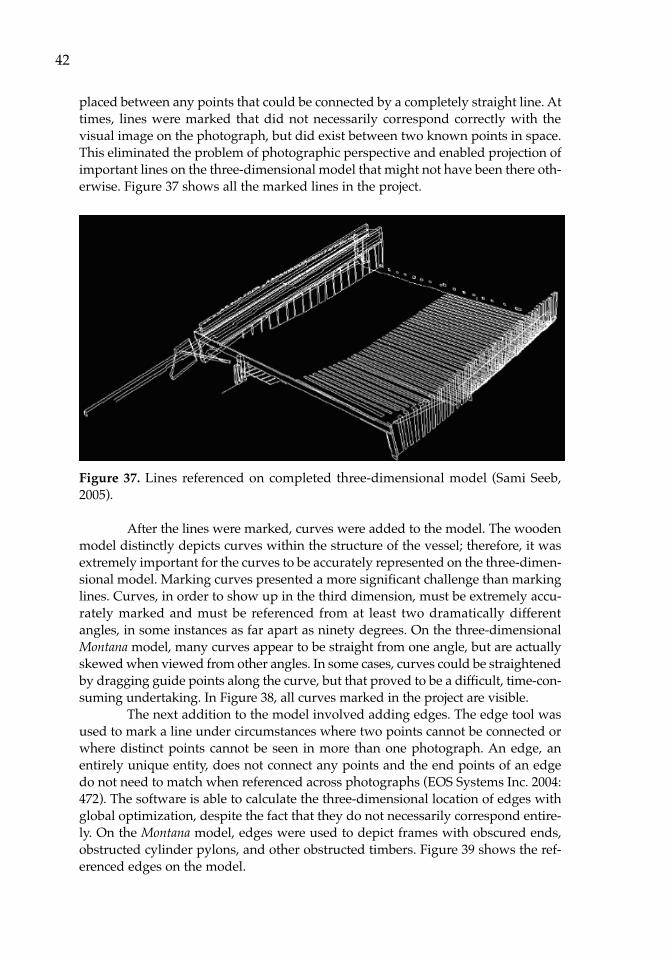
placed between any points that could be connected by a completely straight line. Attimes, lines were marked that did not necessarily correspond correctly with thevisual image on the photograph, but did exist between two known points in space.This eliminated the problem of photographic perspective and enabled projection ofimportant lines on the three-dimensional model that might not have been there oth-erwise. Figure 37 shows all the marked lines in the project.
Figure 37. Lines referenced on completed three-dimensional model (Sami Seeb,2005).
After the lines were marked, curves were added to the model. The woodenmodel distinctly depicts curves within the structure of the vessel; therefore, it wasextremely important for the curves to be accurately represented on the three-dimen-sional model. Marking curves presented a more significant challenge than markinglines. Curves, in order to show up in the third dimension, must be extremely accu-rately marked and must be referenced from at least two dramatically differentangles, in some instances as far apart as ninety degrees. On the three-dimensionalMontana model, many curves appear to be straight from one angle, but are actuallyskewed when viewed from other angles. In some cases, curves could be straightenedby dragging guide points along the curve, but that proved to be a difficult, time-con-suming undertaking. In Figure 38, all curves marked in the project are visible.
The next addition to the model involved adding edges. The edge tool wasused to mark a line under circumstances where two points cannot be connected orwhere distinct points cannot be seen in more than one photograph. An edge, anentirely unique entity, does not connect any points and the end points of an edgedo not need to match when referenced across photographs (EOS Systems Inc. 2004:472). The software is able to calculate the three-dimensional location of edges withglobal optimization, despite the fact that they do not necessarily correspond entire-ly. On the Montana model, edges were used to depict frames with obscured ends,obstructed cylinder pylons, and other obstructed timbers. Figure 39 shows the ref-erenced edges on the model.
42
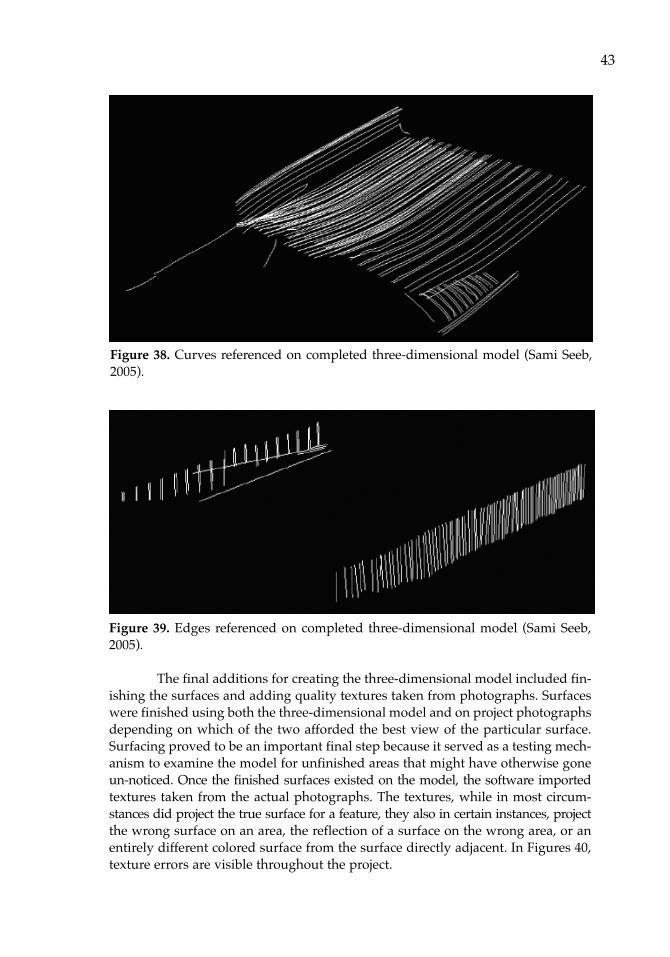
Figure 39. Edges referenced on completed three-dimensional model (Sami Seeb,2005).
The final additions for creating the three-dimensional model included fin-ishing the surfaces and adding quality textures taken from photographs. Surfaceswere finished using both the three-dimensional model and on project photographsdepending on which of the two afforded the best view of the particular surface.Surfacing proved to be an important final step because it served as a testing mech-anism to examine the model for unfinished areas that might have otherwise goneun-noticed. Once the finished surfaces existed on the model, the software importedtextures taken from the actual photographs. The textures, while in most circum-stances did project the true surface for a feature, they also in certain instances, projectthe wrong surface on an area, the reflection of a surface on the wrong area, or anentirely different colored surface from the surface directly adjacent. In Figures 40,texture errors are visible throughout the project.
43
Figure 38. Curves referenced on completed three-dimensional model (Sami Seeb,2005).
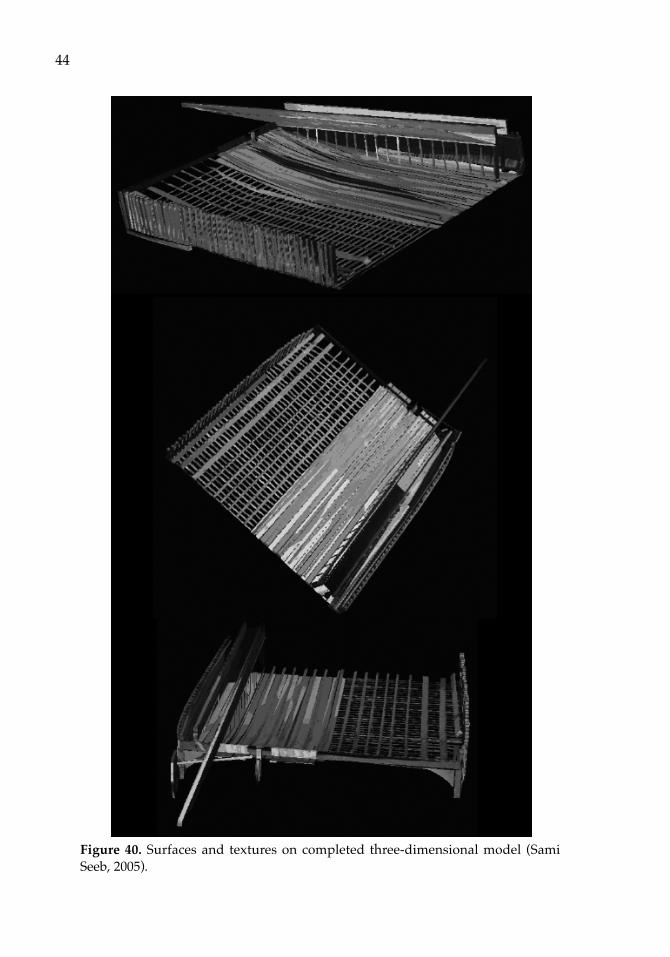
44
Figure 40. Surfaces and textures on completed three-dimensional model (SamiSeeb, 2005).
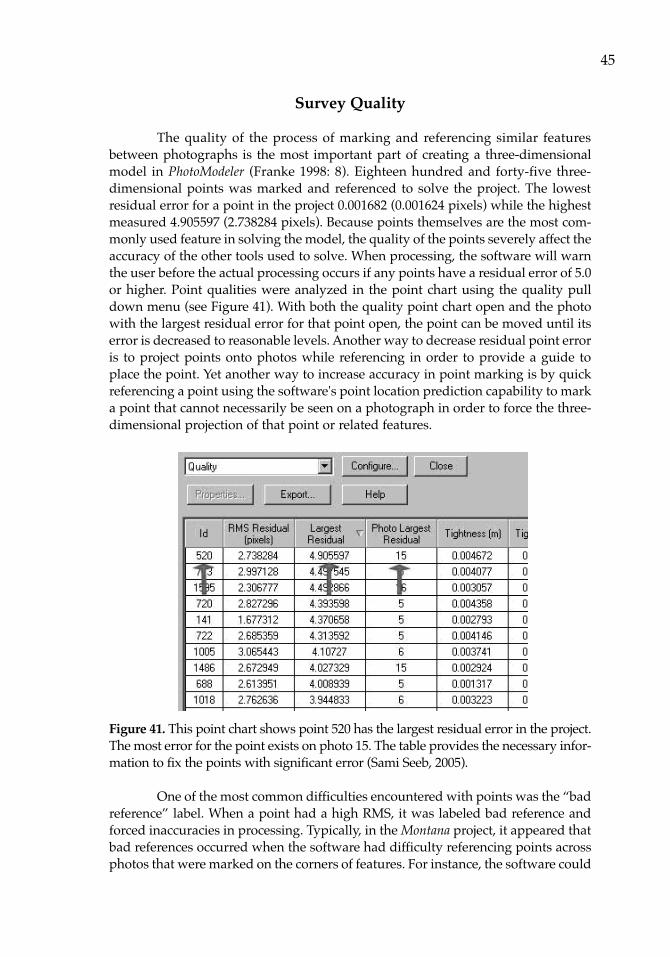
Survey Quality
The quality of the process of marking and referencing similar featuresbetween photographs is the most important part of creating a three-dimensionalmodel in PhotoModeler (Franke 1998: 8). Eighteen hundred and forty-five three-dimensional points was marked and referenced to solve the project. The lowestresidual error for a point in the project 0.001682 (0.001624 pixels) while the highestmeasured 4.905597 (2.738284 pixels). Because points themselves are the most com-monly used feature in solving the model, the quality of the points severely affect theaccuracy of the other tools used to solve. When processing, the software will warnthe user before the actual processing occurs if any points have a residual error of 5.0or higher. Point qualities were analyzed in the point chart using the quality pulldown menu (see Figure 41). With both the quality point chart open and the photowith the largest residual error for that point open, the point can be moved until itserror is decreased to reasonable levels. Another way to decrease residual point erroris to project points onto photos while referencing in order to provide a guide toplace the point. Yet another way to increase accuracy in point marking is by quickreferencing a point using the software's point location prediction capability to marka point that cannot necessarily be seen on a photograph in order to force the three-dimensional projection of that point or related features.
Figure 41. This point chart shows point 520 has the largest residual error in the project.The most error for the point exists on photo 15. The table provides the necessary infor-mation to fix the points with significant error (Sami Seeb, 2005).
One of the most common difficulties encountered with points was the “badreference” label. When a point had a high RMS, it was labeled bad reference andforced inaccuracies in processing. Typically, in the Montana project, it appeared thatbad references occurred when the software had difficulty referencing points acrossphotos that were marked on the corners of features. For instance, the software could
45
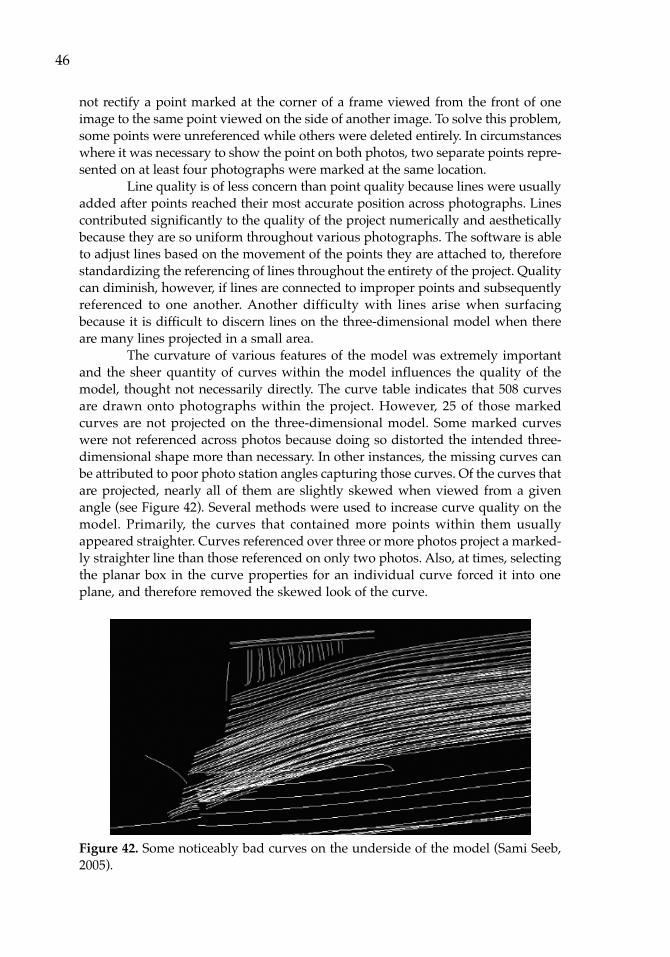
not rectify a point marked at the corner of a frame viewed from the front of oneimage to the same point viewed on the side of another image. To solve this problem,some points were unreferenced while others were deleted entirely. In circumstanceswhere it was necessary to show the point on both photos, two separate points repre-sented on at least four photographs were marked at the same location.
Line quality is of less concern than point quality because lines were usuallyadded after points reached their most accurate position across photographs. Linescontributed significantly to the quality of the project numerically and aestheticallybecause they are so uniform throughout various photographs. The software is ableto adjust lines based on the movement of the points they are attached to, thereforestandardizing the referencing of lines throughout the entirety of the project. Qualitycan diminish, however, if lines are connected to improper points and subsequentlyreferenced to one another. Another difficulty with lines arise when surfacingbecause it is difficult to discern lines on the three-dimensional model when thereare many lines projected in a small area.
The curvature of various features of the model was extremely importantand the sheer quantity of curves within the model influences the quality of themodel, thought not necessarily directly. The curve table indicates that 508 curvesare drawn onto photographs within the project. However, 25 of those markedcurves are not projected on the three-dimensional model. Some marked curveswere not referenced across photos because doing so distorted the intended three-dimensional shape more than necessary. In other instances, the missing curves canbe attributed to poor photo station angles capturing those curves. Of the curves thatare projected, nearly all of them are slightly skewed when viewed from a givenangle (see Figure 42). Several methods were used to increase curve quality on themodel. Primarily, the curves that contained more points within them usuallyappeared straighter. Curves referenced over three or more photos project a marked-ly straighter line than those referenced on only two photos. Also, at times, selectingthe planar box in the curve properties for an individual curve forced it into oneplane, and therefore removed the skewed look of the curve.
Figure 42. Some noticeably bad curves on the underside of the model (Sami Seeb,2005).
46
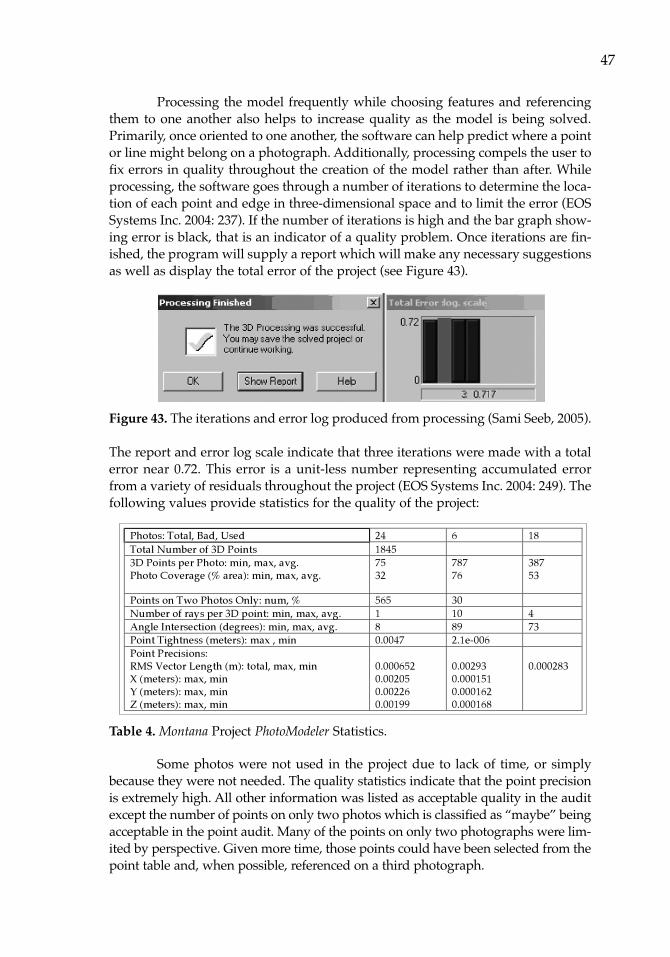
Processing the model frequently while choosing features and referencingthem to one another also helps to increase quality as the model is being solved.Primarily, once oriented to one another, the software can help predict where a pointor line might belong on a photograph. Additionally, processing compels the user tofix errors in quality throughout the creation of the model rather than after. Whileprocessing, the software goes through a number of iterations to determine the loca-tion of each point and edge in three-dimensional space and to limit the error (EOSSystems Inc. 2004: 237). If the number of iterations is high and the bar graph show-ing error is black, that is an indicator of a quality problem. Once iterations are fin-ished, the program will supply a report which will make any necessary suggestionsas well as display the total error of the project (see Figure 43).
Figure 43. The iterations and error log produced from processing (Sami Seeb, 2005).
The report and error log scale indicate that three iterations were made with a totalerror near 0.72. This error is a unit-less number representing accumulated errorfrom a variety of residuals throughout the project (EOS Systems Inc. 2004: 249). Thefollowing values provide statistics for the quality of the project:
Table 4. Montana Project PhotoModeler Statistics.
Some photos were not used in the project due to lack of time, or simplybecause they were not needed. The quality statistics indicate that the point precisionis extremely high. All other information was listed as acceptable quality in the auditexcept the number of points on only two photos which is classified as “maybe” beingacceptable in the point audit. Many of the points on only two photographs were lim-ited by perspective. Given more time, those points could have been selected from thepoint table and, when possible, referenced on a third photograph.
47
Photos: Total, Bad, Used 24 6 18Total Number of 3D Points 18453D Points per Photo: min, max, avg.Photo Coverage (% area): min, max, avg.
7532
78776
38753
Points on Two Photos Only: num, % 565 30Number of rays per 3D point: min, max, avg. 1 10 4Angle Intersection (degrees): min, max, avg. 8 89 73Point Tightness (meters): max , min 0.0047 2.1e-006Point Precisions:RMS Vector Length (m): total, max, minX (meters): max, minY (meters): max, minZ (meters): max, min
0.0006520.002050.002260.00199
0.002930.0001510.0001620.000168
0.000283
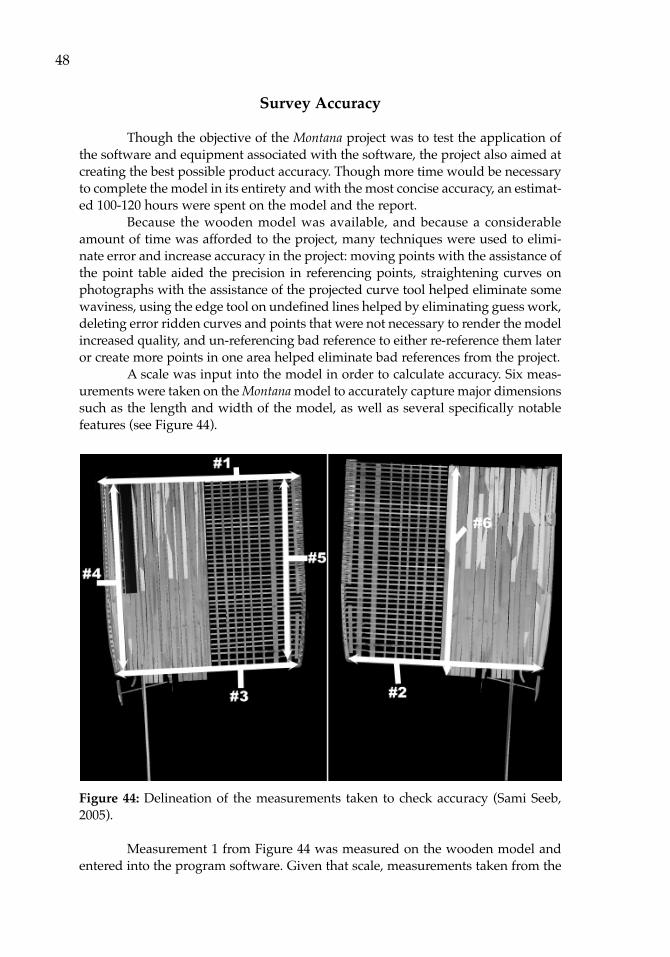
Survey Accuracy
Though the objective of the Montana project was to test the application ofthe software and equipment associated with the software, the project also aimed atcreating the best possible product accuracy. Though more time would be necessaryto complete the model in its entirety and with the most concise accuracy, an estimat-ed 100-120 hours were spent on the model and the report.
Because the wooden model was available, and because a considerableamount of time was afforded to the project, many techniques were used to elimi-nate error and increase accuracy in the project: moving points with the assistance ofthe point table aided the precision in referencing points, straightening curves onphotographs with the assistance of the projected curve tool helped eliminate somewaviness, using the edge tool on undefined lines helped by eliminating guess work,deleting error ridden curves and points that were not necessary to render the modelincreased quality, and un-referencing bad reference to either re-reference them lateror create more points in one area helped eliminate bad references from the project.
A scale was input into the model in order to calculate accuracy. Six meas-urements were taken on the Montana model to accurately capture major dimensionssuch as the length and width of the model, as well as several specifically notablefeatures (see Figure 44).
Figure 44: Delineation of the measurements taken to check accuracy (Sami Seeb,2005).
Measurement 1 from Figure 44 was measured on the wooden model andentered into the program software. Given that scale, measurements taken from the
48
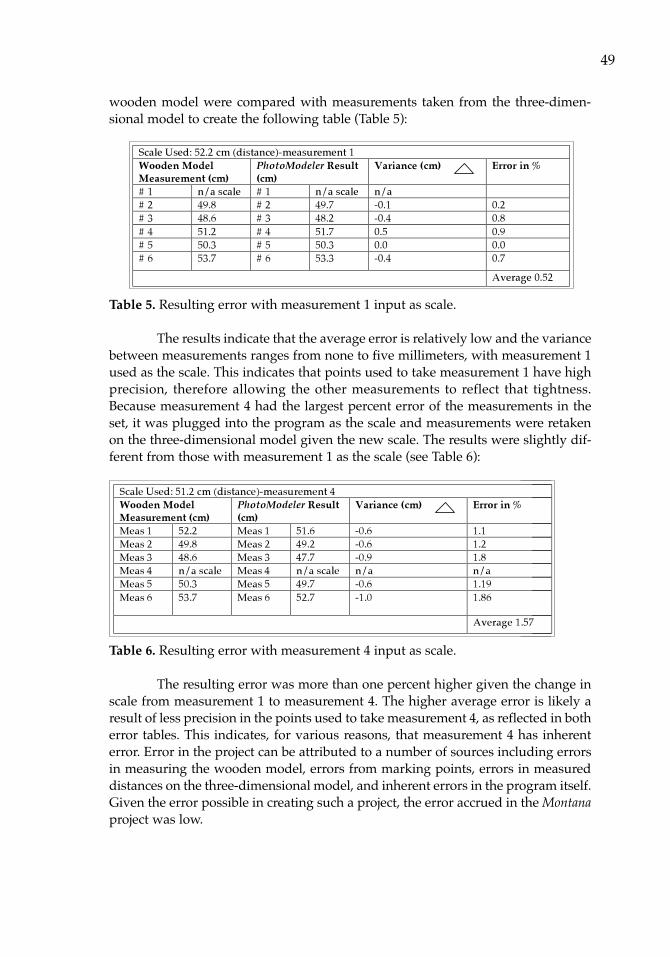
wooden model were compared with measurements taken from the three-dimen-sional model to create the following table (Table 5):
Table 5. Resulting error with measurement 1 input as scale.
The results indicate that the average error is relatively low and the variancebetween measurements ranges from none to five millimeters, with measurement 1used as the scale. This indicates that points used to take measurement 1 have highprecision, therefore allowing the other measurements to reflect that tightness.Because measurement 4 had the largest percent error of the measurements in theset, it was plugged into the program as the scale and measurements were retakenon the three-dimensional model given the new scale. The results were slightly dif-ferent from those with measurement 1 as the scale (see Table 6):
Table 6. Resulting error with measurement 4 input as scale.
The resulting error was more than one percent higher given the change inscale from measurement 1 to measurement 4. The higher average error is likely aresult of less precision in the points used to take measurement 4, as reflected in botherror tables. This indicates, for various reasons, that measurement 4 has inherenterror. Error in the project can be attributed to a number of sources including errorsin measuring the wooden model, errors from marking points, errors in measureddistances on the three-dimensional model, and inherent errors in the program itself.Given the error possible in creating such a project, the error accrued in the Montanaproject was low.
49
Scale Used: 51.2 cm (distance)-measurement 4Wooden ModelMeasurement (cm)
PhotoModeler Result(cm)
Variance (cm) Error in %
Meas 1 52.2 Meas 1 51.6 -0.6 1.1Meas 2 49.8 Meas 2 49.2 -0.6 1.2Meas 3 48.6 Meas 3 47.7 -0.9 1.8Meas 4 n/a scale Meas 4 n/a scale n/a n/aMeas 5 50.3 Meas 5 49.7 -0.6 1.19Meas 6 53.7 Meas 6 52.7 -1.0 1.86
Average 1.57
Scale Used: 52.2 cm (distance)-measurement 1Wooden ModelMeasurement (cm)
PhotoModeler Result(cm)
Variance (cm) Error in %
# 1 n/a scale # 1 n/a scale n/a# 2 49.8 # 2 49.7 -0.1 0.2# 3 48.6 # 3 48.2 -0.4 0.8# 4 51.2 # 4 51.7 0.5 0.9# 5 50.3 # 5 50.3 0.0 0.0# 6 53.7 # 6 53.3 -0.4 0.7
Average 0.52
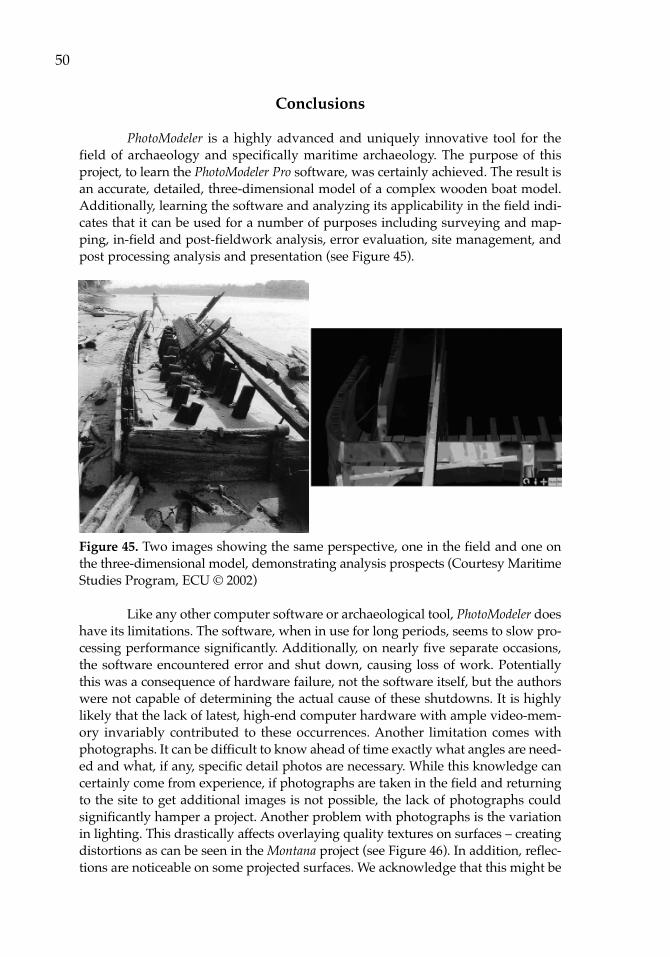
Conclusions
PhotoModeler is a highly advanced and uniquely innovative tool for thefield of archaeology and specifically maritime archaeology. The purpose of thisproject, to learn the PhotoModeler Pro software, was certainly achieved. The result isan accurate, detailed, three-dimensional model of a complex wooden boat model.Additionally, learning the software and analyzing its applicability in the field indi-cates that it can be used for a number of purposes including surveying and map-ping, in-field and post-fieldwork analysis, error evaluation, site management, andpost processing analysis and presentation (see Figure 45).
Figure 45. Two images showing the same perspective, one in the field and one onthe three-dimensional model, demonstrating analysis prospects (Courtesy MaritimeStudies Program, ECU © 2002)
Like any other computer software or archaeological tool, PhotoModeler doeshave its limitations. The software, when in use for long periods, seems to slow pro-cessing performance significantly. Additionally, on nearly five separate occasions,the software encountered error and shut down, causing loss of work. Potentiallythis was a consequence of hardware failure, not the software itself, but the authorswere not capable of determining the actual cause of these shutdowns. It is highlylikely that the lack of latest, high-end computer hardware with ample video-mem-ory invariably contributed to these occurrences. Another limitation comes withphotographs. It can be difficult to know ahead of time exactly what angles are need-ed and what, if any, specific detail photos are necessary. While this knowledge cancertainly come from experience, if photographs are taken in the field and returningto the site to get additional images is not possible, the lack of photographs couldsignificantly hamper a project. Another problem with photographs is the variationin lighting. This drastically affects overlaying quality textures on surfaces – creatingdistortions as can be seen in the Montana project (see Figure 46). In addition, reflec-tions are noticeable on some projected surfaces. We acknowledge that this might be
50

a reflection of our place in the learning curve, and that with some minor method-ological adjustment this problem may be easily fixed.
Figure 46. Texture distortions due to light surfaces on photographs (Sami Seeb, 2005).
Pixelation is another problem, which might be alleviated by using higherresolution photographs then those used in this project. A severe limitation in pointmarking is the inability for the program to recognize and reference a point on acommon corner in two photographs (see Figure 47).
Figure 47. Three points deemed bad references because of the point of view of thephotograph. The points mark the same corners, but the program, because of thephoto angle, is unable to recognize that they correspond (Sami Seeb, 2005).
51
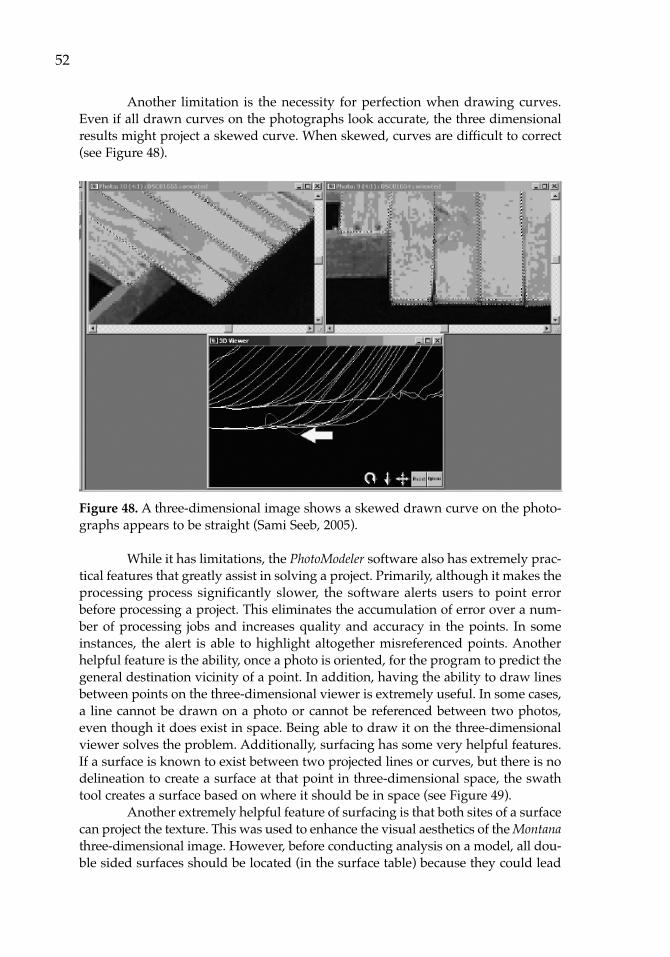
Another limitation is the necessity for perfection when drawing curves.Even if all drawn curves on the photographs look accurate, the three dimensionalresults might project a skewed curve. When skewed, curves are difficult to correct(see Figure 48).
Figure 48. A three-dimensional image shows a skewed drawn curve on the photo-graphs appears to be straight (Sami Seeb, 2005).
While it has limitations, the PhotoModeler software also has extremely prac-tical features that greatly assist in solving a project. Primarily, although it makes theprocessing process significantly slower, the software alerts users to point errorbefore processing a project. This eliminates the accumulation of error over a num-ber of processing jobs and increases quality and accuracy in the points. In someinstances, the alert is able to highlight altogether misreferenced points. Anotherhelpful feature is the ability, once a photo is oriented, for the program to predict thegeneral destination vicinity of a point. In addition, having the ability to draw linesbetween points on the three-dimensional viewer is extremely useful. In some cases,a line cannot be drawn on a photo or cannot be referenced between two photos,even though it does exist in space. Being able to draw it on the three-dimensionalviewer solves the problem. Additionally, surfacing has some very helpful features.If a surface is known to exist between two projected lines or curves, but there is nodelineation to create a surface at that point in three-dimensional space, the swathtool creates a surface based on where it should be in space (see Figure 49).
Another extremely helpful feature of surfacing is that both sites of a surfacecan project the texture. This was used to enhance the visual aesthetics of the Montanathree-dimensional image. However, before conducting analysis on a model, all dou-ble sided surfaces should be located (in the surface table) because they could lead
52
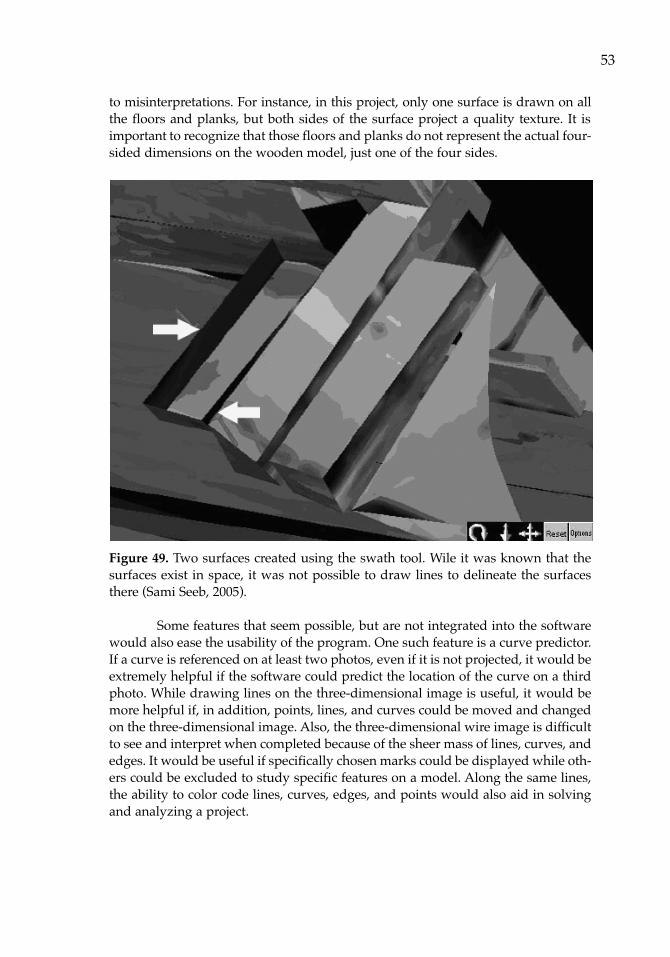
to misinterpretations. For instance, in this project, only one surface is drawn on allthe floors and planks, but both sides of the surface project a quality texture. It isimportant to recognize that those floors and planks do not represent the actual four-sided dimensions on the wooden model, just one of the four sides.
Figure 49. Two surfaces created using the swath tool. Wile it was known that thesurfaces exist in space, it was not possible to draw lines to delineate the surfacesthere (Sami Seeb, 2005).
Some features that seem possible, but are not integrated into the softwarewould also ease the usability of the program. One such feature is a curve predictor.If a curve is referenced on at least two photos, even if it is not projected, it would beextremely helpful if the software could predict the location of the curve on a thirdphoto. While drawing lines on the three-dimensional image is useful, it would bemore helpful if, in addition, points, lines, and curves could be moved and changedon the three-dimensional image. Also, the three-dimensional wire image is difficultto see and interpret when completed because of the sheer mass of lines, curves, andedges. It would be useful if specifically chosen marks could be displayed while oth-ers could be excluded to study specific features on a model. Along the same lines,the ability to color code lines, curves, edges, and points would also aid in solvingand analyzing a project.
53

ReferencesAttmore, William
References
Anichtenko, E., J. Betz, J. Boudoin, M. Brenkle, C. Ethridge, C. Mires, D. Nelson, J. Rogers, and T. Snyder
2005 HMS Alert Report, HIST 6810: Ship Construction, Program in MaritimeStudies, East Carolina University, Greenville, NC.
Corbin, A., B.A. Rodgers, B. Jaeschke, C.H. Mires, J.T. Snyder, C.F. Valvano,and A. Weir
2004 Leviathan of the Plains: History, Excavation, and Architecture of the Steamboat Montana. Report to Missouri Department of NaturalResources and SCI Engineering, from Program of Maritime Studies,East Carolina University, Greenville, NC.
Diveley, B.2005 Applying Photogrammetric Survey to Watercraft in Currituck County,
North Carolina, HIST 5005: Deep Water and Advanced Methodologyfor Maritime Archaeology Report, Program in Maritime Studies,East Carolina University, Greenville, NC.
EOS Systems Inc.2004 PhotoModeler Pro 5, EOS User Manual. 30th edition. Vancouver,
British Columbia. 2005 PhotoModeler, Vancouver, British Columbia, Canada.
(http://www.photomodeler.com/index.html).
Fontenoy, P.2005 Currituck Watercraft Survey Database. Beaufort Maritime Museum,
Microsoft Access; Beaufort, NC.
Franke, J.1999 Applying PhotoModeler in Maritime Archaeology:
A photogrammetric survey of the J3 Submarine Wreck. Report-Australian National Centre of Excellence for Maritime Archaeology,Western Australian Maritime Museum, No.6.
Fraser, C.S. 1998 Some Thoughts on the Emergence of Digital Close Range
Photogrammetry. Photogrammetric Record 16(91):37-50 (April 1998).
Green, J., S. Matthews, and T. Turanli2002 Underwater Archaeological Survey Using PhotoModeler,
VirtualMapper: different applications for different problems. The International Journal of Nautical Archaeology 31(2): 283-292.
55
Liss, M.2005 Applications of PhotoModeler in Maritime Archaeology, From Ship
Construction to Cyberspace, HIST 5005: Deep Water and Advanced Methodology for Maritime Archaeology Report, Program in Maritime Studies, East Carolina University, Greenville, NC.
McFadden, K., K. Koshgarian, and M. Liss2005 Montana. Report, HIST 6810: Ship Construction, Program in Maritime
Studies, East Carolina University, Greenville, NC.
North Carolina Department of Fish and Game (NCDFG)1964 North Carolina Vessel Registration Form 47274-500A, Currituck County,
North Carolina.1966 North Carolina Vessel Registration Form 50332-100A, Class B, Currituck
County, North Carolina. 1969 North Carolina Vessel Registration Form 73369-100A Class B, Currituck
County, North Carolina.1984 North Carolina Vessel Registration Form J-29347-100-02, Currituck County,
North Carolina.
Seeb, S.2005 Modeling Montana, HIST 5005: Deep Water and Advanced
Methodology for Maritime Archaeology Report, Program in Maritime Studies, East Carolina University, Greenville, NC.
Way, F., Jr.1983 Way's Packet Directory, 1848-1994: Passenger Steamboats of the Mississippi
River System Since the Advent of Photography in Mid-Continent America.Ohio University Press, Athens.
56