Embed Size (px)
Citation preview

Voltage Sag Diagnosis Using Big Data Analysis
Bingbing Zhao, Zhongda Yuan and Junwei Cao
Research Institute of Information Technology
Tsinghua University
Beijing 100084, P. R. China
Email: [email protected]
Huaying Zhang, Zhengguo Zhu, and Senjing Yao
Shenzhen Power Supply Co. Ltd.
China Southern Power Grid
Shenzhen 518020, P. R. China
Abstract—We proposes a data-driven approach for voltage
sag diagnosis in this paper. Rather than traditional features such
as frequency, amplitude and duration, we apply temporal
distribution as a new feature to distinguish whether the sag is
caused by power system faults or heavy load switching. Sags
caused by these two reasons have different distribution pattern,
and this work interprets it from a number of perspectives. We
also perform voltage sag source location by clustering. This
approach don’t use any physical level analysis and can find the
fault source faster as well as accurately.
Keywords—power quality; voltage sag; big data; fault location;
temporal distribution
I. INTRODUCTION
Ideal waveforms of power systems should be perfect sine waves with constant frequency. In three phases AC, the voltage and current of each phase are expected to have the same amplitude, symmetric phases. However, because the nonlinearity and asymmetry of generators, transformers and circuits, all the parameters in power systems may not meet with the design. Additionally, outside interference, wrong operation and load unbalance intensify the power grid to deviate from normal. In reality, power quality problems can make a threat to the safety and stability to the whole power grid, and result in financial loss.
Voltage sags have been present in power systems for many years, but only recently catch researchers' attention due to the inconvienience caused by them. Nowadays, many devices in a factory are using microcontrollers, which have high requirements for power quality. Possible consequences of poor power quality include unexpected power supply failures, equipment failures or malfunctioning, overheating, or damage to sensitive equipments such as PCs, workstations, and controllers.
Among power quality problems, voltage sags are the most common ones, which take about 60 percent. According to the IEEE definition, a voltage sag is a momentary reduction (i.e., 0.5-30 cycles) in the supply voltage between 10 and 90 percent of the nominal voltage[1][2]. There are 3 important indexes in evaluating voltage sags: amplitude, duration and frequency. Sag amplitude is the ratio of effective voltage value when sag occurs and nominal effective voltage value. Duration is the lasting time between sag starting and ending. Sag frequency is the number of times per unit the sag occurs.
Voltage sags are causing billions of financial loss in America every year. The main causes of voltage sags can be divided into two classes: system failures and non-system failures. System failures are short circuit and ground connection mostly caused by thunderstorm, strong wind, and other external forces. System failures also have two types: recoverable failures and permanent failures. Recoverable failures always last for a short time, and the voltage will come back to normal when interference factors disappear. In contrast, permanent failures make protective device work and then automatically reclose. If the reclose is successful, there will be only interruptions (or deep sags) for a short time. Non-system failures mostly refer to heavy load starting, especially large motors.
The purpose of voltage sag diagnosis can be mainly divided into two groups, to find the fault causes and to locate the sag source. Traditional methods to study voltage sags is by experiment and simulation. Researchers impose a failure into the simple system they build themselves, and then measure the wave forms and frequency to extract the characteristics. However, the actual system is much more complicated. The existing model can’t take all factors into consideration and is excessively simplified. The data-driven approach can be applied to solve this problem. This approach regards complicated systems as a black box to focus on inputs and outputs. Nowadays, with PMUs and all types of instruments are widely installed in smart grid, it is easy get status information. How to use data to enhance power quality and further improve security and stability is the key issue.
There have been some researchers that try to analyze power quality based on data analysis. A classification method is proposed in [3] to locate sag sources based only on the voltage magnitude and phase-angle jump. A new approach for power quality time series data mining is presented in [4] using S-transform based fuzzy expert systems (FES). Power quality events are classified in [5] using Wavelet Packet Transform (WPT) and Support Vector Machines (SVM). Features of disturbance signals are extracted using WPT and input to the SVM for effective classification. All these methods have two problems:
using too much circuit level analysis, which doesn’t take full advantage of machine learning algorithms;
features are too complicated, and further interpretion can’t be easily performed.
© 2015. The authors - Published by Atlantis Press 0113
International Conference on Information Technologies in Education and Learning (ICITEL 2015)
1
In this paper, comprehensive statistical analysis is performed based on voltage sag data from the Shenzhen city in China. Except common features such as sag magnitude, duration and frequency, we extract new features about how sags are distributed in time. Based on all these features, a decision tree is finally built to determine the cause of a new voltage sag. In section 3, we proposed a new method to locate voltage sag source totally based on data clustering.
II. DATA FEATURES
We get voltage sag data of Shenzhen from 2010 to 2012 for 3 years. Since many big companies have factories in Shenzhen, industrial power consumption takes 62.1% of total power consumption, which bring high requirements for power quality.
To improve power quality, Shenzhen has installed power quality monitors in all 110kV and 220kV substations. The data we get have 22000 records in all, and in each record, there are 7 dimensions, including substation, bus, phase, event type, start time, duration and amplitude.
A. Asymmetry in Three Phases
Voltage sags are always accompanied with asymmetry in three phases. Two main causes of voltage sag are transmission line fault and heavy load switching.
Transmission line faults can be divided to 1-phase earth, 2-phase earth, 3-phase earth, 2-phase short circuit and 3-phase short circut. Except for 3-phase earth faults, the others all lead to voltage sags with asymmetry in three phases. The work [6] discusses shares and features of different transmission fault types in transmission systems. In the work [7] why asymmetry exists from a physical perspective is discussed.
Shenzhen is located in a coastal region, which belongs to sub-tropical maritime climate. Such climate makes thunders frequent and great impact to transmission lines. Thunders lead to insulator arc-over and short circuits.
B. Amplitude and Duration
Different types of voltage sags are caused by different external reasons. And whether they can show different features in amplitude and duration will be discussed in this chapter.
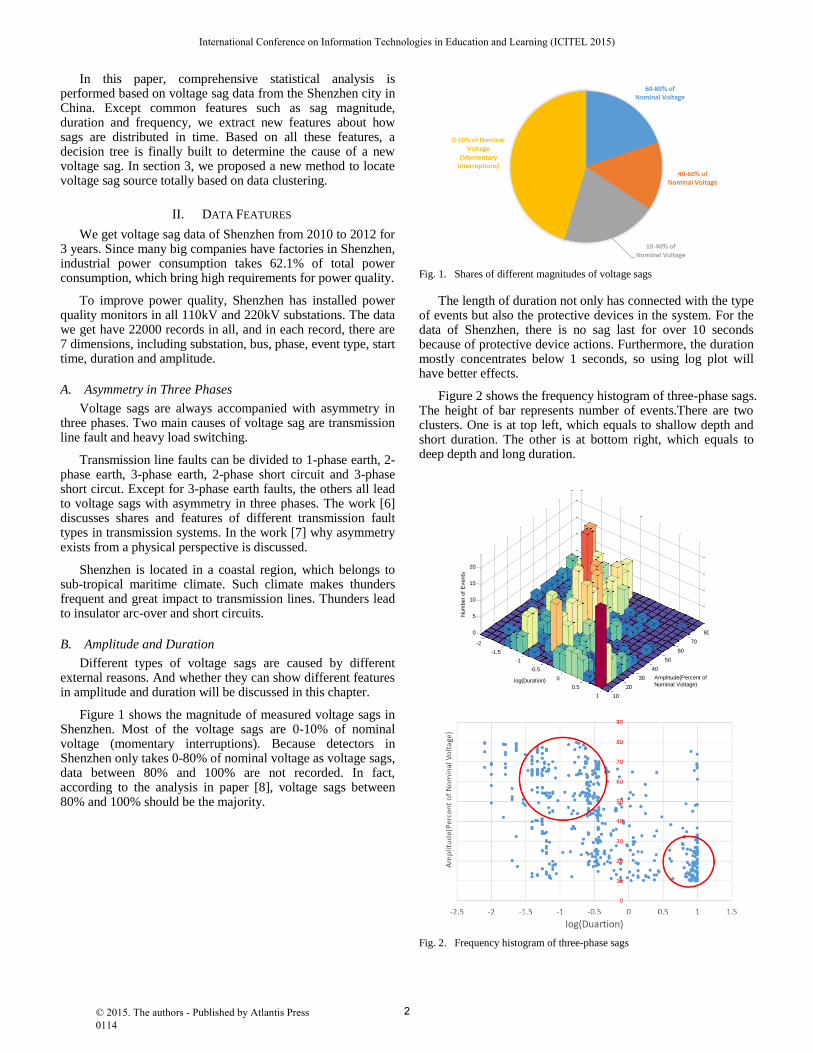
Figure 1 shows the magnitude of measured voltage sags in Shenzhen. Most of the voltage sags are 0-10% of nominal voltage (momentary interruptions). Because detectors in Shenzhen only takes 0-80% of nominal voltage as voltage sags, data between 80% and 100% are not recorded. In fact, according to the analysis in paper [8], voltage sags between 80% and 100% should be the majority.
Fig. 1. Shares of different magnitudes of voltage sags
The length of duration not only has connected with the type of events but also the protective devices in the system. For the data of Shenzhen, there is no sag last for over 10 seconds because of protective device actions. Furthermore, the duration mostly concentrates below 1 seconds, so using log plot will have better effects.
Figure 2 shows the frequency histogram of three-phase sags. The height of bar represents number of events.There are two clusters. One is at top left, which equals to shallow depth and short duration. The other is at bottom right, which equals to deep depth and long duration.
-2
-1.5
-1
-0.5
0
0.5
1 10
20
30
40
50
60
70
800
5
10
15
20
Amplitude(Percent of
Nominal Voltage)log(Duration)
Num
ber
of
Events
Fig. 2. Frequency histogram of three-phase sags
© 2015. The authors - Published by Atlantis Press 0114
International Conference on Information Technologies in Education and Learning (ICITEL 2015)
2

Figure 3 shows the frequency histogram of events in which one phase sags and two phases swell. It can be found that most events have deep depth (<40%). There is a line near at duration of 1 second, which may be caused be protective devices.
-2
-1.5
-1
-0.5
0
0.5
1 10
20
30
40
50
60
70
800
5
10
15
Amplitude(Percent of
Nominal Voltage)log(Duration)
Num
ber
of
Events
Fig. 3. Frequency histogram of one phase sags and two phases swell
Figure 4 shows the frequency histogram of events in which two phase sags and the other phase remains. There is just peak in area where amplitude is between 60-80% and duration is below 0.1 seconds. Because the kind of events is caused by interphase short circuit, it can be inferred that most interphase short circuit faults remain for a short time and don’t have severe impact in the whole system.
-2
-1
0
1 0
20
40
60
80
0
5
10
15
Amplitude(Percent of
Nominal Voltage)
log(Duration)
Num
ber
of
Events
Fig. 4. Frequency histogram of two phases sags and the other phase remains
Based on all the analysis in this chapter, Figure 5 is a summary of all the conclusions. Because sags caused by different reasons share different characteristic in amplitude and duration, we can make a simple judgement using amplitude and duration. In this plane, the whole plane is divided into four quadrants. Every quadrant has its most possible cause. Of course, all the boundary are absolute.
Fig. 5. Cause classification by amplitude and duration
C. Temporal Distribution
Voltage sags caused by different reasons also display different characteristics in happening time. Because the record of each sag is low, effective information is limited. If some features can be extracted from temporal distribution, classifications can be more accurate.
Figure 6 shows the temporal distribution in one day. Figure 6(a) is the analytical result of three phase sags. There are 2 peaks at 10 o’clock (10a.m.) in the morning and 15 o’clock (3p.m.) in the afternoon. Number of events gets bottom at night from 0 to 8 a.m. In comparison, Figure 6(b) is the analytical result of one phase sags. What is apparent is that it is equally distributed, and no obvious peaks and bottoms.
According to analysis in previous part, three phase sags are mostly caused by heavy load switching. The factories who owe big motors produce only in working hours, and there will two peaks in morning and afternoon separately. One-dimension sags are mostly caused by transmission line faults, which is due to external force, especially thunder. These factors don’t show characteristic in temporal distribution. For example, thunder and strong wind won’t happen at exact time in one day, and thus leads to a uniform distribution.
In Figure 6(b), there are still two less obvious peaks in 10 and 15. Because the three phase of big motors may be asymmetry, big motor starting also leads to one-dimension sags.
0 1 2 3 4 5 6 7 8 9 10 11 12 13 14 15 16 17 18 19 20 21 22 230
20
40
60
80
100
Hour
Num
ber
of
Events
(a) three-phase sags
© 2015. The authors - Published by Atlantis Press 0115
International Conference on Information Technologies in Education and Learning (ICITEL 2015)
3
0 1 2 3 4 5 6 7 8 9 10 11 12 13 14 15 16 17 18 19 20 21 22 230
10
20
30
40
50
60
70
80
Hour
Num
ber
of
Events
(b) one-phase sags
Fig. 6. Temporal distribution in one day
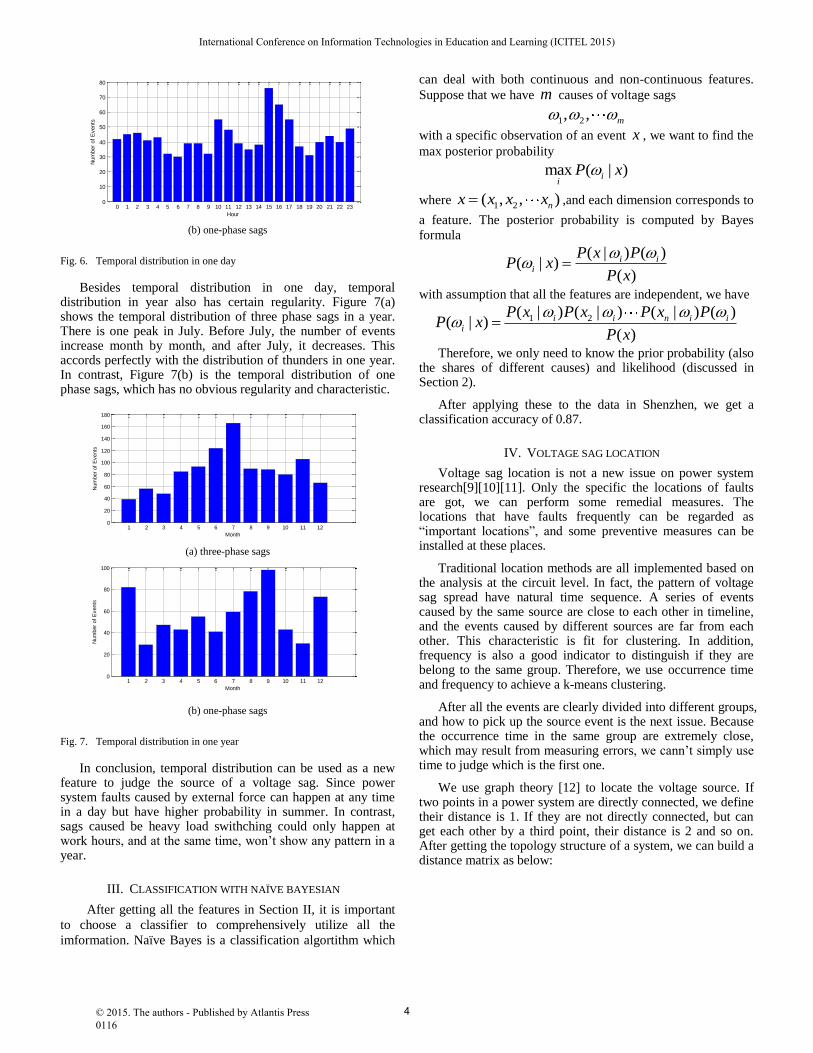
Besides temporal distribution in one day, temporal distribution in year also has certain regularity. Figure 7(a) shows the temporal distribution of three phase sags in a year. There is one peak in July. Before July, the number of events increase month by month, and after July, it decreases. This accords perfectly with the distribution of thunders in one year. In contrast, Figure 7(b) is the temporal distribution of one phase sags, which has no obvious regularity and characteristic.
1 2 3 4 5 6 7 8 9 10 11 120
20
40
60
80
100
120
140
160
180
Month
Num
ber
of
Events
(a) three-phase sags
1 2 3 4 5 6 7 8 9 10 11 120
20
40
60
80
100
Month
Num
ber
of
Events
(b) one-phase sags
Fig. 7. Temporal distribution in one year
In conclusion, temporal distribution can be used as a new feature to judge the source of a voltage sag. Since power system faults caused by external force can happen at any time in a day but have higher probability in summer. In contrast, sags caused be heavy load swithching could only happen at work hours, and at the same time, won’t show any pattern in a year.
III. CLASSIFICATION WITH NAÏVE BAYESIAN
After getting all the features in Section II, it is important
to choose a classifier to comprehensively utilize all the
imformation. Naïve Bayes is a classification algortithm which
can deal with both continuous and non-continuous features.
Suppose that we have m causes of voltage sags
1 2, , m
with a specific observation of an event x , we want to find the
max posterior probability
max ( | )i
iP x
where 1 2( , , )nx x x x ,and each dimension corresponds to
a feature. The posterior probability is computed by Bayes
formula
( | ) ( )( | )
( )
i ii
P x PP x
P x
with assumption that all the features are independent, we have
1 2( | ) ( | ) ( | ) ( )( | )
( )
i i n i ii
P x P x P x PP x
P x
Therefore, we only need to know the prior probability (also the shares of different causes) and likelihood (discussed in Section 2).
After applying these to the data in Shenzhen, we get a classification accuracy of 0.87.
IV. VOLTAGE SAG LOCATION
Voltage sag location is not a new issue on power system research[9][10][11]. Only the specific the locations of faults are got, we can perform some remedial measures. The locations that have faults frequently can be regarded as “important locations”, and some preventive measures can be installed at these places.
Traditional location methods are all implemented based on the analysis at the circuit level. In fact, the pattern of voltage sag spread have natural time sequence. A series of events caused by the same source are close to each other in timeline, and the events caused by different sources are far from each other. This characteristic is fit for clustering. In addition, frequency is also a good indicator to distinguish if they are belong to the same group. Therefore, we use occurrence time and frequency to achieve a k-means clustering.
After all the events are clearly divided into different groups, and how to pick up the source event is the next issue. Because the occurrence time in the same group are extremely close, which may result from measuring errors, we cann’t simply use time to judge which is the first one.
We use graph theory [12] to locate the voltage source. If two points in a power system are directly connected, we define their distance is 1. If they are not directly connected, but can get each other by a third point, their distance is 2 and so on. After getting the topology structure of a system, we can build a distance matrix as below:
© 2015. The authors - Published by Atlantis Press 0116
International Conference on Information Technologies in Education and Learning (ICITEL 2015)
4

12 13
21 23 2
31 32 3
1 2 3
10
0
0
0
n
n
n
n
n n
d d d
d d d
d d d
d d d
The center point can be determined be two criterions:
Sum of distance
1
max ij
n
ij
d
Variance of distance
2
1,
min ( )n
ij
ij
i
i
j
d d
These two criterions are also intuitive. Sum of distance can measure whether a point is at a central position. If a point is on the edge, a number of points will be far from it, and thus the sum will high. At the same time, due to the point that are close to it, the variance will be high.
In this section, we perform a clustering method to locate the sag source. Because of the natural sparsity of events in timeline, sags caused by the same source are close to each other. After dividing them into different groups, a distance matrix is constructed to find the central point, which is also the source location.
V. CONCLUSIONS
This paper presents a comprehensive data-driven voltage sag diagnosis. Except for traditional features such as asymmetry, amplitude and duration, we also discover the different pattern in temporal distribution caused by power system fault and heavy load switching. A Naïve Bayes classifier is trained using all the features, and achieve an accuraccy of 0.87. In Section 4, a new method on sag source location algorithm is propose. Due to the natural sparsity of events in timeline, we simply accomplish the clustering by occurance time. After the events are divided into groups, the distance matrix is used to find the central point, and also the source location.
Unlike the other data mining work, all the features and results are instuitive and accord with our common sense and experience. Since without labels of which points are the sources, we can’t test the effectiveness of our approach. In future work, we will generate data by power simulation software to test the effectiveness.
ACKNOWLEDGMENT
This work was supported in part by National Natural Science Foundation of China (grants No. 61472200 and No. 61233016), Ministry of Science and Technology of China under National 973 Basic Research Program (grant No. 2013CB228206), and China Southern Power Grid R&D project (K-SZ2012-026).
REFERENCES
[1] R. C. Dugan, M. McGranaghan, and H. W. Beaty, Electrical Power Systems Quality. New York: McGraw-Hill, 1996.
[2] IEEE Recommended Practise for Evaluating Electric Power System Compatibility With Electronic Process Equipment, IEEE Std. 1346-1998
[3] Leborgne, Roberto Chouhy, Daniel Karlsson, and Jaap Daalder. "Voltage sag source location methods performance under symmetrical and asymmetrical fault conditions." Transmission & Distribution Conference and Exposition: Latin America, 2006. TDC'06. IEEE/PES. IEEE, 2006.
[4] Behera, H. S., Pradipta K. Dash, and B. Biswal. "Power quality time series data mining using S-transform and fuzzy expert system." Applied Soft Computing 10.3 (2010): 945-955.
[5] Behera, H. S., Pradipta K. Dash, and B. Biswal. "Power quality time series data mining using S-transform and fuzzy expert system." Applied Soft Computing 10.3 (2010): 945-955.
[6] Heine, Pirjo, and Matti Lehtonen. "Voltage sag distributions caused by power system faults." Power Systems, IEEE Transactions on 18.4 (2003): 1367-1373.
[7] Bollen, Math HJ. Understanding power quality problems. Vol. 3. New York: IEEE press, 2000.
[8] Lamoree, Jeff, et al. "Voltage sag analysis case studies." IEEE Transactions on Industry Applications 30.4 (1994): 1083-1089.
[9] Hamzah, Noraliza, Azah Mohamed, and Aini Hussain. "A new approach to locate the voltage sag source using real current component." Electric Power Systems Research 72.2 (2004): 113-123.
[10] Lotfifard, Saeed, Mladen Kezunovic, and Mirrasoul J. Mousavi. "Voltage sag data utilization for distribution fault location." Power Delivery, IEEE Transactions on 26.2 (2011): 1239-1246.
[11] Pradhan, Ashok Kumar, and Aurobinda Routray. "Applying distance relay for voltage sag source detection." Power Delivery, IEEE Transactions on 20.1 (2005): 529-531.
[12] Bondy, John Adrian, and Uppaluri Siva Ramachandra Murty. Graph theory with applications. Vol. 290. London: Macmillan, 1976.
© 2015. The authors - Published by Atlantis Press 0117
International Conference on Information Technologies in Education and Learning (ICITEL 2015)
5